oxygen, nitrogen and air broadening of hcn spectral lines ... · oxygen, nitrogen and air...
TRANSCRIPT

ARTICLE IN PRESS
Contents lists available at ScienceDirect
Journal of Quantitative Spectroscopy &Radiative Transfer
Journal of Quantitative Spectroscopy & Radiative Transfer 109 (2008) 2857–2868
0022-40
doi:10.1
� Cor
E-m
journal homepage: www.elsevier.com/locate/jqsrt
Oxygen, nitrogen and air broadening of HCN spectral lines atterahertz frequencies
Chun Yang a, Jeanna Buldyreva b, Iouli E. Gordon c, Franc-ois Rohart d, Arnaud Cuisset a,Gael Mouret a, Robin Bocquet a, Francis Hindle a,�
a Laboratoire de Physico-Chimie de l’Atmosphere, UMR CNRS 8101, Universite du Littoral Cote d’Opale, 189A Av. Maurice Schumann, 59140 Dunkerque, Franceb Institut UTINAM, UMR CNRS 6213, Universite de Franche-Comte, 16, Route de Gray, 25030 Besanc-on Cedex, Francec Harvard-Smithsonian Center for Astrophysics, Atomic and Molecular Physics Division, 60 Garden Street, Cambridge, MA 02138-1516, USAd Laboratoire de Physique des Lasers, Atomes et Molecules, UMR CNRS 8523, Batiment P5-135, Universite de Lille 1, 59655 Villeneuve d’Ascq Cedex, France
a r t i c l e i n f o
Article history:
Received 25 July 2008
Received in revised form
25 August 2008
Accepted 26 August 2008
Keywords:
HCN
Oxygen
Nitrogen
Broadening
Terahertz
Photomixing
73/$ - see front matter & 2008 Elsevier Ltd. A
016/j.jqsrt.2008.08.005
responding author.
ail address: [email protected] (F.
a b s t r a c t
The room-temperature nitrogen- and oxygen-broadening coefficients of hydrogen
cyanide spectral lines have been measured in the 0.5–3 THz (17–100 cm�1) frequency
range (purely rotational transitions with 5pJp36) by a continuous-wave terahertz
spectrometer based on a photomixing source. An improved version of the Robert and
Bonamy semiclassical formalism has been used to calculate the oxygen-broadening
coefficients and resulted in a good agreement with these measurements. The nitrogen
and oxygen data are combined to provide the air-broadening coefficients as used by the
HITRAN database. A significant difference is observed between the measured and
tabulated values for transitions with high values of the rotational quantum number.
A new polynomial representation is suggested for inclusion in HITRAN. A similar
polynomial expression has been derived for the nitrogen broadening to aid the studies
of Titan’s atmosphere.
& 2008 Elsevier Ltd. All rights reserved.
1. Introduction
Hydrogen cyanide (HCN) is an important gas in astrophysical and atmospheric research. It is present in comets,interstellar clouds and the atmospheres of some planets and moons such as Titan for example [1,2]. Therefore, an extensiveknowledge of its spectroscopic parameters is very important and they are tabulated in the major spectroscopic databasessuch as HITRAN [3]. The knowledge of HCN spectral parameters is also important for the star formation models as well asfor industrial pollution monitoring and burning of bio-mass. The HCN line broadening by various foreign gases is ofparticular interest. For example, the values of the foreign gas broadening parameters can be used to estimate temperaturesand concentrations of the gas in different astrophysical objects [4]. There have been extensive experimental studies of thesebroadening parameters in the infrared region for air and N2 perturbation [5–8] and references therein. The terahertz (THz)region has been studied far less extensively and only the N2-broadening parameters have been measured using a far-infrared Fourier spectrometer [9]. The O2-broadening data in any spectral region are very limited. The purpose of theexperiments described in this paper is to extend the available oxygen-broadening information. The N2-broadenedcoefficients have also been measured allowing the air-broadening coefficients to be determined.
ll rights reserved.
Hindle).

ARTICLE IN PRESS
C. Yang et al. / Journal of Quantitative Spectroscopy & Radiative Transfer 109 (2008) 2857–28682858
Computations of collisional broadening coefficients for HCN–N2 system are currently available for (0,1, 0) band at room[10] and low [11] temperatures in the framework of the traditional Robert and Bonamy (RB) semiclassical approach withparabolic trajectories for the relative molecular motion [12]. Recently, the room-temperature coefficients had been alsoevaluated [13] by the improved version of the RB formalism [14] involving the exact solutions of the classical equations ofmotion [15] (RBE). In contrast, the oxygen-broadening coefficients for HCN (vib)rotational lines to our knowledge havenever been computed. We present therefore their theoretical values by the semiclassical RBE approach. Since for the case oftwo linear molecules this approach had been already discussed in detail elsewhere [14], in Section 4 we briefly present itskey features and main formulae relative to the linewidth calculation. The numerical results are given and compared withthe experimental data in Section 5. In Section 6, the air-broadening coefficients deduced from the measured data arecompared to existing infrared data and are used to determine a new polynomial function which is suggested for inclusionin HITRAN as it extends to higher rotational levels.
2. Experimental procedure
The use of ultra-fast electronic components and optical heterodyning or ‘‘photomixing’’ can provide access tofrequencies from 0.1 to 3 THz (3.3–100 cm�1). Photomixing [16] is a frequency down-conversion technique where twolasers close in frequency are used to create a beatnote at the target frequency. A semiconductor material with a suitablyshort carrier lifetime is employed to convert the beatnote into an electrical current which is subsequently radiated by anantenna. Photomixing sources have already demonstrated their utility for the spectroscopy of gases [17–20] along with thequantitative analysis of complex samples such as cigarette smoke containing many chemical species and a high degree ofaerosols [21].
A continuous-wave terahertz (CW-THz) spectrometer was constructed using a photomixing radiation source, Fig. 1. Theinstrument can be divided into the following functional units: a dual-frequency optical source, the photomixer element, aTHz beam propagation path including the sample cell and a detector (bolometer). The optical source contains two (TopticaDL-100) extended cavity diode lasers (ECDL) operating at 780 nm. The lasers are spatially mixed using a beam splitter tocreate a beatnote in the THz frequency range. In order to optimize the spectral resolution of the source, a frequencystabilization scheme was applied to each laser. The first laser was frequency locked to a saturated absorption feature of therubidium D2-line, using commercially available apparatus (TEM Messtechnik, CoSy). The second laser was stabilized usinga low-contrast Fabry–Perot interferometer system (TEM Messtechnik, iScan). Unlike many Fabry–Perot systems that canonly provide information at the resonant frequency, the advantage of this low-contrast interferometer is that it is capable ofproviding a stabilization signal at any frequency. An error signal generated by the difference between an arbitrary set-pointand the Fabry–Perot is applied to the peizoelectic element of the laser. Hence the laser can be frequency scanned across itsgain profile with an active frequency correction being provided by the interferometer. In the particular case of an ECDL, thefine adjustment of the grating alignment using the piezoelectric allows a continuous tuning range of around 10 GHz to beroutinely obtained. Larger frequency steps are realized by manual adjustments of the grating alignment along with currentand temperature of the laser diode. A tapered semiconductor optical amplifier (Toptica, BoosTA) was used to increaseavailable power of the dual-frequency source up to 1.5 W. To verify the correct operation and stabilization of the lasers and
Fig. 1. CW-THz spectrometer composed an optical source, the photomixer element, THz beam propagation path and bolometer. Optical isolators are
placed at the entry and exit of the amplifier.

ARTICLE IN PRESS
Fig. 2. Beatnote between two ECDL, measured at the exit of the tapered amplifier with a sweep time of 5 ms.
C. Yang et al. / Journal of Quantitative Spectroscopy & Radiative Transfer 109 (2008) 2857–2868 2859
the amplifier, a microwave beatnote was measured using a fast photodiode and a spectrum analyzer, Fig. 2. The spectralpurity of the beatnote was determined to be 0.5 MHz at �3 dB.
The photomixing elements were fabricated by the Institut d’Electronique de Microelectronique et de Nanotechnologie(IEMN, Lille, France). They consist of a GaAs substrate with a 1mm layer of low-temperature grown GaAs (LTG-GaAs)deposited by molecular beam epitaxy at a temperature of 300 1C. An electrode array and the radiating antenna arepatterned on the device surface using electron beam lithography. The electrode array has a dimension of 8mm�8mm andconsists of 5 interdigitated electrodes each of 0.2mm width. The electrode array is located at the center of a pair of log spiralantenna. The dual-frequency laser beam is focused onto the center of the electrode array to which a voltage VBIAS is applied.The LTG-GaAs has a sufficiently short carrier lifetime in order to conserve the difference frequency of the THz beatnote;hence, a corresponding current iTHz is created. The current is coupled to the broadband spiral antenna radiating a THzelectromagnetic wave. This device is capable of producing up to 100 nW of THz radiation and operating at frequenciesbetween 0.1 and 3 THz. The highly divergent THz beam produced by the photomixer is collimated by a combination of ahemispherical silicon lens placed on the device substrate and a metal off-axis parabolic mirror. The collimated beam passesthrough a sample chamber of length 104 mm by means of two Teflon windows before being focused onto the detector by asecond parabolic mirror. The detector used is a silicon bolometer operating at 4.2 K and having a noise equivalent power of2.0�10�12 W/Hz1/2.
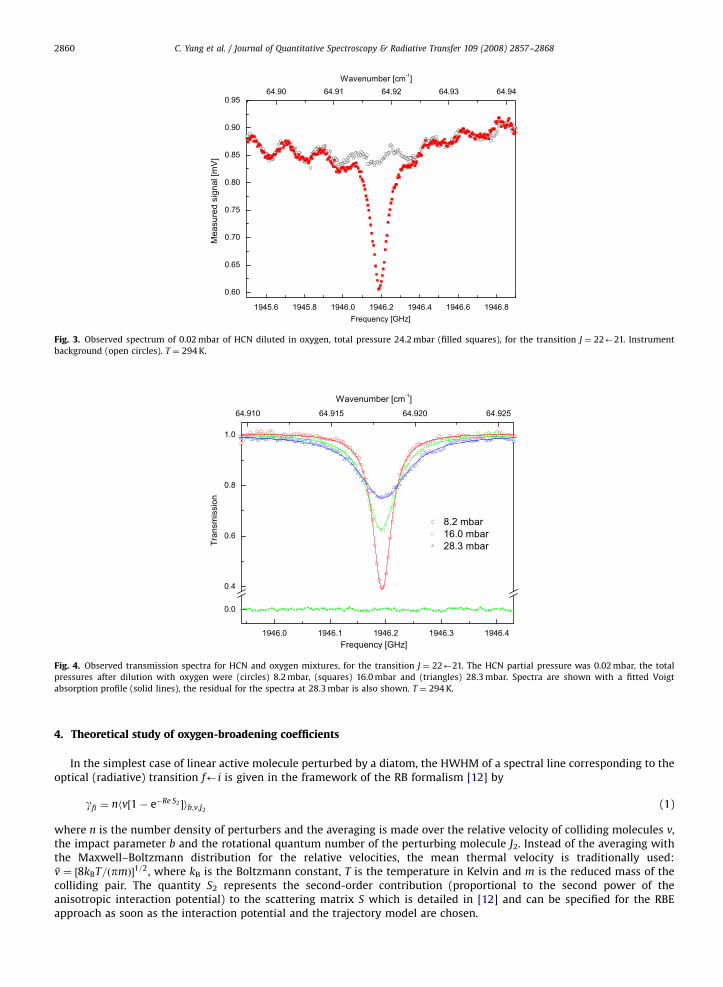
Gaseous HCN was produced by reacting potassium cyanide with phosphoric acid. Due to the strong permanent dipolemoment of HCN which results in particularly intense rotational transitions, a small quantity, typically 0.02 mbar, of HCNwas introduced into the sample chamber and subsequently diluted with either nitrogen or oxygen. Resulting maximumobserved absorptions remained smaller than 90%. Spectra were recorded for the ground-state (0, 0, 0) and upperdegenerated-state (0,12
1, 0) HCN transitions in the frequency range of 0.53–3.26 THz (J ¼ 5 to 36). An instrumentbackground recorded under identical conditions accompanies each measured spectra, as illustrated in Fig. 3. Theoscillations present in the data are caused by a Fabry–Perot effect established between the photomixer and the bolometer.The periodicity corresponds to the total length of the THz propagation path of 81 cm. For each transition examined, aminimum of 15 independent spectra were recorded covering pressures up to 40 mbar.
3. Results and data analysis
The measured spectra were normalized by an instrument background and fitted, taking account of the Beer–Lambertlaw, to a Voigt profile based on the complex probability function [22] by a non-linear minimization routine. Typicalnormalized data are presented in Fig. 4 showing the broadening of HCN by oxygen. The Doppler contribution wascalculated for each transition, while the collisional broadening DuHWHM, integrated line intensity area and center frequencywere minimized for each recorded spectrum. The collisional broadening was determined for both oxygen and nitrogen as afunction of pressure up to total pressures of 40 mbar.
The broadening coefficients gHCN�O2and gHCN�N2
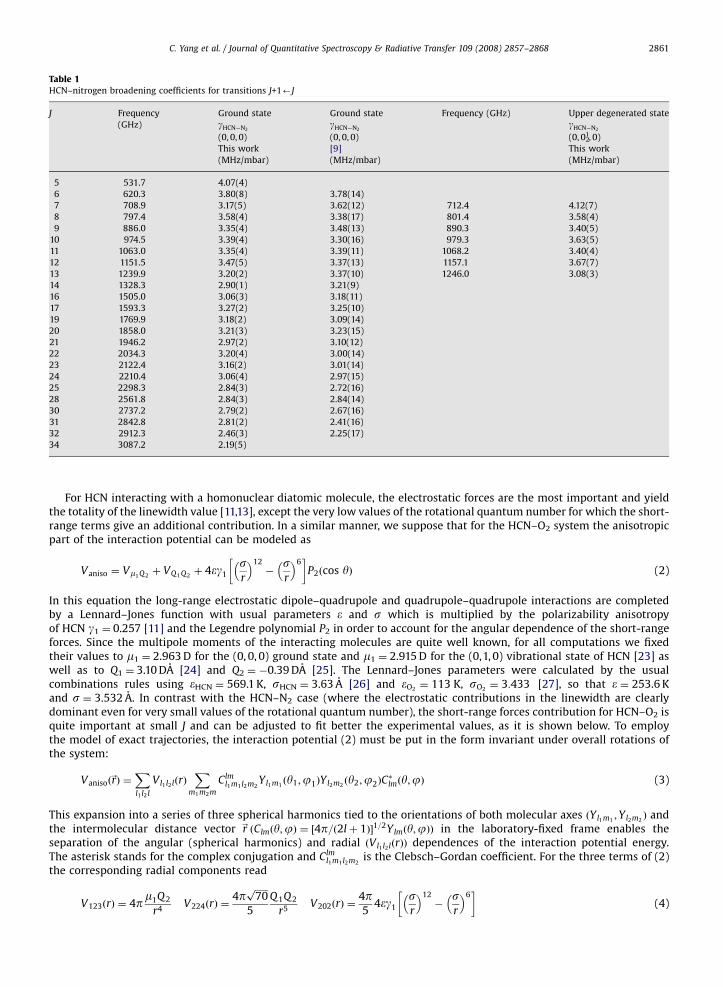
were determined by the linear regression of these data for eachtransition and are presented in Tables 1 and 2. An example is presented in Fig. 5 for the oxygen broadening of the linecorresponding to the transition J ¼ 22’21 at 1946.2 GHz where the calculated Doppler broadening HWHM is 2.3 MHz. Asexpected, the oxygen- and nitrogen-broadening coefficients decrease with increasing J, Fig. 6, and the interaction withnitrogen is approximately 1.7 times stronger than for oxygen. The correct operation of the spectrometer was confirmed bycomparison of the nitrogen-broadening results with those previously published by Sergent-Rozey et al. [9], Table 1. For themajority of the lines, the difference between these data sets is commensurate with the measurement uncertainties.
ARTICLE IN PRESS
Fig. 3. Observed spectrum of 0.02 mbar of HCN diluted in oxygen, total pressure 24.2 mbar (filled squares), for the transition J ¼ 22’21. Instrument
background (open circles). T ¼ 294 K.
Fig. 4. Observed transmission spectra for HCN and oxygen mixtures, for the transition J ¼ 22’21. The HCN partial pressure was 0.02 mbar, the total
pressures after dilution with oxygen were (circles) 8.2 mbar, (squares) 16.0 mbar and (triangles) 28.3 mbar. Spectra are shown with a fitted Voigt
absorption profile (solid lines), the residual for the spectra at 28.3 mbar is also shown. T ¼ 294 K.
C. Yang et al. / Journal of Quantitative Spectroscopy & Radiative Transfer 109 (2008) 2857–28682860
4. Theoretical study of oxygen-broadening coefficients
In the simplest case of linear active molecule perturbed by a diatom, the HWHM of a spectral line corresponding to theoptical (radiative) transition f’i is given in the framework of the RB formalism [12] by
gfi ¼ nhv½1� e�Re S2 �ib;v;J2(1)
where n is the number density of perturbers and the averaging is made over the relative velocity of colliding molecules v,the impact parameter b and the rotational quantum number of the perturbing molecule J2. Instead of the averaging withthe Maxwell–Boltzmann distribution for the relative velocities, the mean thermal velocity is traditionally used:v ¼ ½8kBT=ðpmÞ�1=2, where kB is the Boltzmann constant, T is the temperature in Kelvin and m is the reduced mass of thecolliding pair. The quantity S2 represents the second-order contribution (proportional to the second power of theanisotropic interaction potential) to the scattering matrix S which is detailed in [12] and can be specified for the RBEapproach as soon as the interaction potential and the trajectory model are chosen.
ARTICLE IN PRESS
Table 1HCN–nitrogen broadening coefficients for transitions J+1’J
J Frequency Ground state Ground state Frequency (GHz) Upper degenerated state
(GHz) gHCN�N2gHCN�N2
gHCN�N2
(0, 0, 0) (0, 0, 0) (0, 021, 0)
This work [9] This work
(MHz/mbar) (MHz/mbar) (MHz/mbar)
5 531.7 4.07(4)
6 620.3 3.80(8) 3.78(14)
7 708.9 3.17(5) 3.62(12) 712.4 4.12(7)
8 797.4 3.58(4) 3.38(17) 801.4 3.58(4)
9 886.0 3.35(4) 3.48(13) 890.3 3.40(5)
10 974.5 3.39(4) 3.30(16) 979.3 3.63(5)
11 1063.0 3.35(4) 3.39(11) 1068.2 3.40(4)
12 1151.5 3.47(5) 3.37(13) 1157.1 3.67(7)
13 1239.9 3.20(2) 3.37(10) 1246.0 3.08(3)
14 1328.3 2.90(1) 3.21(9)
16 1505.0 3.06(3) 3.18(11)
17 1593.3 3.27(2) 3.25(10)
19 1769.9 3.18(2) 3.09(14)
20 1858.0 3.21(3) 3.23(15)
21 1946.2 2.97(2) 3.10(12)
22 2034.3 3.20(4) 3.00(14)
23 2122.4 3.16(2) 3.01(14)
24 2210.4 3.06(4) 2.97(15)
25 2298.3 2.84(3) 2.72(16)
28 2561.8 2.84(3) 2.84(14)
30 2737.2 2.79(2) 2.67(16)
31 2842.8 2.81(2) 2.41(16)
32 2912.3 2.46(3) 2.25(17)
34 3087.2 2.19(5)
C. Yang et al. / Journal of Quantitative Spectroscopy & Radiative Transfer 109 (2008) 2857–2868 2861
For HCN interacting with a homonuclear diatomic molecule, the electrostatic forces are the most important and yieldthe totality of the linewidth value [11,13], except the very low values of the rotational quantum number for which the short-range terms give an additional contribution. In a similar manner, we suppose that for the HCN–O2 system the anisotropicpart of the interaction potential can be modeled as
Vaniso ¼ Vm1Q2þ VQ1Q2
þ 4�g1
sr
� �12�
sr
� �6� �
P2ðcos yÞ (2)
In this equation the long-range electrostatic dipole–quadrupole and quadrupole–quadrupole interactions are completedby a Lennard–Jones function with usual parameters e and s which is multiplied by the polarizability anisotropyof HCN g1 ¼ 0.257 [11] and the Legendre polynomial P2 in order to account for the angular dependence of the short-rangeforces. Since the multipole moments of the interacting molecules are quite well known, for all computations we fixedtheir values to m1 ¼ 2.963 D for the (0, 0, 0) ground state and m1 ¼ 2.915 D for the (0,1, 0) vibrational state of HCN [23] aswell as to Q1 ¼ 3.10 DA [24] and Q2 ¼ �0.39 DA [25]. The Lennard–Jones parameters were calculated by the usualcombinations rules using eHCN ¼ 569.1 K, sHCN ¼ 3.63 A [26] and �O2
¼ 113 K, sO2¼ 3:433 [27], so that e ¼ 253.6 K
and s ¼ 3.532 A. In contrast with the HCN–N2 case (where the electrostatic contributions in the linewidth are clearlydominant even for very small values of the rotational quantum number), the short-range forces contribution for HCN–O2 isquite important at small J and can be adjusted to fit better the experimental values, as it is shown below. To employthe model of exact trajectories, the interaction potential (2) must be put in the form invariant under overall rotations ofthe system:
Vanisoð~rÞ ¼Xl1 l2 l
Vl1 l2 lðrÞX
m1m2m
Clml1m1 l2m2
Yl1m1ðy1;j1ÞYl2m2
ðy2;j2ÞC�lmðy;jÞ (3)
This expansion into a series of three spherical harmonics tied to the orientations of both molecular axes ðYl1m1;Yl2m2
Þ andthe intermolecular distance vector ~r ðClmðy;jÞ ¼ ½4p=ð2lþ 1Þ�1=2Ylmðy;jÞÞ in the laboratory-fixed frame enables theseparation of the angular (spherical harmonics) and radial ðVl1 l2 lðrÞÞ dependences of the interaction potential energy.The asterisk stands for the complex conjugation and Clm
l1m1 l2m2is the Clebsch–Gordan coefficient. For the three terms of (2)
the corresponding radial components read
V123ðrÞ ¼ 4pm1Q2
r4V224ðrÞ ¼
4pffiffiffiffiffiffi70p
5
Q1Q2
r5V202ðrÞ ¼
4p5
4�g1
sr
� �12�
sr
� �6� �
(4)

ARTICLE IN PRESS
Table 2HCN–oxygen broadening coefficients for transitions J+1’J
J Frequency Ground state Theory Frequency Upper degenerated state Theory
(GHz) gHCN�O2Viso1 (GHz) gHCN�O2
Viso1
(0, 0, 0) (MHz/mbar) (0, 021, 0) (MHz/mbar)
This work This work
(MHz/mbar) (MHz/mbar)
0 2.54 2.52
1 2.53 2.50
2 2.51 2.49
3 2.49 2.46
4 2.43 2.41
5 531.7 2.11(2) 2.36 2.33
6 620.3 2.29(1) 2.27 2.25
7 708.9 2.10(5) 2.20 2.17
8 797.4 2.05(2) 2.13 801.4 2.38(3) 2.11
9 886.0 2.18(2) 2.09 890.3 2.12(3) 2.06
10 974.5 2.22(3) 2.05 979.3 2.05(3) 2.02
11 1063.0 2.17(1) 2.02 1068.2 2.02(2) 1.99
12 1151.5 2.13(2) 2.00 1157.1 2.08(5) 1.97
13 1239.9 1.90(1) 1.98 1246.0 1.94(2) 1.96
14 1328.3 1.92(2) 1.97 1.94
16 1505.0 1.85(1) 1.96 1.93
17 1593.3 2.02(2) 1.95 1.92
19 1769.9 1.91(1) 1.93 1.91
20 1858.0 2.03(1) 1.91 1.89
21 1946.2 1.67(2) 1.89 1.86
22 2034.3 1.81(2) 1.86 1.83
23 2122.4 1.81(1) 1.83 1.80
24 2210.4 1.68(1) 1.79 1.76
25 2298.3 1.62(1) 1.75 1.72
28 2561.8 1.54(1) 1.70 1.67
30 2737.2 1.52(2) 1.65 1.61
31 2842.8 1.65(1) 1.59 1.56
32 2912.3 1.62(2) 1.53 1.50
34 3087.2 1.43(2) 1.47 1.44
36 3261.7 1.23(4) 1.41 1.38
37 1.34 1.31
38 1.28 1.25
39 1.21 1.18
40 1.15 1.12
41 1.08 1.05
42 1.02 0.99
Fig. 5. Collisional linewidths as a function of pressure for the transition J ¼ 22’21. A weighted least-squares fit provides a broadening coefficient of
1.6570.01 MHz/mbar. T ¼ 294 K.
C. Yang et al. / Journal of Quantitative Spectroscopy & Radiative Transfer 109 (2008) 2857–28682862

ARTICLE IN PRESS
Fig. 6. Oxygen- (filled symbols) and nitrogen- (open symbols) broadening coefficients for the J+1’J ground-state transitions (squares) and upper
degenerated-state transitions (triangles) at T ¼ 294 K. The error bars of the broadening coefficients are smaller or equal to the size of the symbols used.
C. Yang et al. / Journal of Quantitative Spectroscopy & Radiative Transfer 109 (2008) 2857–2868 2863
These radial components are computed numerically for r varying from the minimal distance of the closest approach rc min
(defined by the relative velocity v and the isotropic potential parameters) to 13 A (where the contributions to the linewidthbecome negligible).
The second-order contribution S2 is then given by
S2 ¼ 2_�2 rc
v
� �2Xl1 l2 l
Xj0
i j02
Cj0i0ji0l10
� �2C
j020j20l20
� �2f l1 l2 l þ
Xj0
f j0
2
Cj0f 0
jf 0l10
� �2
Cj020j20l20
� �2f l1 l2 l �
Xj0
2
ð�1Þj2þj02 Cj020j20l20
� �2Dðl1Þji jf
f l1 l2 l
264
375 (5)
where the primed rotational numbers stand for the states induced by collision Dðl1Þji jf¼ 2ð�1Þjiþjf ½ð2ji þ 1Þð2jf þ 1Þ�1=2
Cji
ji0l10Cjf
jf 0l10Wðjijf jijf ;1l1Þ with Wðjijf jijf ;1 l1Þ denoting the Racah coefficient, and f l1 l2 lðrc; kcÞ is the so-called resonancefunction defined by the distance of the closest approach rc (for a given value of the impact parameter b) and the resonanceparameter kc ¼ orc/v (the frequency o ¼ oii0 þo220 characterizes how close are the pairs of states ii0 and 220 to the exactresonance):
f l1 l2 lðrc; kcÞ ¼X
m
ðl�mÞ!ðlþmÞ!
22lððl�mÞ=2Þ!2ððlþmÞ=2Þ!2
Z ymax
1
dyVl1 l2 lðrcyÞy cos kcA0ðyÞ þmffiffiffiffiffiffiffiffiffiffiffiffiffiffiffiffiffiffiffiffiffiffiffiffi1� V�isoðrcÞ
pA2ðyÞ
� �ffiffiffiffiffiffiffiffiffiffiffiffiffiffiffiffiffiffiffiffiffiffiffiffiffiffiffiffiffiffiffiffiffiffiffiffiffiffiffiffiffiffiffiffiffiffiffiffiffiffiffiffiffiffiffiffiffiffiffiffiffiffiffiy2 � 1þ V�isoðrcÞ � y2V�isoðrcyÞ
p( )2
,
AnðyÞ ¼
Z y
1
dz
zn�1ffiffiffiffiffiffiffiffiffiffiffiffiffiffiffiffiffiffiffiffiffiffiffiffiffiffiffiffiffiffiffiffiffiffiffiffiffiffiffiffiffiffiffiffiffiffiffiffiffiffiffiffiffiffiffiffiffiffiffiffiffiffiz2 � 1þ V�isoðrcÞ � z2V�isoðrczÞ
p (6)
In contrast with the resonance functions of the Anderson–Tsao–Curnutte theory [28] (which are tabulated for the long-range interactions) or those of the RB formalism with parabolic trajectories [12] (which are expressed analytically throughthe Bessel functions), the exact-trajectory resonance functions, (6), are computed by a numerical integration over thereduced trajectory parameter y�r/rc and depend on the reduced isotropic potential V�iso ¼ 2V iso=ðmv2Þ which governs therelative molecular motion.
The parameters of Viso approximated as usual by a Lennard–Jones function V iso ¼ 4� ðs=rÞ12� ðs=rÞ6
j kinfluence greatly
the resonance functions and, consequently, the linewidth computation. We analyze below various Viso parameterizationsavailable for HCN–O2.
The calculation of the resonance parameter kc corresponding to the simultaneous collisional transitions in the activeand perturbing molecules needs the rotational constant values for the active molecule in the ground state or degeneratedvibrational state (only pure rotational radiative transitions are considered here) as well as for the perturbing molecule inthe ground state (collisions are supposed to induce only rotational transitions). For HCN we took B0 ¼ 44.315909 GHz forthe ground and B1 ¼ 44.534538 GHz for the degenerated vibrational states [29]. For O2 B0 ¼ 43.103110 GHz calculated withBe and ae of Herzberg [30] was used.
5. Analysis of isotropic potential parameterization and comparison with experimental data
The oxygen-broadening coefficients were computed for the ground state (0, 0, 0) using the isotropic potentialLennard–Jones parameters e ¼ 95.854 K, s ¼ 3.676 A (obtained by the combination rules with eHCN ¼ 81.31 K, sHCN ¼
3.918 A, as recommended in [11], and �O2¼ 113 K, sO2
¼ 3:433 [27], as for the anisotropic potential component V202).

ARTICLE IN PRESS
Fig. 7. Comparison of theoretical and experimental dependences of HCN–O2 broadening coefficients on the rotational quantum number at 294 K.
Experimental data for (1, 0, 0) R(J) lines are calculated from the nitrogen- and air-broadening data [1]; for (0,1, 0) R(J) lines they are obtained from the
measurements of [2] (air-broadening) and [3] (nitrogen-broadening).
C. Yang et al. / Journal of Quantitative Spectroscopy & Radiative Transfer 109 (2008) 2857–28682864
The results are plotted on Fig. 7 (theoretical curves ‘‘Viso1’’) together with the experimental data of the present work andthe measurements of Colmont [31] and Kaghat [32] for the rotational transition J ¼ 1’0. Since, at present, no apparentvibrational dependence has been observed for the HCN-broadening coefficients [3], in order to extend the comparison tosmall values of the rotational quantum number we plotted on the same figure the broadening coefficients estimated fromthe measurements of Rinsland et al. [7] for the (1, 0, 0) R(J) lines of air- and N2-perturbed HCN at 296 K as well as from themeasurements of Devi et al. [5] (air-perturbed) and those of Smith et al. [8] (nitrogen-broadened) (0,1, 0) R(J) lines at 296 K.The oxygen broadening was estimated using the common equation
gair ¼ 0:79gN2þ 0:21gO2
(7)
As can be seen from this figure, the chosen Viso parameterization leads to a very good agreement with the measurements.The dominant character of the electrostatic interactions (curve ‘‘elec Viso1’’) for middle and high values of J is alsodemonstrated. The agreement with (1, 0, 0) experimental data for very low J can be further improved by changing theLennard–Jones parameters in the V202 term of the anisotropic potential. Indeed, taking e ¼ 95.854 K and s ¼ 3.676 A(the same parameter values as for Viso) reduces the contribution of the component V202 in the linewidth (thick solid line‘‘V202�Viso1’’ in Fig. 7).
It is also noted that the slight overestimation of the broadening coefficient for small J values ( J ¼ 1–6) can be attributedto the use of the mean thermal velocity in our computations. Indeed, it has been shown for HCN–N2 [13] that the Maxwellaveraging even with three values of n (0:5v, v and 1:5v) enables a more realistic decreasing of the theoretical RBE linewidthsfor the small values of the rotational quantum number. The analogous computation for HCN–O2 (‘‘MB’’ curve in Fig. 7)confirms this explication. The somewhat low values of the theoretical broadening coefficient for high values of J initiated usto test other possible parameters for the isotropic potential. Since the multipole moments were fixed in our computationsand only the electrostatic contributions are responsible for the high J value linewidths, solely the Viso potential can bemodified to improve the fit of the experimental data. An alternative set of Lennard–Jones parameters for O2 molecule(�O2¼ 88 K, sO2
¼ 3:541 ) [33] resulted in slightly different parameters for HCN–O2: e ¼ 84.85 K, s ¼ 3.730 A, but nosignificant change was observed for the computed linewidths. We made therefore one more computation taking this time adeeper HCN isotropic potential [26], so that the Lennard–Jones parameters for the anisotropic V202 term and the isotropicpotential were exactly the same. The resulting theoretical curve (‘‘Viso3’’) in Fig. 7 reproduces very well the broadeningcoefficients for high J values but obviously overestimates the linewidths at middle and small J. As it had already beenperformed previously [11], we did not test the Lennard–Jones N-6 or spherical average of the atom–atom interactionsmodels for the isotropic potential, since no significant difference between the broadening coefficients obtained by theseand the usual 12–6 Lennard–Jones form was stated by the authors. For HCN–O2 we retained therefore the Viso1parameterization of the isotropic potential as the most appropriate, Table 2. The best parameterization for the anisotropicpotential component V202 appears to have the same values of e and s as Viso1.
For the rotational transitions referring to the (0,121, 0) vibrational state (the rotational constant value and the dipolar
moment of HCN change as mentioned at the end of Section 4), the theoretical curve is practically indistinguishable fromthat of the (0, 0, 0) ground state (thick dashed line in Fig. 7). The corresponding numerical values are presented in Table 2.This is less clear for the experimental data where the measurement uncertainty does not allow the vibrational dependencyto be excluded.

ARTICLE IN PRESS
C. Yang et al. / Journal of Quantitative Spectroscopy & Radiative Transfer 109 (2008) 2857–2868 2865
6. Air-broadened half-widths
The air-broadened half-widths in the pure rotational band were estimated from our oxygen- and nitrogen-broadeningdata using (7). These values are shown in Fig. 8 along with the polynomial (dashed line) that was used to estimate thevalues for all the bands of HCN in the HITRAN2004 database [3]. The polynomial was derived from the fit to theexperimental data from the (1, 0, 0) and (0, 2, 0) bands [6,7]. The polynomial was used for jmjp29, where m ¼ �J00 for the P
branches and m ¼ J0 for R-branches. For jmj429 the constant value of 0.088 cm�1 atm�1 was used (the horizontal dashed-dotted line in Fig. 8) due to lack of the experimental information for higher J-values.
It is obvious that the value of 0.088 cm�1 atm�1 significantly overestimates the air-broadened half-widths for higher J
transitions measured in this work. In Fig. 8 the data from P and R branches of (1, 0, 0) and (0,1, 0) bands [5,7] are also shown.They were fitted together with the values from this work to obtain a fourth-order polynomial
gair ¼ A0 þ A1jmj þ A2jmj2 þ A3jmj
3 þ A4jmj4 (8)
The values from the (0, 2, 0) band [6] were not included in the fit as they are very close to the values from (1, 0, 0) bandwhich is also a parallel band. The results of the fit are given in Table 3. The new polynomial is suggested for the new editionof the HITRAN database, because it takes into account values for the higher J transitions and also derived from both paralleland perpendicular bands. Although the fitting data were only available for jmjp34, it appears that the polynomial followsthe trend up to jmj ¼ 40; therefore, it seems to be safe to use for jmjp40, with HITRAN uncertainty code 5 (5–10%) [3]. Forjmj440 it is suggested to use the polynomial value for jmj ¼ 40 until more data become available. The HCN-broadeningparameters are currently used to study the atmospheric composition of Titan; it is therefore important to have a similarpolynomial expression for the nitrogen-broadening coefficient. Such an expression was derived in [8] and it is interesting tosee if it can be improved by utilizing the high J data from this work. Data for the (1, 0, 0) band [7], the (0,1, 0) band [8,11,34]and the pure rotation band of this work and [13,31] were together fitted to a third-order polynomial analogous to (8). Theresults are shown in Fig. 9. Apart from the polynomial derived in this work (the coefficients are also given in Table 3), thepolynomial function from [8] is also plotted. Interestingly, it also follows the data very well even at higher jmj values.
Fig. 8. Air-broadened half-widths of HCN from pure rotational, (1, 0, 0) and (0,1, 0) bands.
Table 3Fourth-order polynomial fit (Eq. (8) to experimental air and nitrogen broadened half-widths)
Parameter Value (air) Error (air) Value (N2) Error (N2)
All bands All bands
A0 0.15694 1.4�10�3 0.17396 1.1�10�3
A1 �9.86�10�3 5.0�10�4�0.00997 2.7�10�4
A2 6.29144�10�4 5. 7�10�5 5.039�10�4 1.8�10�5
A3 �1.71209�10�5 2.4�10�6�8.58211�10�6 3.5�10�7
A4 1.47824�10�7 3.5�10�8
R2 0.97205 0.96844
St. dev. 0.0024 0.00313
N points 133 161

ARTICLE IN PRESS
Fig. 9. N2-broadened half-widths of HCN from pure rotational, (1, 0, 0) and (0,1, 0) bands.
Fig. 10. A comparison of nitrogen-broadened half-widths of R-branch lines of HCN from pure rotational, (1, 0, 0) and (0,1, 0) bands. The widths of lines
from pure rotational and (1, 0, 0) bands are plotted against widths of the corresponding (0,1, 0) lines.
C. Yang et al. / Journal of Quantitative Spectroscopy & Radiative Transfer 109 (2008) 2857–28682866
Therefore either polynomial can be used safely, although the polynomial derived here seems to account slightly better forthe widths of pure rotational lines.
Although it was previously suggested that there is no strong vibrational dependence for the foreign gas broadening ofHCN lines [3], the observations of Figs. 7–9 suggest the possibility of such a dependence. In Fig. 10 the N2-broadened half-widths (R-branches) from (1, 0, 0) [7], (0,1, 0) [8] and pure rotation bands measured here and in [13,31] are compared. Thehalf-widths of (0,1, 0) band are taken as reference values. It seems that the values from (1, 0, 0) and (0,1, 0) bands are a littledifferent at lower J’s (wider widths). Unfortunately, there is not enough experimental information to study the vibrationaldependence for the oxygen broadening.
7. Conclusion
The construction of a CW-THz spectrometer based on two ECDL has allowed the HCN-broadening coefficients for oxygenand nitrogen to be measured at frequencies from 532 GHz to 3.26 THz (5pJp36). The correct operation of this newlyconstructed instrument was validated by the good agreement between the measured nitrogen data and that published bySergent-Rozey et al. [9]. The oxygen-broadening coefficients were computed as a function of the rotation quantum numberusing the semiclassical RBE formalism for various parameterizations of the isotropic part of the interaction potential whichgoverns the relative molecular motion and influences significantly the theoretical linewidth values. Although all testedparameterizations provided a reasonable agreement with the experimental data, the Viso1 set of parameters was retained

ARTICLE IN PRESS
C. Yang et al. / Journal of Quantitative Spectroscopy & Radiative Transfer 109 (2008) 2857–2868 2867
as optimal. Since the application of the measured data to the air-broadening parameter tabulated in the HITRAN databasedisplayed a significant discrepancy for jmj429, a new fourth-order polynomial was therefore suggested for inclusion inHITRAN to improve the accuracy for these transitions. Comparison between the data measured for nitrogen broadeningwith the (1, 0, 0) and (0,1, 0) bands recorded in the infrared region indicated the possibility of a vibrational dependency;further investigations are required in order to confirm this tendency.
Acknowledgments
The authors would like to thank J.F. Lampin and K. Blary of the IEMN for the fabrication of the photomixer devices, alongwith Marc Fourmentin for his assistance in the preparation of this article. The authors also thank M.A.H. Smith for hercomments regarding this work. This work was partially funded by Agence De l’ Environnement et de la Maıtrise de l’Energie(ADEME), the Region Nord–Pas de Calais, the European Commission and the Delegation Generale pour l’Armement(projet de Recherche Exploratoire et Innovation no. 06.34.037). The Laboratoire de Physico-Chimie de l’Atmosphere and theLaboratoire de Physique des Lasers, Atomes et Molecules participate in the Centre d’Etudes et de Recherches Laserset Applications (CERLA).
References
[1] Teanby NA, Irwin PGJ, de Kok R, Vinatier S, Bezard B, Nixon CA, et al. Vertical profiles of HCN, HC3N, and C2H2 in Titan’s atmosphere derived fromCassini/CIRS data. Icarus 2007;186:364–84.
[2] Kim SJ, Geballe TR, Noll KS, Courtin R. Clouds, haze, and CH4, CH3D, HCN, and C2H2 in the atmosphere of Titan probed via 3mm spectroscopy. Icarus2005;173:522–32.
[3] Rothman LS, Jacquemart D, Barbe A, Benner DC, Birk M, Brown LR, et al. The HITRAN 2004 molecular spectroscopic database. JQSRT2005;96:139–204.
[4] Weisstein EW, Serabyn E. Submillimeter line search in Jupiter and Saturn. Icarus 1996;123:23–36.[5] Devi VM, Benner DC, Smith MAH, Rinsland CP, Predoi-Cross A, Sharpe SW, et al. A multispectrum analysis of the n2 band of H12C14N: Part I. Intensities,
broadening, and shift coefficients. J Mol Spectrosc 2005;231:66–84.[6] Devi VM, Benner DC, Smith MAH, Rinsland CP, Sharpe SW, Sams RL. A multispectrum analysis of the 2n2 spectral region of H12C14N: intensities,
broadening and pressure-shift coefficients. JQSRT 2004;87:339–66.[7] Rinsland CP, Devi VM, Smith MAH, Benner DC, Sharpe SW, Sams RL. A multispectrum analysis of the n1 band of H12C14N: Part II. Air- and
N2-broadening, shifts and their temperature dependences. JQSRT 2003;82:343–62.[8] Smith MAH, Rinsland CP, Blake TA, Sams RL, Benner DC, Devi VM. Low-temperature measurements of HCN broadened by N2 in the 14mm spectral
region. JQSRT 2008;109:922–51.[9] Sergent-Rozey M, Nguyen-Van-Thanh, Rossi I, Bouanich JP. Nitrogen broadening measurements in the far infrared-spectrum of HCN. J Mol Spectrosc
1990;142:182–90.[10] Schmidt C, Lambot D, Walrand J, Blanquet G, Bouanich JP. Diode-laser measurements of N2-broadening coefficients in the n2 band of HCN. J Mol
Spectrosc 1992;151:292–302.[11] Schmidt C, Populaire JC, Walrand J, Blanquet G, Bouanich JP. Diode-laser measurements of N2-broadening coefficients in the n2 band of HCN at
low-temperature. J Mol Spectrosc 1993;158:423–32.[12] Robert D, Bonamy J. Short-range force effects in semi-classical molecular line broadening calculations. J Phys—Paris 1979;40:923–43.[13] Rohart F, Nguyen L, Buldyreva J, Colmont JM, Wlodarczak G. Lineshapes of the 172 and 602 GHz rotational transitions of HC15N. J Mol Spectrosc
2007;246:213–27.[14] Buldyreva J, Bonamy J, Robert D. Semiclassical calculations with exact trajectory for N2 rovibrational Raman linewidths at temperatures below 300 K.
JQSRT 1999;62:321–43.[15] Landau LD, Lifshitz EM. Course of theoretical physics. Oxford: Pergamon; 1976.[16] Hindle F, Cuisset A, Bocquet R, Mouret G. Continuous-wave terahertz by photomixing: applications to gas phase pollutant detection and
quantification. CR Phys 2008;9:262–75.[17] Matton S, Rohart F, Bocquet R, Mouret G, Bigourd D, Cuisset A, et al. Terahertz spectroscopy applied to the measurement of strengths and
self-broadening coefficients for high-J lines of OCS. J Mol Spectrosc 2006;239:182–9.[18] Chen P, Pearson JC, Pickett HM, Matsuura S, Blake GA. Measurements of 14NH3 in the n2 ¼ 1 state by a solid-state, photomixing, THz spectrometer,
and a simultaneous analysis of the microwave, terahertz, and infrared transitions between the ground and n2 inversion-rotation levels. J MolSpectrosc 2006;236:116–26.
[19] Mouret G, Matton S, Bocquet R, Hindle F, Peytavit E, Lampin JF, et al. Far-infrared cw difference-frequency generation a using vertically integrated andplanar low temperature grown GaAs photomixers: application to H2S rotational spectrum up to 3 THz. Appl Phys B 2004;79:725–9.
[20] Podobedov VB, Plusquellic DF, Fraser GT. THz laser study of self-pressure and temperature broadening and shifts of water vapor lines for pressures upto 1.4 kPa. JQSRT 2004;87:377–85.
[21] Bigourd D, Cuisset A, Hindle F, Matton S, Bocquet R, Mouret G, et al. Multiple component analysis of cigarette smoke using THz spectroscopy,comparison with standard chemical analytical methods. Appl Phys B 2007;86:579–86.
[22] Humlicek J. Optimized computation of the Voigt and complex probability functions. JQSRT 1982;27:437–44.[23] Jorgensen UG, Almlof J, Gustafsson B, Larsson M, Siegbahn P. CASSCF and CCI calculations of the vibrational band strengths of HCN. J Chem Phys
1985;83:3034–42.[24] Gray CG, Gubbins KE. Theory of molecular fluids. Fundamentals, vol. 1. London/New York: Oxford University Press (Clarendon Press); 1984.[25] Stogryn DE, Stogryn AP. Molecular multipole moments. Mol Phys 1966;11:371–93.[26] Rohart F, Derozier D, Legrand J. Foreign gas relaxation of the J ¼ 0–41 transition of HC15N. A study of the temperature-dependence by coherent
transients. J Chem Phys 1987;87:5794–803.[27] Johnston HL, McCloskey KE. Viscosities of several common gases between 90 K and room temperature. J Phys Chem 1940;44:1038–58.[28] Tsao CJ, Curnutte B. Line-widths of pressure-broadened spectral lines. JQSRT 1962;2:41–91.[29] Hietanen J, Jolma K, Horneman VM. The infrared calibration lines of HCN in the region of n2 with the resolution of 0.003 cm�1. J Mol Spectrosc
1988;127:272–4.[30] Herzberg G. Spectra of diatomic molecules. Princeton: Van Nostrand; 1966.[31] Colmont JM. Collisional broadening of the J ¼ 1o�0 transition of HC15N by nitrogen, oxygen, helium, and air. J Mol Spectrosc 1985;114:
298–304.

ARTICLE IN PRESS
C. Yang et al. / Journal of Quantitative Spectroscopy & Radiative Transfer 109 (2008) 2857–28682868
[32] Kaghat F. Profils des transitions millimetriques : Analyse par spectroscopie resolue en temps du retrecissement et de l’asymetrie lies a la distributiondes vitesses moleculaires. Ph.D. thesis, Universite de Lille 1,1995.
[33] Trautz M, Melster A. Die reibung, warmeleitung und diffusion in gasmischungen XI. Die reibung von H2, N2, CO, C2H4, O2 und ihren binarengemischen. Ann Phys 1930;399:409–26.
[34] Lemaire V, Babay A, Lemoine B, Rohart F, Bouanich JP. Self- and foreign-gas-broadening and shifting of lines in the n2 band of HCN. J Mol Spectrosc1996;177:40–5.