oxford cambridge and rsa wednesday 12 june 2019 – morning
TRANSCRIPT

*7663502571*
Turn overOCR is an exempt Charity© OCR 2019 [603/1038/8]
DC (SC/TP) 191700/5 R
Oxford Cambridge and RSA
INSTRUCTIONS• Use black ink. HB pencil may be used for graphs and diagrams only.• Answer all the questions. • Write your answer to each question in the space provided in the Printed Answer
Booklet. If additional space is required, you should use the lined page(s) at the end of the Printed Answer Booklet. The question number(s) must be clearly shown.
• You are permitted to use a scientific or graphical calculator in this paper.• Give non-exact numerical answers correct to 3 significant figures unless a different
degree of accuracy is specified in the question.• The acceleration due to gravity is denoted by g m s–2. Unless otherwise instructed, when
a numerical value is needed, use g = 9.8.
INFORMATION• The total mark for this paper is 100.• The marks for each question are shown in brackets [ ].• You are reminded of the need for clear presentation in your answers.• The Printed Answer Booklet consists of 16 pages. The Question Paper consists of
12 pages.
You must have:• Printed Answer Booklet
You may use:• a scientific or graphical calculator
Wednesday 12 June 2019 – MorningA Level Mathematics AH240/02 Pure Mathematics and Statistics Time allowed: 2 hours

2
H240/02 Jun19© OCR 2019
FormulaeA Level Mathematics A (H240)
Arithmetic seriesS n a l n a n d2 1n 2
121= + = + -^ ^h h" ,
Geometric series
S ra r
11
n
n=
--^ h
S ra
1= -3 for r 11
Binomial seriesC C Ca b a a b a b a b b n Nn n n n n n n
rn r r n
11
22 2 f f !+ = + + + + + +- - -^ ^h h,
where ! !!C
nr r n r
nCn r n r= = =-
J
LKK ^N
POO h
! ! ,x nxn n
x rn n n r
x x n1 1 21 1 1
1 Rn r2 ff
f 1 !+ = + +-
+ +- - +
+^ ^ ^ ^ ^h h h h h
Differentiation
tan kx seck kx2
sec tanx xcosec x2-cosec cotx x-
sec xcot xcosec x
xf^ h xf l^ h
Quotient rule y vu
= , xy
v
v xu u x
v
dd d
ddd
2=-
Differentiation from first principles
limx hx h x
ff f
h 0=
+ -
"l^ ^ ^h h h
Integration
lnxxx x c
ff
d f= +lc
edd ^^ ^hh h
x x x n x c11f f d f
n n 1=+
++
l; ^ a ^ a ^h hk hk
Integration by parts u xv x uv v x
u xdd d d
d d= -; ;
Small angle approximationssin .i i , cos 1 2
1 2.i i- , tan .i i where i is measured in radians

3
H240/02 Jun19 Turn over© OCR 2019
Trigonometric identitiessin sin cos cos sinA B A B A B! !=^ h
cos cos cos sin sinA B A B A B! "=^ h
tan tan tantan tanA B A BA B
1!"!
=^ h A B k 21! ! r+a ^ h k
Numerical methods
Trapezium rule: y x h y y y y y2da
bn n2
10 1 2 1f. + + + + +
-^ ^h h" ,y , where h nb a
=-
The Newton-Raphson iteration for solving x 0f =^ h : x x xx
ff
n nn
n1 = -+ l
^^hh
ProbabilityA B A B A BP P P P, += + -^ ^ ^ ^h h h h
A B A B A B A BP P P P P+ = =^ ^ ^ ^ ^h h h h h or A BBA B
PP
P +=^ ^
^h hh
Standard deviation
nx
nx x
x 2 22
-= -
^ h/ / or ff x x
ffx
x2 2-= - 2
^ h/
///
The binomial distribution
If ,X n pB+ ^ h then P X xnx p p1x n x
= = --
J
LKK^ ^N
POOh h , mean of X is np, variance of X is np p1-^ h
Hypothesis test for the mean of a normal distribution
If ,X N 2+ n v^ h then ,Xn
N2
+ nv
J
LKK
N
POO and ,
nX
0 1N+v
n- ^ h
Percentage points of the normal distributionIf Z has a normal distribution with mean 0 and variance 1 then, for each value of p, the table gives the value of z such that Z z pP G =^ h .
0.75 0.90 0.95 0.674 1.282 1.645
0.975 0.99 0.995 1.960 2.326 2.576
0.9975 0.999 0.9995 2.807 3.090 3.291
pz
KinematicsMotion in a straight line Motion in two dimensionsv u at= + tv u a= +
s ut at21 2= + t ts u a2
1 2= +
s u v t21= +^ h ts u v2
1= +^ hv u as22 2= +
s vt at21 2= - t ts v a2
1 2= -

4
H240/02 Jun19© OCR 2019
Section A: Pure MathematicsAnswer all the questions.
1 (a) Differentiate the following.
(i) xx
2 12
+ [3]
(ii) ( )tan x x32 - [2]
(b) Use the substitution u x 1= - to integrate x 11-
. [4]
(c) Integrate x x
x2 8 1
22 - -
- . [2]
2 (a) Find the coefficient of x5 in the expansion of ( )x3 2 8- . [1]
(b) (i) Expand ( )x1 3 .0 5+ as far as the term in x3. [3]
(ii) State the range of values of x for which your expansion is valid. [1]
A student suggests the following check to determine whether the expansion obtained in part (b)(i) may be correct.
“Use the expansion to find an estimate for 103 , correct to five decimal places, and compare this with the value of 103 given by your calculator.”
(iii) Showing your working, carry out this check on your expansion from part (b)(i). [3]
3 (a) A circle is defined by the parametric equations ,cos sinx y3 2 4 2i i= + =- + .
(i) Find a cartesian equation of the circle. [2]
(ii) Write down the centre and radius of the circle. [1]
(b) In this question you must show detailed reasoning.
The curve S is defined by the parametric equations ,cos sinx t y t4 2= = . The line L is a tangent to S at the point given by t 6
1r= .
Find where the line L cuts the x-axis. [6]

5
H240/02 Jun19 Turn over© OCR 2019
4 A species of animal is to be introduced onto a remote island. Their food will consist only of various plants that grow on the island. A zoologist proposes two possible models for estimating the population P after t years. The diagrams show these models as they apply to the first 20 years.
1000
Model A
500
0 10
P
t20
1000
Model B
500
0 10
P
t20
(a) Without calculation, describe briefly how the rate of growth of P will vary for the first 20 years, according to each of these two models. [1]
The equation of the curve for model A is P 20 1000e( )t10020 2
= + --
.
The equation of the curve for model B is P 20 1000 1 et5= + - -
J
LKK
N
POO.
(b) Describe the behaviour of P that is predicted for t 202
(i) using model A, [1]
(ii) using model B. [1]
There is only a limited amount of food available on the island, and the zoologist assumes that the size of the population depends on the amount of food available and on no other external factors.
(c) State what is suggested about the long-term food supply by
(i) model A, [1]
(ii) model B. [1]

6
H240/02 Jun19© OCR 2019
5
h
r
l
For a cone with base radius r, height h and slant height l, the following formulae are given.
Curved surface area, S rlr=
Volume, V r h31 2r=
A container is to be designed in the shape of an inverted cone with no lid. The base radius is r m and the volume is V m3.
The area of the material to be used for the cone is 4r m2.
(a) Show that V r r1631 2 6r= - . [4]
(b) In this question you must show detailed reasoning.
It is given that V has a maximum value for a certain value of r.
Find the maximum value of V, giving your answer correct to 3 significant figures. [5]
6 Shona makes the following claim.
“n is an even positive integer greater than 2 2 1n& - is not prime”
Prove that Shona’s claim is true. [4]
7 In this question you must show detailed reasoning.
Use the substitution u x x6 2= + to solve the equation x x x x36 12 7 2 04 3 2+ + + - = . [5]

7
H240/02 Jun19 Turn over© OCR 2019
Section B: StatisticsAnswer all the questions.
8 The stem-and-leaf diagram shows the heights, in centimetres, of 17 plants, measured correct to the nearest centimetre.
5 7 9 93 4 55 55 55 9 94 5 7 9 9
9
56789
Key: 55 6 means 56
(a) Find the median and inter-quartile range of these heights. [3]
(b) Calculate the mean and standard deviation of these heights. [2]
(c) State one advantage of using the median rather than the mean as a measure of average for these heights. [1]
9 (a) The masses, in grams, of plums of a certain kind have the distribution N(55, 18).
(i) Find the probability that a plum chosen at random has a mass between 50.0 and 60.0 grams. [1]
(ii) The heaviest 5% of plums are classified as extra large.
Find the minimum mass of extra large plums. [1]
(iii) The plums are packed in bags, each containing 10 randomly selected plums.
Find the probability that a bag chosen at random has a total mass of less than 530 g. [4]
(b) The masses, in grams, of apples of a certain kind have the distribution N(67, v2). It is given that half of the apples have masses between 62 g and 72 g.
Determine v. [5]
10 The level, in grams per millilitre, of a pollutant at different locations in a certain river is denoted by the random variable X, where X has the distribution N(n, 0.000 040 9).
In the past the value of n has been 0.0340.
This year the mean level of the pollutant at 50 randomly chosen locations was found to be 0.0325 grams per millilitre.
Test, at the 5% significance level, whether the mean level of pollutant has changed. [7]

8
H240/02 Jun19© OCR 2019
11 A trainer was asked to give a lecture on population profiles in different Local Authorities (LAs) in the UK. Using data from the 2011 census, he created the following scatter diagram for 17 selected LAs.
00
0.05
0.1
0.15
0.2
0.25
0.05 0.1 0.15
Proportion aged 65+
Prop
ortio
n ag
ed 1
8 to
24
0.2 0.25 0.3 0.35
17 Selected Local Authorities
He selected the 17 LAs using the following method. The proportions of people aged 18 to 24 and aged 65+ in any Local Authority are denoted by Pyoung and Psenior respectively. The trainer used a
spreadsheet to calculate the value of k PP
senior
young= for each of the 348 LAs in the UK. He then used
specific ranges of values of k to select the 17 LAs.
(a) Estimate the ranges of values of k that he used to select these 17 LAs. [2]
(b) Using the 17 LAs the trainer carried out a hypothesis test with the following hypotheses.
H0: There is no linear correlation in the population between Pyoung and Psenior. H1: There is negative linear correlation in the population between Pyoung and Psenior.
He found that the value of Pearson’s product-moment correlation coefficient for the 17 LAs is .0 797- , correct to 3 significant figures.
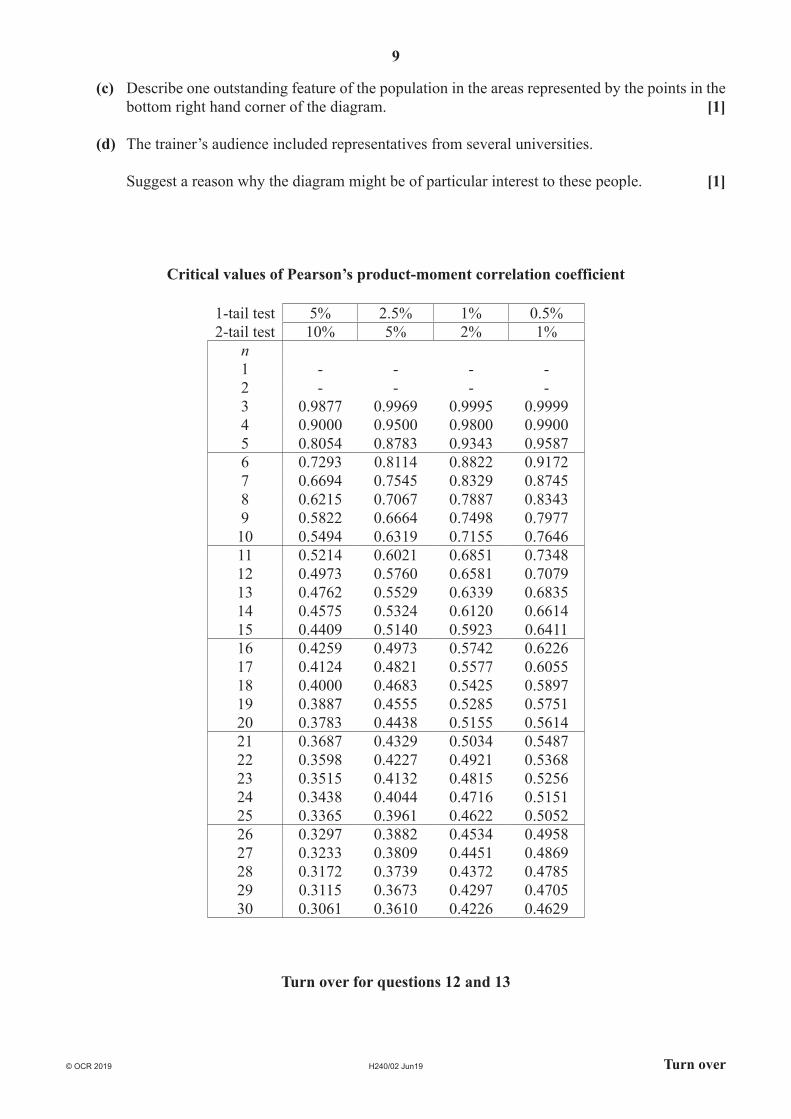
(i) Use the table on page 9 to show that this value is significant at the 1% level. [2]
The trainer concluded that there is evidence of negative linear correlation between Pyoung and Psenior in the population.
(ii) Use the diagram to comment on the reliability of this conclusion. [2]
9
H240/02 Jun19 Turn over© OCR 2019
(c) Describe one outstanding feature of the population in the areas represented by the points in the bottom right hand corner of the diagram. [1]
(d) The trainer’s audience included representatives from several universities.
Suggest a reason why the diagram might be of particular interest to these people. [1]
Critical values of Pearson’s product-moment correlation coefficient
1-tail test 5% 2.5% 1% 0.5%2-tail test 10% 5% 2% 1%
n1 - - - -2 - - - -3 0.9877 0.9969 0.9995 0.99994 0.9000 0.9500 0.9800 0.99005 0.8054 0.8783 0.9343 0.95876 0.7293 0.8114 0.8822 0.91727 0.6694 0.7545 0.8329 0.87458 0.6215 0.7067 0.7887 0.83439 0.5822 0.6664 0.7498 0.797710 0.5494 0.6319 0.7155 0.764611 0.5214 0.6021 0.6851 0.734812 0.4973 0.5760 0.6581 0.707913 0.4762 0.5529 0.6339 0.683514 0.4575 0.5324 0.6120 0.661415 0.4409 0.5140 0.5923 0.641116 0.4259 0.4973 0.5742 0.622617 0.4124 0.4821 0.5577 0.605518 0.4000 0.4683 0.5425 0.589719 0.3887 0.4555 0.5285 0.575120 0.3783 0.4438 0.5155 0.561421 0.3687 0.4329 0.5034 0.548722 0.3598 0.4227 0.4921 0.536823 0.3515 0.4132 0.4815 0.525624 0.3438 0.4044 0.4716 0.515125 0.3365 0.3961 0.4622 0.505226 0.3297 0.3882 0.4534 0.495827 0.3233 0.3809 0.4451 0.486928 0.3172 0.3739 0.4372 0.478529 0.3115 0.3673 0.4297 0.470530 0.3061 0.3610 0.4226 0.4629
Turn over for questions 12 and 13

10
H240/02 Jun19© OCR 2019
12 A random variable X has probability distribution defined as follows.
( ), , , , ,
,X xkx x0
1 2 3 4 5P otherwise= =
=*
where k is a constant.
(a) Show that ( ) .X 3 0 2P = = . [3]
(b) Show in a table the values of X and their probabilities. [2]
(c) Two independent values of X are chosen, and their total T is found.
(i) Find ( )T 7P = . [3]
(ii) Given that T 7= , determine the probability that one of the values of X is 2. [4]
13 It is known that 26% of adults in the UK use a certain app. A researcher selects a random sample of 5000 adults in the UK. The random variable X is defined as the number of adults in the sample who use the app.
Given that ( ) .X n 0 025P 1 1 , calculate the largest possible value of n. [5]
END OF QUESTION PAPER

11
H240/02 Jun19© OCR 2019
BLANK PAGE

12
H240/02 Jun19© OCR 2019
Oxford Cambridge and RSA
Copyright Information
OCR is committed to seeking permission to reproduce all third-party content that it uses in its assessment materials. OCR has attempted to identify and contact all copyright holders whose work is used in this paper. To avoid the issue of disclosure of answer-related information to candidates, all copyright acknowledgements are reproduced in the OCR Copyright Acknowledgements Booklet. This is produced for each series of examinations and is freely available to download from our public website (www.ocr.org.uk) after the live examination series.
If OCR has unwittingly failed to correctly acknowledge or clear any third-party content in this assessment material, OCR will be happy to correct its mistake at the earliest possible opportunity.
For queries or further information please contact The OCR Copyright Team, The Triangle Building, Shaftesbury Road, Cambridge CB2 8EA.
OCR is part of the Cambridge Assessment Group; Cambridge Assessment is the brand name of University of Cambridge Local Examinations Syndicate (UCLES), which is itself a department of the University of Cambridge.