ownership of jse-listed companies - national treasury ownership... · 2 ownership of jse-listed...
TRANSCRIPT

0
Ownership of JSE-listed companies
Research Report for National Treasury
September 2017

1
Ownership of JSE-listed companies
Research Report for National Treasury
September 2017
Table of Contents
1. Introduction .............................................................................................................. 2
2. The JSE equity market ................................................................................................ 3 2.1 Instruments ................................................................................................................................. 3
2.2 South African and foreign companies............................................................................. 4
2.3 Free-float market capitalisation ..................................................................................... 5
3. Foreign ownership of JSE-listed companies ................................................................ 6
4. Ownership through South African institutional investors ............................................ 10
5. Major shareholders in South African companies ...................................................... 15
6. Black ownership ...................................................................................................... 17
7. Ownership Monitor ................................................................................................. 24
This research report was prepared by Lynne Thomas, an independent researcher and consultant,
formerly with Centre for Research in Economics and Finance in Southern Africa at the London School
of Economics. The views do not necessarily reflect the views of the National Treasury.
Comments on the draft report may be sent to [email protected] by 30 October 2017.

2
Ownership of JSE-listed companies
Research Report for National Treasury
September 2017
1. Introduction The structure of ownership of South African companies reflects several important aspects of the South African economy, linking to policy priorities on transformation and inclusive growth, macroeconomic and financial stability, and competition. This report presents data on the ownership of South African companies listed on the JSE and proposes an Ownership Monitor for tracking trends in the composition of ownership over time1. Listed companies are typically expected to have diverse ownership - characterised by a large number of relatively small shareholdings - although many will also have one or more strategic shareholders with a significant influence in the company. This assessment focuses on four aspects of ownership, reflecting the policy priorities noted above:
Foreign ownership
Ownership through South African institutional investors, including retirement funds, long-term insurance companies, collective investment schemes and investment managers
Major shareholdings, i.e., significant stakes in the company by one or more shareholders
Black (BEE) ownership The report begins by describing key characteristics of the JSE equity market and sets out the basis of the estimates of ownership developed in this report. Each element of ownership is then considered, drawing on data from a variety of sources brought together for this study. The final section combines the data in an Ownership Monitor aimed at providing an overarching view of ownership of JSE-listed companies. Selected examples of the composition of ownership for major South African companies are shown throughout this report in boxes.
1 The analysis does not cover unlisted companies as data are not generally available on the ownership
structure of privately-held companies. By definition, unlisted companies do not offer their shares for trade on the stock exchange and are typically held by a small number of owners.

3
2. The JSE equity market2 The JSE equity market comprised 816 traded instruments and 379 listed companies at the end of 2016. The market captures a range of instruments issued by listed companies to fund investment and economic activity, and also investment products based on varied underlying assets. The equity market is a channel through which savings (domestic and foreign) can flow into real (productive) investment in the economy, and through which shares and other instruments are traded between investors, forming part of the financial infrastructure for the allocation and management of risks and returns in the economy.
2.1 Instruments Table 1 summarises the number and value of various categories of instruments traded in the JSE equity market, as at the end of 2016. By far the largest category is ordinary shares issued by listed companies. Ordinary shares are characterised by the right to receive dividends and the right to vote at shareholder meetings and on major corporate actions. Ordinary shareholders are entitled to the residual capital on the winding up of the company only after other creditors have been paid out. This is the main type of instrument traded in the equity market, both by number and market capitalisation3. Similar equity instruments include: (i) N ordinary shares and B ordinary shares – these are alternative classes of shares that pay dividends to the shareholder but have fewer or no voting rights and rights to the residual capital of the company may be different to those of ordinary shareholders; (ii) depository receipts – these are instruments linked to the underlying shares of a foreign company; and (iii) participatory interests in property-based investments (REITs).
Table 1: Overview of the JSE equity market, at end 2016
Number of instruments
Market capitalisation1
millions of rand
Ordinary shares and similar equity instruments2 387 13 132 904
Preference shares and debentures 64 44 268
Exchange Traded Funds 49 65 518
Warrants and options 270 322 398
Other instruments3 46 15 531
Total equity market 816 13 580 619
Source: Calculated from data provided by the JSE
Notes: 1. Market capitalisation is the share price on the reference date (in this case end of 2016) multiplied by the number of shares on the reference date. This measure of total market capitalisation includes shares in foreign-domiciled companies that are held offshore (see Table 2).
2. Similar equity instruments include N and B ordinary shares, depository receipts and participatory interests in REITs. Seven companies have two or more classes of shares listed on the JSE. Adjusting for multiple classes of shares, there were 379 listed companies at the end of 2016.
3. Includes Exchange Traded Notes and other investment products
2 This report focuses on the ownership of shares in companies listed on the JSE equity market. It does not
cover participation in the JSE debt and derivatives markets.
3 Market capitalisation is the share price on a particular reference date multiplied by the number of shares in
the company on that date. It measures the current market value of the company’s shares.

4
The analysis of ownership in this report is based on holdings of ordinary shares and similar equity instruments issued by listed companies (with some exceptions noted where relevant). Other instruments traded in the JSE equity market are not included as they do not confer ownership in the sense of: (i) the right to the dividend and (ii) the right to vote which otherwise accompanies the ownership of ordinary shares. These other instruments include debt and debt-like instruments issued by listed companies (preference shares4 and debentures), warrants and options linked to the shares of listed companies, exchange traded funds that track the shares of listed companies (in South Africa and in foreign jurisdictions) and other structured investment products.
2.2 South African and foreign companies The JSE equity market is an international market, providing access to shares in both South African (domestic) companies and a growing number of foreign-domiciled companies. Foreign companies have been permitted to list shares on the JSE since 2004 - commonly referred to as “inward listings”. This has had two important effects in the market: (i) foreign companies are able to raise capital in South Africa to finance investment, both locally and internationally; and (ii) South African investors are able to use a familiar (and regulated) local conduit for the international diversification of risks and returns. Before 2004, a number of South African companies received permission to move to a foreign domicile and to list on major international stock exchanges, while also retaining listings on the JSE5. These companies have subsequently evolved or been absorbed into much larger international companies, although many maintain strong economic ties with South Africa. For the purposes of this report, these companies are classified as foreign on the basis of their domicile and primary stock exchange listing but in a number of cases there is a significant economic presence in South Africa. Table 2 shows the market capitalisation of listed companies at the end of 2016, distinguishing between South African companies and foreign-domiciled companies. Market capitalisation in Table 2 includes the value of ordinary shares and similar equity instruments (see Table 1); other instruments traded in the equity market are excluded.
4 Preference shares pay a fixed percentage dividend in contrast to the variable dividends earned by ordinary
shareholders. Holders of preference shares rank above ordinary shareholders in the right to residual capital if the company is wound up and do not usually have voting rights. Preference shares are hybrid instruments, combining elements of debt (a fixed dividend) and equity (capital gain).
5 Billiton (1997), Anglo American, Old Mutual and South African Breweries (1999), and Dimension Data (2000)
moved their company registration and domicile to the UK. Investec (2002) established a dual-listed company, based in the UK and South Africa. Other significant foreign listings linked to earlier unbundlings of the international assets of South African companies include Compagnie Financière Richemont and Liberty International plc (now Intu Properties plc).

5
Table 2: Market capitalisation of South African and foreign companies listed on the JSE At end 2016, in millions of rand
Number of
instruments1
Total Market Capitalisation
Market Capitalisation dematerialised on Strate
South African companies 312 5 805 283 5 497 033
Foreign-domiciled companies 75 7 327 620 1 753 507
Total 387 13 132 904 7 250 540
Source: Calculated from data provided by the JSE
Notes: 1. Ordinary shares, B and N ordinary shares, depository receipts and participatory interests in property-based investments. Other instruments traded in the equity market are excluded.
One important feature of the foreign companies listed on the JSE is that, typically, a large percentage of the shares will be held on an international share register that is not freely available to South African investors. Shares in foreign companies traded on the JSE are held on a separate South African share register6. In practice, the shares available to South African investors on the JSE are thus only a fraction of the total shares of these foreign companies. Table 2 illustrates this point by showing both the total (global) market capitalisation of listed companies and the subset of market capitalisation that is held in dematerialised (electronic) form in South Africa on Strate7. Over 90 percent of the shares in South African companies are held on Strate (by value), compared to just 24 percent of the total shares in foreign companies listed on the JSE. The analysis of ownership in this report focuses on the ownership of shares held in South Africa – based on the dematerialised shares held on Strate - including both South African and foreign-domiciled companies. Shares that are held in offshore markets (by foreigners) are not included as they are outside of the local equity market. On this basis, South African companies represented three-quarters of the local equity market at the end of 2016.
2.3 Free-float market capitalisation Another key concept in the JSE equity market is the “free-float” market capitalisation. The free float reflects the shares that, in principle, are available to trade on the JSE. The free float restriction excludes blocks of shares held by strategic owners, for example including shares that are closely held by directors and managers of the company and by affiliated companies, shares held by government, shares held in employee share schemes, shares held by publicly-traded companies, shareholdings of 10 percent or more by private companies and individuals, and other blocks of shares that are considered to be strategically held or locked-in as opposed to freely tradeable8.
6 South African residents are not freely permitted to move shares from the South African register to the
international register but non-residents are able to move shares through trading such that the total number of shares on the South African register is not necessarily constant.
7 Strate is the Central Securities Depository in South Africa, providing the electronic settlement of transactions
on the JSE.
8 Free float restrictions are described in the FTSE/JSE Africa Index Ground Rules, available from the JSE
website.
6
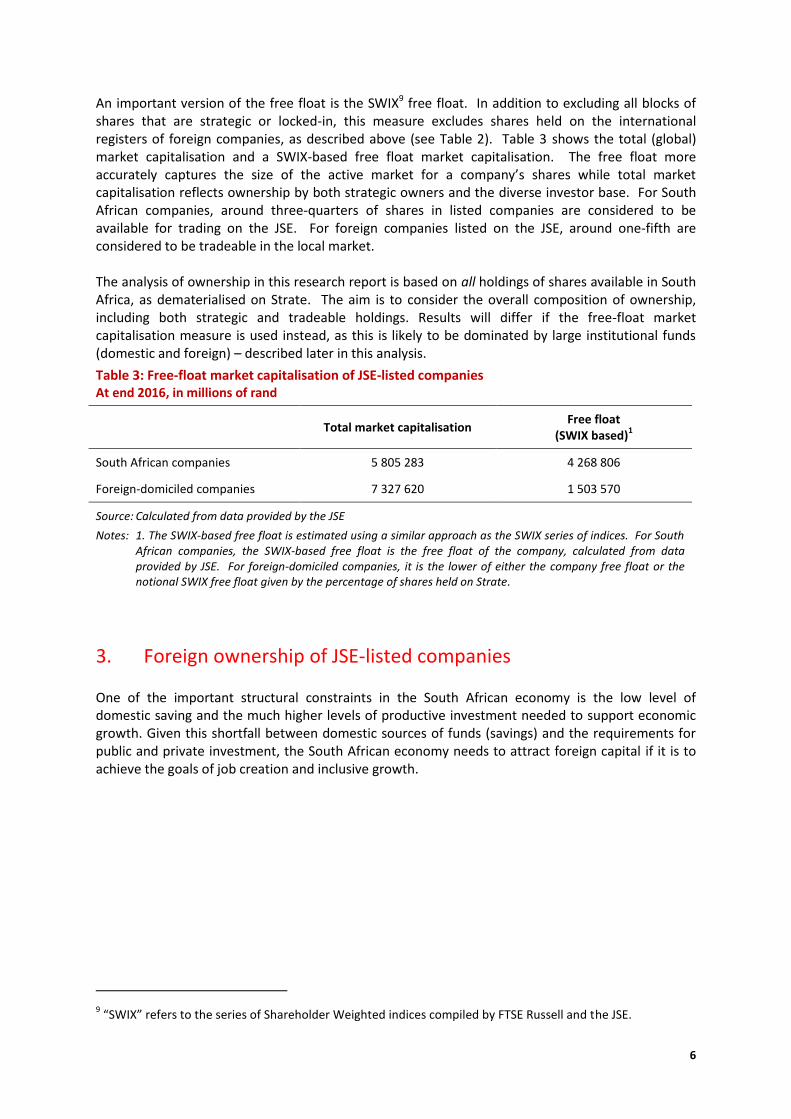
An important version of the free float is the SWIX9 free float. In addition to excluding all blocks of shares that are strategic or locked-in, this measure excludes shares held on the international registers of foreign companies, as described above (see Table 2). Table 3 shows the total (global) market capitalisation and a SWIX-based free float market capitalisation. The free float more accurately captures the size of the active market for a company’s shares while total market capitalisation reflects ownership by both strategic owners and the diverse investor base. For South African companies, around three-quarters of shares in listed companies are considered to be available for trading on the JSE. For foreign companies listed on the JSE, around one-fifth are considered to be tradeable in the local market. The analysis of ownership in this research report is based on all holdings of shares available in South Africa, as dematerialised on Strate. The aim is to consider the overall composition of ownership, including both strategic and tradeable holdings. Results will differ if the free-float market capitalisation measure is used instead, as this is likely to be dominated by large institutional funds (domestic and foreign) – described later in this analysis.
Table 3: Free-float market capitalisation of JSE-listed companies At end 2016, in millions of rand
Total market capitalisation
Free float (SWIX based)
1
South African companies 5 805 283 4 268 806
Foreign-domiciled companies 7 327 620 1 503 570
Source: Calculated from data provided by the JSE
Notes: 1. The SWIX-based free float is estimated using a similar approach as the SWIX series of indices. For South African companies, the SWIX-based free float is the free float of the company, calculated from data provided by JSE. For foreign-domiciled companies, it is the lower of either the company free float or the notional SWIX free float given by the percentage of shares held on Strate.
3. Foreign ownership of JSE-listed companies One of the important structural constraints in the South African economy is the low level of domestic saving and the much higher levels of productive investment needed to support economic growth. Given this shortfall between domestic sources of funds (savings) and the requirements for public and private investment, the South African economy needs to attract foreign capital if it is to achieve the goals of job creation and inclusive growth.
9 “SWIX” refers to the series of Shareholder Weighted indices compiled by FTSE Russell and the JSE.

7
South Africa has attracted considerable volumes of foreign capital, which has supported progress towards economic transformation. Much more needs to be done to achieve the overall vision set out in the National Development Plan – and this will require a continued role for foreign capital, channelled towards to growth-enhancing investment. Figure 1 shows the total stock of foreign capital invested in South Africa (i.e., foreign liabilities of South Africa), relative to the size of the economy (GDP). It illustrates the substantial growth in foreign participation since the mid-1990s, following the political and economic reforms that opened the economy to cross-border capital flows. The largest source of foreign ownership of South African companies is through foreign direct investment (FDI) - amounting to R1 970 billion in value at the end of 2015, equivalent to 49% of GDP. FDI is characterised by the presence of control or a significant degree of influence over the management of an enterprise in the host economy (following the standard international definition of FDI10). In statistical terms, an ownership threshold of 10 percent is typically used to define a direct investment relationship, although in practice relationships between affiliated entities can be more complex. Equity, inter-company loans and reinvested earnings all form part of the FDI relationship between the parent company and its international subsidiaries and affiliates. The presence of control or significant influence - and the intention to establish a lasting interest in the local enterprise – distinguish FDI from other forms of capital inflows. FDI is often viewed as a preferred form of capital because it is expected to contribute broader economic benefits, such as the transfer of new skills and technologies and increased access to international markets. This form
10
OECD Benchmark Definition of Foreign Direct Investment, fourth edition, Organisation for Economic Co-operation and Development, 2008; Balance of Payments and International Investment Position Manual, sixth edition, International Monetary Fund, 2009
Box 1: Changing ownership – Barclays Africa In 2005, Barclays Bank plc (UK) acquired a 57% shareholding in ABSA Group, representing the largest single foreign direct investment in South Africa at the time of the transaction. ABSA would eventually be transformed into the Barclays Africa Group following the acquisition of the African businesses of Barclays plc in 2013 – with the Barclays plc shareholding increasing to 62%. In March 2016, Barclays plc announced its intention to reduce its shareholding in Barclays Africa Group to below 20%, in order to lessen its global capital and other regulatory requirements. In May 2016, it reduced its stake to 50%. Part of these shares were sold to the Public Investment Corporation, increasing its major shareholding in Barclays Africa to 6.9%, with the remainder sold to a reasonably diverse investor base – indicated by the increased holding of other shareholders. At the beginning of June 2017, Barclays plc disposed of a further substantial stake in Barclays Africa, taking its shareholding down from 50.1% to 23.4%. Shares were sold to a mix of new and existing investors, both locally and internationally. A further 7% stake is expected to be sold to the Public Investment Corporation, subject to regulatory approvals, which will eventually take the Barclays plc holding to below 20%.
1
Barclays Africa - Shareholder composition
December 2015 December 2016 June 2017
Barclays Bank plc 62.3 50.1 23.4
Public Investment Corporation 5.6 6.9 7.1
Other shareholders 32.1 43.0 69.5
South African shareholders 20.7 25.3 38.4
Foreign shareholders 79.3 74.7 61.6
Data from Barclays Africa corporate website - Annual Reports and information on major shareholders
Barclays plc’s withdrawal has created an opportunity for increasing black ownership of the Barclays Africa Group. In a submission to Parliament in March 2017, Barclays Africa indicated that Barclays plc had agreed to make R2.1 billion of capital available for a new BEE transaction – representing around 1.5% of the market capitalisation of Barclays Africa. The proposed BEE transaction would follow an earlier major empowerment deal launched in 2004 which saw the transfer of 10% of ABSA to a BEE consortium. The 2004 empowerment deal concluded in 2012 when the BEE consortium sold off its remaining equity holding. Research by Intellidex
2 has estimated that the deal generated around
R2.6 billion in net value for black beneficiaries. 1 “Barclays Africa in South Africa’s largest bookbuild”, Barclays Africa Press Release, 1 June 2017 2 The Value of BEE Deals, Intellidex Research Report, June 2015

8
of investment typically represents a longer-term (fixed) commitment to the economy, compared to other more volatile forms of capital flows.
Foreign ownership through portfolio equity investment contributes a further substantial portion of South Africa’s foreign capital needs - amounting to R1 770 billion in value at the end of 2015, equivalent to 44% of GDP. In South Africa, portfolio equity investment is facilitated by the large and sophisticated local stock exchange11 and a sound legal and regulatory framework for investor protection12. While capital flows in this form can be volatile, it is nevertheless the case that a significant amount of accumulated foreign capital has been invested in South Africa through this channel and is likely to continue to remain an important source of foreign funding in the near future. Figure 2 shows the ownership of companies listed on the JSE, including both South African and foreign-domiciled companies. The composition of ownership by domestic and foreign investors is calculated from the market capitalisation of shares held on Strate, i.e., excluding the offshore share registers of foreign-domiciled companies. Aggregate data on foreign and domestic ownership were provided by the JSE for this study, drawing on information from the shareholder records held by Strate. Exchange control requires that shareholders be identified as domestic (resident) or foreign (non-resident). Consistent with the findings in Figure 1, the high level of foreign ownership of JSE-listed companies has continued to rise in recent years: from 28 percent of the market (by value) in 2008 to 38 percent in 2016. Similar results are obtained for the subset of South African companies listed on the JSE
11
By market capitalisation, the JSE is amongst the world’s top 20 stock exchanges (based on data from the World Federation of Exchanges, in the World Bank’s World Development Indicators).
12 South Africa ranks highly in global comparisons of measures of investor protection. Doing Business 2017
(World Bank) ranks South Africa at 22nd out of 190 countries for protecting minority investors, based on a survey of the legal framework. The Global Competitiveness Report 2016-2017 (World Economic Forum) places South Africa in the top rank out of 138 countries for the protection of minority shareholder interests, based on surveys with business executives.

9
(excluding the foreign-domiciled companies), where the share of foreign ownership has risen from 30 percent in 2008 to 37 percent in 2016. In principle, the foreign ownership data in Figure 2 should include both strategic foreign ownership in the form of FDI and foreign ownership in the form of portfolio equity investment, dominated by foreign institutional funds. However, an important caveat is that strategic foreign investment can involve a chain of ownership through a locally-based company. In cases where FDI is channelled through a local holding company, then the ownership stake in the listed company may appear as domestic ownership rather than foreign ownership in these data - based on the registered holder of the shares, as opposed to the ultimate investor. To illustrate, a selection of listed companies with major foreign owners is shown in the Box 2 – in certain cases the largest shareholder is reported to be a local holding company. The data on foreign ownership of listed companies may understate the
true extent of foreign involvement for this reason.
Box 2: Illustration - foreign ownership through local companies
Published information* on the largest identified shareholder for a small selection of South African companies is shown
below. All six companies are widely known as having a significant level of foreign ownership. However, in some cases this ownership is channelled through a local (unlisted) company in South Africa – with the result that the largest shareholder appears as a domestic rather than foreign entity. The ultimate owner of the company is also shown, based on information available on corporate websites.
Listed SA company Largest shareholder in SA company Shareholding
in SA company Ultimate foreign owner
Anglo American Platinum Anglo South Africa Capital Proprietary Ltd Domicile: South Africa
77.7% Dec 2016
Anglo American PLC (UK)
ArcelorMittal SA ArcelorMittal Holdings AG Domicile: Switzerland
53.1% Dec 2016
ArcelorMittal (Luxembourg)
Barclays Africa Barclays Bank PLC Domicile: UK
23.4% Jun 2017
Barclays Bank PLC (UK)
Massmart Main Street 830 Proprietary Limited Domicile: South Africa
52.4% Dec 2016
Walmart (US)
Nedbank Old Mutual Life Assurance (SA) Ltd & Assoc. Domicile: South Africa
54.2% Dec 2016
Old Mutual PLC (UK)
Standard Bank Industrial and Commercial Bank of China Domicile: China
20.1% Dec 2016
Industrial and Commercial Bank of China (China)
Vodacom Vodafone Investments SA (Pty) Limited Domicile: South Africa
65.0% Mar 2016
Vodafone (UK)
* Listed companies are required to disclose information on any major shareholders, holding in excess of 5 percent of issued
share capital. This information is typically published in a standard form in Annual Reports and Annual Financial Statements.
10
4. Ownership through South African institutional investors Retirement funds and long-term insurance companies manage a substantial fraction of household wealth in South Africa (Figure 3), providing the main vehicles through which millions of ordinary South Africans save for retirement and manage risks to the well-being of the household13. Collective investment schemes manage a further substantial portion of discretionary savings by households,
13
In 2015, there were just over 16 million members of retirement funds in South Africa, including both occupational funds (where membership is a condition of the terms of employment) and individual retirement annuity funds. There is double counting in this figure, however, as an individual may be a member of more than one fund. (Data from the 2015 Annual Report of the Registrar of Pension Funds, Financial Services Board).
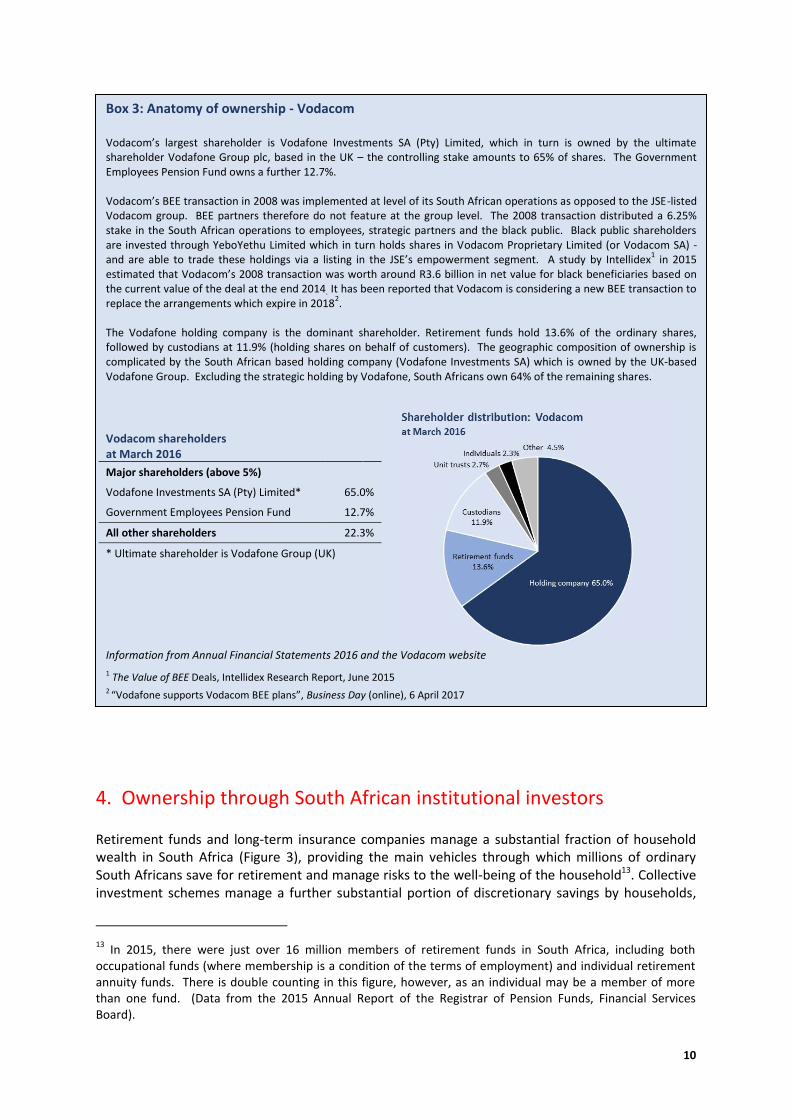
Box 3: Anatomy of ownership - Vodacom Vodacom’s largest shareholder is Vodafone Investments SA (Pty) Limited, which in turn is owned by the ultimate shareholder Vodafone Group plc, based in the UK – the controlling stake amounts to 65% of shares. The Government Employees Pension Fund owns a further 12.7%. Vodacom’s BEE transaction in 2008 was implemented at level of its South African operations as opposed to the JSE-listed Vodacom group. BEE partners therefore do not feature at the group level. The 2008 transaction distributed a 6.25% stake in the South African operations to employees, strategic partners and the black public. Black public shareholders are invested through YeboYethu Limited which in turn holds shares in Vodacom Proprietary Limited (or Vodacom SA) - and are able to trade these holdings via a listing in the JSE’s empowerment segment. A study by Intellidex
1 in 2015
estimated that Vodacom’s 2008 transaction was worth around R3.6 billion in net value for black beneficiaries based on the current value of the deal at the end 2014. It has been reported that Vodacom is considering a new BEE transaction to replace the arrangements which expire in 2018
2.
The Vodafone holding company is the dominant shareholder. Retirement funds hold 13.6% of the ordinary shares, followed by custodians at 11.9% (holding shares on behalf of customers). The geographic composition of ownership is complicated by the South African based holding company (Vodafone Investments SA) which is owned by the UK-based Vodafone Group. Excluding the strategic holding by Vodafone, South Africans own 64% of the remaining shares.
Vodacom shareholders at March 2016
Major shareholders (above 5%)
Vodafone Investments SA (Pty) Limited* 65.0%
Government Employees Pension Fund 12.7%
All other shareholders 22.3%
* Ultimate shareholder is Vodafone Group (UK)
Information from Annual Financial Statements 2016 and the Vodacom website
1 The Value of BEE Deals, Intellidex Research Report, June 2015 2 “Vodafone supports Vodacom BEE plans”, Business Day (online), 6 April 2017

11
providing accessible and regulated vehicles for pooling funds and increasing the diversification of assets. South Africa has a large investment management industry, capable of providing both standardised products such as collective investment schemes and bespoke services for wealthier individuals, institutional funds, corporates and trusts. Together, these institutions provide an important channel through which long-term domestic savings are directed to sectors of the economy that require capital, including private-sector companies, public corporations, and government. Institutional investors are also an important mechanism for the international investment of household savings. This offers benefits to households in terms of the diversification of risks and returns, while macro-prudential limits on the foreign assets held by institutional investors aim to place a ceiling on overall capital outflows from the economy. Institutional investors invest across various asset classes, including shares (equities), bonds and other debt securities, property and cash; both in South Africa and in international markets. They are a crucial component of the local equity market, providing capital to listed companies and a liquid market for the trading of shares and other financial instruments. Table 5 shows the total assets held by the different categories of institutional investors and the portion that is allocated to shares (equities) in JSE-listed companies. Crucially, these data limit the double counting of assets that takes place when one institution (such as a long-term insurance company or collective investment scheme company) manages assets on behalf of another institution (such as a retirement fund). The data shown in Table 5 are based on the underlying (originating) institution that receives funds from retail clients (including individuals, corporates and trusts), as opposed to the ultimate manager of the assets. Retirement funds are by far the largest group of institutional investors measured on this basis – reflecting the dominant role of retirement saving for households. Data are drawn from the asset allocation reports that institutional investors submit to the Financial Surveillance Department (FinSurv) of the South African Reserve Bank. These reports are the main tool for monitoring foreign exposures against the macro-prudential foreign asset limits. Institutional
12
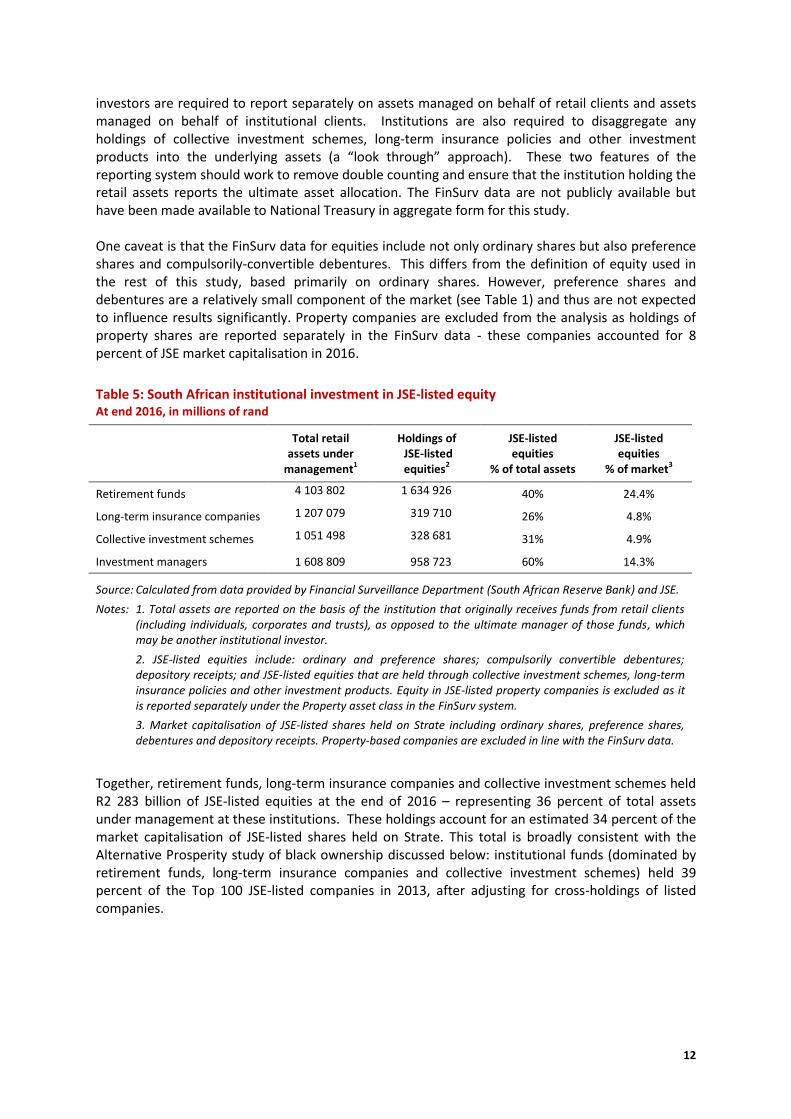
investors are required to report separately on assets managed on behalf of retail clients and assets managed on behalf of institutional clients. Institutions are also required to disaggregate any holdings of collective investment schemes, long-term insurance policies and other investment products into the underlying assets (a “look through” approach). These two features of the reporting system should work to remove double counting and ensure that the institution holding the retail assets reports the ultimate asset allocation. The FinSurv data are not publicly available but have been made available to National Treasury in aggregate form for this study. One caveat is that the FinSurv data for equities include not only ordinary shares but also preference shares and compulsorily-convertible debentures. This differs from the definition of equity used in the rest of this study, based primarily on ordinary shares. However, preference shares and debentures are a relatively small component of the market (see Table 1) and thus are not expected to influence results significantly. Property companies are excluded from the analysis as holdings of property shares are reported separately in the FinSurv data - these companies accounted for 8 percent of JSE market capitalisation in 2016.
Table 5: South African institutional investment in JSE-listed equity At end 2016, in millions of rand
Total retail assets under
management1
Holdings of JSE-listed equities2
JSE-listed equities
% of total assets
JSE-listed equities
% of market3
Retirement funds 4 103 802 1 634 926 40% 24.4%
Long-term insurance companies 1 207 079 319 710 26% 4.8%
Collective investment schemes 1 051 498 328 681 31% 4.9%
Investment managers 1 608 809 958 723 60% 14.3%
Source: Calculated from data provided by Financial Surveillance Department (South African Reserve Bank) and JSE.
Notes: 1. Total assets are reported on the basis of the institution that originally receives funds from retail clients (including individuals, corporates and trusts), as opposed to the ultimate manager of those funds, which may be another institutional investor.
2. JSE-listed equities include: ordinary and preference shares; compulsorily convertible debentures; depository receipts; and JSE-listed equities that are held through collective investment schemes, long-term insurance policies and other investment products. Equity in JSE-listed property companies is excluded as it is reported separately under the Property asset class in the FinSurv system.
3. Market capitalisation of JSE-listed shares held on Strate including ordinary shares, preference shares, debentures and depository receipts. Property-based companies are excluded in line with the FinSurv data.
Together, retirement funds, long-term insurance companies and collective investment schemes held R2 283 billion of JSE-listed equities at the end of 2016 – representing 36 percent of total assets under management at these institutions. These holdings account for an estimated 34 percent of the market capitalisation of JSE-listed shares held on Strate. This total is broadly consistent with the Alternative Prosperity study of black ownership discussed below: institutional funds (dominated by retirement funds, long-term insurance companies and collective investment schemes) held 39 percent of the Top 100 JSE-listed companies in 2013, after adjusting for cross-holdings of listed companies.

13
A further R959 billion of equities was reported in the FinSurv system by investment management companies14 – representing a further 14 percent of the market capitalisation of JSE-listed shares held on Strate. These holdings should reflect the equities that are managed (directly or indirectly) as part of investment portfolios on behalf of individuals, trusts and other retail investors. A further review of the coverage of the FinSurv data on investment managers is recommended in order to ascertain the nature of clients and any potential overlap with other categories of investors. Table 5 illustrates the important role of South African retirement funds in the local equity market. By far the largest fund is the Government Employees Pension Fund (GEPF), representing around 40 percent of the reported assets of retirement funds15. GEPF is the single largest investor in the local
14
Investment managers are required to register as institutional investors with the Financial Surveillance Department if they wish to use the foreign asset allowances. To qualify, an investment manager must be registered with the Financial Services Board as a discretionary manager or be registered with the JSE as a stockbroker with a discretionary mandate. (Information from Section B.2(H) of the Currency and Exchanges Manual, South African Reserve Bank) 15
Based on data reported in the 2015 Annual Report of the Registrar of Pension Funds, Financial Services Board.
Box 4: Anatomy of ownership - FirstRand FirstRand was the largest banking group by JSE market capitalisation at the end of 2016. The major shareholder is RMB Holdings Limited, also a JSE-listed company, holding 34.1% of shares. The Public Investment Corporation is the next largest shareholder at 9.5%, mainly reflecting funds managed on behalf of the Government Employees Pension Fund. FirstRand’s BEE partners directly held 4.2% of the company at June 2016. FirstRand implemented a major BEE transaction in 2005 transferring 10% of the company to a combination of BEE partners and employee trusts. A study by Intellidex
1 estimates that around R23 billion in net value was created for black beneficiaries.
Corporate ownership dominates as a result of the substantial stakes held by RMB Holdings and Remgro (38%). Institutional investors (domestic and foreign) form the next most important group, including unit trusts (20%) and pension funds (16%). Geographically, South Africans hold 70% of the company, with foreign investors accounting for 22% and the remaining 8% has unknown nationality.
FirstRand shareholders at June 2016
Major shareholders (above 5%)
RMB Holdings Limited 34.1%
Public Investment Corporation 9.5%
Other significant shareholders
BEE partners 4.2%
Financial Securities Ltd (Remgro) 3.9%
All other shareholders 48.3%
Information from Annual Financial Statements 2016 and the FirstRand website
1 The Value of BEE Deals, Intellidex Research Report, June 2015

14
equity market, either directly or through the Public Investment Corporation (PIC) – discussed further below in the context of major shareholders in South African companies.
The beneficiaries of retirement funds span a broad section of the population – including both wealthy South Africans with bespoke retirement plans and millions of workers and their dependents through the reach of occupational retirement funds. In this way, the benefits of share ownership – as a vehicle for wealth accumulation – are made available to millions of South Africans. However, it must also be acknowledged that the combination of high levels of unemployment and incomplete coverage of occupational funds means that a significant fraction of the population continue to be excluded from these benefits. Employment creation is an essential priority for increasing savings and wealth accumulation across the population in South Africa. Using the Quarterly Labour Force Survey, there were approximately 6.5 million members of occupational retirement funds in South Africa in the fourth quarter of 2016 – representing 47
Box 5: Anatomy of ownership - Sasol Sasol has two classes of shares listed on the JSE: Sasol ordinary shares (the main listing) and Sasol BEE ordinary shares which trade between BEE compliant persons. In addition, BEE ownership of Sasol ordinary shares is effected through the Sasol Inzalo Employee Trust, Sasol Inzalo Management Trust and Sasol Inzalo Foundation. BEE ownership is further facilitated by public holdings of Sasol Inzalo shares (Sasol Inzalo Public Limited), listed in the empowerment segment of the JSE. A study by Intellidex
1 in 2015 estimated that Sasol’s BEE transactions were worth around R6.4 billion in net
value for black beneficiaries based on values at the end of 2014. However a lower oil price and thus share price is now expected to mean that the Inzalo scheme will mature in 2018 with no shares distributed to BEE shareholders. Sasol have announced proposals for a new R21 billion BEE deal to replace the maturing Inzalo scheme
2.
Sasol’s two major shareholders are the Government Employees Pension Fund (12.9%) and the Industrial Development Corporation (8.2%). The Sasol Inzalo Employee Trust, Sasol Inzalo Management Trust and Sasol Inzalo Foundation directly hold 5.3% of the ordinary shares (see table). A further 2.9% is held by the black public through the Sasol Inzalo scheme (see chart). By type of shareholders, retirement funds and unit trusts (domestic and foreign) hold just over half of the ordinary shares. Shares backing American Depositary Receipts listed on the New York Stock Exchange account for 6.4% of the total; sovereign wealth funds hold a further 5.3%. South African ownership is between 60% and 70% of the company.
Sasol shareholders – Ordinary shares* at June 2016
Major shareholders (above 5%)
Government Employees Pension Fund 12.9%
Industrial Development Corporation 8.2%
Other shareholders - BEE
Sasol Inzalo Employees Trust 3.6%
Sasol Inzalo Management Trust 0.3%
Sasol Inzalo Foundation 1.5%
All other shareholders 73.5%
* A separate class of Sasol BEE shares is also listed on the JSE and trade between BEE compliant persons.
Information from Annual Financial Statements 2016 and the Sasol website
1 The Value of BEE Deals, Intellidex Research Report, June 2015
2 Sasol announces proposed new R21 billion B-BBEE ownership structure, Sasol Media Release, 20 September 2017

15
percent of all employees (Figure 4). Linking to the discussion of black ownership below, the African/Black population group accounted for an estimated 67 percent of these members; Coloureds and Indian/Asians represented at further 12 percent and 4 percent respectively; and White employees accounted for the remaining 17 percent (based on the standard population groups used in the Quarterly Labour Force Survey)16. For those employees not covered by occupational funds, 80 percent were in the African/Black population group – reflecting historical patterns of limited coverage amongst the very lowest paid.
5. Major shareholders in South African companies Most JSE-listed companies have one or more major shareholders that are expected to have an important influence in the company through the voting power attached to the shares. In this context, the Companies Act (2008) requires that listed companies disclose information on beneficial holdings of 5 percent or more of each class of shares issued by the company. The extent of holdings by major shareholders is a useful indicator of the concentration of ownership and influence in listed South African companies. Table 6 summarises the distribution of major shareholders, based on the disclosures made by the Top 25 South African companies listed on the JSE (all foreign-domiciled companies are excluded). The threshold used to define a “major shareholder” is 5 percent or more of the shares of the company, in line with the disclosure requirements of the Companies Act. The Top 25 companies accounted for two-thirds of the total market capitalisation of South African listed companies in 2016 and provide a reasonable estimate for patterns in the market as a whole.
16
Figure 4 shows the estimated numbers of employees in occupational retirement funds by population group. It does not indicate the share of the total value of retirement fund assets that are associated with each population group as this will be influenced by both salary levels and the length of employment across employees in these groups.

16
In aggregate, major shareholders hold an estimated 33 percent of the total market capitalisation of the Top 25 South African companies – indicating that a significant degree of influence is often held by one or more shareholders. The single largest major shareholder in JSE-listed companies is the Government Employees Pension Fund (including holdings through the Public Investment Corporation), accounting for around 11 percent of the market value of the Top 25 companies. These holdings are slightly exceeded in value by the combined major shareholdings of foreign companies – in most cases representing strategic foreign direct investments17. South African companies form the next largest category of major shareholder, including other listed companies (cross-holdings) and unlisted holding companies. Major shareholders in the form of South African BEE companies and trusts represent around 1 percent of the total market capitalisation of the Top 2518. However, this does not mean that BEE companies and trusts directly hold only 1 percent of JSE listed companies – smaller stakes that fall below the 5 percent threshold for major shareholders are not included in this estimate.
Table 6: Major shareholders1 by type: Top 25 South African companies
Estimated value
in R million2
% of Top 25 market capitalisation
Foreign companies, direct and indirectly via SA companies3 435 688 11%
GEPF and PIC4 429 166 11%
South African companies, excluding BEE companies 203 700 5%
South African institutional investors, excluding GEPF and PIC 49 188 1%
South African BEE companies and trusts5 44 719 1%
Private individuals 41 986 1%
Foreign institutional investors 37 656 1%
South African Government 27 903 1%
Total estimated value of major shareholdings 1 270 006 33%
Total market capitalisation of Top 25 companies 3 810 608
Source: Major shareholders information from Annual Reports, Annual Financial Statements and corporate websites. Market capitalisation provided by JSE.
Notes: 1. Major shareholders that own 5 percent or more of the shares of the company.
2. Estimated value based on market capitalisation at end 2016. Reporting dates vary across companies and the size of major shareholdings in any one company may differ over time. The estimate applies the most recent reported shareholdings to the market capitalisation of the company at the end of 2016.
3. Includes both direct shareholdings of foreign companies and indirect holdings through South African holding companies.
4. Government Employees Pension Fund and the Public Investment Corporation. The PIC primarily manages funds on behalf of the GEPF, as well as a smaller amount of other government funds.
5. Major shareholders identified as black-owned based on information on corporate websites.
17
For this analysis, holdings of foreign companies through local companies are included in the total for foreign owners – see Box 1.
18 BEE companies include all major shareholders that are identified as black owned, based on information
available on corporate websites.

17
6. Black ownership One of the key goals of Broad-Based Black Economic Empowerment is to increase black ownership of South African companies, as part of a transformation agenda to substantially expand participation in the economy by previously disadvantaged communities. Ownership is one of five elements of the generic B-BBEE scorecard for companies doing business in South Africa and is an important feature of the sector specific codes. In line with the B-BBEE approach, most JSE-listed companies have set up structures to transfer ownership of shares to black beneficiaries19, typically accompanied by financing mechanisms20.
19
In a 2015 study of the value generated by BEE transactions, Intellidex identify BEE schemes at 83 out of the Top 100 JSE-listed companies. (The Value of BEE Deals, Intellidex Research Report, June 2015)
Box 6: Anatomy of ownership - Anglo American Platinum
Anglo American Platinum’s largest shareholder is Anglo South Africa Capital Proprietary Limited, which in turn is owned by Anglo American plc – the controlling stake is 77.7% of the shares in Anglo American Platinum. No other shareholder holds in excess of 5% of shares. Anglo American Platinum’s major BEE transactions have been mainly at the level of specific mining operations, creating strategic stakes in operations for BEE groups. Significant BEE partners therefore do not feature as shareholders at the group level. An earlier BEE employee share scheme has now matured, while a current community economic empowerment scheme accounts for around 2% of shares. A study by Intellidex
1 in 2015 estimated that
Anglo American Platinum’s BEE transactions were worth around R10.7 billion in net value for black beneficiaries based on values at the end of 2014. The holding company (ultimately Anglo American plc) is the dominant shareholder. Banks, nominees and financial companies account for 8.8% of shares, followed by trusts and investment companies with 6.2% and retirement funds with 5.4%. The geographic composition of ownership is complicated by the South African based holding company (Anglo South Africa Capital) which is owned by UK-based Anglo American plc. Excluding this strategic holding by Anglo American, South Africans own 58% of the remaining shares.
Anglo American Platinum shareholders at December 2016
Major shareholders (above 5%)
Anglo South Africa Capital Pty Limited* 77.7%
All other shareholders 22.3%
* Ultimate shareholder is Anglo American (UK)
Information from Annual Report 2016 and Anglo American Platinum website
1 The Value of BEE Deals, Intellidex Research Report, June 2015

18
These have included schemes introducing new strategic investors in the company, schemes for the employees of the company, and schemes targeted at community groups. In some instances, ownership schemes have transferred shares in the listed company itself; in others, companies have established ownership schemes in their subsidiaries or at the level of specific operations. Over time, these schemes should contribute to the creation of new assets (wealth) held by previously disadvantaged South Africans, although this also requires sustainable financing. Recent research by Intellidex (a South African research company) has found that BEE ownership schemes implemented by the Top 100 JSE-listed companies generated R317 billion in net value for beneficiaries in the period between 2000 and 2014 (including both matured deals and the value of current (live) deals at the end of 2014 – the net value of current deals will vary with the share price of the company)21. The ownership of South African companies by standard population groups is not currently measured. An ongoing study by Alternative Prosperity on behalf of JSE estimates black ownership as a percentage of the value of the Top 100 JSE-listed companies, held through BEE schemes and also indirectly though participation in institutional funds. Alternative Prosperity and JSE have generously shared their findings for this study, summarised in Table 7. One difference between Alternative Prosperity’s data and the data presented above on foreign investors, institutional investors and major shareholders is the measure of market capitalisation of JSE-listed companies. Alternative Prosperity exclude cross-holdings, together with a small amount of Treasury shares (shares that are held by the company) and Government holdings. Cross-holdings
20
For example, the initial transfer of shares to the BEE structure is funded by a notional debt, repaid out of the dividend stream from the shares until the deal expires. The residual value of the shares (net of any remaining debt) on expiry represents the final value of the ownership stake created for black beneficiaries of the scheme.
21 The Value of BEE Deals, Intellidex Research Report, June 2015.
Box 7: Anatomy of ownership - Exxaro Exxaro is one of the largest predominately black-owned resources companies listed on the JSE. The black-empowerment company was created through a BEE transaction in 2006 involving Kumba Resources, Anglo American plc, Eyesizwe Mining and the Industrial Development Corporation. A new BEE vehicle (Main Street 333) was formed - in turn owned by various BEE partners - to hold a controlling stake of 52% in Exxaro. The BEE transaction to establish Exxaro matured in November 2016 and by the end of December 2016, the BEE partners held a reduced stake of 45.3% of the company through Main Street 333 (see table). In January 2017, the BEE shareholding fell further to 37.7% following a share repurchase to settle debt obligations, implemented as part of the unwinding of the BEE deal. In November 2016, Exxaro announced plans for a new BEE ownership structure to replace the matured deal. Under the transaction planned for 2017, the new BEE owner will hold a lower overall stake of 30% of the company.
Exxaro Shareholders at December 2016
Major shareholders (above 5%) In November 2016, Exxaro announced a new BEE
transaction to replace the maturing transaction with
Main Street 333.
Under the BEE transaction planned for 2017, the new
BEE shareholder will hold 30% of the company.
Main Street 333 – BEE partners 45.3%
Government Employees Pension Fund 5.9%
Other shareholders - BEE
Exxaro Employee Empowerment Share Trust 0.7%
All other shareholders 48.1%
Information from Annual Financial Statements 2016 and Exxaro website

19
occur when one listed company holds the shares of another listed company – and as a result the market value of the first company should reflect in part the market value of the second company. Alternative Prosperity’s measure of ownership thus focuses on the net value embedded in JSE-listed companies (i.e., net of cross-holdings). The measure of market calculation used elsewhere in this report includes all forms of ownership, including the concentration of corporate ownership that can occur through cross-holdings. BEE ownership22 The estimate of BEE ownership includes the following components:
Shareholdings associated with BEE schemes at the listed entity level, including strategic owners, employee share ownership schemes and other broad-based community ownership schemes.
BEE ownership achieved through transactions involving the sale of assets at the subsidiary level to black owners. This approach to measuring black ownership is consistent with the B-BBEE Codes, which allow ownership points on the scorecard to be achieved through sale of asset transactions, as well as ownership stakes in the listed entity itself.
Retail ownership by black people where identified – reportedly this is a small component. Alternative Prosperity estimate that BEE ownership on this basis was 10 percent of the value of the Top 100 listed companies in 2013 (Table 7). It is worth noting that this does not necessarily mean that fully 10 percent of the shares of listed companies are in the hands of black investors. For some listed companies, black ownership has been achieved by the transfer of stakes in their subsidiaries or the sale of assets, rather than at the level of the listed group. A narrow focus on the ownership of shares of listed entities would therefore disregard the extent to which black ownership has been facilitated through various forms of BEE schemes. For this reason, BEE transactions at the subsidiary level can be counted towards ownership under the B-BBBE Codes – and are also included by Alternative Prosperity in their estimates of black ownership. A further complication in assessing trends in black ownership arises from the structure of BEE transactions. BEE schemes typically have a period during which the beneficiaries are locked in, forming part of the financial structure for the transfer of ownership. Following maturity of the deal, beneficiaries may opt to sell their holdings, potentially leading to a dilution of black ownership over time. A declining share of black ownership of the company in this instance should not necessarily be considered a signal of failure in terms of transformation – as black beneficiaries are able to use the net wealth accumulated through the BEE process to diversify their assets and pursue new investments. This is reflected in the current B-BBEE Codes, which have allowed for the recognition of black ownership after the sale or loss of shares by black participants. The use of the principle of “once empowered, always empowered” has been the subject of debate in the development of amendments to the Codes.
22
Alternative Prosperity refer to this as “direct black ownership”. The term “BEE ownership” is used in this report to avoid any confusion with the concept of direct investment in the discussion of foreign ownership.

20
Table 7: Ownership of Top 100 JSE-listed companies in 2013 Results from the Alternative Prosperity study on behalf of JSE
Broad composition of ownership
Share of foreign investors 41%
Share of SA institutional funds - mostly reflecting retirement funds, collective investment schemes and long-term insurance companies
1
39%
Share of other investors 21%
Estimates of black ownership
BEE ownership2: BEE schemes at the listed company level, BEE
transactions at subsidiary level, and direct retail holdings 10%
Black ownership through institutional funds 13%
Source: Data provided by Alternative Prosperity from a study on behalf of JSE
Notes: 1. SA institutional funds include: retirement funds, collective investment schemes, long-term and short-term insurance companies, medical schemes, university endowments and banks. Retirement funds, collective investment schemes and long-term insurance companies represent over 90 percent of institutional funds investing in JSE-listed companies.
Alternative Prosperity use the term “mandated investments”, in line with the terminology of the B-BBEE Codes. The alternative term “institutional funds” is used here to be consistent with the discussion of institutional investors elsewhere in this report.
2. Alternative Prosperity refer to this concept as “direct black ownership”. The term “BEE ownership” is used in this report to avoid confusion with the concept of direct investment in the discussion of foreign ownership.
Black ownership through institutional funds23 Alternative Prosperity estimate that indirect black ownership through institutional funds amounted to 13% of the Top 100 JSE-listed companies in 2013 (Table 7). This estimate is based on an analysis of the vested rights of beneficiaries in retirement funds, life policies and collective investment schemes, using a sample drawn from the largest institutions investing in JSE-listed companies. The concept of vested rights would capture, for example, the value on resignation in a defined benefit retirement fund or the surrender value in an endowment policy with a long-term insurance company. The estimate of black ownership through institutional funds is not directly comparable with the estimate of institutional ownership of JSE-listed companies shown in Table 5. The vested rights of black versus non-black beneficiaries does not necessarily add up to the total holdings of South African institutional investors as shown in Table 5 for two main reasons. First, there will be some component of ownership through institutional funds where the population group of the fund member or policy holder cannot be identified. Second, assets held in excess of the vested rights of members or policy holders are deemed to be owned by the institutional investor. For these reasons, it should not be assumed that non-black beneficiaries own the difference between the total institutional ownership reported in Table 5 and the ownership by black beneficiaries reported in Table 7.
23
Alternative Prosperity use the term “mandated investments”, in line with the terminology of the B-BBEE Codes. The alternative term “institutional funds” is used here to be consistent with the discussion of institutional investors elsewhere in this report.

21
Progress towards B-BBEE ownership targets: a snapshot of major financial groups The measurement of ownership set out under the B-BBEE Codes of Good Practice is a complex assessment of the influence and economic interest of black owners in South African companies. The calculation of a company’s black ownership relative to the B-BBEE targets is subject to specific measurement rules as set out in the Codes that together imply that the measure of black ownership for B-BBEE purposes may look very different from the simple percentage of shares in a listed entity that are held by black owners. For example, the measurement of ownership for the purposes of the Codes can include the recognition of transactions involving the sale of assets, equity instruments or other business of a related business (as noted above). Recognition of ownership after the sale or loss of shares by black participants is also allowed (as also noted above). Any holdings by the state or public entities are excluded from the measurement of ownership. Companies can opt to either include or exclude mandated investments (institutional funds) from the measurement of ownership. Furthermore, an important component of the ownership scorecard is the measure of net value held by black participants, taking into account any acquisition debt owed. These complexities mean that it is not straightforward to estimate black ownership against the B-BBEE targets from publicly available data. An alternative approach is instead to examine the ownership scores achieved by companies relative to the B-BBEE targets as defined in the Codes. The following analysis focuses on ownership scores in the financial sector relative to the B-BBEE targets
Box 8: Anatomy of ownership - Sanlam Sanlam is the second largest non-bank financial services group listed on the JSE. Sanlam’s single largest shareholder is the BEE partner Ubuntu-Botho Investments (Pty) Ltd, holding 13.5% of shares. The Government Employees Pension Fund owns a further 12.2%. Sanlam’s major BEE transaction was implemented in 2004 and initially transferred an 8% shareholding to the Ubuntu-Botho consortium. By the time the deal matured, the equity stake had increased to 14%. A study by Intellidex
1
estimates that the deal created a net value of around R14.4 billion for black beneficiaries. By broad category, individuals collectively hold 12.4% of Sanlam’s shares; in part this will be a legacy of the original distribution of shares to policyholders when the company demutualised in 1998. South African institutions and other investors are the largest category with 49.1% percent of shares (including both major shareholders). Offshore institutions and other investors hold 38.1%.
Sanlam shareholders at December 2016
Major shareholders (above 5%)
Ubuntu-Botho Investments (Pty) Ltd 13.5%
Government Employees Pension Fund 12.2%
All other shareholders 74.3%
Information from Annual Report 2016 and the Sanlam website
1 The Value of BEE Deals, Intellidex Research Report, June 2015

22
set out in the Financial Sector Code published in November 201224. An Amended Financial Sector Code is currently under development. For this exercise, “financial companies” are defined as all listed companies classified as banks, life insurance, non-life insurance or financial services25. The Top 20 financial companies by total market capitalisation (at end 2016) were examined – representing 97% of the total market capitalisation of all listed financial companies. Company websites were searched to identify the most recent B-BBEE certificates for the Top 20 financial companies26. Certificate dates vary across the companies, covering either 2016 or 2017. The published certificates were supplemented with B-BBEE scorecard data provided to National Treasury by the four major banking groups. In total, B-BBEE data are available for 15 of the Top 20 financial companies27. In three cases BEE certificates were not available from the company website and in two cases the relevant BEE certificate is for a related company that is also in the Top 20. The ownership score reported on the B-BBEE certificate consists of several indicators, each with a number of points available linked to the B-BBEE target for that indicator. The ownership scorecard is shown in Box 2. Figure 8 shows the weighted average ownership score across the 15 major financial companies – the average is calculated by weighting the score for each company by the total market capitalisation of the company. The weighted average is shown together with the remaining distance
24
This analysis can be extended to other sectors subject to the availability of B-BBEE certificates.
25 Based on the Industry Classification Benchmark sector classification, as used by the JSE.
26 South African and foreign-domiciled financial companies are included. For foreign-domiciled companies, the
B-BBEE certificate covers the South African operations of the group.
27 The 15 companies represent 82% of the market capitalisation of all listed financial companies.
Box 9: Financial Sector Code (2012) - Ownership Scorecard
Points Target
1. Voting rights of black people 3 25% + 1 Vote
2. Voting rights of black women 1 10% + 1 Vote
3. Economic interest of black people 3 25% + 1 Share
4. Economic interest of black women 1 10% + 1 Share
5. Economic interest of black designated groups, black participants in employee share ownership schemes, black participants in broad based ownership schemes and/or black participants in co-ops
1 2.5%
Ownership fulfilment
6. Net equity value 3 By formula
7. Direct or indirect ownership in excess of 15% 2 10%
Total 14
Bonus points
8. Ownership by new black entrants 2 10%
9. Ownership by ESOPS and co-ops 1 10%
Total including bonus points 17

23
to the total points available on the ownership scorecard (including bonus points). This provides an illustration of progress in reaching the ownership targets set for the financial sector. In order to place progress on transformation of ownership in context, Figure 8 also shows progress on other elements of the B-BBEE scorecard for the financial sector, covering management control, employment equity, skills development, preferential procurement, empowerment financing, enterprise development, socio-economic development and access to financial services. Figure 5 shows that South Africa’s major financial institutions have made progress towards achieving black ownership but have not yet fully reached the targets set out in the Financial Sector Code (2012). On a weighted average basis, the 15 major companies covered in this analysis have achieved a score of 15.3 out of the 17 points (including bonus points) available for ownership on the B-BBEE scorecard. More broadly, while some of the largest financial companies have either achieved or are close to achieving a number of the targets set in the Financial Sector Code, there are areas where transformation is substantially lagging. In particular, management control and employment equity are areas where major financial companies are clearly struggling to reach transformation goals.

24
7. Ownership Monitor Table 8 brings together the estimates of ownership from the preceding sections into an Ownership Monitor – a tool for summarising and assessing the composition of ownership of JSE-listed companies. The table presents the most recent estimates available for each component, but as new data become available, annual indicators can be constructed to enable comparison over time. The table consists of three sections. Section 1 sets out the broad composition of ownership of JSE-listed companies across foreign investors, South African institutional investors and other South
Box 10: Anatomy of ownership - Nedbank and Old Mutual Nedbank’s largest shareholder is the Old Mutual Life Assurance Company (and associates), in turn owned by the ultimate shareholder Old Mutual plc, based in the UK. The controlling stake amounts to 54.2% of shares. The next largest shareholder, the Government Employees Pension Fund, holds a further 6.0% (see table). The Old Mutual holding company is the dominant shareholder in Nedbank. Banks and brokers hold 16.4% of shares, followed by retirement funds with 10.9% and mutual funds with 9.6% (see chart). Empowerment shareholders account for 2.1% of the shares. Excluding the strategic holding by Old Mutual, South Africans own 57% of the remaining shares. Nedbank launched a major BEE transaction in 2005, the Eyethu Share Scheme, which initially created a 9% stake in the Nedbank Group for black beneficiaries, including black business partners, employees, non-executive directors, clients and community interest groups. The Scheme had fully matured by 2015. A study by Intellidex
1 in 2015 estimated that
around R5.5 billion in net value was created for black beneficiaries. The ownership structure of Nedbank will change significantly in the near future. In 2016, Old Mutual plc announced plans for a managed separation of the Group’s four main business areas: Old Mutual Emerging Markets (SA), Nedbank (SA), Old Mutual Wealth (UK) and Old Mutual Asset Management (US). The intention is that a strategic relationship will be maintained between Nedbank and Old Mutual Emerging Markets but that Old Mutual will reduce its stake to a minority position. It is envisaged that the remaining shareholding in Nedbank will be distributed widely to Old Mutual shareholders – and that there will not be any new strategic investors. Following the managed separation, Old Mutual Emerging Markets will be an independent company with a primary stock exchange listing in South Africa.
Nedbank shareholders at December 2016
Major shareholders (above 5%)
Old Mutual Life Assurance Company (SA) and associates*
54.2%
Government Employees Pension Fund 6.0%
All other shareholders 39.8%
* Ultimate shareholder is Old Mutual plc (UK)
Information from Annual Financial Statements 2016 and Nedbank and Old Mutual websites
1 The Value of BEE Deals, Intellidex Research Report, June 2015

25
African investors. Section 2 presents estimates of the composition of major shareholders in South African listed companies, based on disclosed holdings of 5 percent or more of shares in the Top 25 South African companies. Section 3 summarises measures of black ownership relative to the value of JSE-listed companies and measures progress towards B-BBEE targets for the major financial companies listed on the JSE. Notes to the table provide definitions and information on the sources of data and are an important aid for interpreting the Ownership Monitor. This monitor will assist debates on economic transformation through providing a broader overview of the composition of ownership, building on important work elsewhere on measuring black ownership and on measuring the wealth generated by BEE schemes for black beneficiaries. The growth of black ownership of South African companies is an important feature of Government’s transformation goals – in line with the vision set out in the National Development Plan. The Ownership Monitor illustrates progress on this objective together with the continued role that foreign ownership and institutional ownership will have in delivering stronger economic growth - as a pre-requisite for genuine and sustainable economic transformation. The Monitor thus provides an overarching view of progress towards building a more diverse profile of corporate ownership in South Africa, supported by a vibrant and inclusive equity market and effective allocation of capital towards growth-enhancing investment.

26
Table 8: Ownership Monitor: JSE-listed companies
Note 1. Broad composition of ownership % of JSE market
capitalisation
1.1 Foreign investors 38%
1.2 Ownership through South African institutional investors, of which:
1.3 Retirement funds 24%
1.4 Long-term insurance companies 5%
1.5 Collective investment scheme companies 5%
1.6 Investment managers 14%
1.7 South African: Other investors 14%
1.8 Additional item: Cross-holdings of JSE-listed companies 9%
Reference date: December 2016
Coverage: South African and foreign-domiciled companies listed on the JSE. JSE market capitalisation is the value of dematerialised shares held on Strate.
Holdings by South African institutional investors are reported on a look-through basis, excluding the double counting of assets that occurs when one institution manages assets on behalf of another institution (see notes).
Note 2. Major shareholders, holding 5 percent or more of a company’s shares % of JSE market
capitalisation
2.1 All major shareholders, of which: 33%
2.2 Foreign companies, direct and indirectly via SA companies 11%
2.3 GEPF and PIC 11%
2.4 South African companies, excluding BEE companies 5%
2.5 South African institutional investors, excluding GEPF and PIC 1%
2.6 South African BEE companies and trusts 1%
2.7 Private individuals 1%
2.8 Foreign institutional investors 1%
2.9 South African Government 1%
Reference date: 2016 (reporting dates vary across companies)
Coverage: South African companies only, i.e., excluding foreign-domiciled companies listed on the JSE. Estimates are based on the major shareholders as disclosed by the Top 25 listed companies. The Top 25 companies represent around two-thirds of total market capitalisation of South African companies. In this section, JSE market capitalisation is the total market capitalisation, including a small amount of shares that are not dematerialised on Strate.

27
Table 8: Ownership Monitor: JSE-listed companies (cont.)
Note 3. Black ownership based on B-BBEE Codes % of JSE market
capitalisation
3.1 BEE ownership (Alternative Prosperity) 10%
3.2 BEE ownership (Adjusted: Ownership Monitor) 9%
3.3 Black ownership through institutional funds (Alternative Prosperity) 13%
3.4 Black ownership through institutional funds (Adjusted: Ownership Monitor) 11%
Reference date: 2013
Coverage: The Top 100 South African and foreign-domiciled companies listed on the JSE. JSE market capitalisation is the value of dematerialised shares held on Strate. Alternative Prosperity exclude cross-holdings, Treasury shares and Government holdings from market capitalisation. The “Adjusted: Ownership Monitor” rows add back these components (mainly cross-holdings) to be consistent with measures of market capitalisation in Sections 1 and 2.
BEE ownership includes: BEE ownership of the listed company itself, BEE ownership achieved through transactions at subsidiary level, and direct black retail holdings. The percentage reflects ownership as measured according to the B-BBEE Codes, as opposed to a narrow measure of BEE ownership of the listed entity itself.
Black ownership through institutional funds measures the ownership of the Top 100 through the vested rights of black beneficiaries in institutional funds, in particular retirement funds. The vested rights basis is not necessarily equivalent to the holdings of institutional investors set out in Section 1 (see notes).
3.5 B-BBEE scores for major financial companies: Weighted average score
Ownership 15.3 out of 17 points
Management control 6.1 out of 9 points
Employment equity 10.8 out of 18 points
Skills development 9.2 out of 10 points
Preferential procurement 15.7 out of 16 points
Empowerment financing 14.7 out of 15 points
Enterprise development 4.6 out of 5 points
Socio-economic development 2.9 out of 3 points
Access to financial services 11.8 out of 14 points
Reference date: 2016 or 2017 (reporting dates vary across companies)
Coverage: JSE-listed financial companies classified as banks, life insurance, non-life insurance and financial services according to the ICB sector classification. Data cover 15 out of the Top 20 financial companies by total market capitalisation, for which B-BBEE certificates are available from company websites. The 15 companies represent 82% of the total market capitalisation of all JSE-listed financial companies. Scores for each element of the scorecard are weighted by the total market capitalisation of the listed company. Total points available include bonus points on the B-BBEE scorecard.
28
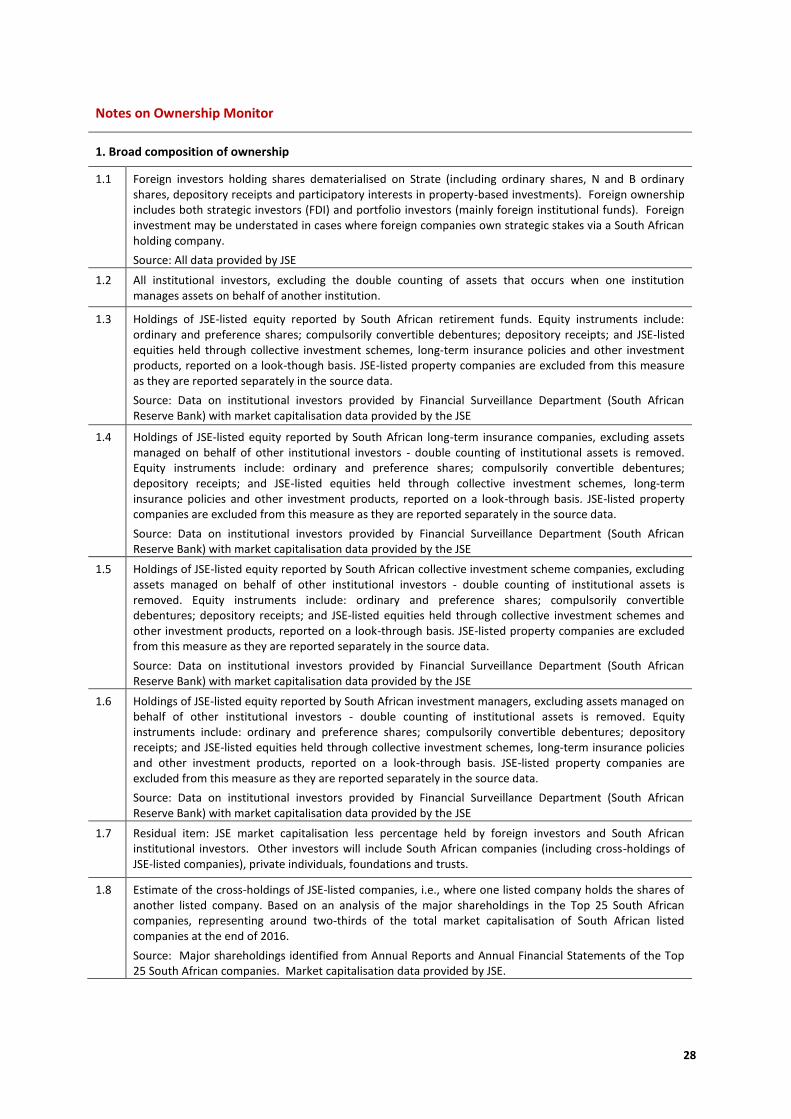
Notes on Ownership Monitor
1. Broad composition of ownership
1.1 Foreign investors holding shares dematerialised on Strate (including ordinary shares, N and B ordinary shares, depository receipts and participatory interests in property-based investments). Foreign ownership includes both strategic investors (FDI) and portfolio investors (mainly foreign institutional funds). Foreign investment may be understated in cases where foreign companies own strategic stakes via a South African holding company.
Source: All data provided by JSE
1.2 All institutional investors, excluding the double counting of assets that occurs when one institution manages assets on behalf of another institution.
1.3 Holdings of JSE-listed equity reported by South African retirement funds. Equity instruments include: ordinary and preference shares; compulsorily convertible debentures; depository receipts; and JSE-listed equities held through collective investment schemes, long-term insurance policies and other investment products, reported on a look-though basis. JSE-listed property companies are excluded from this measure as they are reported separately in the source data.
Source: Data on institutional investors provided by Financial Surveillance Department (South African Reserve Bank) with market capitalisation data provided by the JSE
1.4 Holdings of JSE-listed equity reported by South African long-term insurance companies, excluding assets managed on behalf of other institutional investors - double counting of institutional assets is removed. Equity instruments include: ordinary and preference shares; compulsorily convertible debentures; depository receipts; and JSE-listed equities held through collective investment schemes, long-term insurance policies and other investment products, reported on a look-through basis. JSE-listed property companies are excluded from this measure as they are reported separately in the source data.
Source: Data on institutional investors provided by Financial Surveillance Department (South African Reserve Bank) with market capitalisation data provided by the JSE
1.5 Holdings of JSE-listed equity reported by South African collective investment scheme companies, excluding assets managed on behalf of other institutional investors - double counting of institutional assets is removed. Equity instruments include: ordinary and preference shares; compulsorily convertible debentures; depository receipts; and JSE-listed equities held through collective investment schemes and other investment products, reported on a look-through basis. JSE-listed property companies are excluded from this measure as they are reported separately in the source data.
Source: Data on institutional investors provided by Financial Surveillance Department (South African Reserve Bank) with market capitalisation data provided by the JSE
1.6 Holdings of JSE-listed equity reported by South African investment managers, excluding assets managed on behalf of other institutional investors - double counting of institutional assets is removed. Equity instruments include: ordinary and preference shares; compulsorily convertible debentures; depository receipts; and JSE-listed equities held through collective investment schemes, long-term insurance policies and other investment products, reported on a look-through basis. JSE-listed property companies are excluded from this measure as they are reported separately in the source data.
Source: Data on institutional investors provided by Financial Surveillance Department (South African Reserve Bank) with market capitalisation data provided by the JSE
1.7 Residual item: JSE market capitalisation less percentage held by foreign investors and South African institutional investors. Other investors will include South African companies (including cross-holdings of JSE-listed companies), private individuals, foundations and trusts.
1.8 Estimate of the cross-holdings of JSE-listed companies, i.e., where one listed company holds the shares of another listed company. Based on an analysis of the major shareholdings in the Top 25 South African companies, representing around two-thirds of the total market capitalisation of South African listed companies at the end of 2016.
Source: Major shareholdings identified from Annual Reports and Annual Financial Statements of the Top 25 South African companies. Market capitalisation data provided by JSE.
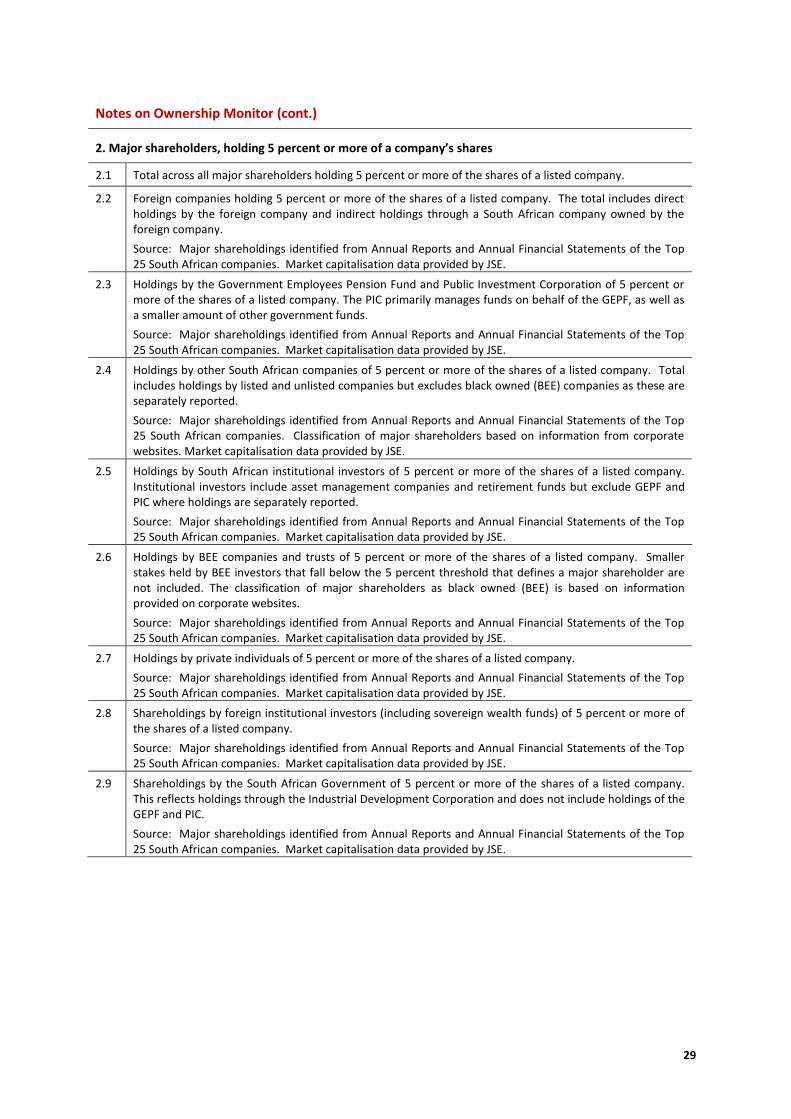
29
Notes on Ownership Monitor (cont.)
2. Major shareholders, holding 5 percent or more of a company’s shares
2.1 Total across all major shareholders holding 5 percent or more of the shares of a listed company.
2.2 Foreign companies holding 5 percent or more of the shares of a listed company. The total includes direct holdings by the foreign company and indirect holdings through a South African company owned by the foreign company.
Source: Major shareholdings identified from Annual Reports and Annual Financial Statements of the Top 25 South African companies. Market capitalisation data provided by JSE.
2.3 Holdings by the Government Employees Pension Fund and Public Investment Corporation of 5 percent or more of the shares of a listed company. The PIC primarily manages funds on behalf of the GEPF, as well as a smaller amount of other government funds.
Source: Major shareholdings identified from Annual Reports and Annual Financial Statements of the Top 25 South African companies. Market capitalisation data provided by JSE.
2.4 Holdings by other South African companies of 5 percent or more of the shares of a listed company. Total includes holdings by listed and unlisted companies but excludes black owned (BEE) companies as these are separately reported.
Source: Major shareholdings identified from Annual Reports and Annual Financial Statements of the Top 25 South African companies. Classification of major shareholders based on information from corporate websites. Market capitalisation data provided by JSE.
2.5 Holdings by South African institutional investors of 5 percent or more of the shares of a listed company. Institutional investors include asset management companies and retirement funds but exclude GEPF and PIC where holdings are separately reported.
Source: Major shareholdings identified from Annual Reports and Annual Financial Statements of the Top 25 South African companies. Market capitalisation data provided by JSE.
2.6 Holdings by BEE companies and trusts of 5 percent or more of the shares of a listed company. Smaller stakes held by BEE investors that fall below the 5 percent threshold that defines a major shareholder are not included. The classification of major shareholders as black owned (BEE) is based on information provided on corporate websites.
Source: Major shareholdings identified from Annual Reports and Annual Financial Statements of the Top 25 South African companies. Market capitalisation data provided by JSE.
2.7 Holdings by private individuals of 5 percent or more of the shares of a listed company.
Source: Major shareholdings identified from Annual Reports and Annual Financial Statements of the Top 25 South African companies. Market capitalisation data provided by JSE.
2.8 Shareholdings by foreign institutional investors (including sovereign wealth funds) of 5 percent or more of the shares of a listed company.
Source: Major shareholdings identified from Annual Reports and Annual Financial Statements of the Top 25 South African companies. Market capitalisation data provided by JSE.
2.9 Shareholdings by the South African Government of 5 percent or more of the shares of a listed company. This reflects holdings through the Industrial Development Corporation and does not include holdings of the GEPF and PIC.
Source: Major shareholdings identified from Annual Reports and Annual Financial Statements of the Top 25 South African companies. Market capitalisation data provided by JSE.

30
Notes on Ownership Monitor (cont.)
3. Black ownership based on B-BBEE Codes
3.1 BEE ownership (or direct black ownership) as measured by Alternative Prosperity on behalf of JSE. The estimate includes BEE ownership of the listed company itself, BEE ownership achieved through transactions at subsidiary level, and direct black retail holdings. The percentage reflects ownership as measured according to the B-BBEE Codes, as opposed to a narrow measure of BEE ownership of the listed entity itself.
Source: Data provided by Alternative Prosperity
3.2 BEE ownership with adjusted market capitalisation. Alternative Prosperity exclude cross-holdings, Treasury shares and Government holdings from market capitalisation. The “Adjusted: Ownership Monitor” figures add back these components (mainly cross-holdings) to be consistent with measures of market capitalisation in Sections 1 and 2 of the Ownership Monitor. The difference between the two approaches is not expected to be substantial.
Source: Data provided by Alternative Prosperity
3.3 Black ownership through institutional funds (mandated investments) as measured by Alternative Prosperity on behalf of the JSE. The estimate captures the vested rights of black beneficiaries in institutional funds, in particular retirement funds.
The vested rights of black versus non-black beneficiaries will not necessarily add up to the total holdings of South African institutional investors set out in Section 1 for two main reasons. First, there will be some component of indirect ownership where the population group of the fund member or policy holder cannot be identified. Second, assets held in excess of the vested rights of members or policy holders are deemed to be owned by the institutional investor. It should not be assumed that non-black beneficiaries own the difference between the total institutional ownership reported in Section 1 and the ownership by black beneficiaries reported in Section 3.
Source: Data provided by Alternative Prosperity
3.4 Black ownership though institutional funds with adjusted market capitalisation. Alternative Prosperity exclude cross-holdings, Treasury shares and Government holdings from market capitalisation. The “Adjusted: Ownership Monitor” figures add back these components (mainly cross-holdings) to be consistent with measures of market capitalisation in Sections 1 and 2 of the Ownership Monitor. The difference between the two approaches is not expected to be substantial.
Source: Data provided by Alternative Prosperity
3.5 B-BBEE scores for major financial companies listed on the JSE based on the B-BBEE scorecard set out in the Financial Sector Code (2012). The analysis includes companies classified as banks, life insurance, non-life insurance and financial services according to the ICB sector classification. Data cover 15 out of the Top 20 financial companies by total market capitalisation, based on B-BBEE certificates from company websites or otherwise B-BBEE scorecard data provided to National Treasury. The B-BBEE score for each company is weighted by the total market capitalisation of the JSE-listed company to provide a weighted average score for each element of the scorecard. Total points include the bonus points available under the ownership, management control and employment equity elements. Companies that are exempt from the empowerment financing element are excluded from the average scores for empowerment financing and enterprise development as this is scored on a different basis. Companies that are exempt from the full access to financial services element are excluded from the average score for this element.
Source: B-BBEE certificates from company websites and B-BBEE scorecard data provided to National Treasury by major banking groups.