owners manual hf online data acquisition system
TRANSCRIPT

Owners Manual
HF Online Data Acquisition System
3170 Metro Parkway
Fort Myers, FL 33916-7597 Phone: 239-337-2116 Fax: 239-332-7643
Email: [email protected]
Catalog No. 22838 (8/02) Rev 2.3

Ref 22838 (8/02) Rev 2.3 ii
Table of Contents
1.0 System Set Up ..............................................................................................1 1.1 Minimum Hardware Requirements for Lookout ............................1 1.2 Testing TCP/IP.................................................................................1
2.0 Software Installation ...................................................................................2 2.1 Installing National Instruments Lookout ........................................2 2.2 Installing the HF Online Files..........................................................3 2.3 Setup Lookout for HF Online .......................................................3
2.3.1 System Options ...................................................................3 2.3.2 Startup .................................................................................4 2.3.3 Serial Port ...........................................................................6 2.3.4 Security Set Up and User Accounts (optional) ...................7
2.4 Setting Up ODBC ..........................................................................9 2.5 Lookout Registration and Licensing ............................................14
3.0 Data Acquisition .......................................................................................15 3.1 Overview .......................................................................................15 3.2 Summary Panel .............................................................................15 3.3 Faceplate Panel .............................................................................17 3.4 HyperTrend ...................................................................................18 3.5 Edit Device Dialog Box ................................................................19 3.6 System Panel .................................................................................21
4.0 Report Generation .....................................................................................23 4.1 Overview .......................................................................................23 4.2 Report Configuration Panel ..........................................................23 4.3 Printouts ........................................................................................24
4.3.1 Time Range and Interval ...................................................24 4.3.2 Database Source ................................................................25 4.3.3 Execute Query ...................................................................25 4.3.4 Page 1 Panel ......................................................................26 4.3.5 Page 2 Panel ......................................................................26
4.4 Database/Spreadsheet ...................................................................27 4.4.1 CSV File Logging .............................................................27 4.4.2 Converting CSV Files to ACCESS Database Files ..........28
5.0 Appendix ...................................................................................................29
Ref 22838 (8/02) Rev 2.3 1
1.0 System Set Up The data acquisition system is based on the Lookout HMI/SCADA (Human Machine Interface / Supervisory Control And Data Acquisition) system manufactured by National Instruments, Austin, Texas. Lookout is a PC based software that operates on Windows 9x / NT/2000/Me/XP operating systems. 1.1 Minimum Hardware Requirements for Lookout The following are the minimum computer requirements Pentium Class PC running at 90 MHz. • 32 MB RAM (recommend 64 MB) • 200 MB free hard disk space. • Windows 98/95, Windows 2000, Widows XP or Windows NT version 4.0
with the latest service pack. • Network card and TCP/IP networking installed on PCs to be connected
(this is required only if the SCADA system is to operate on a multi-node network of PCs).
Note: The above are the minimum requirements of Lookout. It is always better to have as fast a computer and as large a hard drive and RAM capacity as possible. Because the SCADA application is to run 24 hours a day, the computers should have some form of AC power surge protection. A suitably sized uninterruptible power supply (UPS) provides the ultimate protection. 1.2 Testing TCP/IP The Lookout application for the turbidity data acquisition has been developed such that it can be installed and operated on a multi-node network. It can, however, be installed and operated from a single PC node. The TCP/IP set up is required only for networked operation. The network must be properly set up with the TCP/IP protocols installed. It must be possible to ping any computer on the network. Please note that Lookout currently does not support Novell networking. Please disregard this section if the data acquisition operation is to be done only from a single computer.

Ref 22838 (8/02) Rev 2.3 2
2.0 Software Installation There are four steps to installing HF Online. These steps are: • Installing National Instruments Lookout • Installing HF Online Files • Setup Lookout for HF Online • Setup Windows ODBC Data Source Administrator 2.1 Installing National Instruments Lookout Before installing, make sure that all other applications that may be currently using ODBC are shut down. Such applications include spreadsheets, word processors and database programs. Prior to installation of the software, it would be helpful if you have already registered the license for Lookout software. Refer to section 1, Registering Lookout, in the Lookout Operators Manual. This registration can be done by mail, fax or over the Internet. If you are not registered, the software can be installed and will run for 30 days without the Keycode. The Keycode will be requested each time the software is started and as such can be entered at any time. Insert the National Instruments Lookout CD into the CD drive. Select Install Lookout. The Lookout CD-ROM has autorun capability. If for some reason the autorun fails to start the CD installation routine, click on the Start icon in the taskbar and select Run. Enter N:\ Lookout\Setup.exe where N represents the CD ROM drive letter. Then select OK. Install Lookout following the screen prompts. If there is enough free room on your hard drive (100MB), do a complete installation. If the SCADA system is being installed on a Windows NT platform, select the option to install the NT keyboard driver. Follow the remaining instructions to complete the Lookout installation. It will be necessary to re-boot the computer after the installation is complete. Repeat all of the above steps for all PC’s on which Lookout is to be installed (this step is valid only for networked operation).

Ref 22838 (8/02) Rev 2.3 3
2.2 Installing the HF Online Files This is the actual program that runs on the Lookout platform. These files are included on a separate CD labeled HF Online Software. Create a new folder named HF Scientific Files under the National Instruments directory. Copy the 13 files from the CD under the folder HF scientific files to this new folder.
Highlight all the files in the HF Scientific Files folder and right click. Go to Properties. Uncheck the box for Read Only.
Create a new folder called HFScientific under National Instruments\Lookout\Graphics. Copy the file called Logo.bmp from the HF Program Files folder to this new folder.
It is helpful, but not required to create a short cut from C:\Program Files\National Instruments\Lookout on the desktop make it easier to launch the program. If this is done, it should be named HF Online.
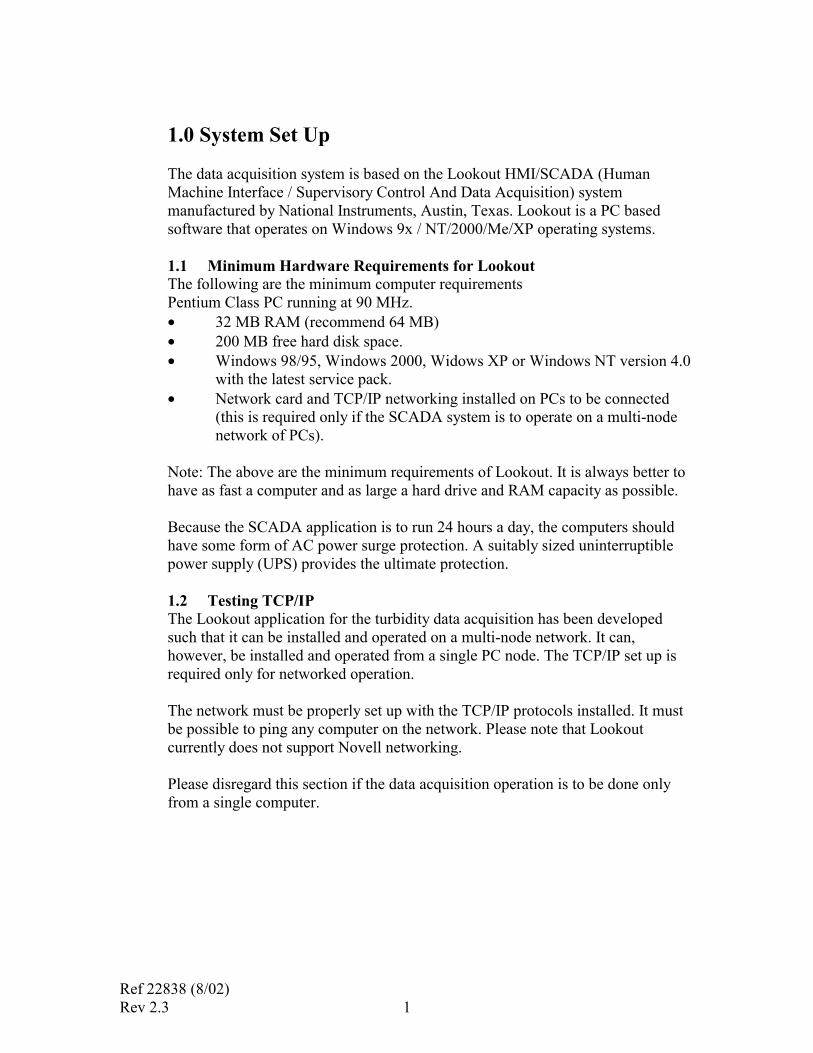
2.3 Setup Lookout for HF Online It is now necessary to setup the Lookout platform to operate HF Online correctly. Launch Lookout from the Start>>Program Files… or the desktop shortcut. 2.3.1 System Options From the pull down menus select Options >> System from the menu bar. In the System Options dialog box that appears enter the following information: In the security levels box, enter 2 in the seven right hand boxes. Refer to Fig. 2-1. Uncheck (if checked) the Left Mouse Click, Right Mouse Click and the Show panel navigation arrows in status bar options. The Computer Name field and the Citadel Database information are automatically filled in by Lookout it is recommended that these names not be modified.
Ref 22838 (8/02) Rev 2.3 4
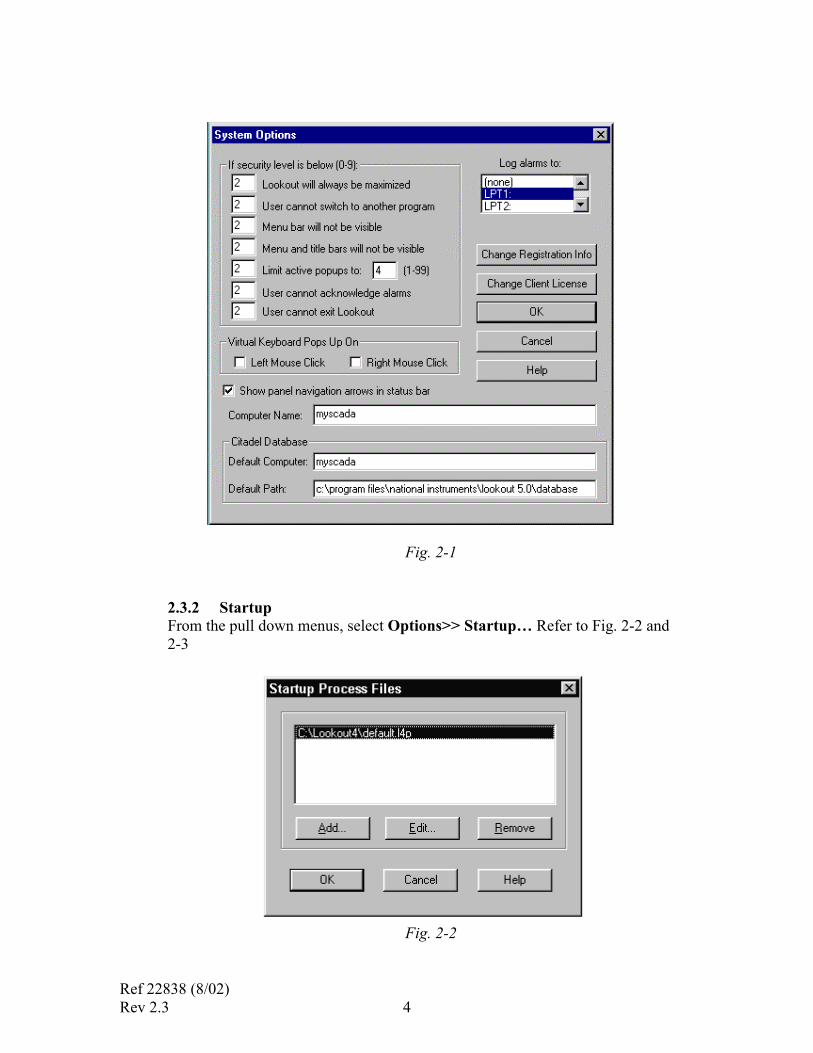
Fig. 2-1 2.3.2 Startup From the pull down menus, select Options>> Startup… Refer to Fig. 2-2 and 2-3
Fig. 2-2
Ref 22838 (8/02) Rev 2.3 5
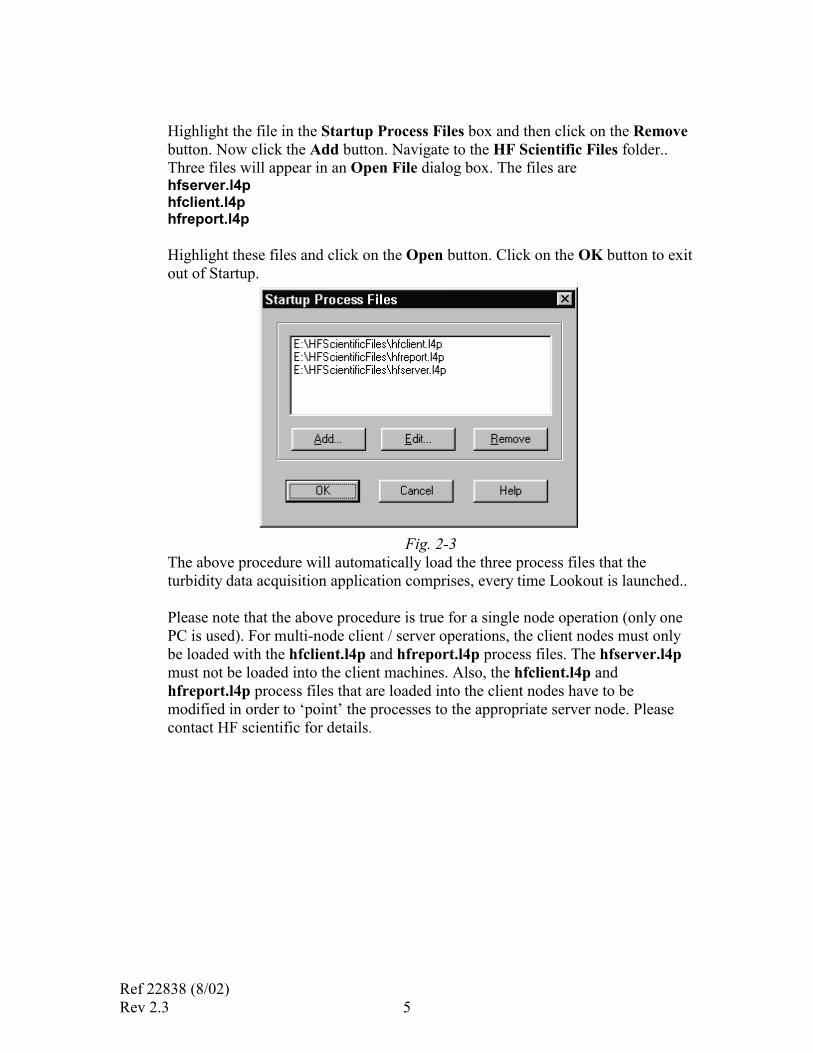
Highlight the file in the Startup Process Files box and then click on the Remove button. Now click the Add button. Navigate to the HF Scientific Files folder.. Three files will appear in an Open File dialog box. The files are hfserver.l4p hfclient.l4p hfreport.l4p Highlight these files and click on the Open button. Click on the OK button to exit out of Startup.
Fig. 2-3
The above procedure will automatically load the three process files that the turbidity data acquisition application comprises, every time Lookout is launched..
Please note that the above procedure is true for a single node operation (only one PC is used). For multi-node client / server operations, the client nodes must only be loaded with the hfclient.l4p and hfreport.l4p process files. The hfserver.l4p must not be loaded into the client machines. Also, the hfclient.l4p and hfreport.l4p process files that are loaded into the client nodes have to be modified in order to ‘point’ the processes to the appropriate server node. Please contact HF scientific for details.
Ref 22838 (8/02) Rev 2.3 6
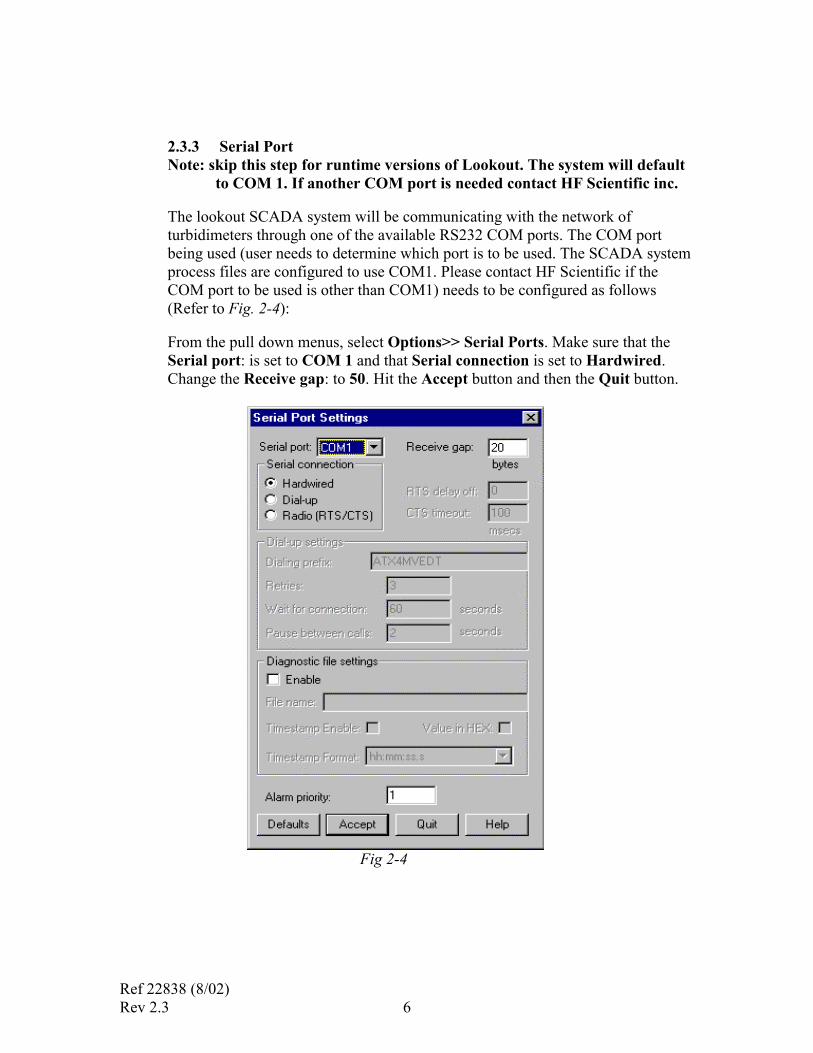
2.3.3 Serial Port Note: skip this step for runtime versions of Lookout. The system will default
to COM 1. If another COM port is needed contact HF Scientific inc. The lookout SCADA system will be communicating with the network of turbidimeters through one of the available RS232 COM ports. The COM port being used (user needs to determine which port is to be used. The SCADA system process files are configured to use COM1. Please contact HF Scientific if the COM port to be used is other than COM1) needs to be configured as follows (Refer to Fig. 2-4): From the pull down menus, select Options>> Serial Ports. Make sure that the Serial port: is set to COM 1 and that Serial connection is set to Hardwired. Change the Receive gap: to 50. Hit the Accept button and then the Quit button.
Fig 2-4

Ref 22838 (8/02) Rev 2.3 7
2.3.4 Security Set Up and User Accounts (optional) The Lookout HMI/SCADA system is capable of up to ten levels of security. The turbidity data SCADA system is configured with the following security levels:
Security Level Description 0 No access. 1 Browse and print reports only. 2 Level 1 plus alarm acknowledge, change scale on bar chart and trends,
change SQL report start/end times and sample intervals. 3 Level 2 plus change individual instrument parameters, all SQL report
parameters and System parameters. 10 Level 3 plus full application edit for tuning and changing application
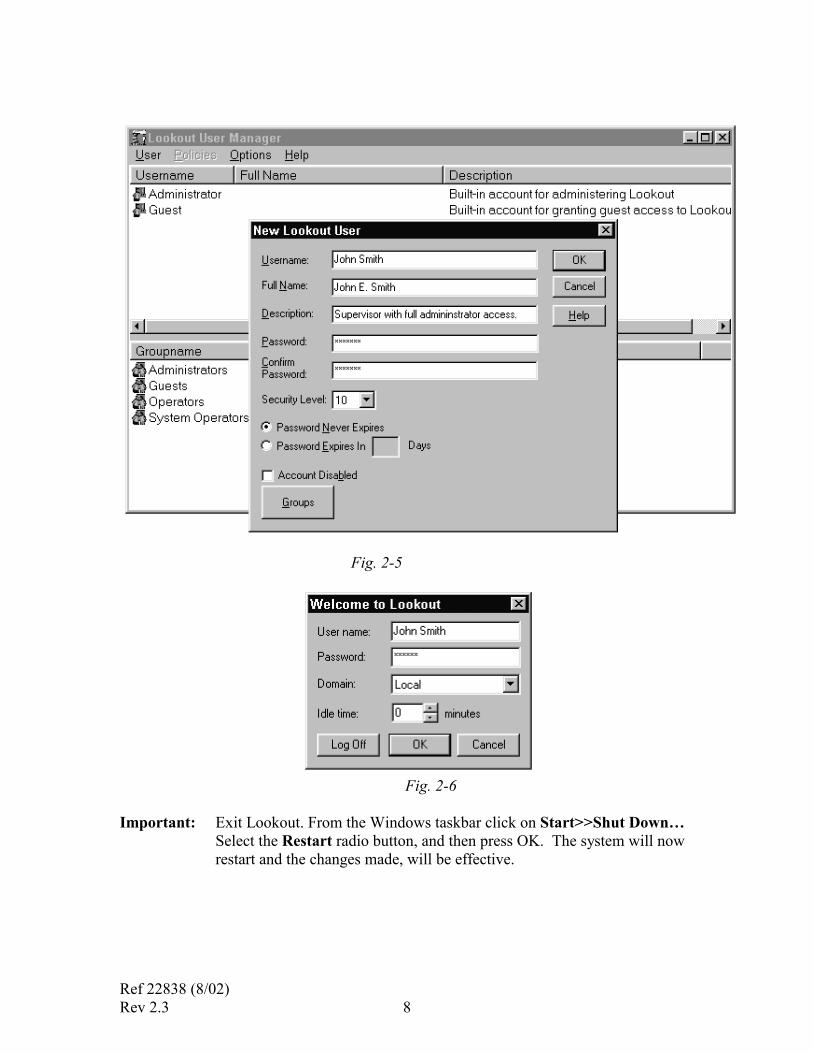
(Administrator) It is necessary to set up user accounts for all personnel who will access the SCADA system. Each user is assigned a security level based on the level of functionality that he/she needs to access. The user accounts are set up as follows (refer to Fig. 2-5): With Lookout launched, select Options >> User Manager. In the dialog box select User >> New User. In the New Lookout User dialog box enter the following information: Username: Name that the user will log in with. Full Name: Full name of the user. Description: A description of the account. Password: An Alphanumeric password (at least 5 elements long). Security Level: Security level for the user per the above table Click OK . Repeat above steps for each new user account that needs to be created. Please note that Lookout security is capable of creating and using user groups. Please refer to Chapter 6, Security of the Lookout Developer’s Manual. To log into the system the user needs to click on login box located on the left side of the task bar next to the date and time box. This box will display the user name of the currently logged in user. If no user is logged in, the box will read “nobody”. In the login dialog box, the user has the option of entering an Idle time value which would be the time in minutes after which Lookout would log the user out if there is no mouse or keyboard activity. The default value of zero means that the automatic log off feature is disabled (refer Fig. 2-6).
Ref 22838 (8/02) Rev 2.3 8
Fig. 2-5
Fig. 2-6
Important: Exit Lookout. From the Windows taskbar click on Start>>Shut Down…
Select the Restart radio button, and then press OK. The system will now restart and the changes made, will be effective.

Ref 22838 (8/02) Rev 2.3 9
2.4 Setting Up ODBC (Open Database Connectivity) Lookout uses a historical database called Citadel for logging all the turbidity process data. The Citadel database includes an ODBC driver, which enables other applications to directly retrieve data from Citadel using SQL (Structured Query Language) queries. It is necessary to set up ODBC in the server node PC (please refer to the next section for an explanation of server and client node PCs). The set up is done as follows: Shut down all ODBC applications such as databases, spreadsheets, and word processors before setting up ODBC. From the Windows taskbar click on Start >> Settings >> Control Panel >> ODBC Data Sources or ODBC (depending on the version of Windows that you are running). Please refer to Fig2-7 for an example of the pop up dialog box that would appear. Please note that the dialog box would vary depending on the version of Windows that you are using.
Fig. 2-7
Select the User DSN tab or the System DSN tab, depending on the type of data source that you want to create. The User DSNs are visible only to the user who created them on the current machine. System DSNs are available to all users on the current machine.

Ref 22838 (8/02) Rev 2.3 10
Click on the Add button. The following dialog box appears (Fig. 2-8).
Fig. 2-8
Select National Instruments Citadel 4 Database from the list and click on the Finish button. In the resulting pop up dialog box (refer to Fig. 2-9), fill in the Data Source Name, Description and Database Path fields: Data Source Name: Lookout4 The Data Source Name must be different from any other ODBC Data Source Names. Description: Lookout Citadel Database. Database path: Z:\Program Files\National Instruments\Lookout\database (where Z is the drive under which Lookout has been installed). The Database Path gives the location of the folder where the data for this source is stored. The path shown above is the default location. It is possible to configure multiple Citadel databases

Ref 22838 (8/02) Rev 2.3 11
Fig. 2-9 Click OK in the Setup dialog box. In the ODBC Data Source Administrator dialog box (Refer to Fig.2-7), select the File DSN tab. In the resulting pop up dialog box (see Fig. 2-10) click on the Add button.
Fig 2-10
Ref 22838 (8/02) Rev 2.3 12
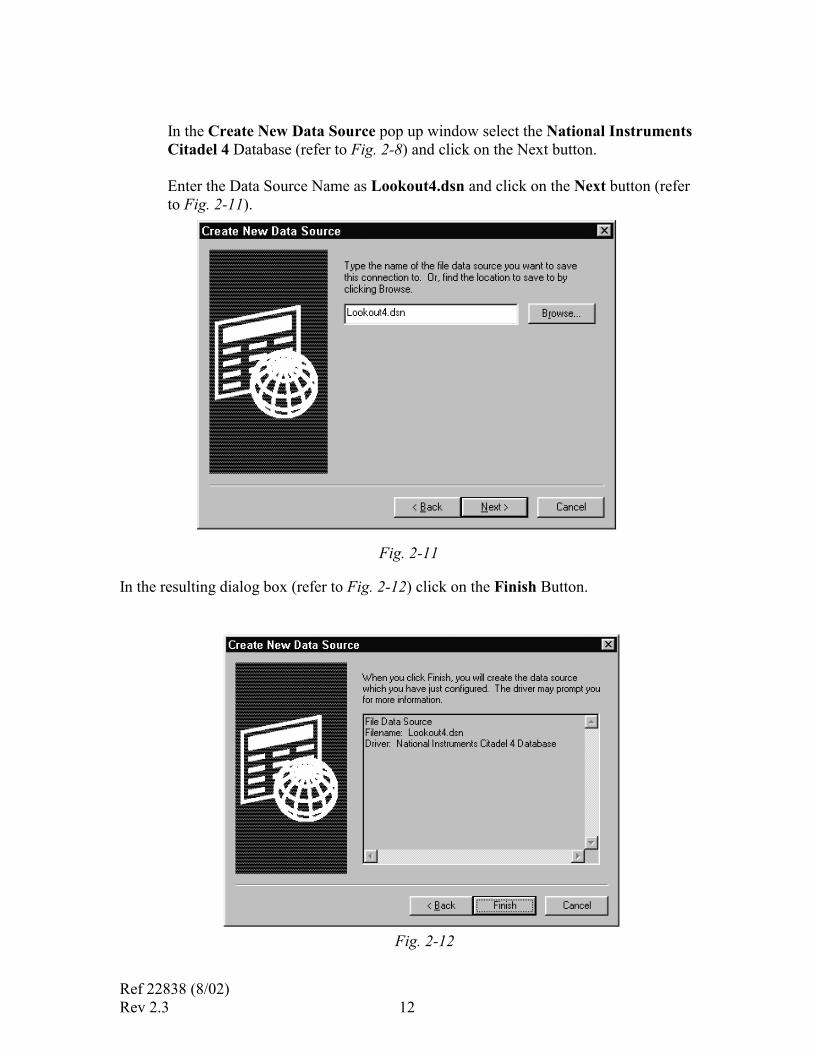
In the Create New Data Source pop up window select the National Instruments Citadel 4 Database (refer to Fig. 2-8) and click on the Next button. Enter the Data Source Name as Lookout4.dsn and click on the Next button (refer to Fig. 2-11). Fig. 2-11
In the resulting dialog box (refer to Fig. 2-12) click on the Finish Button.
Fig. 2-12

Ref 22838 (8/02) Rev 2.3 13
In the dialog pop up (refer to Fig. 2-13) enter the Database Path as Z:\ Program Files\National Instruments\Lookout\database where Z represents the drive in which Lookout is installed. Also check the Convert special characters option and then click on the OK button on the Setup box followed by the OK button in the ODBC Data Source Administrator dialog box.
Fig. 2-13

Ref 22838 (8/02) Rev 2.3 14
2.5 Lookout Registration and Licensing The PC that is to be connected to the turbidimeter network through one of it’s COM ports is called the SERVER node, while all other PC’s on a network which will be operating on the SCADA system are called CLIENT nodes. In the case of a single PC operation, the PC will act as both the server as well as the client node. Licensing in Lookout is done using Keycodes that are supplied by National Instruments. It is necessary to enter the appropriate registration information and key codes in each node in order for the system to work properly. As an unregistered package, Lookout is limited to 50 I/O points and one client connection for 30 days after which it lapses into a demo mode. For a first time installation of Lookout in a computer, Lookout will prompt you for the registration information. The registration information is provided with lookout as a separate document. Lookout must be registered with National Instruments to receive the Keycode or License code necessary to run Lookout. Please note that the Lookout license provided is a run time only license. What this means is that the process configuration files cannot be modified. Any changes to the process, if so required, have to be done by HF scientific inc. and the modified files have to be copied into the site computer/s. There will be an additional fee required to make any changes to the coding. Please refer to Chapter 1, Lookout Operator’s Manual for details regarding entering registration and license code (Keycode) information.
Ref 22838 (8/02) Rev 2.3 15
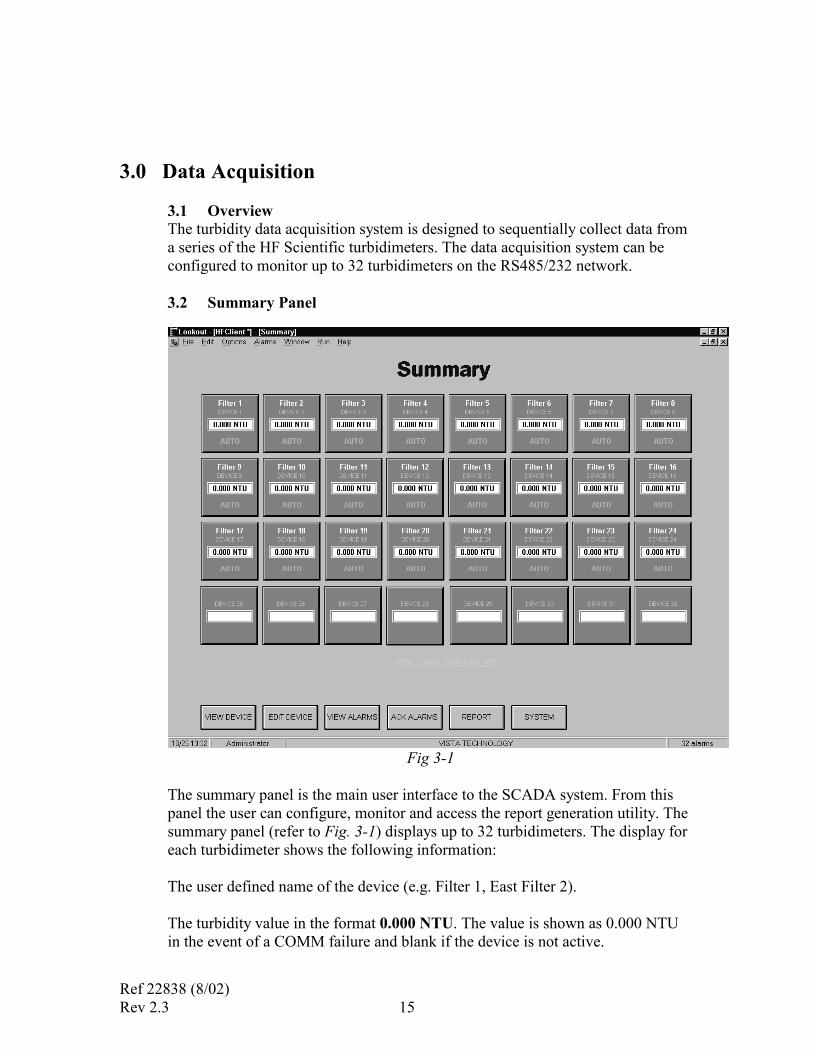
3.0 Data Acquisition 3.1 Overview The turbidity data acquisition system is designed to sequentially collect data from a series of the HF Scientific turbidimeters. The data acquisition system can be configured to monitor up to 32 turbidimeters on the RS485/232 network. 3.2 Summary Panel
Fig 3-1 The summary panel is the main user interface to the SCADA system. From this panel the user can configure, monitor and access the report generation utility. The summary panel (refer to Fig. 3-1) displays up to 32 turbidimeters. The display for each turbidimeter shows the following information: The user defined name of the device (e.g. Filter 1, East Filter 2). The turbidity value in the format 0.000 NTU. The value is shown as 0.000 NTU in the event of a COMM failure and blank if the device is not active.

Ref 22838 (8/02) Rev 2.3 16
The current status of the unit (Auto, Set-Up, Calibrate or OOS). OOS refers to out of service. In addition to the above information, the summary panel provides the following functionality. Please note that the availability of the listed functions to a given user depends on his/her security level (if used). The minimum security level in order to access the function is indicated. View Device push button (Security level greater than or equal to 1): This push button activates the Faceplate Panel pop up window (refer to Fig.3-2), which displays additional operating parameters of each device. The user can navigate to any specific device using the NEXT and PREVIOUS push buttons that appear on the pop up window. Alternatively, the user can click on the display of any specific device to view the detail display. Please refer to the Faceplate Panel section later in this chapter for more information. Edit Device push button (Security level greater than or equal to 9): This push button activates a pop up dialog box (refer to Fig 3-3) through which the user can configure each device. Please refer to the Edit Device Dialog Box section later in this chapter for more information. View Alarms push button (Security level greater than or equal to 1): This push button activates the alarm windows. The alarm window shows all active (unacknowledged in red, acknowledged in black) and inactive (unacknowledged in blue) alarms. ACK Alarms push button (Security level greater than or equal to 2): This push button is used for acknowledging Lookout alarms. Reports push button (Security level greater than or equal to 1): This push button activates the report generation utility. Please refer to Chapter 3, Report Generation of this manual for more information. System push button (Security level greater than or equal to 9): This push button activates the System Panel (refer to Fig 3-4), which runs in the server process. The System Panel is to be used for trouble shooting and diagnostic purposes only. Most of the device configuration capabilities available on the System Panel are available in the Edit Device dialog box, which is available on the Summary Panel. The features of the System panel are discussed in more detail in the System Panel section of this chapter. It should be noted that the System Panel is available only on the server PC in a networked operation.

Ref 22838 (8/02) Rev 2.3 17
3.3 Faceplate Panel
Fig. 3-2
The Faceplate Panel is accessed using the View Device push button on the Summary panel or by clicking on any of the individual device summary displays on the Summary panel. This panel provides the following information for each device: Device Mode: The modes indicated are as follows: Mode Description Unknown Computer has not yet talked to device to determine the mode. Calibrate Device mode is “Calibrate”. Set-Up Device mode is “Set-Up”. Auto Device mode is “Auto”. Comm Status: The Comm Status field will display one of the following values:
Comm Status Description Comm Fail Computer cannot talk to device.

Ref 22838 (8/02) Rev 2.3 18
Normal Computer is talking to device. Alarm Status: The Alarm Status field will display one of the following values:
Warning Status: This field will display one of the following values:
Bar Chart: A bar chart is provided to display the turbidity value. The scale value is user defined and is based on the upper and lower limits of the device. Please refer to the Edit Device Dialog Box section later in this chapter. The following color scheme is used for the bar:
3.4 HyperTrend The HyperTrend displays the turbidity value of the device in a chart form. The user can scroll backward and forward using the scroll keys provided. When the indicator located on the upper right corner is green, the right end of the chart displays the current value and the chart is ‘on’. When the indicator is red, the HyperTrend is ‘stopped’ (Note: Lookout continues to log the data to the historical database). With the HyperTrend in the ‘stopped’ position, the chart displays a date and time value. Clicking on the date/time values on the upper end of the numbers advances the values while clicking on the lower end of the numbers decreases the values. For example, clicking on the lower end of the month value reduces it by one. The chart would therefore be displaying the turbidity values for the same time in the previous month. This very powerful feature allows the user to search and view specific data almost instantly. The HyperTrend also features a cursor, which can be used to view specific values as well as for statistical functions such as Break/Min/ Max. The scale of the trend is user defined as in the case of the bar chart and is dependent on the upper and lower limits of the device. Please refer to the Edit Device Dialog Box section later in this chapter. The user can also define the trend span by clicking on the Trend Span push button.
Alarm Status Description Hi Alarm Device value is greater than the computer based Hi Alarm limit. HiHi Alarm Device value is greater than the computer based HiHi Alarm limit. Alarm 1 Device Alarm Status is “Alarm 1”. Alarm 2 Device Alarm Status is “Alarm 2”. Normal Turbidity value is within normal range. Disabled Limit alarming is not selected.
Warning Status
Description
Low-Flow Device Warning Status is “Low Flow”. Normal No Low Flow warnings exist
Bar Color Description Blue Normal Cyan Device is in “Set-Up” or “Calibrate” mode. Yellow Communication failure. Red Alarm condition.

Ref 22838 (8/02) Rev 2.3 19
3.5 Edit Device Dialog Box
Fig. 3-3
The Edit Device panel is used for configuring each device. The panel is accessed from the Summary panel using the Edit Device push button (Note that the Edit Device push button has a security level of 9). The panel has the following features: Choose Device Number: This is a text entry box in which the user enters the address of the device that is to be configured. The valid range of values is 1 - 32. In the text entry box the user can type in the value or use the available virtual keypad. Out of Service: The user uses this check box to specify that the device is out of service. With the device ‘Out of Service’ Lookout will indicate the turbidity values as –9.999. Device Description: This text entry box is used to specify a name for the device. The name specified here is used in the Summary Panel and Faceplate Panel. The name used should not be more than 8 characters long including any spaces.
Ref 22838 (8/02) Rev 2.3 20
Decimal Places: This text entry box is used to specify the number of decimal places in which the HF turbidimeter has been configured to report the turbidity value. Note: This value must agree with the number of decimal place on the turbidimeter and vice versa. Engineering Units: This text entry box is used to specify the engineering units that will appear with the turbidity value readings on the Summary panel and the Faceplate panel. High Scale Limit: This text entry box is used to specify the upper scale limit of the instrument. The value specified here is used in the bar chart and the HyperTrend chart on the Faceplate panel. Please note that the value entered here has to correspond to the upper limit value set on the actual device. Low Scale Limit: This text entry box is used to specify the lower scale limit of the instrument. The value specified here is used in the bar chart and the HyperTrend chart on the Faceplate panel. Please note that the value entered here has to correspond to the lower limit value set on the actual device. Alarm Reporting: These radio buttons are used to specify how the limit alarming is to be handled:
Alarm Reporting
Description
Device The limit alarms reported are based on the alarm status of the device. Computer The alarms reported are based on the parameters as defined in Lookout for
Hi and HiHi alarms None No limit alarms reported.
Ref 22838 (8/02) Rev 2.3 21
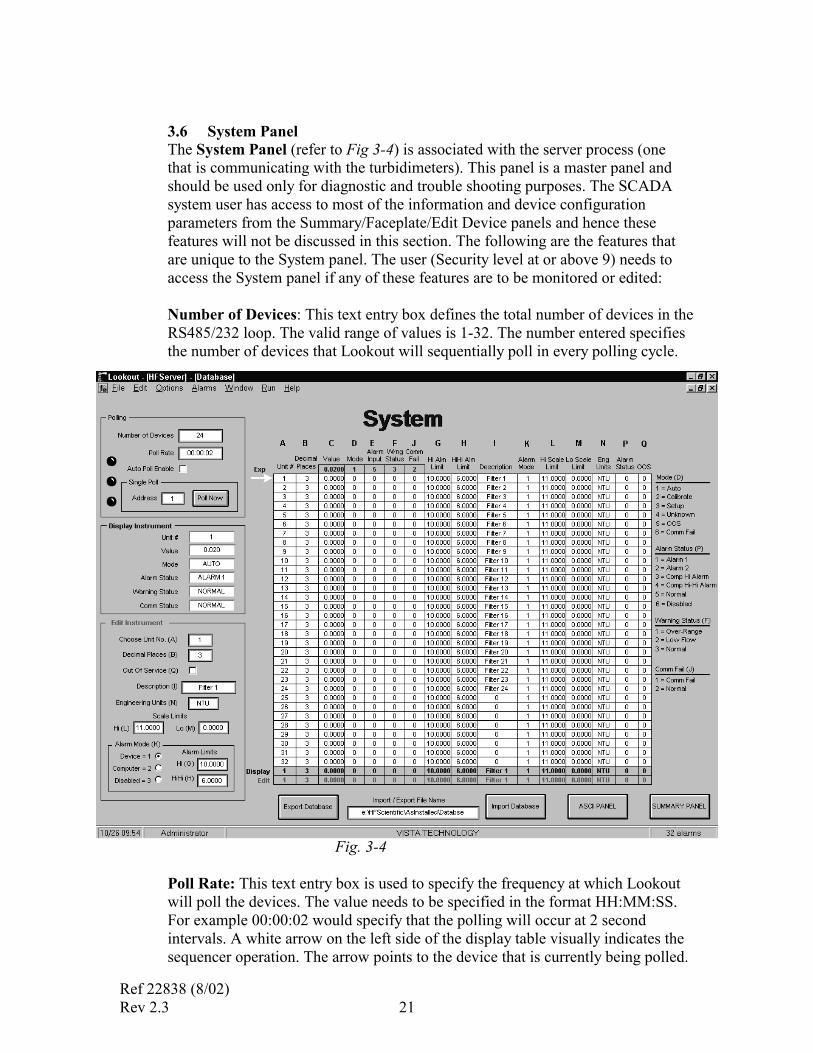
3.6 System Panel The System Panel (refer to Fig 3-4) is associated with the server process (one that is communicating with the turbidimeters). This panel is a master panel and should be used only for diagnostic and trouble shooting purposes. The SCADA system user has access to most of the information and device configuration parameters from the Summary/Faceplate/Edit Device panels and hence these features will not be discussed in this section. The following are the features that are unique to the System panel. The user (Security level at or above 9) needs to access the System panel if any of these features are to be monitored or edited: Number of Devices: This text entry box defines the total number of devices in the RS485/232 loop. The valid range of values is 1-32. The number entered specifies the number of devices that Lookout will sequentially poll in every polling cycle. Fig. 3-4 Poll Rate: This text entry box is used to specify the frequency at which Lookout will poll the devices. The value needs to be specified in the format HH:MM:SS. For example 00:00:02 would specify that the polling will occur at 2 second intervals. A white arrow on the left side of the display table visually indicates the sequencer operation. The arrow points to the device that is currently being polled.

Ref 22838 (8/02) Rev 2.3 22
Auto Poll Enable: This check box is used to enable the automatic polling of the devices. If unchecked, Lookout will not poll any devices and hence the turbidity values will not be updated. Single Poll: This feature is to be used for testing or trouble shooting a specific device. To use this feature, the user would disable (uncheck) the Auto Poll Enable check box, enter the device number to be tested/diagnosed in the Address text entry box and then click on the Poll Now push button. Lookout will poll the specified device once. The Poll Now push button needs to be operated for each additional poll of the device.
Alarm Limits: entering the appropriate values in the respective text entry boxes specifies The Hi and HiHi alarm limits. These alarm limit values are valid only if the Computer mode is selected for alarming. Import / Export File Name: Once all the devices are configured (Device Name, Decimal places etc.), it is possible to export all the configuration data into an Excel spreadsheet. This spreadsheet can be used as a backup or even to modify the configuration data. The user can specify the path and name of the data file in the Import / Export File Name text entry box. For example, if the file were to be called Database.xls to be saved under d:\HFScientificFiles then the text entry would be d:\HFScientificFiles\Database.
Note: The default setting for this path is c:\windows\desktop\database. This will store a file on the desktop for windows 98. This path should be changed as required; it must be a valid path for this feature to operate correctly.
Export Database push button: With the configuration data file name and path specified as indicated above, clicking on the Export Database push button would export the file to the location specified. If the file is exported for the first time, Lookout creates a new file. If the file already exists, then the existing file is over-written with the new data. It is recommended that a backup copy of this file be maintained on a floppy disk. Import Database push button: Once the data file is created it is possible to import the data into Lookout using this Import Database push button. The database may need to be imported for several reasons. For example, in the event of a computer system failure which requires software re-installation. The user can also modify the configuration information for the devices in the Excel file and then import the data into Lookout. ASCII Panel: The ASCII panel is provided for testing and diagnostic purposes only. The panel displays the raw data that is received from the devices during the polling process. The panel also displays the “parsed” values, which are the various sections of the raw data (e.g. Device Address, Turbidity Value, Mode, Status etc) that are then displayed and logged.

Ref 22838 (8/02) Rev 2.3 23
4.0 Report Generation
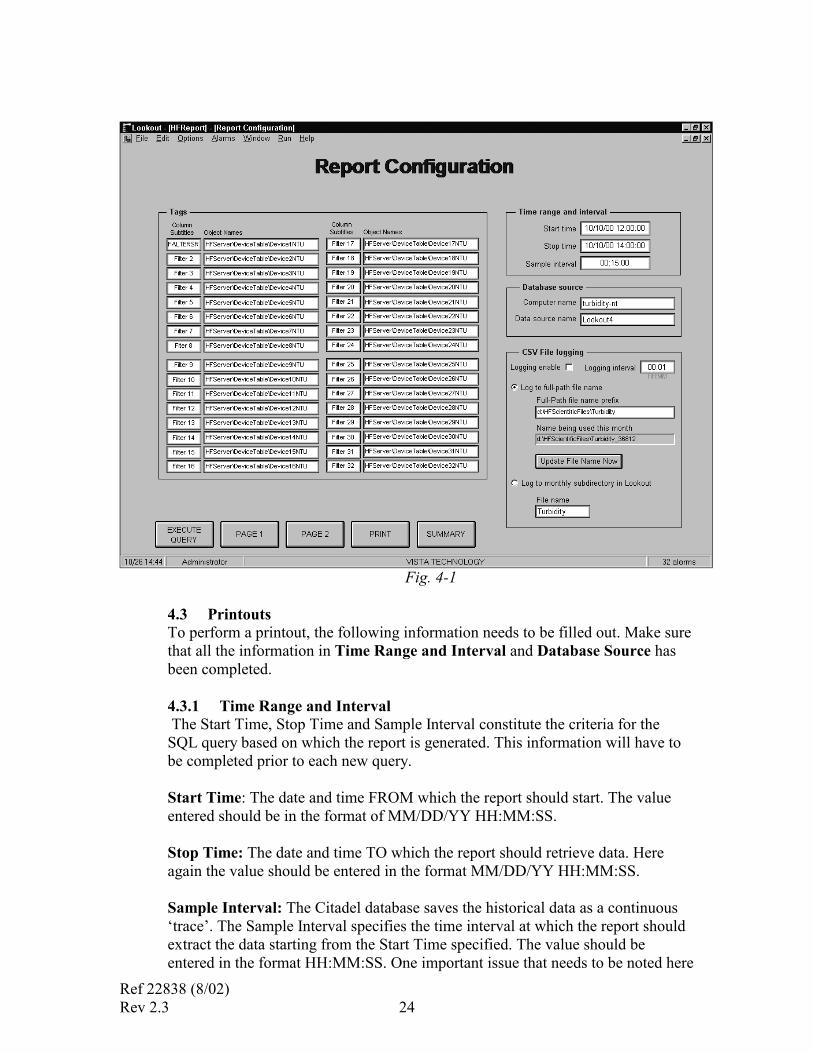
4.1 Overview The SCADA system allows the user to generate query-based reports from the historical data that is collected by the Citadel database. The system can also be set up to log data in .csv (comma separated values) format files which can be opened directly in any spreadsheet programs such as Excel. The .csv files can also be converted into Access database files. The report generation is done using the report generation process, which can be accessed from the Summary panel using the Report push button. 4.2 Report Configuration Panel This panel (refer to Fig. 4-1) allows the user to configure the query based reports that are generated from data logged to the Citadel historical database. This panel also provides the user with the option to log turbidity data in .csv format at a user specified interval, path and file name. The Report Configuration panel has the following features: Tags: This is an array of text entry boxes with which the user can specify: Column Subtitles: These are the column subtitles as they should appear on the report. The subtitle should not be more than 8 characters long. It should be noted that the SQL query based report is configured as a 32 column and 31 row report. The basis for the 32 columns is the 32 devices that the SCADA system can handle. Hence the column subtitles would be essentially the device names (Filter 1, Filter 2 etc.). Object Names: The Object Name specifies the name of the tag in the Citadel database that the user would like to create the report for. The reports are set up for the turbidity values and the Object Name is HFServer\DeviceTable\DeviceXNTU where X denotes the device address. For example, the Object Name for the turbidity value for Device 1 would be HFServer\DeviceTables\Device1NTU. The SCADA system is configured to log only the turbidity value to the database. The object names are already entered in the table and should not require any editing by the user.
Note: Editing these object names may result in improper operation of the report generation function.
Ref 22838 (8/02) Rev 2.3 24
Fig. 4-1
4.3 Printouts To perform a printout, the following information needs to be filled out. Make sure that all the information in Time Range and Interval and Database Source has been completed. 4.3.1 Time Range and Interval The Start Time, Stop Time and Sample Interval constitute the criteria for the SQL query based on which the report is generated. This information will have to be completed prior to each new query. Start Time: The date and time FROM which the report should start. The value entered should be in the format of MM/DD/YY HH:MM:SS. Stop Time: The date and time TO which the report should retrieve data. Here again the value should be entered in the format MM/DD/YY HH:MM:SS. Sample Interval: The Citadel database saves the historical data as a continuous ‘trace’. The Sample Interval specifies the time interval at which the report should extract the data starting from the Start Time specified. The value should be entered in the format HH:MM:SS. One important issue that needs to be noted here

Ref 22838 (8/02) Rev 2.3 25
is that as indicated earlier, the report has only 31 rows. Hence if the number of records based on the start and stop times and the sample interval is greater than 31, all records after the 31st would not be shown on the report. For example if: Start Time = 10/25/02 12:00:00 Stop Time I = 10/25/02 14:00:00 and Sample Interval = 00:02:00 (2 minutes) the number of records would be 60. However, since only 31 records can be displayed, the report would only show data from 12:00:00 through 13:02:00. It is therefore important to to pick a combination of start / stop time and sample interval in such a way as to have no more than 31 records. 4.3.2 Database Source This parameter has two fields, which are required for the execution of the SQL query. These fields usually only have to be completed only once. Computer Name: Name of the PC node where the Citadel database resides. For a single PC operation, an easy way to find the computer name is to go to Options >> System. The name in the Computer Name field (refer to Fig. 2-1 in Section 2, Software Installation of this manual), which Lookout has filled in automatically, is to be used. Data Source Name: This is the ODBC data source name for the Citadel database that will be used by SQL to execute the query. Use Lookout4 as the name if the procedure for ODBC set up indicated in Section 2, Software Installation has been followed. 4.3.3 Execute Query This push button is used to execute the SQL query, which upon successful completion will create the required report. The user needs to fill all the criteria values as mentioned in previously, before attempting to execute the query. Page 1 push button: Activation of this push button accesses the Page 1 panel of the two-page report (refer to Fig. 4-2). Please refer to the Page 1 section later in this chapter. Page 2 push button: Activation of this push button accesses the Page 2 panel of the two-page report (refer to Fig. 4-3). Please refer to the Page 2 section later in this chapter. Print push button: This push button is used the print the two pages of the report that has been generated.
Ref 22838 (8/02) Rev 2.3 26
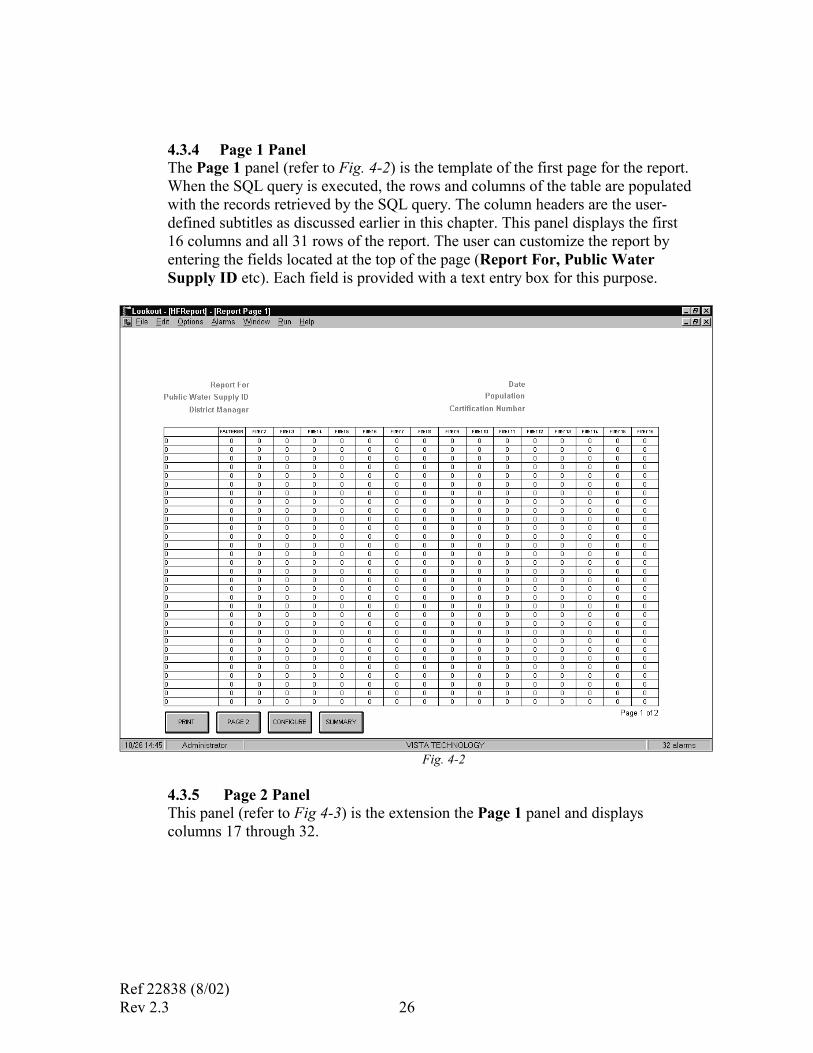
4.3.4 Page 1 Panel The Page 1 panel (refer to Fig. 4-2) is the template of the first page for the report. When the SQL query is executed, the rows and columns of the table are populated with the records retrieved by the SQL query. The column headers are the user-defined subtitles as discussed earlier in this chapter. This panel displays the first 16 columns and all 31 rows of the report. The user can customize the report by entering the fields located at the top of the page (Report For, Public Water Supply ID etc). Each field is provided with a text entry box for this purpose.
Fig. 4-2 4.3.5 Page 2 Panel This panel (refer to Fig 4-3) is the extension the Page 1 panel and displays columns 17 through 32.

Ref 22838 (8/02) Rev 2.3 27
4.4 Database/Spreadsheet In addition to the Citadel historical database it is also possible to log data separately in a .csv format file (also called spreadsheet logging), which can be opened directly using any spreadsheet program, such as Excel. The user has the option of enabling/disabling this logging function as well as a choice of where the data will be logged. The user can also specify the logging interval. 4.4.1 CSV File Logging To use the facility of data logging, complete the following information inside CSV File Logging. Logging Enable: This check box is used to enable or disable the spreadsheet logging. Logging Interval: Interval of time at which Lookout saves the specified field as a new row in the spreadsheet file. Please note that unlike the Citadel database where the data is saved as a continuous trace, the spreadsheet data is a snapshot of the data at the specified time intervals. The value needs to be entered in the format HH:MM. Log to Full-Path Name / Log to Monthly Subdirectory in Lookout: It is possible to save the spreadsheet file either in the default Lookout directory or using a fully specified path name. The major difference is that if the data is saved in the Lookout directory, Lookout automatically creates a directory tree, which makes it easy for retrieving and maintaining the data. For example Lookout would automatically create a folder under the Lookout directory for the year 2002. In the 2002 folder it would create a folder for the current month. The spreadsheet file would then be located in the month folder (d:\Program Files\National Instruments\Lookout\2002\nov\turbidity.csv). At the start of a new month or year. Lookout would create the appropriate folder/s. If the full path name option is selected, the user needs to enter the desired path name where the file is to be saved. In this case Lookout will NOT create the year/month folders automatically. In order to address this problem, the process has been configured to automatically concatenate a unique number at the end of the file name for each month. For example if the file is to be saved under d:\HFScientificFiles\Turbidity, Lookout will add a unique number to the end of the file name, which will make the file name look something like Turbidity_36812.csv. If the full path name option is selected the user needs to click on the Update File Name Now pushbutton for the settings to take effect. The spreadsheet object has been configured to log only the turbidity values for each device. It must be noted that if the spreadsheet file is opened while Lookout is running, Lookout cannot write new data to the file. Lookout will automatically create a memory buffer where it will store this data until the .csv file is available again.

Ref 22838 (8/02) Rev 2.3 28
However, the buffer is not unlimited in size and if the spreadsheet file is left open indefinitely, the buffer could overflow causing loss of data. It is therefore good practice to close the spreadsheet file immediately after use. Another item to keep in mind regarding the spreadsheet files is that these files will open directly in Excel. However while closing the file, Excel will put up a dialog box stating that the open file was created in an earlier version of Excel and ask if the user wishes to update it to the latest version of Excel. Always pick NO. This is because the spreadsheet object in Lookout is not capable of writing to a file later than Excel 4. If the user needs to use the file in a later version of Excel, it is recommended that a copy of .csv file be made for use in the newer version, leaving the original for Lookout to log data. 4.4.2 Converting CSV Files to ACCESS Database Files It is easy to convert the .csv data files to a Microsoft® ACCESS database file. To do so create a new database in Access. Then create a new table to import data from external files. Navigate to the location of the .csv file and click on Import. Follow the instructions to complete the Access table created from the .csv file.
Fig. 4-3

Ref 22838 (8/02) Rev 2.3 29
5.0 Appendix Lookout File Types A Lookout process comprises of four files: Process (.l4p), State (.lst), Source Code (.lks) and Security (.lka). These files are created automatically in the application development cycle. All of the above files have the same user defined file name (e.g. hfserver) but with file extension as indicated above. A brief description of each file type and its function: Process File: A process file is a compiled file that contains the Lookout process that we want to run. Process files cannot be directly edited or modified. Rather, Lookout compiles the .l4p on an object-by-object basis. The compilation occurs whenever the application is saved. With this approach it is possible to create new objects or modify existing ones without having to shut down the process, one of the most powerful features of the Lookout SCADA system. Please note that in order to be able to edit or modify a Lookout process it is necessary to have the Keycode for the development version of Lookout loaded on the computer. Source Code File: In the application development process, Lookout automatically creates and updates a corresponding source code file when the File>>Save command is invoked. The source code file is a standard ASCII text file that can be viewed and printed with any word processor or text editor. The source code information can be used for debugging and documentation. State File: The state file contains the actual values of object data members. Lookout uses the state file to store the position of switches, potentiometers, trend lines etc. When Lookout first loads an application, it reads the state file to determine what state the pots, switches, trend lines etc. should be upon startup. The state file updates any time the application is saved or closed. It is also updated on a periodic basis at user-defined intervals. Security File: Every Lookout process has an attached security file identified by the .lka extension. All the security information for a Lookout process is kept in the .lka file.