owens, glynnis anne (1978) e.s.r. studies of tcnq complex
TRANSCRIPT

E.S.R. STUDIES OF
TCNQ COMPLEX SALTS
by
GLYNNIS ANNE OWENS, B.Sc.
Thesis submitted to the University of Nottinghamfor the degree of
Doctor of PhilosophyOctober 1978.
ACKNOWLEDGEMENTS
The past three years at the University of
Nottingham have been enjoyable and most rewarding, and I
would like to express my gratitude to the numerous people
who have made it so.
Firstly, I would like to thank Professor D.D.Eley,
F.R.S.,O.B.E. for the interest he has shown in this work,
and to Dr.M.R.Willis for his continued guidance and
encouragement. Also in the academic field, thanks are due
to various members of the semiconductor group with whom I
have had valuable discussions.
I would also like to take this opportunity of
thanking the technical staff of the Chemistry Department,
particularly Mr.W.E.Porter, Mr.R.Parsons and Mr.N.D.Brown,
and also Mr.J.L.Dennis of the Physics Department.
Thanks are also due to my colleagues, to Mr.T.J.
Spencer for careful typing of this manuscript, and the
SCience Research Council for financial support.
I would like to thank my fiance, Derek, for his
patience and understanding and, finally, I wish to express
my sincere and deep gratitude to my parents for their
support, encouragement and enthusiasm throughout m~
education. To them I dedicate this thesis.

To Mum and Dad

CHAPTER 1
1.1
1.21.3
1.4
1.51.6
1.7
1.8
CONTENTS
INTRODUCTION
The concept of conduction. 1
Studies of the organic solid state. 2Superconductivity. 4
The TCNQ molecule. 7
TCNQ salts. 9
Structural factors influencing thephysical properties.
12
Reported progress in the search fora superconductor.
16
The role played by electron spinresonance in the study of TCNQcomplex salts.
22
CHAPTER 2 MAGNETIC PROPERTIES
Forward 262.1 Magnetic properties of matter. 262.2 Diamagnetism. 28
"- 2.3 Paramagnetism. 312.3.1 The Curie law. 312.3.2 Van Vleck paramagnetism and Pauli 34
paramagnetism.2.3.3 Ferromagnetism, antiferromagnetism 36
and ferrimagnetism.2.4 Electron spin resonance. 391.4.1 Magnetic properties of the electron. 402.4.2 Interaction with a magnetic field. 412.4.3 The resonance condition. 43

2.4.4
2.4.5
2.4.6
2.4.7
2.4.8
2.4.9
2.5
2.5.12.5.2
CHAPTER 3
3.1
3.2
3.2.1
3.2.2
Relaxation processes.
Lineshapes and·linewidths.
Fine structure.
Nuclear hyperfine structure.
Exchange interactions.
Convention of the spin Hamiltonian.
Magnetic properties of TCNQcomplex salts.
Triplet excitons.
E.s.r. spectral characteristicsassociated with triplet excitonsin TCNQ complex salts.
EXPERIMENTAL
Sample preparation.
Electron spin resonance studies.Equipment.
(i) The spectrometer.
(ii) The cooling unit.
(iii) High temperature equipment.
(iv) The analog integrator.
(v) Sample holders.
Calibration experiments.
(i) Microwave power attenuators.
(ii) 100KHz receiver attenuators.(iii) Thermocouple calibration.
(iv) Sweep rate calibration.
46
48
51
52
53
54
55
56
63
7174
74
74
7779
79
8182
82
83
85
85

3.2.2 (v) Purity of DPPH. 87(vi) Oscilloscope measurements. 89
3.2.3 Electron spin resonance measurementson TCNQ complex salts.
91
(i) g factor measurements. 91(ii) Molar susceptibility 95
measurements.(iii) Temperature dependence of the 96
signal intensities.(iv) Dipolar interaction study. 98(v) Lineshape study. 99(vi) Spin-lattice relaxation time 100
study.(vii) Estimate of Curie spins. 103
CHAPTER 4 RESULTS AND DISCUSSION OF E.S.R.STUDIES OF TCNQ COMPLEX SALTSAVAILABLE AS SINGLE CRYSTALS.
4.1 DCBP(TCNQ)3. 1054.2 DMPA(TCNQ)4(I). 1324.3 DPB(TCNQ)4· 1434.4 TPT(TCNQ)4· 151
CHAPTER 5 RESULTS AND DISCUSSION OF E.S.R.STUDIES OF TCNQ COMPLEX SALTSAVAILABLE ONLY IN POLYCRYSTALLINEFORM.
5.1 DMPA(TCNQ)4(II). 1625.2 DPPE(TCNQ)S· 1705.3 DBPE(TCNQ)S· 174
5.4 DHPE(TCNQ)S· 177

CHAPTER 6
REFERENCES.
APPENDICES.
CONCLUDING REMARKS.
·Page
182

ABSTRACT
The technique of electron spin resonance was used
to study the magnetic properties of a number of complex
salts of 7,7' ,8,8'-tetracyanoquinodimethane (TCNQ) in order
to obtain a more complete understanding of the electronic
states in these materials.
All but one of the cations used in the
preparation of these compounds were divalent and their
TCNQ complex salts exhibit magnetic behaviour characteristic
of thermally accessible triplet excitons. Three of these
compounds, 1,2-di(N-p-cyanobenzyl-4-pyridinium)ethylene
(DCBP)-(TCNQ)3' 1,2-di(N-methyl-4-pyridinium)ethane (DMPA)-
(TCNQ)4 (I), and 1,4-di(N-pyridinium)butane (DPB)-(TCNQ)4'
were available as single crystals and could be studied in
detail. Four of these, however, were only available in
polycrystalline form and these were DMPA(TCNQ)4(II) and
1,2-di(N-alkyl-4-pyridinium)ethylene (DRPE)-(TCNQ)S' in
which R equals n-propyl (P), n-butyl (B), and cyclohexyl
(H). The existence of two phases (I and II) of DMPA(TCNQ)4'
first indicated by the electrical data, was supported by
the different magnetic behaviour observed in this work.
The absolute magnitudes of the signal intensity
for DPPE(TCNQ)S' DHPE(TCNQ)S and DMPA(TCNQ)4 (II) ,werefound to be well described by an approximate solution to
the Heisenberg Hamiltonian, which indicates an exciton
band is present in these compounds. The absence of dipolar
splitting and the high d.c. conductivity supports thisinterpretation.
However, DMPA(TCNQ)4(I), DPB(TCNQ)4' DBPE(TCNQ)Sand DCBP(TCNQ)3 gave results indicative of localised
triplet excitons. The latter compound exhibits dipolar
splitting, and information concerning the exciton dynamics
could be obtained. These results were consistent with the
conductiv:lty data and, where available, the crystal
structure determinations.
The complex salt TPT(TCNQ)4 was available in
single crystal form and contained the only trivalent
cation studied in this work. The temperature independent
signal intensity indicated that triplet excitons were not
present, and this behaviour was typical of Pauli
paramagnetism. This observation was consistent with the
semi-metallic d.c. conductivity observed and was explained
in terms of the high degree of disorder present, asindicated by the crystal structure determination.

CHAPTER I
INTRODUCTION
"All that glisters may not be gold,
but at least it contains free electrons."
John Desmond Bernal
1901 - 1971
-1-
1.1 THE CONCEPT OF CONDUCTION
Scientists throughout the centuries have
observed chemical changes and phenomena associated with
the electron, and explanations ranged from demons and
spirits to the relatively recent 'phlogiston hypothesis'.
It was not until about 1800 that the flow of heat through
a substance was attributed to motion of particles, and
the particle itself was discovered in 1897 by J.J.Thompson.
This elementary particle, the electron, is responsible for
the conduction of heat, the conduction of electricity, andchemical reactions, all of which provide man with the
conveniences and comforts of modern life.
The motion of the electron through a substanceis dependent on the nature of the substance and how
readily the electrons can be detached from their atoms.
Consequently, materials can be classified in terms of
their electrical conductivity and named metals (good
conductors), semiconductors (intermediate conductors),
and insulators (poor conductors). This can be understoodwith reference to Figure 1.1, which shows the bands of
energy levels which are allowed to electrons in a solid.
These energy bands originate from the discrete energy
levels associated with the isolated atoms comprising thesolid and consist of a large number of closely spaced
levels. In a metal (Figure l.l(a}) band B is only
partly filled and electrons close to the surface can

!Energy
I A ConductionBand
(a) (b)
Figure 1.1
Schematic Diagram for electrical conduction in
(a) a metal, and (b) a semiconductor.

-2-
move freely through the material. In a semiconductor(Figure l.l(b)) band B is completely filled and electricalconduction can only occur by exciting the electrons acrossthe energy gap into band A. This is achieved by thermalenergy in the case of electrical conduction, and byelectromagnetic radiation in photoconduction. Figurel.l(b) can also be used to represent insulators, only inthis case the energy gap is greater.
All three classes of materials have their usesin industry today, particularly semiconductors which areextensively used in solid state electronic devices. Theemphasis on semiconductors is based on the fact that theirelectrical conductivity and other properties can bechanged, not only by the addition of small amounts ofother materials, but by external stimuli such astemperature change, electric field, and incident radiation.
1.2 STUDIES OF THE ORGANIC SOLID STATE
Most of the early work on semiconductors wascarried out on the inorganic elements silicon andgermanium and, although these are widely used in industry,there has been a growing need for materials with bettermechanical properties. Organic compounds were an obviouschoice as the considerable flexibility of organicchemistry enables the design and synthesis of moleculeswith specific physical and chemical properties.

-3-
The first step in this field was made by
Pochettinol in 1906 with the observation of photoconduction
in anthracene. This was followed, however, by very few
investigations, and it was not until the Second World War
that further interest in the organic solid state was
aroused. This was initiated by Szent-Gyorgyi2 who
suggested that many biochemical problems might be solved
if discussed in terms of electron transport in living
matter. It was this impetus that opened the organic
semiconductor field, not only with biological
macromolecules but also simpler molecules and molecularcomplexes.
Semiconductivity was subsequently observed in
wool plus 8% absorbed water3,4 and later photoconductive
effects were reported5 in gelatine to which various dyes
had been added. Further significant work fo·J:lowedwith
the observation of intrinsic semiconductmon in the
biologically significant organic dye, phthalocyanine6,7,
and polynuclear hydrocarbons and quinones were also shown
to exhibit semiconducting behaviour 8
Although research into biological macromolecules
has continued and expanded, interest has developed in
bimolecular organic systems also. This diversification
was a result of the observation of high d.c. electricalconductivities in certain bimolecular organic solids 9

-4-
These materials became known as charge transfer (CT)
complexes and were formed from potential electron donor
and potential electron acceptor molecules. The complex
formed exhibited a spectral band not associated with
either of the individual components, but was in fact due
to the transfer of an electron from the donor to the
acceptor molecule, hence the name of charge transfer.
Frequently this results in paramagnetic compounds and
many of these CT complexes have been foundlO to contain
unpaired electrons in the solid state using the
technique of electron spin resonance.
These CT complexes had wide ranging properties
depending on the donor and acceptor strengths of the
component molecules. Although complexes of weak donors
and weak acceptors were usually poor conductors, whereas
strong donors and acceptors exhibited higher
conductivities, it became apparent that charge transfer
alone did not determine the electrical conductivity of
these complexes. Scientists have since been trying to
understand the thermal, transport, magnetic and optical
properties of organic solids in terms of the ~arious
interactions between the constituent molecules in thesolid state.
1.3 SUPERCONDUCTIVITY
The phenomenon of superconductivity was

-5-
discovered by the Dutch physicist Heike Kammerlingh Onnes
in 1911, and is associated with the total disappearance
of electrical resistance in a material. The transition
from a normal to a superconducting state was treated from
a thermodynamic viewpoint and, from 1929 to 1950, the
developments in the theory of superconductivity consisted
of refinements to this treatment. It was not until 1957
that superconductivity was explained in terms of
microscopic solid state phenomena by Bardeen, Cooper andSchrieffer 11
According to the BCS theory, there are two
major conditions that must be met for superconductivity
to occur. Firstly, there must be an attractive
interaction between pairs of electrons which is strong
enough to overcome the normal Coulomb repulsion between
them. Moreover, this attractive interaction must be
sufficiently strong for bound pairs to result. Secondly,
all these bound pairs of electrons must be in
identically the same quantum mechanical state in order to
remain bound.
Many inorganic materials and alloys are known
to exhibit superconducting behaviour but this state
exists only in a particular range of temperature. The
temperature at which the transition from a superconducting
state to an ordinary metallic state occurs is known as the
-6-
critical temperature, T , the highest value being aboutc21K, and corresponds to the breaking up of all bound
pairs.
The technological potential of superconductors
is virtually limitless, but the low temperatures involved
makes most of the proposed applications not economically
feasible. Therefore, the production of new
superconductors with large values of T is of tremendousctechnological importance. However, theoretical
calculations predicted that a value of 40K for T isc
unlikely to be exceeded by any inorganic metal or alloy,
thereby destroying the dream of a high temperaturesuperconductor. This is where the organic solid stateonce again provoked interest.
Little12 proposed in 1964 that an organic
compound of appropriate structure could theoretically be a
high temperature superconductor. Figure 1.2 shows the
model organic polymer used by Little to explain the
mechanism. He proposed a slight variation of the BCS
theory by suggesting that an electron moving along the
spine of this model polymer would induce a dipole in the
highly polarisable molecules of the side chain. Thisinduced charge would then attract a second electron,
resulting in the formation of a pair of electrons
(Cooper pair) having an attractive interaction between

Figure 1.2
Little's model organic superconductor and the
canonical forms of the side group.
-7-
them. This mecha.nism differs from the BCS theory in that
an electronically polarisable entity is used instead of
the polarisable ionic lattice. Therefore, the very small
electronic mass, instead of the larger ionic mass, appears
in the theoretical calculation of Tc' resulting in a walue
at least an order of magnitude above that possible for a
conventional metal or alloy.
Little's theory is very hypothetical and hasbeen th b' f h '" 13-15 b t the su Ject 0 muc cr1t1C1sm , u etechnological and academic importance of his proposal has
stimulated interest in attempting to synthesise molecular
systems similar to the model polymer.
1.4 THE TCNQ MOLECULE
The organic molecule 7,7',8,8'-tetracyanoquino-
dimethane (TCNQ), and the compounds associated with it,
have been under intensive investigations since it was
first synthesised in 1960 by the company E.I.du Pont de
Nemours and Co. in the U.S.A.16• The TCNQ molecule is a
closed-shell almost planar quinoid molecule (Figure 1.3
(a)) having four highly electnon-withdrawing cyanide
groups located at the terminal methylene carbon atoms.
These characteristics account for its very large electron
affinity and associated behaviour of taking one electron
when in conta.ct with virtually any electron donor to form
the open-shell TCNQ- monoanion radical (Figure 1.3 (b)),

(a)
Ne".c--<NC,/
Cb)
Figure 1. 3
(a) Neutral TCNQ molecule.
(b) TCNQ anion radical.

-8-
whose molec:ular geometry is slightly different from that
of the neutral molecule.
The single unpaired electron on TCNQ occupies
the lowest energy empty w-level and is expected to reside,
mainly localised, on the terminal dicyano methylene carbon
groUps in order to take advantage of the strong electron
affinity of the cyanides. Confirmation of the electronicstructure has been provided by the small hyper finecoupl' f th' '1' d' 17 b~ng 0 e r~ng protons ~n so ut~on stu ~es , y
analysis of the X-ray bond lengths associated with the
anion radical18,19, and by a theoretical study 20
Many aromatic organic molecules, other thanTCNQ, are known to be good electron acceptors, for
example, quinones and substituted quinones, and combine
readily with good electron donors to form paramagnetic
CT complexes. However, TCNQ complexes have received the
most interest, there being two main reasons for this.
Firstly, the majority of the compounds exhibit
semiconducting behaviour and are, therefore, significant
as pointed out in section 1.2. Secondly, the complexes
are similar in structure, being essentially one-
dimensional, to the model system proposed by Little for
the organic high t~mperature superconductor.
-9-
1.5 TCNQSALTS
The first stable salts of TCNQ (frequently also
called complexes) were prepared by Melby et al16,2l and
these compounds may be represented by the general formula+ -D (TCNQ) , where D is the cation which frequently contains
no unpaired electrons. The most commonly used cations are
aromatic molecules generally containing nitrogen atoms.
However, TCNQ forms complexes with various alkali and
transition metals as well as with organic bases.
The compounds having the above general formula
are known as simple salts, each TCNQ existing in the form
of an anion radical, but neutral TCNQ molecules may also
take part, in which case the compounds are called complex
salts. The stoichiometry is 1:1 in the simple salts, but
is often found as 2:3, 1:2, or even 1:4 in the complex
salts, the latter therefore having the general formula ofDn+( - 0TCNQ)n(TCNQ)x' where n is the valency of the cation
and x is the number of neutral TCNQ molecules.
Both the simple and the complex salts of TCNQh 21 22 . 23 24ex ibit interesting electrical ' and magnet1c '
properties unusual for organic systems. The number of
TCNQ complexes synthesised is well into the hundreds, but
they can all be grouped into three classes22, each
specified by the similarity of physical properties. The
range of room temperature electrical conductivities varies

-10-
from 10-9 to 103 ohm-l cm-l and it is this property which
forms the basis of the segregation into classes.
The most highly conducting group of complexes,where the cation is normally derived from a planar
heterocyclic 'base, shows near metallic properties having
a high conductivity of 101 tol03 ohm-l cm-l which
increases with decreasing temperature. This class of
complexes also usually exhibits temperature-independent
paramagnetic susceptibility, normally associated with
Pauli paramagentism, which is characteristic of a
degenerate electron gas such as occurs in metals.
The conductivity of the so-called intermediate-
conductivity complexes is smaller by several orders of
magnitude and decreases with decreasing temperature.
Their paramagnetic susceptibility also decreases as the
temperature is lowered, thereby indicating the existence
of a gap in the magnetic excitation spectrum.
The third and final class incorporates the low-
COnductivity complexes which are practically insulators
and mostly dLamaqne t tc at room temperature, consequently
provoking little interest.
Although there are examples of both types ~n all
the three classes, it is generally found that the complex

-11-
salts exhibit higher conductivities than the simple salts.
The proposed explanation25 for this considers the problem
in terms of the coulomb repulsion between the electrons.
For the simple salt, the conduction mechanism involves the
removal of an odd electron from TCNQ-, leaving a neutral
molecule, and is added to another TCNQ to give a doubly
negative molecule. For a complex salt, transport of an
electron can occur without putting two electrons on the
same TCNQ site, as there are neutral TCNQ molecules
available. The fact that two electrons do not reside on
the same molecule in the complex salts has also been
confirmed23 by comparison of electron spin resonance data.
In the attempt to understand the conductionmechanisms involved and to synthesise more highly-
conducting compounds, polymeric salts of TCNQ have also
been studied~6-28. However, these polymers were found to
be poorer conductors than the monomers from which they
Were derived, and the electrical properties varied
according to the polymer crystallinity, this behaviour
having been observed previously on compounds other thanTCNQ salts29,30.
It is apparent that chemists and physicists
have been faced with the tremendous challenge of how to
explain and interpret the wide range of physical
properties exhibited by TCNQ complexes, which remain

-12-
unprecedented in the field of the organic solid state.Many attempts have been made24,2S,31,32, with, the goal of
Little's superconductor providing the motivation, but even
today a fully comprehensive understanding of this family
of salts is yet to be achieved.
1.6 STRUCTURAL FACTORS INFLUENCING THE PHYSICAL PROPERTIES
The wide range in physical properties of TCNQ
complexes is not surprising when one considers the variety
of crystal structures adopted. The early X-ray crystal
structure determinations33,34 elucidated one of the
reasons for the high conductivity observed wmth some of
the TCNQ complexes, although there are undoubtedly other
important factors involved. It was discovered that a
characteristic feature of the complexes is the presence of
columns of the TCNQ molecules arranged with their
molecular planes almost parallel to each other. These
stacks are separated in one direction through the crystal
by planes of the cations (Figure 1.4). This mode of
packing provides a facile conduction pathway for the
unpaired TI-electrons in one direction, along the stack,
and this is reflected in the electrical conductivities.
Large anisotropies of the physical properties
have been observed in these materials which allows a
certain correlation of conductivity to be made with
structure. This has in fact been used by Dahm et a13S to

TCNQstack
C :::J-:lr:: ee :J:l CC C2+:J C :J
C ee c :l
C.::oJ
:J C :::lCe e·
:J C ::JC CZ+
::J C :JC
e e:J t ]
C
Figure 1.4
Schematic representation of the crystal structure
of a typical TCNQ complex salt. The bracket
indicates a group of 4 TCNQ molecules within the
stack.

-13-
form the basis of a classification of the TCNQ complexes.
If the compound possesses mixed stacks of alternating
donors and acceptors, these stacks are described as
'heterosoric' (eg.ADAD .•••). If in the mixed stacks there
are isolated pairs (diads), threes (triads) or fours
(tetrads) of TCNQ molecules, they are described as 'non-
soric' (eg. ADDADDA •••• ). However, if the compound
possesses separate stacks of cations and TCNQ molecules,
each stack only containing molecules of one type, then
they are known as 'homosoric'.
Another property characterising the stacks is
the nature of the n-orbital overlap between component
TCNQ molecules. Using an extended Huckel approach, it has
been shown19,36 that a minimum intermolecular pairing
energy between charged TCNQ dimers in a stack occurs when
they are overlapped with the ring of one over the external
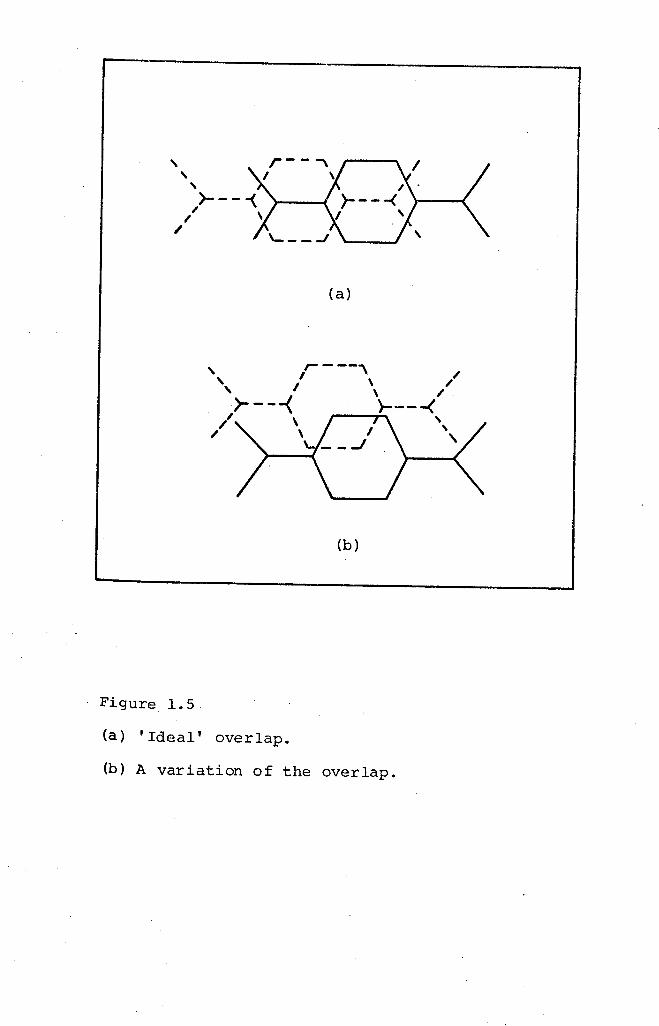
double bond of the other. This is specified as the 'ideal'
Overlap (Figure 1.S(a» and maximises n-orbitalsinteraction
whilst minimising Van der Waals repulsion. However, this
ideal overlap is only present in some TCNQ complexes and,
together with the stacking behaviour, bears some relation
to the conductivity.
An ideal lattice for high electrical conductivity
is, therefore, one in which the stacking arrangement is
homosoric, there is ideal overlap between the adjacent
(b)
(a)
Figure 1.5
(a) 'Ideal' overlap.
(b) A variation of the overlap.

-14-
TCNQ molecules, and also there is a r~9ular interplanar
molecular separation of approximately O.32nm.This mode of
packing ensures maximum overlapping of the wave functions
of adjacent molecules at minimum Van der Waals repulsion.
Moreover, delocalisation of the electrons occurs
rendering all the TCNQ's equivalent along the stack.
In the intermediate-conductivity class, the
molecules forming the stack are not equivalent, and also
differ in the mode of overlap as well as in the
interplanar spacings. This causes the column to be
divided into repeating units of 2,3 or 4 TCNQ molecules
(Figure 1.4), each group being separated by a larger
spacing than the spacings between molecules within the
group. Furthermore, the overlap is also usually different
within the stack (Figure 1.5(b», and tends to restrict
the unpaired electrons to a particular group of TCNQ
molecules. The existence of these charged
'supermolecules' within the linear one-dimensional stackhas b f' d bIt' t d' 23een con ~rme y e ec ron sp~n resonance s u ~es ,
thereby supporting the X-ray crystallography data.
Although ih is accepted that the physical
properties of these salts is indeed directly related to
the structure, the question still remains as to why such
a variety of structures occurs. There have been many
attempts to explain this in temms of one variable, assumed

-15-
to be the most important parameter. It has been proposed37
that differences in the distortions of the molecular stacks
result from variations in the degree of charge transfer
from donor to acceptor, which in turn is partly determined
by the ionisation potential of the donor and the strength
of the ionic bonding in these materials. The importance
of the donor molecules has also been discussed in terms ofthe' 38,39 , b'l' 25,401r symmetry and polar1sa 1 1ty •
By incorporating into the lattice easily
polarisable molecular cations of the appropriate size and
geometry, a reduction of the effective coulomb repulsion
between the electrons on the TCNQ stack results 41. This
is Closely related to Little's indirect electron-electron
interaction via polarisable side-chains, and so makes
Possible the achievement of more highly-conducting
behaviour. Organic molecules, being large in size, make
Possible a significant reduction of the coulomb repulsion
and give rise to highly-conducting complexes, whereas
salts with metal cations generally have low to intermediate
conductivities.
The similarities between the proposed criteria
for conduction in the TCNQ salts and Little's model
polymer, that is, the one-dimensional conduction pathway
and the role played by polarisation, show why these salts
have been studied so extensively. Furthermore, one of the

-16-
criticisms against Little's theory is the high activation
energy for conduction exhibited by polyene chains42,
whereas Little's theoretical calculations require a small
activation energy. This objection cannot be applied to
TCNQ salts as they have, in general, activation energies
an order of magnitude smaller than for polyene chains.
The situation is extremely complex, with a wide
variety of properties and an even wider variety of possible
explanations and effects to be considered. For example,
Thomas43,suggested that superconductivity is most probably
rendered unattainable in these systems by the presence of
structural imperfections, which affect the continuity of
the conducting spine and the configuration of the polarisable
environment. However, the results obtained with TCNQ
salts are encouraging and progress is being made, even
though a superconducting compound within this family of
Salts has not yet been found.
1.7 REPORTED PROGRESS IN THE SEARCH FOR A SUPERCONDUCTOR
Since Little's theory in 1964, systems similar
to his model polymer have been under intense
investigation, and three of these systems are particularlySuitable:
(a) TCNQ complexes
(b) Square planar complexes of transition metals
(c) Polymeric strands of (SN)x
-17-
Group (a) has had particular emphasis for reasons outlined
in the preceding sections.
The first salts of TCNQ found to exhibit
metallic conductivity were N-methyl-phenazinium(NMP)-TCNQ,
qUinolinium(Qn)-(TCNQ)2 and acridinium(Ac)-(TCNQ)2.However, these salts all undergo a metal to semiconductor
transition at 200K44, 223K45 and 150K46 respectively. All
these cations (Figure 1.6) are large aromatic hydrocarbons
containing a nitrogen atom, therefore fulfilling the
criterion of high polarisability. Also, the linear
stacking behaviour is uniform above the transition
temperature, with the cations surrounding the chains in a
sense reminiscent of Little's polymer. Although not
superconducting, these salts were a step in the rightdirection.
The first indication that an organic
superconductor might indeed be within reach carne with the
preparation of tetrathiofulvalinium(TTF)-TCNQ47. TTF is a
highly polarisable donor (Figure 1.6) and forms a highly
conducting solid with TC~Q, having a unique structure48
markedly different from the other salts. The structure
Shows that the molecules of both species are stacked
Vertically in separate columns, therefore either stack
could provide a facile conduction pathway. The two
radical ions have similar sizes and undergo reversible

ext):)+,. Me
N-methylphenazinium+H
Quinolinium+
()=()
Structures of the cations in some of the metallic TCNQ
H
Acridiniurn+ Tetrathiofulvalene
Hexamethylenetetraselenafulvalene
Diethylpyridiniumethylene2+
Figure 1.6
complexes.

-18-
electron transfer at similar potentials49• These factors
are important in enabling it to assume a structure so
favourable to electrical conduction, yet here lies an
example of the complexity of these systems, as the salt
tetramethyl-phenylenediamine(TMPD)-TCNQ also contains
radical ions of very similar redox potential and size,
but it forms a hetersoric semiconductor.
The electrica147,50 and magnetic51 properties
of TTF-TCNQ have been extensively investigated. A large
number of crystals have been studied giving a conductivityof between 200 and 2000 ohm-l cm-I along the direction of
stacking, with a metal to semiconductor transition at 60K.
However, in a small number of perfectly formed crystals
(3 out of 70), it was observed50 that the conductivity
showed a sharp peak just before the onset of this
transition, with a value nearly 500 times that at roomtemperature.
50This high conductivity peak has been postulated
as being due to superconducting fluctuations at 60K, but
the validity of this observation has been criticised onthe b ' f ' d t' , 't 52 h' has~s 0 m~crowave con uc ~v~ty exper~men s w ~cshow no such anomaly, and on the possibility of
misalignment of electrical contacts which has been shown53
to induce similar high conductivity peaks in TTF-TCNQ.

-19-
In all the TCNQ salts mentioned so far, the
metallic state is unstable and lattice distortions result
in the occurrence of insulating behaviour at low
temperatures. This transition was predicted by Peierls54
and was proposed to occur in one-dimensional metals in
order to lower the kinetic energy of the electrons in the
partially filled conduction band. However, several
complexes have been found to exhibit metallic conductivity
throughout the available temperature region. The first
reported organic material having a stable metallic state
was hexamethylene-tetraselenafulvalenium(HMTSF)-TCNQ55,
the compound having a room temperature conductivity
ranging from 1390 to 2178 ohm-l cm-l and remaining
metallic down to 1.lK. The structure of the cation isshown in Figure 1.6.
Progress has also been made in this department
with the discovery of diethylpyridiniumethylene (DEPE)-
(TCNQ)4' the first complex salt to show a monotonic
increase in conductivity on cooling from room temperature
to 30mK56• The st~ucture of this cation is also shown inFigure 1.6.
Since these findings, work has been focused onunderstanding the unusual properties of TTF-TCNQ and to
explore the effects of chemical modifications in both the
donor and acceptor molecules. The TTF donor has been

-20-
replaced with a similar molecule tetraselena£ulvalene
(TSeF) but the metallic state of the TCNQ salt was not
stable throughout the entire temperature range studied57•
The effect of changing the symmetry of the TTF donor has
also been examined58 using the asymmetric donor trimethylene-
tetrathiofulvalene(t-TTF), but this was found to have a
detrimental effect on the physical properties. Similarly,
studies of the TCNQ salt of tetramethyl-tetraselenafulvalene
(TMTSF), the tetramethyl analog of HMTSF, have been
undertaken59 in an attempt to understand the factors
influencing the stability of the metallic state.
Tetrathiotetracene(TTT), unlike the other donors mentioned,
is not a derivative of TTF, but the complex (TTT) (TCNQ)2
also undergoes a metal to semiconductor transition60•
However, the electrical and magnetic properties of (TTT)2I3
proved more interesting with a recently reported6l stable
metallic state down to 3.3K, but a variety of suggestions
fOllowed62-64 proposing different interpretations of the
observed behaviour. An immense number of variations have
in fact been investigated, the donors being mostly based
on the prototype TTF.
In a similar way, effort has also been directed
towards different acceptor molecules, for example, the bis-
dithiolene(BDT) metal complexes65• The close analogy
between these complexes and TCNQ has been noted66 ~nd they
also form donor-acceptor compounds with organic molecules.

-21-
Tetracyanonaphthoquinodimethane(TNAP) is a larger
molecule than TCNQ with lower symmetry and slightly higher
electron affinity, but the complex TTF-TNAP was found not
to exhibit a stable metallic state67• Similarly, salts of
dicyanonaphthoquinone(DCNQ)68, tetrachlorodiphenoquinone
(TCDQ) and its bromo analog (TBDQ)69, and dichlorodicyano-
benzoquinone (DDQ)70 have also been investigated, but the
resistances observed were discouragingly high.
All these studies were attempts to understand
the important interactions in the organic solid state
governing the physical properties. Although conclusive
explanations are still being sought, the importance of
discovering the cause of stable metallic states in these
compounds is clear, for the metallic state is a
prerequisite for superconduction.
The search for a superconductor has not been
restricted to organic systems and one of the most
interesting classes is that of the square planar complexes
of transition metals. An example of a one-dimensional
metallic conductor is the mixed valence organometallic71compound K2Pt(CN)4BrO.32.3H20 • Here, the linear
conducting chains consist of squares carrying the metal
atom at the centre and cyanide groups at the corners(Figure 1 7 ( ». a • The spacings between the adjacent metal
atoms within the chains can be very short (0.28 to o. 29nm),

(a) L,...~0'_t-7---"CNl-JC~~--T~-+--' CN
(b)
Figure 1.7(a) Structure of K2Pt (eN)4BrO. 32.3H20 showingthe overlapping of the d2 electron orbitals.z
(b) Structure of the inorganic polymer (SN)x.

-22-
giving rise to noticeable overlapping of the d~ electronorbitals.
Although Little's hypothesis has yet to besubstantiated, the most promising development with regard
to this is the polymer polysulphur nitride (SN)x' shown in
Figure 1.7 (b)•This is an exception to most polymers in
which the extent of the electron delocalisation within the
chain is very small. This polymer has been known since
191072 but its significance has only recently been
discovered73• Crystals of this inorganic polymer exhibit
one-dimensional metallic conductivity over a temperature
range extending from 300K to below lK, with a weak maximum
at 33K when measurements are performed along the chain axis.
However, at 0.26K the polymer becomes superconducting and
provides encouragement in the search for a high temperature
superconductor.
1.8 THE ROLE PLAYED BY ELECTRON SPIN RESONANCE IN THE
STUDY OF TCNQ COMPLEX SALTS
Since the discovery of electron spin resonance(e.s.r.) by zavoisky74 in 19~5, this technique has been an
invaluable tool for the chemist, physicist and materials
scientist interested in the properties of solids on an
atomic scale. Biologists have also shown considerable
interest in e.s.r. in a variety of plant and animal
tiSsues and natural products.

-23-
The e.s.r. absorption of a free radical was first
observed7S in 1947 using the compound (C6HS)SCS. This
observation paved the way for the use of e.s.r. in the
investigations of solid CT complexes, which consist of free
radical ions for a strong donor and strong acceptor. Early
work was primarily concerned with establishing whether the
observed paramagetism of such solids was an intrinsicproperty of the solid or arose from impurities, and whether
or not there was a connection between the solid's
paramagnetism and its electrical conductivity.
Bijl, Kainer and Rose-InneslO were the first to
consider the temperature dependences of the e.s.r. signal
intensities of solid CT complexes, the compounds they
studied being a series of complexes based on quinones and
P-phenylenediamines. In all cases, strict conformity to a
CUrie Law dependence was observed, indicative of doublet
state species. Subsequent to this study, an exponential
e.s.r• intensity temperature dependence was reported76 to
be displayed by the perylene-iodine complex. This
indicated that, in this case, the paramagnetism arose from
species residing in higher multiplicities.
Similar results to the above have been obtained with
TCNQ salts although,as previously mentioned, a wide variety of
magnetic excitations is exhibited77• The most commonly
found magnetic behaviour in TCNQ complexes is the existence
-24-
of a strong anti ferromagnetic exchange interaction along
the stacks and the absence of appreciable interaction
between stacks. This results in pairwise spin correlation
with a singlet ground state and a thermally-accessible
excited triplet state. The extent of this interaction is
dependent on the same structural parameters on which the
conductivity depends. Therefore, e.s.r. studies on these
complexes are invaluable in aiding in the interpretation
of the electrical data.
The advantages of e.s.r. over static
susceptibility measurements are listed below and outline
the reasons why this particular technique is so applicable
to the study of this family of organic solids:
(a) E.s.r. is a highly sensitive technique,
allowing both single crystals and uncompacted powders to
be studied. This is important as many TCNQ complexes are
not readily prepared in crystal form.
(b) The wide variety of crystal structures
exhibited by TCNQ complexes results in different spin
interactions, therefore small variations in crystal
structure can be investigated by paramagnetic
sUsceptibility measurements.
(c) The one-dimensional linear arrays of TCNQ
molecules separated by planes of cations result in large
anisotropies, which are very difficult to interpret fromstatic susceptibility measurements.

-25-
(d) The number of paramagnetic sites is readily
established, not requiring knowledge of the diamagnetic
correction, which could introduce errors if not known
precisely.
(e) E.s.r. absorption lines may show a hyper fine
splitting by nuclei in the solid, therefore leading to
information about the localisation of the unpaired electron.
There is a co-ordinated effort in this
department to achieve an understanding of the physical
properties of TCNQ complex salts in the solid state. The
investigations include a.c. and d.c. conductivity, Seebeck
effect, crystal structure and magnetic properties. The
aim of the work presented in this thesis is to investigate,
interpret and correlate the e.s.r. data, obtained using
crystalline and polycrystalline forms of TCNQ complex salts,
with structural and electrical data in order to provide
theoretical models consistent with the physical properties.

CHAPTER 2
MAGNETIC PROPERTIES
"The electron is not as simple as it looks."
Sir William Lawrence Bragg
1890 - 1971
-26-
FORWARD
In the preceding chapter, mention was made of
the three classes into which TCNQ complexes fall. By far
the largest of these is the intermediate-conductivity class
and these compounds exhibit the widest range of magnetic
properties, which are interpreted in terms of triplet
excitons. In this chapter, reference will occasionally be
made, for the sake of simplicity, to doublet state species
in order to explain fundamental aspects of the theory.
However, later in the chapter, a more detailed account of
the theory applicable to triplet excitons in TCNQ complex
salts will be presented.
2.1 MAGNETIC PROPERTIES OF MATTER
All matter is electrical by nature and
consequently has associated magnetic properties. The bulk
magnetic property of a material is known as its magnetic
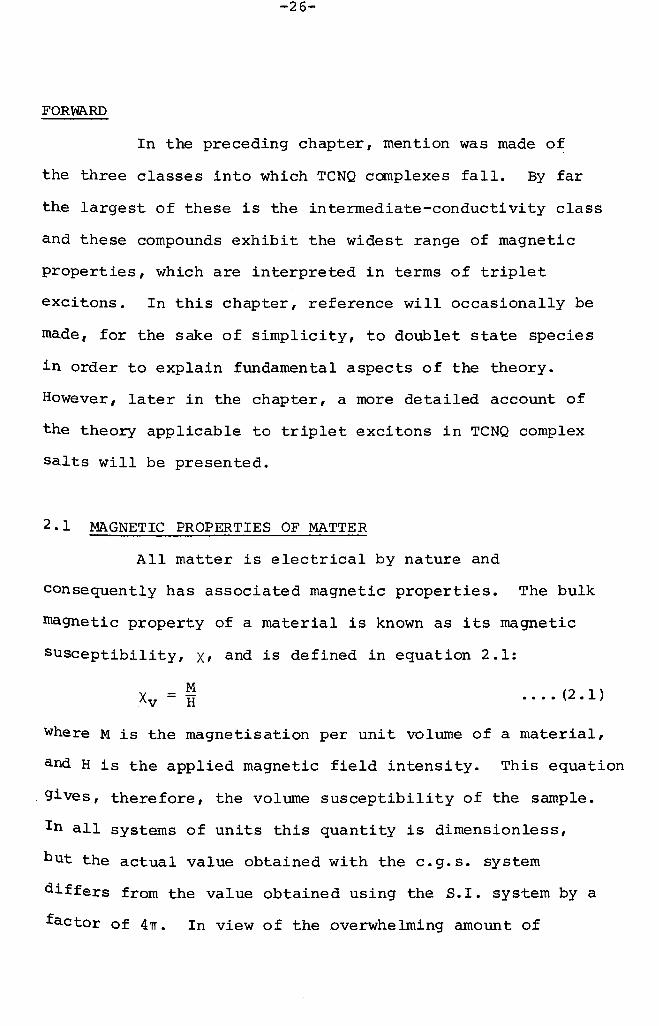
sUsceptibility, X, and is defined in equation 2.1:
MXv = H •.•• (2. 1)
Where M is the magnetisation per unit volume of a material,
and H is the applied magnetic field intensity. This equation
gives, therefore, the volume susceptibility of the sample.
In all systems of units this quantity is dimensionless,
but the actual value obtained with the c.g.s. system
differs from the value obtained using the S.I. system by a
factor of 4TI. In view of the overwhelming amount of

-27-
published work in this field using the non-rationalised
c.g.s. system, all susceptibility values will be in these
units throughout this thesis.
In the c.g.s. system, the volume susceptibility,
although dimensionless, is expressed as electromagnetic
units (e.m.u.). However, magnetic susceptibility can also
be expressed in terms of the sample weight and this can be
calculated from equation 2.2 in which p is the density of
the sample in g -3 The susceptibility would,cm gram
therefore, have units of e.m.u. 3 -1cm g
•••. (2.2)
Similarly, equation 2.3 gives the molar susceptibility in3 -1units of e.m.u. cm mol ,where M.W. is the molecular
weight of the sample.
x M.W. .••. (2.3)
The symbol H, used to represent the magnetic
field intensity in equation 2.1, is also commonly used to
represent the field strength in a sample. This quantity
should be strictly denoted by B, defined in equation 2.4 •
B = H + 4TrM •••• (2.4)
However, the relative difference between Hand B is of the
order 10-6 - 10-7 and so the use of H instead of B is of
no practical consequence in the absence of strongly
magnetic materials. Band H are both expressed in the

-28-
same units (gauss) and, in accordance with the majority of
the literature, H is used in this thesis to represent the
field strength in a sample.
Magnetic susceptibility can have either a
negative or a positive value, and materials having such
susceptibilities are termed as diamagnetic or paramagnetic
respectively (see Figure 2.1). These types of behaviour
are very different and each is dealt with in the following
two sections.
2.2 DIAMAGNETISM
Diamagnetism is associated with the tendency of
electrical charges to partially shield the interior of a
body from an applied magnetic field. This behaviour
results from Lenz's law which states that, when the flux
through an electrical circuit is changed, an induced
current is set up in such a direction as to oppose the
flux change. This induced current persists for as long as
the magnetic field is applied in the case of a
resistanceless circuit, in a superconductor, or in an
electron orbit within an atom. The magnetic field
produced by the induced current is opposite to the applied
field, this resulting in a negative contribution to the
magnetic susceptibility.
By restricting the application of Lenz's law to

:>t+l.~r-I.~.0.~.jJo,IDorJl::lCI.l
I'J.~.jJID~
10'1.Clj~
+
0
--
1
Langevin (free spin)
Paramagnetism .
Van Vleck Paramagnetism.
Temperature
Pauli Paramagnetism
Diamagnetism'
Figure 2.1
Characteristic relative magnitudes of the
rr~gnetic susceptibilities of diamagnetic and
paramagnetic substances.

-29-
monoatomic molecules, the concept of diamagnetism can be
treated using the Larmor theorem78 Briefly, this states
that the motion of electrons around a central nucleus in a
magnetic field is the same, to first order, as the motion
in the absence of the field, except for a precessional
motion superimposed upon the resultant magnetic moment vector.
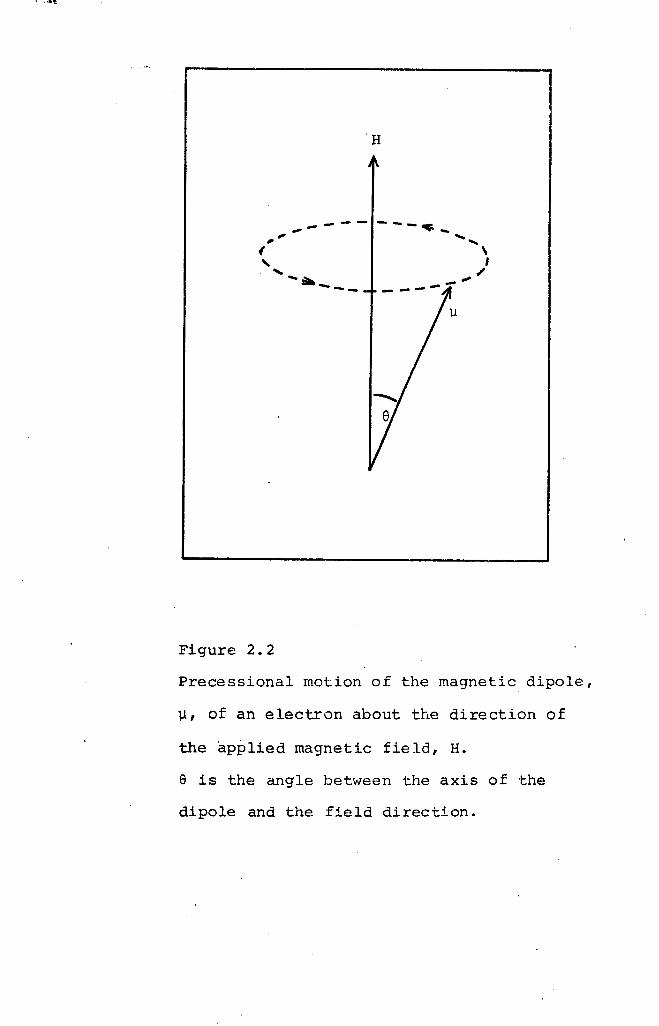
This Larmor precession (Figure 2.2) is in such a direction
as to produce a magnetic moment opposite to the direction
of the applied field. The angular frequency of precession,
W, is called the Larmor frequency and is related to the
applied field, H, by equation 2.5:
W = yH •••• (2.5)
where y is the magnetogyric ratio of the electron, that is,
the ratio of the magnetic moment to the angular momentum.
It is important to note that the precession frequency does
not depend on the angle of inclination,S.
Quantum-mechanical and classical (Langevin)
treatments of this behaviour both result in equation 2.6
for the diamagnetic susceptibility per unit volume •
•••• (2.6)
In this expression, Z is the number of electrons per atom,
N is the number of atoms per unit volume, e and m are the
electronic charge and mass respectively, c is the velocity
of light, and r2 is the mean square distance of the electrons
from the nucleus.
..,------ --- ........" "( ,, ," ./-~---
Figure 2.2
Precessional motion of the magnetic dipole,
~, of an electron about the direction of
the applied magnetic fie la, H.
Elis the angle between the axis of the
dipole and the field direction.

-30-
It can be seen from equation 2.6 that the
problem o£ calculating the diamagnetic susceptibility is
reduced to the evaluation of r2, which amounts to the
determination of the electron charge distribution within
the atom. Also, since the value of r2 is practically
unaltered by temperature, the susceptibility of a
diamagnetic substance is temperature independent to agood approximation.
The derivation of the Larmor theorem assumes
that the field direction is an axis of symmetry of the
system and, therefore, equation 2.6 only applies to atoms
and mononuclear ions. In most molecular systems this
condition is not satisfied, and the treatment of this
situation results in the addition of an extra term in the
equation for the susceptibility. This second term is
known as Van Vleck paramagnetism and will be discussed
in section 2.3.2.
The work of Pascal79is generally accepted as
having paved the way in the study of the diamagnetism of
compounds and is still widely used as a basis for the
calculation of diamagnetic corrections. However, more
sophisticated equipment and a deeper theoretical knowledge
have resulted in additive formulae which allow for more, t' 80accurate est1ma 10ns • Evaluation of the diamagnetic
susceptibility of organic molecules is complicated by the

-31-
fact that the law of additivity must be supplemented with
structural contributions, and by the frequently strong
anisotropy of ring molecules. This is one reason why the
study of magnetic properties of organic anion radical salts
is best accomplished using e.s.r., which requires no
knowledge of the diamagnetic correction.
2.3 PARAMAGNETISM
Electronic paramagnetism (positive contributionto X) is found in:
(a) Atoms, molecules, and lattice defects
possessing an odd number of electrons, as here the total
spin of the system cannot be zero.
(b) Free atoms and ions with a partly filledinner shell.
(c) A few compounds with an even number of
electrons, but in which two or more are unpaired, for
example, molecular oxygen, and excited triplet states.(d) Metals.
Paramagnetism can be wide ranging in both its magnitude
and temperature dependence, and can be classified into
three groups, each of which will be individually discussed
in the following sections.
2.3.1 The Curie Law
The most commonly found paramagnetic behaviour
is where the susceptibility is inversely proportional to

-32-
temperature and is associated with the existence of
permanent magnetic dipoles within the sample. The
electrons in a system are known to be spinning about
their own axes and, having mass, they possess angular
momentum. It is by virtue of this fact that an electron
has associated with it a magnetic dipole, the magnitude
of which is usually discussed interrns of its magnetic
moment, ~ (the underlining denotes a vector quantity).
This magnetic moment is related to the angular momentum
by equation 2.7.
~ = -g x S x Angular Momentum .••. (2.7)
The symbol S represents the Bohr magneton which is defined
as eh/4nmc, where h is Planck's constant and e, m and c
represent the same quantities as defined in equation 2.6.
The introduction of S into the equation arises from the
quantum-mechanical result that angular momentum is
quantised and can only take values which are integral
multiples of h/2n. The quantity g is a dimensionless
constant called the spectroscopic splitting factor and is
used in the equation to allow for the various ratios of
spin and orbital momenta (having the quantum numbers s
and ~ respectively for a single electron) which make up
the total angular momentum. If the electron only possesses
orbital angular momentum, g is equal to 1 whereas, for an
electron possessing only spin angular momentum, quantum-
mechanics shows g to be equal to 2.00232.

-33-
For systems with more than one electron, angular
momenta are combined vectorially to give a resultant,
designated by quantum number~. The usual procedure for
doing this is known as Russell-Saunders coupling, which
involves obtaining the vector sumsL and ~, of ~ and ~
respectively for all the electrons, the vector sum of L
and ~ then giving J.
For a free atom or ion, the spectroscopic
splitting factor can then be calculated from the Lande
equation given by equation 2.8.
g = I + J (J+ I )+S (S+ I ) - L (L+I )
2J(J+I)•••• (2.8)
However, this has different values for an atom or ion in a
crystal because the part of the magnetic moment arising
from the orbital motion of the electrons is modified by the
crystalline electric field. In some cases, where this field
removes the orbital degeneracies, the orbital moment is
greatly reduced (quenched) and g may then be very close to
that of a free electron. Consequently, the g value cannot
then be calculated and becomes an experimental parameter.
In a paramagnetic sample the individual dipoles
align themselves along the direction of an applied magnetic
field, so that the material possesses a resultant
magnetisation. However, the tendency towards parallel
orientation of the dipoles is opposed by thermal motion
-34-
within the lattice and this results in an inverse
relationship between the susceptibility and temperature.
This type of behaviour is governed by the Curie law, theclassical derivation of which was given by Langevin using
Boltzmann's statistics. The quantum-mechanical treatment81
involves the occupancy of all the possible J states, with
population differences following the Boltzmann distribution
as before, and results in equation 2.9 for the volume
susceptibility.
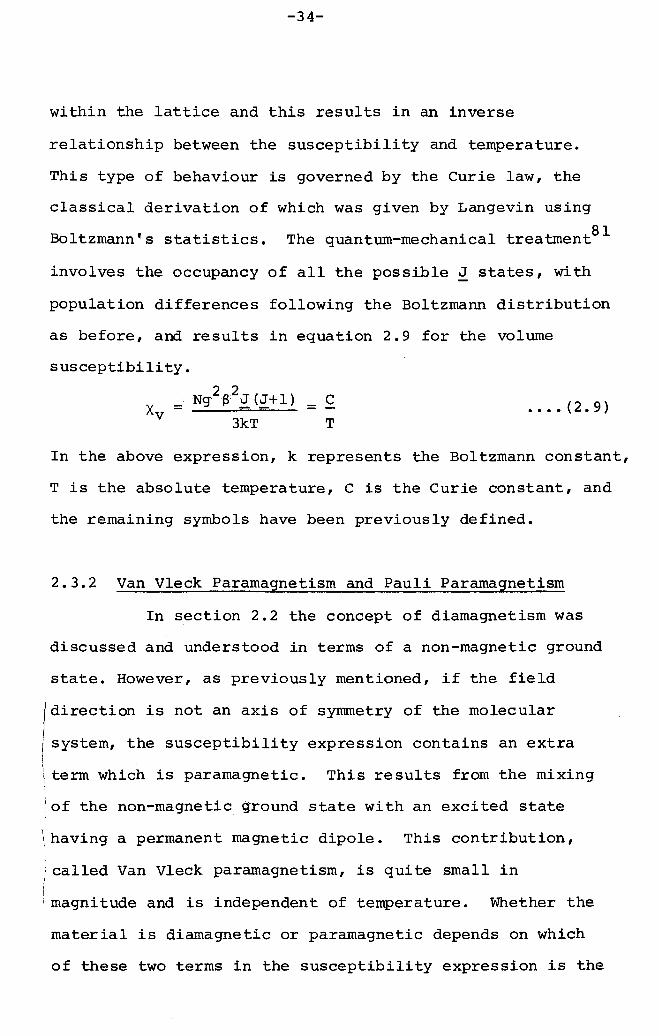
= Ng2S2J(J+I) = CXv •••• (2.9)3kT T
In the above expression, k represents the Boltzmann constant,
T is the absolute temperature, C is the Curie constant, and
the remaining symbols have been previously defined.
2.3.2 Van Vleck Paramagnetism and Pauli Paramagnetism
In section 2.2 the concept of diamagnetism was
discussed and understood in terms of a non-magnetic ground
state. However, as previously mentioned, if the field
direction is not an axis of symmetry of the molecular
system, the susceptibility expression contains an extra
term which is paramagnetic. This results from the mixing\
'of the non-magnetic ground state with an excited state
having a permanent magnetic dipole. This contribution,
called Van Vleck paramagnetism, is quite small in
magnitude and is independent of temperature. Whether the
material is diamagnetic or paramagnetic depends on which
of these two terms in the susceptibility expression is the
-35-
greater.
I Pauli, independent and/
paramagnetism is also temperaturequite small in magnitude. It is the type
of magnetic behaviour exhibited by metals and arises from
the conduction electrons, which might be expected to follow
Curie law behaviour. However, the observed magnitude and
temperature dependence of the paramagnetism differs fromthat expected from classical free electron theory. The
correction of the theory to account for the paramagnetic
behaviour of metals was made by Pauli82 by application of
the Fermi-Dirac distribution function.
In order to observe Curie-type behaviour, the
dipoles within a material must align themselves along the
direction of the applied magnetic field, and the net
magnetisation results from the greater probability of
parallel alignment to that of antiparallel alignment.
Most conduction electrons, however, have zero probability
of turning over when a field is applied because most
electrons are spin-paired in orbitals. This results from
the band structure of metals which require that all
electronic states up to the Fermi level are doubly
occupied at absolute zero. Therefore, at this temperature,
there are no unpaired electrons to contribute to the
susceptibility but, as the temperature is increased, the
electrons within a range kT of the top of the Fermi
-36-
distribution are unpaired and have a chance to turn over
in the field. This small percentage of the total number
of electrons is the reason for the very small paramagnetic
susceptibility observed, which is given by equation 2.10:
•••• (2.10)
where EF represents the Fermi energy.
In the derivation81 of the above equation, the
spatial motion of the electrons was assumed to be not
affected by the magnetic field. However, the wavefunctionsare indeed modified by the magnetic field and Landau83 hasshown that, for free electrons, this causes a diamagnetic
effect equal to one third of the paramagnetic contribution.
Therefore, the resulting expression for the paramagnetism
of metals is given by equation 2.11.
= NS2 .••• (2.11)EF
This can also be of the form given in equation
2.12 where ~ is the molar susceptibility and NF is the
density of states at the Fermi leve184•~ = 64 x 10-6 x NF •••• (2.12)
2.3.3 Ferromagnetism, Antiferromagnetism and Ferrimagnetism
Ferromagnetism, antiferromagnetism and
ferrimagnetism are three groups of magnetic behaviour which
are known collectively as co-operative phenomena. \A ferro-

-37-
!magnet is a material having a magnetic moment even in zero
applied magnetic field, which indicates that the electron;
spins and their dipoles are arranged in a regular manner!
This orientation must be due to some internal interaction
te~ding to line up the magnetic moments parallel to eachother. ~85 was the first to postulate an internal
magnetic field, as well as being referred to as the Weiss
fiald. The orienting effect of this field is opposed by
thermal agitation and, at elevated temperatures, the spin
order is destroyed. Consequently, the spontaneous magneticmoment is only present in a certain temperature range, and
the temperature above which this magnetisation vanishes is
known as the Curie temperature, Tc. Below T , the materialcexhibits ordered ferromagnetic behaviour and, above T , acdisordered paramagnetic phase results which follows a
temperature dependence governed by the Curie-Weiss law,
given in equation 2.13.
•••• (2.13)
This expression describes fairly we,ll the observedsusceptibility variation in the paramagnetic region.
However, detailed calculations predict a slightly different
behaviour at temperatures close to T , in general agreementcwith experimental data, and the resulting expression isgiven in equation 2.14.
c ••.• (2.14)(T-8 )
-38-
The symbol e has a value which is appreciably greater
than the actual transition temperature, T •c
In an antiferromagnet, a similar ordering is
present, only in this case the spins are arranged equally
upon two sublattices. The dipoles upon each sublattice
are antiparallel to those on the other. As there are an
equal number of dipoles on each sublattice, there results
a zero net moment in the temperature region where ordering
is present. However, once again thermal energy destroys
\the order and the point at which this occurs is known as
ithe Neel temperature, TN. The magnetic behaviour of an
antiferromagnetic also follows the Curie-Weiss law but with
a slight modification, shown in equation 2.15.; CIx =/ V (T+e)
•••• (2.15)
All the symbmls in the above equation have been previously
defined.
The term ferrimagnetic was originally used to
describe an important class of magnetic oxides known as
ferrites. This magnetic behaviour is very similar to the
two types already discussed, ordering of the spins again
being present. As in the antiferromagnetic case, a two
!sublattice model is applicable but the spins are notIlarranged equally between each sublattice. Instead, there
\is an excess of spins having a particular orientation.

-39-
This results in a spontaneous magnetisation below T , whencthe ordering is present.
Although all three types of behaviour are very
similar, the magnitudes of their interactions with a magnetic
field are considerably different. For a ferromagnetic material,the interaction is very strong, whereas the antiferromagnet
exhibits a negligible interaction, and a ferrimagnetic
material is intermediate between the two.
2.4 ELECTRON SPIN RESONANCE
It is a fundamental postulate of the quantum
theory that electrons possess angular momentum in integral
multiples of a basic unit. Consequently, the associated
magnetic moment must also be quantised, corresponding to a
finite number of possible orientations with respect to an
external magnetic field. Each orientation represents a
discrete energy level and transitions between them may be
induced, under appropriate conditions, by interaction with
electromagnetic radiation. For a single unpaired electron
in a doublet state, there are only two possible
orientations, with the axis of the magnetic dipole
approximately parallel or antiparallel to the direction of
the external magnetic field. By absorbing energy from
'the electromagnetic radiation, the spin of the electron can
be reversed. It is this phenomenon which forms the basis
of the electron spin resonance method of studying para-

-40-
magnetic materials. In order to explain this techniquemore fully, it is necessary to examine the way in which
the magnetic properties of the electron follow from its
orbital and spin motion, and how the resulting dipole
interacts with a magnetic field. These concepts will beoutlined in the next two sections and will be followedby a discussion of the conditions necessary for energy
absorption to occur.
2.4.1 Magnetic Properties of the Electron
In atoms and molecules, electrons move aroundthe nuclei in orbitals, and it is the motion of the electron
which produces a magnetic dipole momen~. The phenomenon of
orbital angular momentum was used by Bohr86 to predict the
position and number of lines observed in the hydrogenatomic absorption spectra. However, it was found that
Bohr's theory did not explain the absorption spectra of the
more complicated atoms, and did not predict the doublets
observed in the spectra of alkali metals. This indicated
that the description of the energy levels in terms of
orbital angular momenta alone was inadequate. Uhlenbeck
and Goudsmit87 postulated the existence of an additional
angular momentum term associated with the rotation of the
electron about its own axis. Evidence in support of
electron spin followed when pauli88, at approximately the
same time as Darwin89, produced a wave equation for the
electron which incorporated this concept. Further
evidence also became available when Dirac90 showed that

-41-
the solution of the Schrodinger equation resulted in spin
momentum, after allowance had been made for a relativisticcorrection.
Like orbital momentum, spin momentum is also
quantised and this was demonstrated most effectively by. 91 92the Stern-Gerlach exper~ments ' A beam of alkali
metal atoms was passed through a strong inhomogeneous
magnetic field which provided a deflecting force, the
direction of the deflection depending on the orientation
of the dipole. If only two quantised spin states are
possible, the atoms should emerge in two narrow beams
rather than in a diffuse band, and this is exactly the
behaviour observed.
The magnitude of the magnetic moment associated
(With the spinning electron has approximately twice the
value of the moment associated with its orbital momentum,II
and it is the combination of both these momenta which
determine the resultant magnetic moment, ~, as described
in section 2.3.1. The practical significance of the
relations between orbital and spin angular momenta and
the associated magnetic moments may be illustrated by
considering their interaction with a magnetic field.
2.4.2 Interaction of a Dipole with a Magnetic Field
The energy of a magnetic dipole of moment ~ in

-42-
a field H is given by equation 2.16.
E = - ~Hcos8 = - ~.H •••• (2.16)
where e is the angle between the axis of the dipole and
the field direction (see Figure 2.2). Therefore, different
orientations of the electronic magnetic moment vector
correspond to different energies. However, quantisation
restricts the number of possible orientations. For an atom
with total angular momentum~, there are (2J+l) possible
orientations, designated by a magnetic quantum number with
the values MJ = J, J-l, J-2, •••• -J. This quantum number
is the component of the total angular momentum in the
direction of the applied field, and only these values have
physical significance.
If the magnetic moment is derived from spin
angular momentum only, i.e. ~ = 0, MJ may be replaced by
MS' The constant component of the magnetic moment in the
field direction is then given by equation 2.17:
l1S = -gBM S •••• (2.17)
where g is the spectroscopic splitting factor and MS = S,
S-l, •••• -So The symbol S denotes the total spin
angular momentum and, for a system containing n electrons,
can take the values n/2, (n/2)-1, •••• -n/2. The
corresponding energy levels for the atom are, therefore,
given by equation 2.18.
E = g(3MSH •••• (2.18)

-43-
Similarly, if the atom has a magnetic momentderived from orbital angular momentum only, i.e. §. = 0,
the allowed energy levels in the presence of a magnetic
field are given by equation 2.18 in which g equals one and
2.4.3 The Resonance ConditionIn the absence of a magnetic field, the energy
levels discussed in the last subsection are degenerate.
However, the application of a magnetic field removes this,i
(I:
degeneracy and this phenomenon is known as the Zeeman
effect. The splitting of the energy levels allowstransitions to occur between them, if the required energy
is available. In order to explain the conditions which
govern these transitions, the simple case of a free spin
will be discussed, that is, a single electron having no
orbital angular momentum.
The spinning motion of the electron can be
clockwise or anticlockwise and results, therefore, in only
two spin states, which are degenerate in the absence of amagnetic fie1do The magnitude of the spin angular
momentum for a single electron is ~h/2 1T, where h/21T is thebasic unit postulated by Bohr" Consequently, an electron
is commonly referred to as having a spin of~. The spin
state resulting from anticlockwise rotation 1S denoted as
the S, or 'spin-down' state and corresponds to the situation

-44-
in which the dipole moment is parallel to the magnetic
field. Clockwise rotation results in an antiparallelalignment of the dipole moment with the field and is
referred to as the 'spin-up' or a state. Consequently,
the moments associated with the two spin states are in
opposite directions. These components of the spin
angular momentum for a single electron are often denoted
by the quantum number m , which is equal to +~ for the asstate and -~ for the S state.
Substituting these two values into equation 2.1Syields equations 2.19 and 2.20 which give the energies,
E , of the two spin states in a magnetic field.ms= •••• (2. 19 )
E_~ = -gBH2 .••• (2.20)
The energy difference, ~E, between these two Zeeman levels
is, therefore, given by equation 2.21.
~E = g,6H •••• (2.21)
It can be seen from this equation that the difference
between the energy levels can be varied by changing the
magnitude of the magnetic field H and, if g is constant,
the divergence of the levels will be linear with field
(Figure 2.3)•
Transitions between the Zeeman levels can be
induced by the introduction of electromagnetic radiation

Energy
m =+~s
~E=gI3H=hv
H
Figure 2.3
Zeeman energy levels for a single unpaired
electron as a function of the magnetic field,H.

-45-
, of frequency v such that the quantum of energy equals the
separation of the levels. The resonance condition is,
therefore, given by equation 2.22.
hv = gBH .••• (2.22)
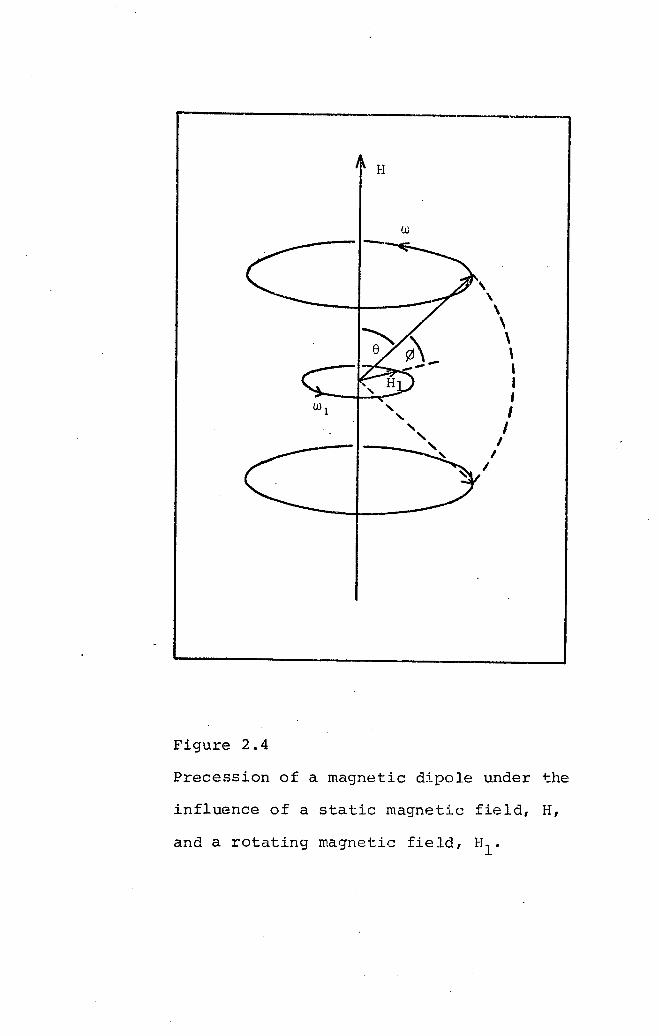
The interaction which causes the transitions is
between the precessing magnetic dipole of the electron and
the oscillating magnetic field accompanying the electro-
magnetic radiation. Consider the application of a field,
HI' perpendicular to H. The dipole, ~, will experience an
additional torque, ~Hlcos~, tending to cause precession
about HI (Figure 2.4). At this point it is important to
note that the oscillating magnetic field can be regarded as
the combination of two magnetic vectors rotating with the
same frequency but in opposite directions. One of these
vectors will be rotating in the same direction as the
precessing dipole and, if this component is rotating about
H with the same frequency as the dipole, a change in ewill result. Since a change in e corresponds to a change
in energy of the system, and there are only two allowed
energy states for a single electron, the induced transition
corresponds to the dipoles being 'flipped' from the
parallel to the antiparallel state. In general, where there
are more than two possible energy levels, the selection
rule for such transitions is ~MJ = ±l.
In the case discussed above for the single
w
H
,\\\\\,I,IIIII
Figure 2.4
Precession of a magnetic dipole under the
influence of a static magnetic field, H,
and a rotating magnetic field, Hlo

-46-
unpaired electron, energy is absorbed by the sample, but
induced emission can also occur with equal probability
corresponding to the reverse process. If the system
remains in thermal equilibrium, more spins are in the
parallel state because of its lower energy, so that there
is a net absorption of power from the electromagnetic
radiation. The number of spins in the sample under study
can be determined by the power absorbed and it is the
detection of this absorption that forms the basis of e.s.r.
spectroscopy.
So far in this section, the fundamental principles
of e.s.r. have been outlined using the simplest case of a
free electron. Detailed accounts involving more complicated
examples can be found in references 93 and 94 and other
standard texts on this subject.
Having established the conditions under which
resonance absorption occurs, it is now necessary to
investigate the various other interactions involved in order
to interpret the spectra obtained using the technique of
e.s.r.
2.4.4 Relaxation Processes
It has been established that resonance absorption
occurs because the population of the ground state and the
upper state are not equal. However, if this were the only

-47-
process taking place, clearly the populations would rapidly
be equalised and absorption would cease. Since the system
must return eventually to the original Boltzmann
distribution when the cause of the disturbance is removed,
there must be a mechanism acting to restore the equilibrium.
Such a mechanism is called a relaxation process, this
concept first being introduced into magnetic resonance by
Bloch95• Although originally formulated to describe the
dynamic magnetic behaviour of nuclear spins, his theoretical
treatment also applies in principle to electron spins, and
the resulting Bloch equations form the basis of the study of
relaxation.
One of the ways in which an electron in the
upper state can lose its absorbed energy and return to the
lower state is by spin-lattice relaxation. This implies a
coupling between the species with the unpaired electrons
(spin system) and the surrounding molecules known as the
lattice. It is this interaction which provides the
dominant relaxation process in e.s.r., and is characterised
by a relaxation time TI, which is the time for the spin
system to lose l/eth of its excess energy.
Another relaxation process is one whereby a spin
can communicate its energy to another spin. Although such
interactions are not energy dissipating and, therefore, do
not contribute directly in returning the spin system to

-48-
equilibrium, the spin-lattice transition may become enhanced
if the spin-spin process brings the excess energy to a
position for a favourable transition. The spin-spin or
transverse relaxation time, T2, is the time taken for this
energy transfer between spins to take place and is often
much more rapid than spin-lattice relaxation. Consequently,
it is usually considered that spin-spin relaxation is the
mechanism which keeps the spin system in internal
equilibrium and that this system as a whole then relaxes
to the lattice.
For the population difference to be maintained
and resonant absorption to continue, it is essential that
the dissipation of the excess energy is rapid, that is,
the relaxation times must be short. Slow relaxation times
can cause the populations of the upper and lower spin
states to approach equally so that the rate of absorption
of energy diminishes. This is known as saturation and is
always avoided experimentally by ensuring that the energy
from the microwave field is supplied to the spin systemless rapidly than it can be transferred to the lattice.
2.4.5 Lineshapes and Linewidths
It is now possible to comment on the width and
the shape of the resonance absorption line. Lineshapes
are determined by the types of interactions between the
spin- system and its environment while the widths depend on
-49-
the strength of the interaction and the relaxation time.
It might be expected that all spins would absorb
energy at one particular value of the magnetic field H.However, the existance of relaxation processes results in
a broadening of the absorption line. Any mechanism which
reduces the lifetime of the spin state causes acorresponding uncertainty in the energy content according
to the Heisenberg uncertainty principle. This means that
the energy absorption from the constant frequency oscillating
field occurs over a range of magnetic field, resulting in an
absorption line of finite width, which is inversely related
to the relaxation time. Weak interactions between the spin
system and its environment lead to long relaxation times
and narrow lines, whereas short relaxation times and wide
lines result from strong interactions.
In a simple homogeneous sytem, where relaxation
is controlled by spin-lattice interactions and the energy
absorbed from the radiation field is distributed so that
the spin system maintains thermal equilibrium throughoutthe resonance process, the Bloch equations predict the
lineshape should be Lorentzian (Figure 2.S(a».
In an inhomogeneous spin system, the individual
electrons find themselves in differing local magneticfields. If the spin-spin interaction is slow compared

Energy
Absorption
(a)
(b)
Figure 2.5
E.s.r. absorption curves
(a) Lorentzian lineshape.
(b) Gaussian lineshape.

-50-
with the relaxation to the lattice, the spin system will
not reach thermal equilibrium and the absorption curve
will have a Gamssian shape (Figure 2.5 (b)).
Therefore, the actual shape of the absorption
curve is determined by the dominating relaxation process.
However, the energy levels in spin systems can be
broadened in various other ways, thereby adding to the
linewidth. These sources of line broadening can be
categorised96 as homogeneous or inhomogeneous and are
given below:
Homogeneous:
(a) Dipole-dipole interaction between like spins.
(b) Spin-lattice relaxation.
(c) Interaction of spins with the radiation field.
(d) Motion of the unpaired spins in the microwave
field.
(e) Diffusion of the spin system excitation
through the paramagnetic sample.
(f) Motionally narrowed fluctuations in the local
field.
Inhomogeneous:
(a) Hyperfine interactions.
(b) Anisotropy of the splitting of the spin levels.
(c) Dopolar interactions between spins with
different Larmor frequencies.(d) Inhomogeneities in the applied magnetic field.

-51-
The spin system as a whole remains in thermal
equilibrium throughout spin resonance only if the line
broadening effects are homogeneous, and Lorentzian
lineshapes result. In the case of inhomogeneous broadening,
different groups of spins experience differing local fields
which may arise from any of the points listed above in this
category, and result in a Gaussian shape.
2.4.6 Fine Structure
In section 2.4.2, mention was made of the number
of allowed energy levels for an atom in an applied magnetic
field. For an atom having a total spin S, there are (2S+1)
levels and the situation for S=~ has been previously
discussed. However, many situations occur for which S>~
and more than two magnetic levels result. In the presence
of crystalline electrostatic fields, the degeneracy of
these energy levels may be removed even in the absence of
an external field, this phenomenon being known as zero-
field splitting. Such a situation is illustrated for the
case of s=3/2 in Figure 2.6. Transitions occur, governed
by the selection rule t:.M=±l,between the energy levels but
the observed lines are situated at different field values.
The multiple spectral lines are called fine structure and
their relative positions will depend on the orientations
of the crystal in the magnetic field. This is because the
crystalline fields are essentially anisotropic in nature,
being governed by the symmetry of the crystal.

Energy
H
3Energy levels for a sys t.em with spin s= /2 as a
(a)
(b)
(a) With no zero-field splitting, givi'ng only one
Figure 2.6
function of the magnetic field, H.
absorption.
(b) With zero-field splitting, giving three
absorption peaks.

-52-
The specific case of this effect for a triplet
state species, having 8=1, involves the magnetic dipolar
interaction between two electrons, and will be discussed
in more detail in section 2.5, which deals with the
theoretical models applicable to TCNQ complex salts.
2.4.7 Nuclear Hyperfine Structure
If the nucleus of the paramagnetic atom also
possesses a resultant angular momentum and hence a
magnetic moment, this will interact with the magnetic field.
Nuclear spin is, of course, also quantised and there are
(2I+l) possible orientations of the nuclear magnetic moment
vector with respect to the field. The symbol I is thenuclear spin value and MI is the nuclear magnetic quantum
number. The interaction of the nucleus with the field is
very much smaller than that of the electron. Consequently,
the interaction of the unpaired electrons, having (28+1)
allowed energy levels, with such a nucleus causes each
electronic energy level to be subdivided into (2I+l)
components. Figure 2.7 illustrates this for the simplest
case of an atom with 8=~, I=~ and L=O. In this diagram,
the allowed transitions are shown and correspond to the
selection rule ~M8=±1, ~MI=O. As in the case of zero-field
splitting, multiple spectral lines are observed and this
additional splitting due to magnetic nuclei is known as
hyperfine structure.

~-----------+-------+------~~II
Energy
m =+~s
m =-~s
Figure 2.7·
hv
Energy levels and hyper fine splitting for a
+~
system with S=~, I=~, L=O, as a function of
magneti c fie Id, H.

-53-
2.4.8 Exchange Interactions
When paramagnetic atoms are brought close together,
the orbitals of the unpaired electrons overlap and this
gives rise to the quantum-mechanical concept of exchange.This treatment takes into account the impossibility of
identifying the electrons in this situation with particular
atoms. The energy of this interaction, for atoms i and j
bearing spins S. and S., contains the term given in equation1 J
2.24.
U = -2JS .• S.2. _2•.•• (2.24)
In the above expression, J is the exchange integral for the
atoms i and j and is related to the overlap of the charge
distr ibutions.
The charge distribution of a system of two spins
depends on whether the spins are parallel or antiparallel,
for the Pauli principle excludes two electrons of the
same spin from being at the same place at the same time.
Therefore, the electrostatic energy of a system will depend
on the relative orientation of the spins. The difference
in energy is called the exchange energy and has an exchange
frequency associated with it.
The importance of exchange lies ren its effect on
lineshape and linewidth. A strong indication of the
presence of exchange interactions is the change from a

-54-
Gaussian to a Lorentzian line shape • However, although
strong exchange will narrow the e.s.r. line, it will not97shift the Larmor absorption frequency •
A further effect of strong exchange in crystals
is the collapse of any nuclear hyperfine interactions.
The initial effect is to broaden the hyperfine lines, and
may even cause them to coalesce to give a single Lorentzian
line, in which case the hyperfine spli t.t.Lnq s:have been
effectively reduced to zero.
2.4.9 Convention of the Spin Hamiltonian
It is apparent that there are many interactions
and effects to be considered when interpreting the
absorption spectra in e.s.r. The usual approach to the
theoretical problems of this sort is to express the
interactions affecting the electronic energy levels in
terms of Hamiltonian operators, each one representing theeffect of a particular interaction. The sum of these
gives the total Hamiltonian which describes the electronic
interactions contributing to the total energy of the atom.
Calculations with the total Hamiltonian are very
difficult, therefore a simplified accounting of the most
likely interactions is performed with a spin Hamiltonian,98originally developed by Abragam and Pryce • The
permitted energy levels of the spin system in a magnetic
-55-
field can be obtai.ned from this spin Hamiltonian,
represented by fr, using the following operator equation:
jt 1[; = Eo1[; •••• (2. 2 3 )
where E represents the eigenvalues corresponding to theopermitted energy levels, and 1[; represents the wave
functions of the effective spin states.
The magnitudes of the various terms in this
Hamiltonian are measured by such parameters as the g factor,
the zero-field splittings, and the hyperfine structure
constants, all of which are experimentally observable.
2.5 MAGNETIC PROPERTIES OF TCNQ COMPLEX SALTS
The intermediate-conductivity class of TCNQ
complexes is by far the largest group and has wide
ranging magnetic properties. The low and high-conductivityclasses, however, have rnaqne t.Lcproperties which are
usually readily interpreted and not so wide ranging. In
general, the complexes exhibiting very low d.c.
conductivities have been found to be essentiallydi ,24 d t hIll '1~amagnet~c an 0 ave on y very sma e.s.r. s~gna s,
99the behaviour of which approximately obeys the Curie law •
The complexes designated as metallic, however, have
generally been observed to display Pauli paramagnetism24,
with a Curie law contribution superimposed upon this, which
is normally attributed to the presence of defects in thelatt' 100~ce .

-56-
The work presented in this thesis has been
entirely devoted to TCNQ complex salts in the intermediate-
conductivity class, that is, compounds containing formally
neutral TCNQ molecules in addition to the anion radicals,
and which exhibit semiconducting behaviour. Therefore,
the following discussion will be concerned with the
observed magnetic properties and proposed interpretations
for the complex salts which fall into this group.
2.5.1 Triplet Excitons
Mulliken's treatmentlOl of CT complexes
considered the ground state to be non-ionic in character.
However, it was proposedlO that a predominantly ionicground state could be achieved using component molecules of
very different electron affinities. Furthermore, it was
suggested that the free radicals obtained in this situation
could interact in the solid state to produce magnetic states
of higher multiplicities than the simple doublet state of a
single unpaired electron.
/Iwas! and
An exchange interaction between electron pairs
considered which gives rise to a ground singlet state
a thermally acce~sible triplet as the first excited
state. The semiconducting TCNQ complex salts represent
such a case and the resulting excitations have become
known as triplet excitons, the size of which is approximately
a unit cell along the chain. /Since the ground state is the

-57-
singlet and the triplet state is higher in energy, the
interaction is said to be anti£erromagnetic and the energy
gap between the two states is given by J. At absolute zero,
the triplet state will not be populated but, as the temperatureis raised, thermal energy excites the electrons into this
excited state.
The singlet state is the energy level occupied by
two electrons o£ opposite spin, there£ore giving an e££ective
spin of s=o and no e.s.r. absorption. The triplet state,
however, consists o£ three degenerate energy levels andtriplet excitons have magnetic properties characteristic of
an effective spin of S=l. In the presence of an applied
magnetic field, the degeneracy is removed and e.s.r.
transitions can occur between these three Zeeman levels.
The observed paramagnetism will, therefore, increase as the
temperature is increased and the triplet state becomes more
populated. The temperature dependence of the intensity I
of the e.s.r. absorption, for the case of a ground singlet10state and a thermally accessible triplet state, was £ound
to be that given in equation 2.25:/ IT cc (exp (J/kT) + 3)-1 •••• (2.25)
where J is the energy difference between the singlet and
triplet states, and k and T are as defined for equation 2.9.)
The above expression was found to be a very good
explanation of the activated paramagnetism exhibited by the

-58-
earliest semiconducting TCNQ complex salts investigated23,I02.
This provided evidence that the unpaired electrons associated
with the stacked TCNQ molecules were indeed correlated, for
a Curie law temperature dependence is expected for electrons
having no such interaction.
The early investigations showed that TCNQ complex
salts had very interesting magnetic properties, and were
the start of intensive studies of the temperature dependence
of the magnetic susceptibilities of these compounds. It was
in such a study that equation 2.26 was introduced byKepler24•
2Ng2f32 IX = - (3 + exp(J/kT))-kT
•••• (2.26)
All the symbols in the above expression have been
previously defined. However, if the susceptibility is a
molar value, then N is Avogadro's number. This expressionI
jadequately described the behaviour of some of the
semiconducting complex salts but was found not to agree
with the observed magnitudes of the susceptibilities for
others. Consequently, a temperature dependent value of J
was introduced to account for the discrepancies, and this
stimulated interest in more theoretical treatments of
triplet excitons.
As previously mentioned, TCNQ complex salts have
characteristic one-dimensional arrangements 0; the TCNQ
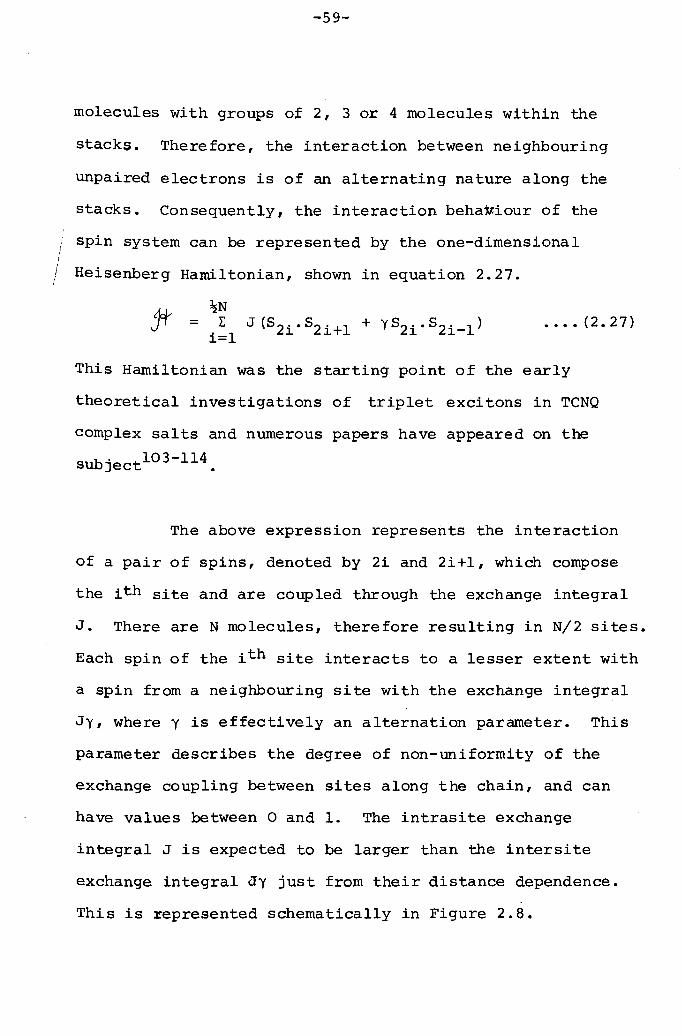
-59-
molecules with groups of 2, 3 or 4 molecules within the
stacks. Therefore, the interaction between neighbouring
unpaired electrons is of an alternating nature along the
stacks. Consequently, the interaction beha~iour of the
spin system can be represented by the one-dimensional
Heisenberg Handltonian, shown in equation 2.27.
= •••• (2.27)
This Hamiltonian was the starting point of the early
theoretical investigations of triplet excitons in TCNQ
complex salts and numerous papers have appeared on thesubjectl03-ll4.
The above expression represents the interaction
of a pair of spins, denoted by 2i and 2i+l, which compose
the ith site and are coupled through the exchange integral
J. There are N molecules, therefore resulting in N/2 sites.
Each spin of the ith site interacts to a lesser extent with
a spin from a neighbouring site with the exchange integral
Jy, where y is effectively an alternation parameter. This
parameter describes the degree of non-uniformity of the
exchange coupling between sites along the chain, and can
have values between 0 and 1. The intrasite exchange
integral J is expected to be larger than the intersite
exchange integral Jy just from their distance dependence.
This is represented schematically in Figure 2.8.
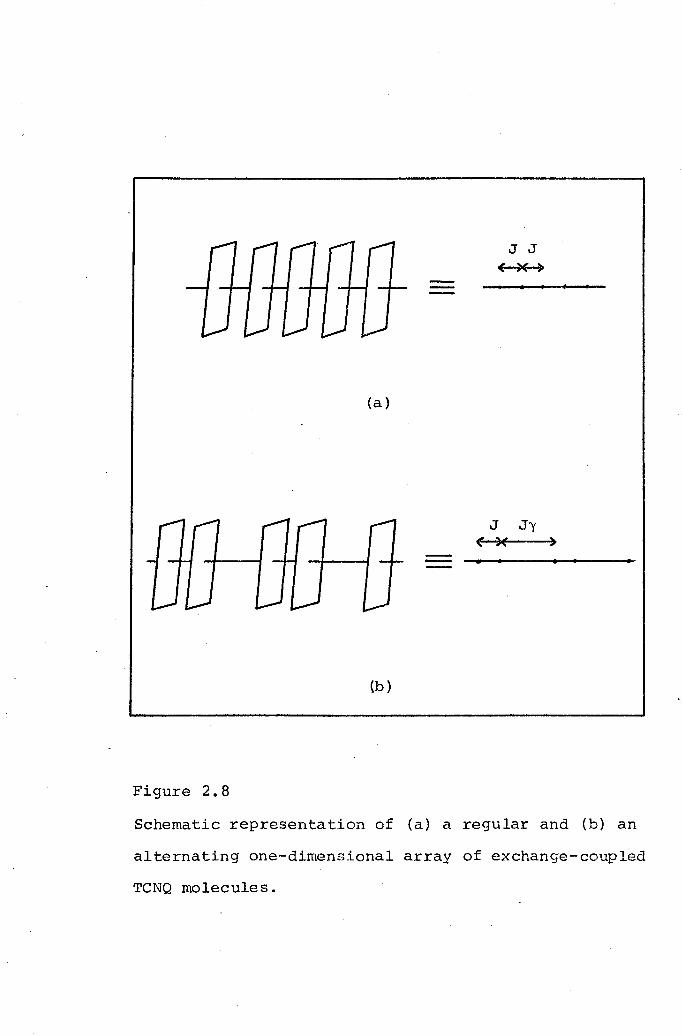
J J( ~
--
(a)
J Jy<)( )
(b)
Figure 2.8
Schematic representation of (a) a regular and (b) an
alternating one-dimensional array of exchange-coupled
TCNQ molecules.

-60-
When an exc~ton ~s localised on one repeat unit
within the stack and there is no interaction with the
neighbouring site, y equals zero and the solution to
equation 2.27 yields equation 2.26. Therefore, this
represents the limiting case of strong alternation and
equation 2.26 is representative of localised triplet
excitons. In the opposite extreme limit, where y=l, the
low lying excitations are spin waves with no gap in their
energy spectrum and their properties have been worked outextensivelylll-113. However, values of y between these two
limits are less well understood, and in all the various
treatments of this problem approximations have had to be
employed to obtain solutions to the Hamiltonian. Lynden-
Bell and Mcconnelll04 described the region where O<y«l in
terms of non-interacting mobile triplet excitons to account
for various features of the e.s.r. spectra of TCNQ complex
salts. Soosl07 attempted to solve the problem for all
values of y and his solution is in good agreement with
experiment for y«l, but failed to agree with exact results
known in the limit y=l. Similar ly, Duffy and Barrl14 tried
to perform exact numerical calculations for the solution of
equation 2.27 but again the work failed to explain the •magnetic behaviour of the system in the limit y=l.
One of the more promising treatments involves the
application of narrow band theory to the electronic states115 . 116 •of the TCNQ stack. Vegter and Hlbma proposed that

-61-
the exciton states result from the interaction between an
electron and a hole, which constitute the first excited
state of the system. Such an exciton can be describedl17
~~.being strongly bound (a Frenkel exciton, corresponding
\J;Q.,J:'<? ) or weakly bound (a Wannier exciton, correspondingto y=l) , and band theory allows for all intermediate cases
between these extremes. Although this treatment
adequately explained the observations on a number of
compounds studiedll6, it did not, however, reproduce
equation 2.26, the limiting solution of equation 2.27.
The most promising treatment recently developed
was first presented by Etemadll8 and this approach was
based upon the theoretical studies of Bulaevskiill3.
Etemad's treatment resulted in equation 2.28 which is the
susceptibility expression for an infinite chain of spins
with variable degrees of alternation.
2Ng282a (X)'X = exp(-J~(y)/kT)kT
•••• (2.28)
The term J~(y) represents the effective singlet-triplet
energy gap. The only symbols not previously defined are
~ (y_} and ~ (y), and these are tabulated values in Etemad's,.._- .....,....._...-
Work that are dependent upon y and the temperature range
under investigation. In the limit of strong alternation,
a(y) and ~(y) are both unity and, therefore, equation 2.28
is identical to the expression to which equation 2.26
reduces, once the inequality given in equation 2.29 is applied.

-62-
exp {J/kT}»3 •••• (2.29)
It can be seen from equation 2.28 that a plot of
~nXT against liT will have a slope of -;;b.(y},and theintercept K on the natural logarithm axis is given by
equation 2.30.. (2N 2Q2a( .})
K = in g IJ Yk
•••• (2. 30)
From a knowledge of the intercept, a(y) can be found and,
from this, a value for y, b.(y), J and W, the exciton
bandwidth, which is also a tabulated function of y. For
y=O, there is zero bandwidth and all the triplet excited
states are degenerate, in contrast to the finite excitonbandwidth for y~O.
Although equation 2.28 is only strictly valid in
the region 0 .035tT/g.5Q_.~~, and the whole approach is onlye._ ..... ,_-. -,.. ...~
applicable to situati.ons where y<~, this treatment hasproved to be a valuable asset in the interpretation of the
magnetic properties of semiconducting TCNQ complex salts.
The impotance of such an approach, which includes values
of y differing from zero, is that it allows for triplet
exciton motion, which is essential for the explanation of
the e.s.r. absorption spectra exhibited by these compounds.
Consequently, this treatment will be used in this thesis
to interpret the results obtained.

-63-
2.5.2 E.s.r. Spectral Characteristics Associated with
Triplet Excitons in TCNQ Complex Salts.
While more accurate solutions of the spinHamiltonian may lead to a better understanding of various
details, the significant result remains the identification
of the excited states as mobile triplet excitons. One ofthe consequences of this migration is that the hyper fine
structure is not observed experimentally even at low
temperatures and for all values of y. Theoretical
studiesl04,I07 reconciled this observation with theaveraging of the nuclear hyperfine splittings to zero due
to rapid propogation of the excitons along the linear
chains. As the exciton moves from molecular entity to
molecular entity, the nuclear spin state experienced by the
triplet electrons is changing rapidly with time, and thisplaces a lower limit on the 'jumping' rate of the exciton
corresponding to the hyperfine frequencies involved. The
observed effect on the e.s.r. spectrum of such a mobile
triplet species is schematically shown in Figure 2.9.
Spectra of the type shown in Figure 2.9(b) were
first observed by Chestnut and Phillips23 in a number of
anion radical salts based on TCNQ. The two absorption
lines are typical of species having an effective spin
value of S=l and arise from the phenomenon of zero-fieldsplitting, previously described in section 2.4.6. In this
case, the degeneracy of the three energy levels comprising
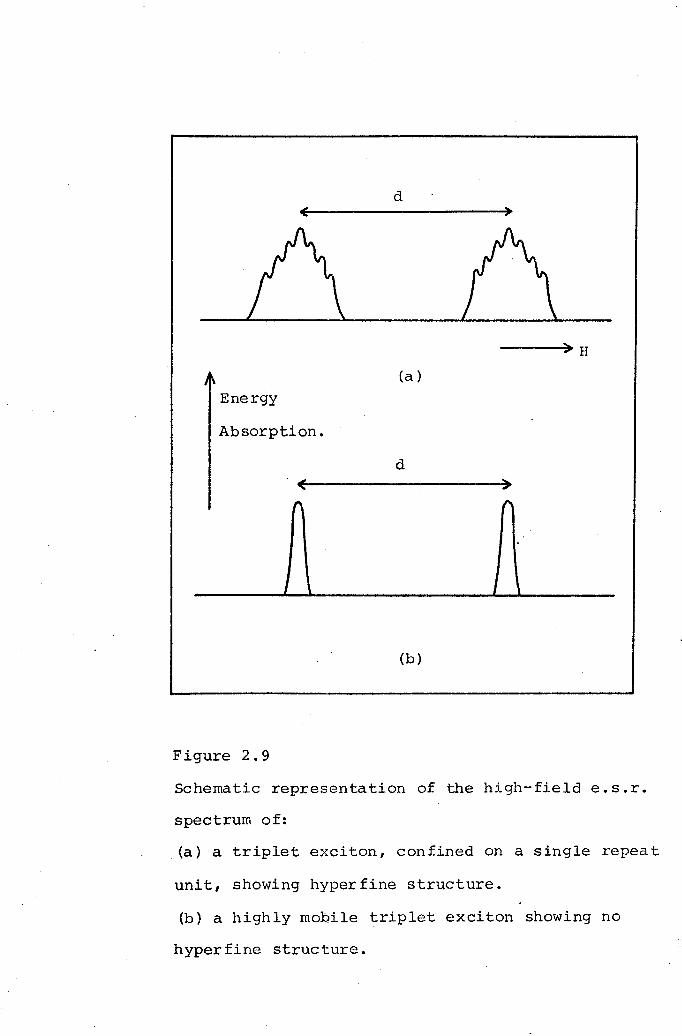
d
---~>~H(a)
Energy
Absorption.
d
Figure 2.9
Schematic representation of the high-field e.s.r.
spectrum of:
(a) a triplet exciton, confined on a single repeat
unit, showing hyper fine structure.
(b) a highly mobile triplet exciton showing no
hyper fine structure.
JJ
(b)

-64-
the triplet state is removed by the dipolar interaction
of the two electrons. Therefore, on application of a
magnetic field, the energy levels diverge, as shown in
Figure 2.10, giving rise to two resonance absorption lines
corresponding to transitions governed by the high+field
selection rule of ~M=±l. These transitions occur at
widely different fields according to the orientation of
the field, and this anisotropy is a direct result of
the dipolar coupling of the two electrons.
A second consequence of this interaction is
that the dipolar coupling may become comparable with the
Zeeman energy, gSH, and it is no longer possible to
assume that the two spin angular momentum vectors are
independently quantised in the external field. This results
in a breakdown of the usual selection rule and there is a
small finite probability of observing the transition
corresponding to ~M=±2, which occurs at approximately half
the field value approriate to the ~M=±l transitions. This
probability increases if the microwave field is applied
parallel to the external field, instead of perpendicular toit, as is normal in e.s.r. experiments.
A complete theoretical treatmentl19 of dipolar
interaction between two electrons resulted in equation
2.31, which is a two-electron Hamiltonian representing
the magnetic interactions between the two spins and the
field.

Energy
~M=±l
hv
6M=±1
H
10>
1-1>
Figure 2.10Energy levels and e.s.r. transitions as a function
of magnetic field for an oriented triplet state
molecule.

-65-
•••• (2. 31 )3r
In this expression, the subscripts 1 and 2 refer to the
two electrons, r is their separation and S is the overallspin. In this treatment, spin-orbit coupling is neglected,
and the zero-field energy levels, the spin wave functions
of which are represented by equations 2.32 to 2.34, are
evaluated by appropriate integrations over spatialcoordina tes•
1+1> = 0.0. •••• (2.32)
10> = (1/12) (as + Sa) •••• (2.33}
1-1> = ss •••• (2.34)
The magnetic (dipolar)interaction between the two
electrons can be expressed in terms of the zero-field
splitting parameters D and E, and gives rise to the more
familiar form of equation 2.31, given in equation 2.35 •
• • • • (2. 35 )
S , Sand S are the quantised spin values in the directionsx y zx, y and z respectively, and the above equation is only valid
in the principal axes coordinate frame of the dipolar
interaction. For an arbitrary orientation, the laboratory
coordinate system will not coincide with the principal axes
coordinate system. However, the two systems can be related
through the Eulerian angles ~, e and ~78, defined in terms
of successive counterclockwise rotations about the axes z,

-66-
nand z' respectively (Figure 2.11). In the e.s.r.
experiment, only ~ is varied as a crystal is rotated about
an axis perpendicular to the static magnetic field, and the
angular variation of the observed doublet separation, d, is
given by equation 2.3623•2d = Clcos ~ + C2 + C3cos~sin~ •••• (2.36)
The values of Cl' C2 and C3 are related to the zero-field
splitting parameters and are given by equations 2.37 to 2.39.
Cl = 3Dsin2e - 3Ecos21jJ(1+ cos2e) •••• (2.37)
C2 = -p + 3Ecos2~
C3 = 6Esin2~cose
•••• (2.38)
.••. (2.39)
A similar functional relation is found23 for the
g factor of the ~M=±l transitions and is given in equation
2.40.
.••• (2.40)
Here, g is defined as the mean resonant field of the observed
doublet and Kl, K2 and K3 are expressed in equations 2.41 to
2.43.
•••. (2.41)
•••• (2.42)
= (g -g )sin 2~cosex y •••• (2. 43)
The anisotropy of the g factor can, therefore, be expressed
in terms of the values gx' g and g along the threey zprincipal magnetic axes.
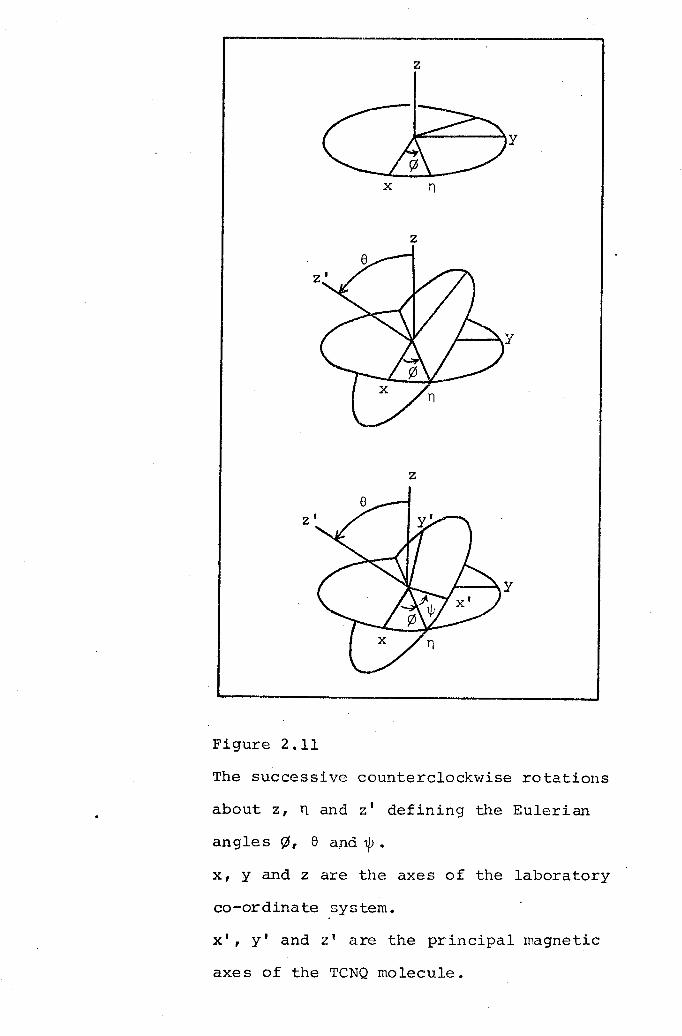
z
x n
z
z
Figure 2.11The successive counterclockwise rotations
about z, nand Zl defining the Eulerian
angles <p, e and 1j.> •
x, y and z are the axes of the laboratory
co-ordinate system.
x I, Y I and z I are the pr incipal magnetic
axes of the TCNQ molecule.
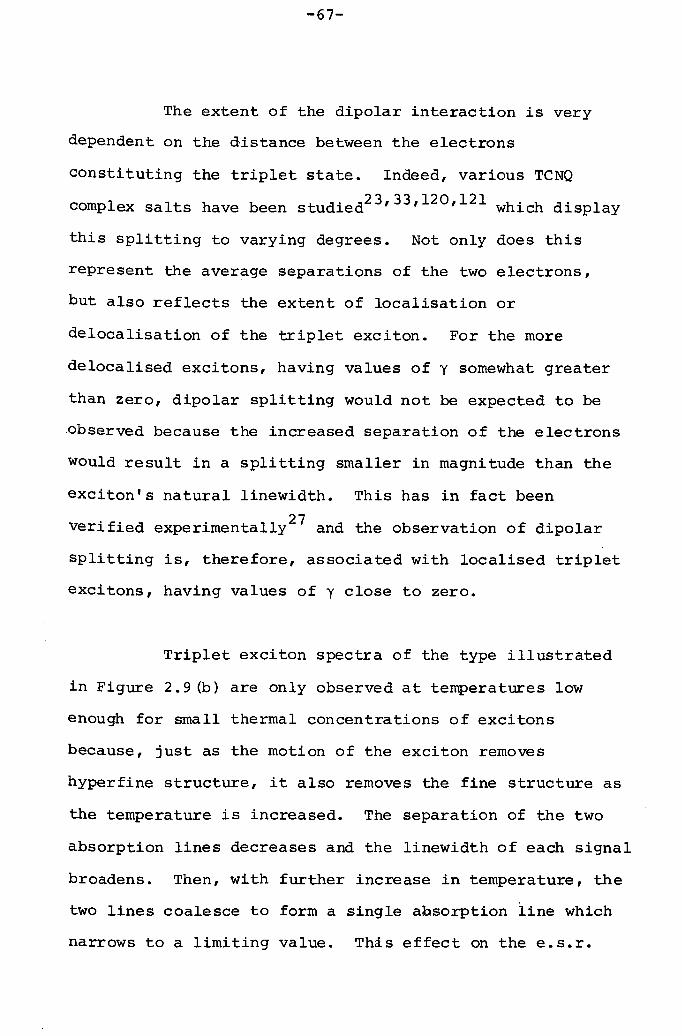
-67-
The extent of the dipolar interaction is verydependent on the distance between the electrons
constituting the triplet state. Indeed, various TCNQcomplex salts have been studied23,33,120,12l which display
this splitting to varying degrees. Not only does this
represent the average separations of the two electrons,
but also reflects the extent of localisation or
delocalisation of the triplet exciton. For the more
delocalised excitons, having values of y somewhat greater
than zero, dipolar splitting would not be expected to be
.observed because the increased separation of the electrons
would result in a splitting smaller in magnitude than the
exciton's natural linewidth. This has in fact been
verified experimentally27 and the observation of dipolar
splitting is, therefore, associated with localised triplet
excitons, having values of y close to zero.
Triplet exciton spectra of the type illustrated
in Figure 2.9 (b) are only observed at temperatures low
enough for small thermal concentrations of excitons
because, just as the motion of the exciton removes
hyper fine structure, it also removes the fine structure as
the temperature is increased. The separation of the two
absorption lines decreases and the linewidth of each signal
broadens. Then, with further increase in temperature, the
two lines coalesce to form a single absorption line which
narrows to a limiting value. This effect on the e.s.r.

-68-
derivative spectrum is shown in Figure 2.12 and is
characteristic of an exch.ange interaction, which is assumed
to be a spin-exchange of the triplet excitons resulting fromexciton-exciton collisions.
Jones and Chestnut122 studied this behaviour in
detail and their theoretical interpretation is widely
accepted. For an understanding of the spectral featuresarising from this phenomenon, it is necessary to consider
two distinct temperature regions: the 'slow' exchange and
the 'fast' exchange region. The former is the region in
which the doublet spectrum is observed, whereas the latter
corresponds to the presence of only one absorption line.
The observed effects in the 'slow' exchange region are
represented by equations 2.44 and 2,45, whilst equation
2.46 corresponds to the region of 'fast' exchange.
= (d 2 _ d2)o •••• (2.44)
v = /3(L\H - LlH )od 2 (L\H _ LlH )-1o ·0
213
•••• (2.45)v = •••• (2.46)
In the above equation, d and do represent the separation
of the doublet in gauss, in the presence and absence ofexchange respectively, Ll.Hand LlH are the linewidths ino
gauss with and without exchange, v is the frequency of the
exchange process.The linewidths,referred to aboVe,are measured

Increasing
Temperature
'.~
Figure 2.12
Effect of exchange interaction with increasing
temperature on the two-line e.s.r. derivative
spectrum arising from zero-field splitting for
a species with S=l.

-69-
from points of extreme slope of the.derivative of the
absorption curve, which is the normal manner in which the
spectra are recorded in e.s.r. experiments.
The approximations given in equations 2.44 to
2.46 follow an experimental temperature dependence given
by equation 2.47:
••.• (2.47)
where Vo is a pre-exponential factor, and ~Ee is the
activation energy for exchange. The exchange frequency is
also proportional to the exciton concentration and this
relationship is shown in equation 2.48.v ~ (exp(J/kT) + 3)-1 ~ exp(~J/kT) •••• (2.48)
From these last two equations, it might be expected that
an equality would exist between ~E and J. However, generallye~Ee is substantially larger than J122,123, which indicates
that there must be some other activated process contributing
to the activation energy for exchange. This difference can
bejustified77 by conSidering an activation energy for
migration of the triplet exciton, ~E, and equation 2.49 canm
be derived.llE = J + llEe m •.•• (2.49)
The treatment outlined in this section
adequately explains most of the experimental ob~ervations
arising from the effects of exchange on the spectra of TCNQ

-70-
complex salts and will, therefore, be used in this thesis
when interpreting the results obtained from single crystal
studies.

CHAPTER 3
EXPERIMENTAL
'~There is no higher or lower knowledge, but
one only, flowing out of experimentation."
Leonardo da Vinci
1452 - 1519

-71-
3.1 SAMPLE PREPARATION
All the compounds studied in this work were
complex salts of TCNQ and were prepared by various
members of this department. The general procedure isbasically the same for all the compounds and detailed
experimental accounts typical of the procedure used have
been presented elsewhere125,126. However, a brief
description of the general method of preparation will be
outlined in this section.
TCNQ was obtained from Eastman-Kodak Ltd. and
used without further purification, as were the precursors
of the cations used in this work. The basic structuresof these cations are presented in Figure 3.1, together
with the abbreviations to be used for them in this thesis,
the correct nomenclature being given in Table 3.1.
Table 3.1
Nomenclature and Abbreviations for the Cations
in Figure 3.1.
Abbreviation Nomenclature
DRPE 1,2-di(N-Alkyl-4-Pyridinium)Ethylene.
DMPA 1,2-di(N-Methyl-4-Pyridinium)Ethane.
DCBP 1,2-di(N-p-CyanoBenzyl-4-Pyridinium)Ethylene.
DPB I,4-di (N-Pyridinium) Butane.
TPT 2,4,6-tri(N-Methyl-2-Pyridinium)Triazine.

· DRPE
H C--+l~O-~CH- CH~-+-CH3 2 2~ 3
DMPA
NNC
DCPB
DPB
TPT
Figure 3.1
Cations used in the preparation of 'l'CNQcomplex salts studied
in this work.
R = n-propyl {P}, n-butyl (B), cyclohexy 1 {H}•

-72-
All the cations,except DPB, were prepared from
their precursors by a one-step quaternisation procedure ofthe pyridine rings, using an alkyl halide RX:
x x
+ 2RX ~
A hot solution of the cation in water was then added to a
hot acetonitrile solution of TCNQ, the actual amounts used
depending on the stoichiometry of the desired product.
x x
+ nTCNQ
+
If X=Cl, the above step involves the intermediate Li+TCNQ-,
which is produced by the direct action of TCNQ on lithium
iodidem acetonitrile:
3LiI + 2TCNQ
The addition of Li+TCNQ- is required as TCNQ itself will
not discharge the chloride ion. The reaction in this
case is as follows:
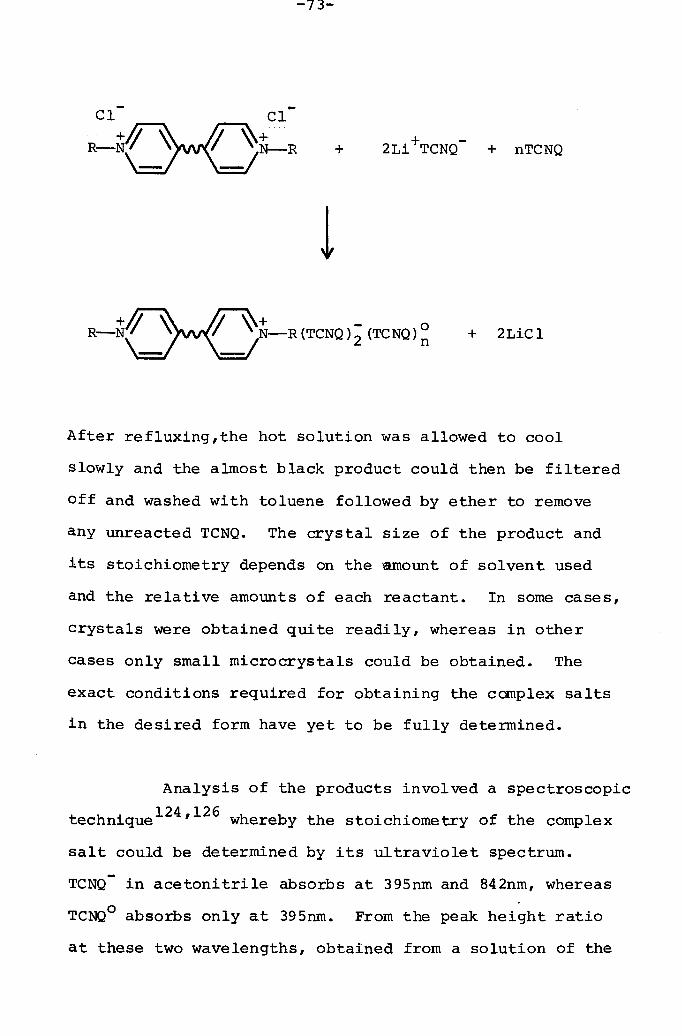
-73-
1+ 2LiCl
After refluxing,the hot solution was allowed to cool
slowly and the almost black product could then be filtered
off and washed with toluene followed by ether to remove
any unreacted TCNQ. The crystal size of the product and
its stoichiometry depends on the amount of solvent used
and the relative amounts of each reactant. In some cases,
crystals were obtained quite readily, whereas in other
cases only small microcrystals could be obtained. The
exact conditions required for obtaining the complex salts
in the desired form have yet to be fully determined.
Analysis of the products involved a spectroscopic. 124 126techn1que ' whereby the stoichiometry of the complex
salt could be determined by its ultraviolet spectrum.
TCNQ in acetonitrile absorbs at 395nm and 842nm, whereas
TCNQo absorbs only at 395nm. From the peak height ratio
at these two wavelengths, obtained from a solution of the

-74-
complex in acetonitrile, the relative amounts of TCNQ tooTCNQ were obtained.
Microanalytical data were also used to confirmthe stoichiometry obtained using the spectroscopic analysis.
In the case of single crystals, X-ray crystallographic data
complemented the above techniques.
3.2 ELECTRON SPIN RESONANCE STUDIES
3.2.1 Equipment
(i) The Spectrometer
The spectrometer used throughout this work was
a Decca X3 operating in the X-band with a klystron
generating a constant frequency of 9270 MHz. The micro-
wave radiation was kept at this fixed frequency by an
automatic frequency control (AFC) locked to a crystal
oscillator, and the resonance condition was satisfied by
varying the magnetic field.
The spectrometer (illustrated in Figure 3.2) a
microwave reflection system, and the reflection cavity
operated in the TEl02 mode. In this system, it is
essential that all the input radiation is absorbed by the
cavity, at a field value off the point of resonance, and
the cavity is then said to be tuned. This occurs when
the resonant frequency of the cavity matches that of the
klystron, and this is achieved using tuning screws, which

B E
A
Figure 3.2
Block Diagram of the e.s.r. spectrometer.
A 100KHz amplifier.
B Klystron power supply.
C Cavity.
D Audio PSD.
E Automatic frequencycontrol (AFe) signalgenerator.
F AFC discriminator.
G 100KHz generator.
H Audio sweep generator.
I Audio amplifier.
K Klystron.
M Magnet.
o Oscilloscope.
P Pre-amp.
PSD lOOKH.z phasesensitive detector.
R Recorder.
T Attenuator.
W Waveguide.

-75-
effectively distort the cavity dimensions to change itsresonant frequency. When resonance occurs, power isabsorbed by the sample and the cavity becomes detuned.
Consequently, power proportional to that absorbed by the
sample is reflected back to the detector, a semiconducting
crystal diode rectifier,which converts microwave power intodirect current.
The spectrometer also operated phase-sensitive
detection (PSD), which enables small signals, normally
obscured by noise, to be observed. This system requiresapplication to the sample of a 100KHz modulating magnetic
field with amplitude, Hm, much less than the linewidth.
This field is supplied by a coil around the cavity and
could be varied using calibrated attenuators from 40 to
O.OlG. During the traverse of the peak, the output signal
is approximately proportional to the slope of the
absorption curve (Figure 3.3(a)). After amplification,
jthiS 100KHz signal is mixed with a reference signal of the
same frequency, of constant amplitude but variable phase,I
in the phase-sensitive detection circuit to produce a d.c.
output signal of the shape shown in Figure 3.3(b). ThisI
I
;is the first derivative of the absorption curve and, forI/ this to be a true representation of the absorption, it is
essential that the amplitude of the 100KHz modulating field
is less than one tenth of the 1inewidth~. Linewidths are
usually quoted in terms of the distance from peak to peak

(a)
-- -- - - -- 7\n- -n-~-________ V_ v. _J Jj_ _tcrystalI current b
dba c
I II ,
~t I H
(b)
HtId.c.I output
II HoIIIIIIII l\HK
Figure 3.3
(a) Effect of superimposing a 100KHz modulation field
c
(H «H ) during the .traverse of an absorption peak.m 0
(b) The d.c. output after phase-sensitive detection
(first derivative curve). This is also typical of
the e.s.r. signal obtained with single crystals of
TCNQ complex salts.

-76-
on the first derivative curve, and this convention has
been used in this thesis for all symmetrical signals.
The efficiency of a cavity in storing microwave
energy is expressed quantitatively by its Q-factor which
can be defined by equation 3.1://Q = W' x energy stored
rate of energy loss •••• (3.1)
where w is the resonant frequency. If energy loss is only
caused by dissipation in the walls, this definition gives
the unloaded Q-factor but, if energy loss through the
coupling holes is included, it measures the loaded Q-factor.
In either definition, the higher the Q, the more efficient
is the cavity.
The method of measuring the Q was a standard
feature of the Decca X3 spectrometer, and differed from
the classical Voltage-Standing-Wave Ratio method. The
V.S.W.R. method involves measuring the amplitude
difference of the input and output standing waves, whereas
the Decca method involves measurement of the reflected wave
voltage using a high directivity directional coupler. Loss
of energy by sample absorption gives rise to a change in the
Q value and, therefore, the quality factor is of importance
jdUring measurements of signal intensity. In order to take
account of the changes in Q with sample, temperature, and
j sample positioning, all signal intensities observed wereI
-77-
normalised by dividing by the corresponding Q value measured.
The relative accuracy of a series of Q measurements was
quoted by the manufacturers as 2%, however, the absolute
accuracy is regarded as being somewhat less than this.
Another important feature of the basic spectrometer
was a Newport Instruments Type P Mark III magnetometer.
The magnetic field could be measured with the proton
resonance probe fitted in the magnet gap, the proton in a
water sample providing the standard. The accuracy of the
field measurement for this magnetometer was quoted by the
manufacturers as one part in 105 at 5KG.
There had been one modification to the spectrometer
and this had involved the replacement of the integrator
circuit, responsible for the control of the magnetic sweep
rate, with a solid state circuit. This modification was
found to be an improvement with respect to the long rate
reproducability127.
The remaining basic features of the spectrometer
and its operation are common to many commercial e.s.r.
systems, and so no further discussion is presented of
the se feature s•
(ii) The Cooling UnitThe temperature within the sample cavity of the
spectrometer was varied in the temperature range 300 to

-78-
4.5K by passing helium gas into the cavity by means of an
Oxford Instruments ESR9 continuous flow cryostat. The
basic design of this equipment is shown in Figures 3.4
and 3.5.
The temperature could be controlled by controlling
the transfer of the coolant gas from the storage vessel by
means of a pump which transfers the gas by suction via a
flexible syphon. The actual temperature required was
maintained by a heating coil situated close to the samplein the cavity, which automatically adjusted the rate of
heating to compensate for any changes in helium flow and to
balance the heat leaks into the cryostat. This automatic
control of the temperature was provided by an Oxford
Instruments Precision Temperature Controller used in
conjunction with the cryostat, and also provided a digital
display of the temperature. With this facility, the
temperature could be controlled to ±O.~K at an accuracy of
O.lK from room temperature to 10K, and at a stability of
±0.5K from 10 to 4.5K.
The sample temperature was measured using the
gold-0.03% iron/chromel thermocouple shown in Figure 3.5.
The voltage from this thermocouple was converted to the
digital display and a calibrated chart was provided with
the equipment.

Sealing plug
u=il--
lJ-Sealing nut
NylonSample Coupling
IIIII," ....._--
IIII\\,""- Cavity
Cavity supportsleeve
Support sleevesecuring nut Cryostat
evacuationvalve
Electrical·lead-through Syphon
entryport
Figure 3.4
The Oxford Instruments E.S.R.9 continuous flow
cryostat (partially open view down to the level
marked A) •

Quartzsamplelocationtube
Electricallead-through
<,
Heat sink
Necked sample res
Adaptor'
Thermocouple
Direction ofhelium flow
Figure 3.5
Deli very tube
Cross-section through the sample region of the
Oxford Instruments E.S.R.9 continuous flowcryostat.

-79-
Below room temperatureT care had to be taken toprevent any condensable materials collecting in the cavity
area and so depreciating the Q value. This was prevented
by passing nitrogen gas at a small flow rate through thee.s.r.cavity area.
(iii) High Temperature Equipment
Measurements above room temperature, up to 340K,
could be performed using the heating coil in the cavity
combined with warm air introduced into the cavity by the
pump. The flexible syphon was replaced by a rod, of suit-
able dimensions which fitted into the cryostat, and
attaching this rod to a copper coil situated in a furnace.
This apparatus enabled warm air to be drawn into the
cryostat, and hence the cavity. Although the digital
display could not be used above 300K, the temperature
could be measured using a voltmeter and the calibration
chart provided.
(iv) The Analog Integrator
Estimation of the intensity of a symmetrical
e.s.r. signal is straightforward and is described in
section 3.2.3(iii). However, for asymmetrical signals,
the intensities are not so readily obtained. The wellk " I" t t" t h" 93" 1" thnown numer1ca 1n egra 10n ec n1que 1nvo v1ng e
measurement of the peak height of the first derivative
e.s.r. signal at uniform intervals throughout the spectrum,

-BO-
is both tedious and time-consuming and the accuracy
depends upon the size of the intervals taken. Also,
although the accuracy for this technique is quite good for
Gaussian lineshapes, it is not so good for Lorentzian
lineshapes unless a very wide sampling range is usedl2B•
In order to surmount the problem, an analogintegrator was used, which was built to the design of
129Randolph • The integrator was connected to the pen-
recorder and had two output channels. The first of these
allowed the power absorption curve to be displayed, and
the second gave a voltage which was directly proportionalto the integrated signal intensity and was also displayed
on the recorder. Although this technique did not increase
the accuracy of the integration, it did decrease the time
consumed in obtaining a measurement of the signal intensity.
Great care had to be taken, however, in using the
integrator as any drift in base-line resulted in a
completely false integration of the spectrum. Before a
spectrum was taken, the two outputs were checked to ensure
there was no drift, and again after the spectrum had been
displayed to ensure that no drift had occurred as the
sweep continued through the spectrum. If any drift had
occurred, the output would vary, and intensity values
were only taken from those spectra which showed "no such
drift. In order to obtain a valid spectrum, the phasing

-81-
had to be set perfectly and this proved to be one of the
benefits of using the integrator. Due to the asymmetry
of the signals obtained with polycrystalline samples, the
correct shape was not immediately obvious but, with the
necessity for setting the phasing perfectly, a true spectral
shape was obtained.
(v) Sample Holders
The type of sample holder used depended upon
the nature of the sample to be studied. In the case ofsingle crystal samples,a silica glass rod of diameter 4mm
was used. The end 8mm of its length was removed on one
side leaving a semi-circular portion of radius 2mm which
provided a flat platform on which to mount the crystal.
The modified end of the glass rod was then annealed to re-
move as many as possible of the radicals that may have been
generated in the grinding process.
Silica glass was used as pyrex glass contains
paramagnetic impurities that would give rise to an e.s.r.
signal. The silica glass rod, with a small amount of
silicone grease on the flat portion, was investigated for
the presence of any signal at various temperatures and
spectrometer settings. A very small signal was observed
below lOOK at about the free electron g factor. This
signal was so small at most of the commonly used
spectrometer settings, that it was unlikely to interfere
-82-
with any measurements made on the single crystals of the
TCNQ complexes studied. However, the investigations
performed enabled the signal to be identified should theneed arise.
The crysta.ls were mounted on the rod using
silicone grease and the orientation of the crystal with
respect to the magnetid field was varied by means of an
Oxford Instruments goniometer attached to the top of the
cavity. This allowed changes in the orientation of a
sample to be made to an accuracy of 6 radians.
In the case of polycrystalline samples, silica
glass tubes of diameter 4mm were used. A weighed sample,
usually 3-4mg, of the TCNQ complex to be studied was
inserted into the tube which was then evacuated to a-3pressure of 10 Pa for about twelve hours, before being
sealed under vacuum. An empty sealed tube was also
investigated at various temperature and spectrometer
settings and a very small signal was observed at about
the free electron g factor as before.
3.2.2 Calibration Experiments
(i) Microwave Power Attenuators
The manufacturers had provided a calibration
graph of microwave power against microwave attenuation.
The powers quoted were for a new Decca klystron, so since

-83-
several EMI klystrons were used in this work, the power at
a certain attenuation was incorrect. However, although
the power levels will be different from klystron to
klystron, the ratios of the power levels indicated by the
various attenuator settings should be the same.
This was checked by investigating the size of
a signal from a crystal of DPB(TCNQ)4 as a function of
microwave power. In the range of microwave attenuation
studied (15 to 40db), the linewidth of the signal remained
the same which indicated that the signal was not saturated.
A plot of the square root of the microwave power against
signal intensity is shown in Figure 3.6 and shows the
expected linear relationship.
(ii) 100KHz Receiver Attenuators
When comparing signal intensities from spectra
taken using different attenuator settings of the 100KHz
receiver, it was vital for an accurate comparison that the
attenuator calibration was correct. This was checked by
investigating the signal intensity from a crystal of
DPB(TCNQ)4 at various values of the 100KHz receiver
attenuators. Six attenuator settings were studied in the
range 13 to 28db and, if they were correctly calibrated,
the product of the signal intensities and the voltage ratio
appropriate to the attenuator setting should give rise to
the same intensity value~ The results obtained for the six
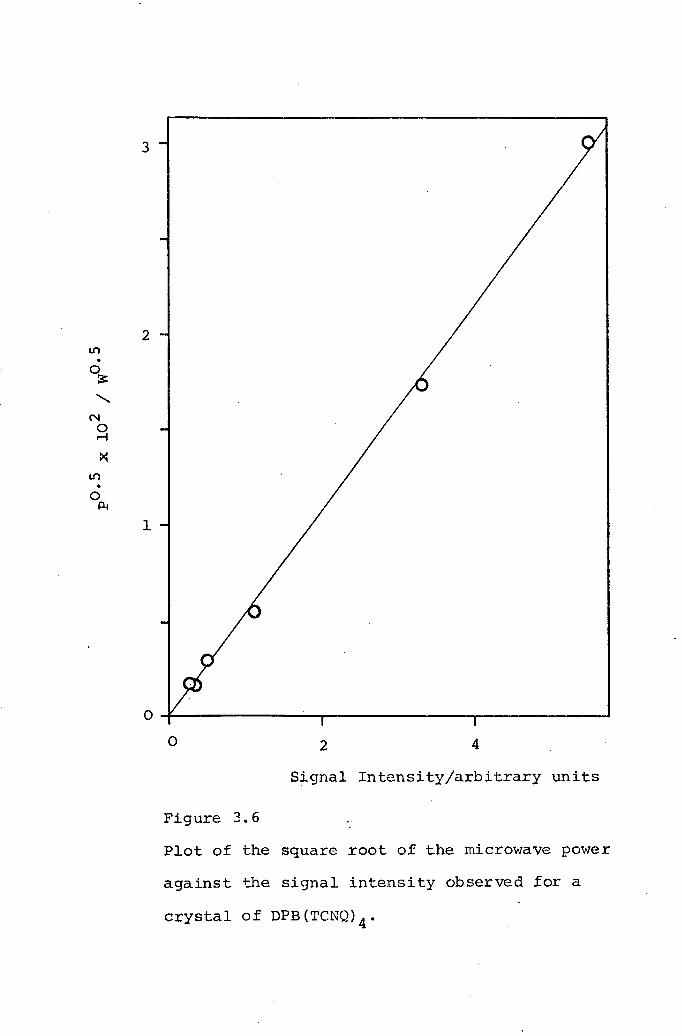
2U)•
~,N0~X
U)•0~
1
o 2 4Signal Intensity/arbitrary units
Figure 3.6
Plot of the square root of the microwave power
against the signal intensity observed for a
crystal of DPB(TCNQ)4.

-84-
attenuator settings are shown in Table 3.2.
Table 3.2 Comparison of Signal Intensities bbtainedwith
different Attenuator Settings of the 100KHz
Receiver.
Attenuation Signal Intensity Voltage Ratio Product of(db) (arbitrary units) for Attenuator Voltage
Setting. Ratio andSignalIntensi ty
13 6,153 4.47 27,50216 4,649 6.31 29,33819 3,334 8.91 29,702
22 2,356 12.59 29,66825 1,719 17.78 30,55928 1,086 25.12 27,280
The mean value obtained in the last column of Table 3.2
is 29,010 with a standard deviation of 1,318. This is
only about 4% of the mean value, which is within the errorinvolved in assessing the signal intensities. Consequently,
it was felt that the attenuator calibration was sufficiently
correct for the comparisons of signal intensities, taken
with different attenuator settings, to be made.

-85-
(iii) Thermocouple Calibration
The thermocouple of the ESR9 cryostat was
situated very close to the sample, as shown in Figure 3.5.
Consequently, the thermal gradient between the two points
must have been very small indeed, and any attempt to
measure it would result in error larger than the value
itself.
However, by supplying voltages corresponding to
the output of the gold-0.03% iron/chromel thermocouple
(obtained from the manufacturer's calibration chart), the
digital display of the Precision Temperature Controller
could be checked. The results indicated that the displayed
temperature was inaccurate up to 3K at certain temperatures.
The thermocouple voltage has a curved dependence upon
temperature, and the deviation in the display resulted from
this as the electronics of the equipment segmented this
curve into three linear portions. However, by checking
the display throughout the temperature range 4.5 to 300K
and noting the deviation, allowance could be made when
taking temperature measurements during this work.
(iv) Sweep Rate Calibration
The sweep rate could be altered in two main ways.
Firstly, the actual sweep rate in gauss could be set at
either 1% or 10% of the magnetic field level chosen, the
maximum field value being 6KG. The field value used

-86-
throughout this work was approximately 3300G and, therefore,
the sweep ranges used were approximately 33 and 330G.
Secondly, the sweep time could be varied from 10
to 10,000 seconds. Consequently, uncertainties arose in
the estimated sweep rate from the errors in both the sweep
range and sweep times. Also, the pen-recorder was of they-t type, and so the response was not directly triggered by
the magnetic field.
The sweep times and rate at which the pen-recorderran was readily checked using a stop-clock, thus leaving
only the error in the sweep range unknown. The method used
to evaluate this error entailed taking a spectrum of a
sample having known spectral parameters. The compound used
was p-benzosemiquinone, the spectrum of which consists of a
quintet caused by the hyperfine splitting of the ring
protons. The separation of the peaks is established and130known to be 6.64MHz •
The p-benzosemiquinone radicals were generated
by mixing equal volumes of approximately O.lM solutions
of hydroquinone and sodium hydroxide in ethanol and water
(30:70 by volume). The radicals decomposed quite readily,
this being indicated by the solution changing colour from
yellow to brown, and so it was necessary to make· a fresh
mixture for each spectrum taken. A special cell had to

-87-
be used for these samples in order to minimise the effects
of the high dielectric loss of the water in the microwave
region. An aqueous solution silica cell was, therefore,
used having a thickness of only O.lmm but a width of lcm.This had to be positioned in the cavity so that the intrusion
of the sample into the microwave electric field was
minimised, so preserving the Q of the cavity. This was
achieved by having the cell with its lcm width parallel to
the external magnetic field H, as shown in Figure 3.7.
From the distance observed between the quintet
peaks on the resulting spectrum, and knowing the sweep
time, pen-recorder speed and the known value of the
hyperfine splitting, the sweep range was calculated.This was repeated for both the 1% and 10% sweep range
settings.
The sweep times and sweep ranges were known to
change slowly as the electronics governing these settings
aged. Consequently, it was found necessary to repeat this
calibration every six months throughout the course of this
work and the estimated accuracy in the sweep rate after
each calibration was approximately 2%.
(v) Purity of DPPH
When making spin measurements, it was necessary
to have a standard with a known number of spins per mole.

Sample axis
cell
currentlines set upby microwavefield
magnetic fie Idloops set up bymicrowave current.
Figure 3.7
The resonant cavity, showing the positioning of the
silica solution cell.
Only some of the electric field lines are shown for
clarity. There is another set in front of the silica
cell in the diagram.

-88-
The standard used throughout this work was l,l-diphenyl-2-
picrylhydrazyl (DPPH), which has a g value of 2.0036 and a
linewidth comparable to those of TCNQ complex salts. DPPH
was obtained from Koch-Light Laboratories Ltd., who quotedthe free radical concentration as 85 to 88% of the
theoretical maximum value. The melting point of the DPPH
was given as 410 to 412K which indicated that the compound
was in the crystallographic form designated as DPPH II by
Duffy and Strandburg131•
The DPPH had been recrystallised from chloroform
by the suppliers, and some of the solvent would most
certainly have remained in the solid as DPPH is known to
~orm a complex with chloroform132• This is probably the
reason for the comparatively poor purity quoted, and also
could explain the slight asymmetry observed in the spectrum
of DPPHI33,134. The magnetic susceptibility of this
material agreed very well with that of a sample of DPPH
recrystallised from chloroform previously studiedl35, andwas found to be 1.123 x 10⁻³ e.m.u. cm3 mol-l at 295K for
both materials.
The purity of the DPPH used in this work wasestimated by a spectroscopic technique', Standard solutions
«10-3M) of the DPPH in chloroform were prepared and their
extinction coefficients at 529nm taken. NOW, with a
knowledge of the literature value of the extinction
-89-
coefficient 136, it was possible to calculate the actual
amount of DPPH present in the standard solutions used
and hence the percentage purity of the DPPH. The puritywas found to be 79%, and this value was used to assessthe number of radicals in each of the standard DPPH
samples used in this work.
The spin concentration of DPPH samples decreaseswith time137 and, consequently, the standard samples weredegassed and the silica tubes sealed under vacuum, as
previously described in section 3.2.l(v). By evacuating
the samples in this way and also keeping them in the dark,
the decrease in spin concentration could be reduced to1381-2% per year •
(vi) Oscilloscope Measurements
Most TCNQ complex salts studied show an
increased signal intensity at low temperatures which obeysa Curie temperature dependence, and this tends to dominate
the signal observedl16• This Curie signal is due to '~
unpaired electrons in the doublet state which are thought
to result from defects in the latticelOO, for example
irregularities in the stoichiometry of the complex.
In order to obtain an order of magnitude
estimate of the number of these species, a technique was
employed which involved comparison bf the signal under

-90-
study with signals from DPPH samples. The spectra of the
TCNQ complex salts were displayed on the oscilloscope
screen and, providing the signal shape was symmetrical, the
intensity could be calculated quite readily by takingmeasurements from the screen. With a knowledge of the Q of
the cavity at the particular temperature, and taking a series
of measurements at different temperatures, a plot of the
normalised intensity against the absolute temperature could
be obtained. The slope of such plots depended upon the
number of spins giving rise to the signal and also upon the
spectrometer settings used. In order to determine how the
slope depended on the settings, samples of DPPH were used.
Measurements of the spectra displayed on the screen were
taken at various temperatures and using the same settings
as before for the TCNQ complex salts. The normalised
intensities were, therefore, found and an example of the
resulting plots is shown in Figure 3.8. Knowing the
number of spins in the DPPH sample, a correction factor
could be calculated to allow for the spectrometer settings.
The number of spins in a DPPH sample was
obtained in the following way. The molar susceptibility
behaviour of DPPH II, in the temperature range studied, is. b . 3 2131,135g~ven y equat~on • •
, C=(T-24 )
•••• (3.2)
In this case, N is 97% of Avogadro's number, T and C have

Ul+J.r-!
§>tHcoH+J 6.r-!..QHco<,
r-IIH
120 160 200 240T/K
Figure 3.8
Plot of t~e reciprocal of the normalised
intensity against temperature for a DPPH.
sample.
-91-
been previously defined in section 2.3.1 of Chapter 2, and
J is equal to~. Consequently, the calculation of the
number of spins giving rise to the Curie law signal in a
TCNQ complex salt assumes there is no orbital contribution
to the angular momentum. However, since the signals
observed were close to the free electron g value, this is
considered to be a justified assumption.
This calibration also involves another assumption
that the line shape of the signals from the TCNQ complex
salts was the same as that of DPPH. This is involved
because the signal intensities for the TCNQ complex salts
and DPPH were calculat~d using equation 3.3, which will
be given in section 3.2.3(iii}. Comparisons of intensities
obtained using this equation require this assumption to be
made. However, any error incurred due to different
line shapes would have been smaller than the overall error
involved in this technique.
3.2.3 Electron Spin Resonance Measurements on TCNQ
Complex Salts.
(i) g Factor Measurement
The actual position of the spectrum in relation
to the magnetic field is of value in ascertaining the
nature of the species giving rise to the signal, and this
is measured in terms of the g factor. The principal
magnetic axes within a crystal can also be located from a

-92-
knowledge of the g values. For these two reasons, this
study was undertaken on all single crystals used and on
most of the polycrystalline samples.
The magnetometer probe was set so that the proton
resonance was locked to 3300G. The point at which the
sweep passed through this field value was marked on the
pen-recorder, and the sweep was allowed to continue until
the signal had been drawn. The distance from the 3300G
marker to the point where the first derivative of the
absorption curve cuts the base-line (see Figure 3.3(b»
was then converted to a field separation using the
calibrated sweep rates. The exact point of resonance
could be calculated and , subsequently, the g factor at
that orientation, using equation 2.22.
The error involved in this estimation resulted
from the magnetometer (±0.33G at 3300G), the sweep rate
(±O.lSG in sweeping 6G), and the klystron frequency
(±O.lMHz at 9270MHz using the cavity locking system).
This gave an error of ±0.0003 for g factors in the resonance
region of 3306G.
The g factors were calculated at 100 intervals
from 0 to 1800 by rotating the crystal around the sample
axis using the goniometer. By rotating through the
remaining 1800 the same angular variation would be
-93~
observed23 and, therefore, results only from the first
1800 rotation were taken. The principal magnetic axes
within a crystal were readily located by observing the
maximum andminimum g factors obtained and noting the
particular orientation to which they corresponded.
Certain TCNQ complexes cannot be prepared in
the form of single crystals and, therefore, the
investigation of these compounds was carried out using
polycrystalline samples. Although it was once believed
that randomly oriented triplet state molecules could not
give rise to a meaningful signal as the absorption would
be smeared over a wide field range, in fact it has been
shown139 that useful information can be deduced from the
spectra. The less anisotropic ~M=±2 transition was
observed initially140, and it was subsequently found
that the peaks due to the ~M=±l transitions could also be
detected141• However, single crystal measurements usually
give less ambiguous results and so polycrystalline samples
were only used where single crystals could not be obtained.
In the case of polycrystalline samples,the peaksobserved have been shownl2l,14l to be located at exactly
the positions at which resonance would occur if single
crystals of the material were oriented with their principal
magnetic axes co-linear with the axes of the laboratory
coordinate system. The spectral shape observed for

-94-
polycrystalline samples is shown in Figure 3.9, and the
method of determining the g factors is the same as that
outlined above, with the distances measured to the points
corresponding to gil and g,Las shown in the diagram.
However, these points were only a true indication of the
g factors if contributions from all possible orientations
of the microcrystals were contained in the spectrum.
This was checked by rotating the sample and observing
whether the spectral shape changed with change of orientation.
Spectra with the type of shape shown in Figure 3.9142have been previously reported for single crystals and
1 II' 1 143,144 f CT 1 d 1po ycrysta ~ne samp es 0 comp exes, an a so27for a number of TCNQ complexes • The dependence of the
splitting upon the spectrometer frequency has been
investigated144 in order to discover the source of such a
signal. This study showed that the structure observed in
such a spectrum was caused by differences in g factor
resulting from g factor anisotropy rather than the existence
" of two specie s with different g factors. Another likely
cause of such structure could be dipolar interaction.
However, splittings from this phenomenon are of the orderof 300MHz for TCNQ complexes23,33,118,12;r;l whereas the
splitting observed with this spectral shape are in the
region of 3MHz. Also, a crystal structure determination145of a TCNQ complex salt showed that all the potential
exciton sites were equivalent and, therefore, the structure

< )
Typical e.s.r. signal obtained with polycrystalline
3MHz
Figure 3.9
samples of TCNQ complex salts.

-95-
could not be due to the presence of two species with
different g factors.
Theoretical interpretations146,147 of the
lineshape shown in Figure 3.9 have shown the structure
to arise from an axially symmetrical g factor. Two of
the g factors are equal (gl.)and correspond to the high
field peak of the spectrum, and the uniquegfactor (g")
corresponds to the low field peak. Consequently, it is
possible to obtain the principal values of the g factors
from a polycrystalline sample.
(ii) Molar Susceptibility Measurements
Before any measurements were taken which involved
a true intensity value and, therefore, a true representation
of the spectrum, all the spectra were checked to ensure that
the sample was not saturated. This was accomplished by
displaying the spectrum on the oscilloscope and observing
the effect produced by increasing the microwave power. Also,
every precaution was taken to eliminate any modulation
broadening, and the amplitude of the 100KHz modulating field
was not allowed to increase to a value above one tenth of
the signal linewidth.
The molar susceptibilities of both single
crystals and polycrystalline samples were obtained by
comparison of the signal intensities with standard DPPH

-96-
samples, using the same spectrometer settings. This
involved knowledge of the weights of the DPPH samples
and the samples under study, the number of spins in the
DPPH samples, and the molecular weights. The accuracy
of the molar susceptibilities estimated using this method
was not very good, being of the order of about 20%, and
resulted from the error in the small weights of the
samples, the uncertainty in the consistency of sample
positioning, and the errors involved in the integration of
the signals and the assessment of the cavity Q. Although
larger samples would have been more desirable, more than
3-4mg of the TCNQ complex salts led to serious
depreciation of the Q of the cavity and, therefore, could
not be used.
From a knowledge of the exchange integral, J,
obtained as described in the next subsection, the
theoretically expected molar susceptibility value for a
localised triplet exciton could be calculated using
equation 2.26. This value could then be compared with the
experimentally observed value to assess the localisation
of the electrons giving rise to the signal.
(iii) Temperature Dependence of the Signal Ihtehsities
Single crystals were oriented at room temperature
with one of the principal magnetic axes parallel to the
external magnetic field, as outlined in section 3.2.3(i).

-97-
The temperature dependence of the signal intensities was
then investigated at this orientation in the temperature
region 300 to 4.5K. Absolute susceptibility measurements
were only taken at room temperature, and so the results
obtained in this study were of the relative intensi tie s
with temperature. From these results, using the treatment
described in section 2.5.1, semilog plots were obtained
of the relative intensity multiplied by temperature against
reciprocal temperature, the slope of which gives the valueof the exchange integral.
Three crystals were studied in this way for each
TCNQ complex salt under investigation. Each principal
magnetic axis in turn was the rotation axis and results
were obtained with each axis in turn being oriented
parallel with the magnetic field, as shown in Figure 3.10.
Normally, the three rotation axes chosen corresponded
approximately to the three external axes of the crystal,
which are also illustrated in Figure 3.10.
The spectrum observed from a single crystal was
of the symmetrical form shown in Figure 3.3(b), and the
parameters of interest in this intensity study are the
linewidth (~H) and the peak to peak height (Ht). Using
the measured values, the intensity I of the signal was
calculated using equation 3.3.
I = (LlH)2 x Ht •••• (3.3)
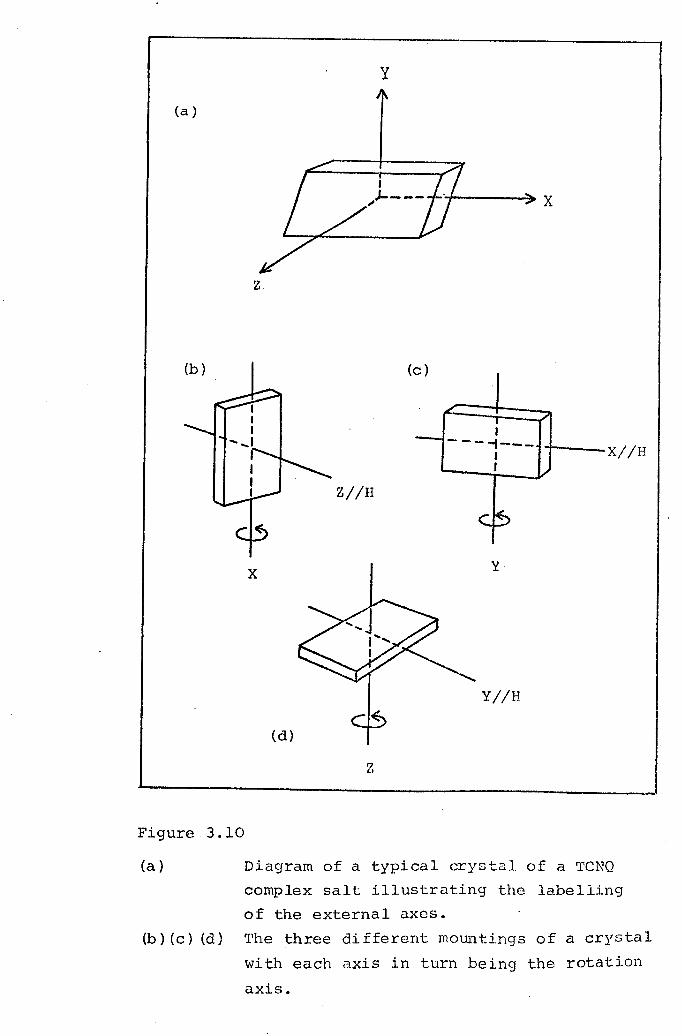
y
(a)
z
(b) (c)
X//HI---,---II
Z//H
x y
Y//H
(d)
z
Figure 3.10
(a) Diagram of a typical crystal of a TCNQcomplex salt illustrat.ing the labelling
of the external axes.(b) (c) (d) 'l'he three different mountings of a crystal
with each axis in turn being the rotation
axis.

-98-
In the case of polycrystalline samples, although
less information can be gained, the exchange integral can
be estimated from the spectra by obtaining the signal
intensities using the analog integrator. Two uncompacted
polycrystalline samples of each TCNQ complex salt were
studied in this way to ensure reproducibility of the results.
(iv) Dipolar Interaction Study
At room temperature,the signal from a single
crystal of a TCNQ complex salt consists of one single
symmetrical peak. However, with some compounds, the
linewidth of this signal is seen to increase with
decreasing tempeMature, ultimately splitting into two peaks
which then progressively move further apart and their
linewidths decrease with further decrease in temperature.
The two peaks arise from dipolar interaction between two
electrons, previously described in section 2.5.2, and
their behaviour with increasing temperature is due to an
exchange interaction, also described in Chapter 2.
The narrowing of the two peaks and their
separation remain constant below a certain temperature,
which depends on the extent of the dipolar interaction,
and at tnLs tenperature the angular variation of both the
g factor and the peak separation was monitored. The
separation, d, is measured from the cross~over points at
the base-line of the two signals, since these points
-99-
correspond to the position of maximum intensity in the
absorption spectrum. The results were then fitted to
the theoretical equations using the University's ICL 1906A
computer to obtain the best estimates of the parameters D
and E. The programme used was a standard Fortran curve-
fitting procedure (denoted by E04 GAF in the computer)
and could also be adapted for use in the g factor study.
The temperature dependence of the peak separation
and the linewidths of the fine structure peaks and the
resulting single peak are well described by the treatment
resulting in equations 2.44 to 2.47. From these equations,
it is possible to calculate the frequency of spin exchange,
v, from the observed linewidth and peak separation data.
The activation energy for exchange, ~Ee' was also obtained
from the slope of a semilog plot of the frequency against
reciprocal temperature, using equation 2.47. This in turn
led to an estimate of the activation energy for exciton
migration, ~E , using equation 2.49.m
(v) Lineshape Study
The lineshape of the spectrum contains
information about the environment of the species giving
rise to the e.s.r. signal and the extent of its
delocalisation. However, although a great deal of
information cannot be obtained from the lineshape on its
own, it can provide valuable confirmation regarding the

-100-
interpretation of other results obtained. Consequently,. 1 1· 137 f d th t b da Slmp e ana YS1S was per orme on e spec ra 0 serve
in order to ascertain the lineshape. This involved
investigating each half of the derivative signal separately,
thereby obtaining a measure of the rate at which the signal
increases to or decreases from the points corresponding to
the maximum or minimum slope of the power absorption curve
in relation to the magnetic field. The results could then
be compared with the behaviour of standard Gaussian and
Lorentzian lineshapes.
(vi) Spin-Lattice Relaxation Time Study
Whereas linesh~E~~ __are determined by the types
of interactions between the spin system and its
environment, the linewidths depend on the strength of the__./'.- .... ~.-.
interaction and the relaxation time. Consequently,
relaxation times can be obtained from a study performed on
the linewidths of the spectra. This study was undertaken__ -- .. _.._ .....
for two reasons. Firstly, to confirm and aid in the
interpretation of other results obtained and, secondly, to
investigate the cause of observed linewidth behaviour not
readily explained.
Techniques for determining relaxation times fall
into two categories, direct and indirect. In direct methods,
the spin system is disturbed from equilibrium by an abrupt
power input, and the system is observed during the return

-101-
to equilibrium. Indirect methods involve measurements ofparameters that are functions of the relaxation times,
and the choice of method depends on the complexity of the
lineshapes being studied and the complexity of apparatus.
The method employed in this work was that ofsaturation-broadening and was chosen because the extra
apparatus required was available and the lineshapes of all
the TCNQ complex salts studied were ~orentzian, a necessary
criterion in the theory behind this method.
For Lorentzian lineshapes, it has been shown148
that the linewidth and the peak height of the derivative
of the absorption curve depend upon microwave power in the
following way, given in equation 3.4.
2 ·4[ 2 *22 *2J(~H) = 3 (1 + HITIT2y )/y (T2) ••.• (3.4)
AB is the linewidth of the derivative absorption curve, HI
is the microwave magnetic field strength, y is the
magnetogyric ratio of the electron, Tl is the spin-lattice*relaxation time, and T2 is related to the inverse of the
linewidth.
The crystal under study was placed in the cavity
at the desired orientation and the linewidths were then
obtained as a function of microwave power at different
temperatures. The linewidths increased as the microwave
f power was inGreased beyond the point at which the signal

-102-
became saturated. /From these results, a plot of (LlH)2
./against Hi was obtained for each temperature studied,*which yielded a straight line with a slope equal to _~_':I\/~T2
2 * 2and an intercept of 4/3y (T~). Furthermore, the calculated*values of Tl and T2 were plotted as a function of inverse
temperature in order to observe the variation of these
parameters in the temperature range studied.
The microwave magnetic field strength, HI' wasidetermined fDr each temperature and power level used by
I measuring the incident power using a Marconi Type 6460
t d k· f thO I t·148. .powerme re, an rna ~ng use 0 e re a ~on . g~ven ~nequation 3.5.
//H12 = (8Q/vVc)[I +(c/2a)2J-l(1±lrOE~)P .••• (3.5)
In this expression, v is the resonant frequency, c and a are
the length and breadth respectively of the cavity, Q is the
loaded Q value with the sample present, Vc is the volume of
the cavity, P is the incident power in mW, and the term
(1±lrOEI) reduces to unity as the reflection coefficient
rOE is so small it becomes negligible.
For the cavity used in this work, equation 3.5reduces to equation 3.6.
Hl2 = (4.90 x 10~7)PQ •••• (3.6)
The Q measurements were the most inaccurate, aaving an error
of approximately ±lO%, and as such set the limit of accuracy

-103-
of the spin-lattice relaxation time measurements.
(vii) Estimate of Curie Spins
The number of spins displaying a Curie law
behaviour at low temperatures, usually below 30K, was
estimated by comparison with standard DPPH samples, as
outlined in section 3.2.2(vi). This study could only beperformed on polycrystalline samples for two reasons. In
order to obtain a spectrum large enough for such an
investigation, at least 2-3mg of the TCNQ complex salts
were needed. Also, the single crystals, being of a more
regular stoichiometry and greater perfection and, therefore,
containing less of the species giving rise to the Curie
signal, did not exhibit this behaviour until very low
temperatures indeed,and the extremely narrow temperature range
available made such a study impossible.
In the case of the polycrystalline samples, the
spectrum shape shown in Figure 3.9 usually collapsed at
these low temperatures to give a single symmetrical signal,
which is essential for this study. However, with some of
the samples studied, the spectrum did not lose its axially-
symmetric shape and, therefore, an estimate of the number of
Curie spins using this technique could not be obtained.
In these cases, and also for single" crystals, an
estimate could be obtained from the semilog plots obtained

-104-
in the investigation described in section 3.2.3(iii).
These plots gave a straight line in the temperature region
where depopulation of the triplet state was occurring.
However, at low temperatures, the plots showed a curvature
which was caused by a contribution to the intensity by the
Curie Species. At even lower temperatures, where the Signal
from this species dominates, the product of the intensity
with temperature remains constant. Therefore, byextrapolating this curvature to its limiting value, and
with a knowledge of the room temperature molar susceptibility,
it was possible to estimate the number of spins per mole
obeying the Curie law. This was considered to be a valid
estimate, as the results obtained in this way agreed very
well with results obtained for the same samples using the
oscilloscope technique, whenever the latter could be
employed.

CHAPTER 4
RESULTS AND DISCUSSION OF E.S.R. STUDIES
OF TCNQ COMPLEX SALTS AVAILABLE AS
SINGLE CRYSTALS.
"Science is built up with facts, as a house
is with stones. But a collection of factsis no more a science than a heap of stones
is a house."
Jules Henri Poincare
1854 - 1912

-105-
DCBP(TCNQ)~="':"::'=~3
The cation 1,2-di(N-p-cyanobenzyl-4-pyridinium)-
ethane (DCBP) is divalent and, consequently, this TCNQ
4.1
complex salt has one neutral and two negatively charged
TCNQ molecules. DCBP(TCNQ)3 crystallised readily fromsolution forming crystals of the shape shown in Figure
3.l0(a). Therefore it was possible to distinguish three
distinct external axes for each crystal, each axis being
labelled as the x, y or z axis, as is shown in Figure 3.10(a).
An X-ray crystallographic structure analysis of
this compound has been performed in this department, and
the projection along the a-axis is illustrated. in Figure
4.1. The crystallographic axes a, band c correspond
approximately to the external axes x, y and z respectively.The smallest dimension of the crystal (z-axis) is
approximately parallel to the perpendicular to the molecular
plane of each TCNQ molecule. The longest crystal dimension
(x-axis) is almost parallel to the long molecular axis ofeach TCNQ molecule and, therefore, the intermediate of the
crystal (y-axis) is approximately parallel to the short
molecular axis of each TCNQ molecule.
As can be seen from Figure 4.1, the cations not
only separate each TCNQ_ stack, but also separate the triads
within each stack. The p-cyanobenzyl end groups protrude
into the stack, as if taking the place of a fourth TCNQ

Figure 4.1
DeBP (TCNQ) 3
Projection of the crystal structure a.long the a-axis.
-106-
molecule, such a tetrad being in actual fact the preferred
stoichiometry of TCNQ complex salts having divalent cations.
Each triad is isolated from the others, therefore, in
directions x and z, but not along y, which is the stack-to-
stack direction. This would most probably be expected to
result in approximately isotropic conductivities in two
directions and a lower conductivity in the direction
through the planes of cations. This is fairly unusual for
these compounds, as normally all the three directions have
differing conductivities. Preliminary conductivity .
measurements149 have indicated that the room temperature-5d.c. conductivity for DCBP(TCNQ)3 is approximately 10
ohm-l cm-I, which is lower by several orders of magnitude
than for the similar complex salt N,N'-dibenzyl-4,4'-
bipyridinium(DBBP}-(TCNQ}4. From the crystal structure of
DBBP(TCNQ}4150, the cation does not protrude into the
TCNQ stack and, therefore, it would appear that the
intrusion of the long cations in DCBP(TCNQ)3 is reflected
in a significant lowering of the conductivity along the
stacking direction, which is normally the most conductive
axis. In order to investigate how this unusual structure
might affect the magnetic properties, e.s.r. studies of
this complex salt were undertaken.
Three crystals of DCBP(TCNQ}3 were studied, each
axis in turn being the rotation axis, as described in
section 3.2.3(iii) of the previous chapter. Crystal 1 was

-107-
mounted with the x-axis as the axis of rotation and,
consequently, the plane under study as the crystal was
rotated relative to the magnetic field contained the
y- and z-axes. Similarly, crystals 2 and 3 were mounted
with the z- and y-axes as the rotation axes, and the xy
and xz planes respectively were investigated as the
crystal was rotated.
During a preliminary investigation of crystal I,
it was found that a single symmetrical e.s.r. signal was
observed at room temperature. However, on lowering the
temperature, the spectrum changed in the manner shown in
Figure 4.2. This is indicative of exchange interaction
which results in the collapse of fine structure caused by
dipolar interaction between two electrons, these two
phenomena having been previously discussed in section
2.5.2 and illustrated in Figure 2.12. This behaviour has. 23 33 120 121 151 152been observed 1n many TCNQ complex salts ' , , , , ,
and is associated with the presence of localised triplet
excitons. The observation of this behaviour is, therefore,
not altogether surprising in DCBP(TCNQ)3 with regard to the
low conductivity observed with this compound and the
segregation of the triads, which might be expected to
cause the triplet exciton to be restricted on one such
group of TCNQ molecules. Furthermore, with only three
TCNQ molecules in each group within the st.ack-, the two
electrons constituting the triplet species must have a

300K ~(U
260K
Figure 4.2DCBP(TCNQ)3Effect of exchange interaction with increasingtemperature on the spectrum of a single crystal.
210K
l80K
l20K

-108-
fairly small separation. The observation of measurable
dipolar splittings, therefore, confirms the close
proximity of the two electrons, as the extent of the
dipolar interaction is very dependent on the average
distance between them.
Figure 4.2 differs from Figure 2.12 in that there
is a central signal in addition to the two outer lines
which constitute the fine structure expected from a localised
triplet exciton. The type of spectrum shown in Figure 4.2
has also been observed previously with many TCNQ complex
salts and the proposed interpretation of this central signal
will be discussed with the temperature dependence of the
signal intensities presented later in this section.
The dipolar splitting of the two outer peaks
remained at a constant value below l20K and, consequently,
the angular variations of this splitting and the g factor
were monitored at this temperature. The experimental
results are shown in Figure 4.3 to 4.8, which also show
the results obtained from the computerised least-squares
curve~fitting procedure for obtaining D, E, gx' gy' gz' eand~. The values obtained for all these parameters which
give the best fit to the experimental data are presented
in Tables 4.1 and 4.2.

+90
1
-90
-200 oDipolar Splitting/MHz
Figure 4.3
+200
DCBP(TCNQ)3
Angular variation of dipolar splitting atl20K for crystal 1.
Approximate orientations: H//y-axis at -330H//z-axis at +570
Computer simulation.

+90
-9 0
+200
Figure 4.4DCBP(TCNQ)3Angular variation of dipolar splitting at120K for crystal 2.Approximate orientations: H//y-axis at -87°.
H//x-axis at +3°.
+100Dipolar Splitting/MHz
computer simulation.

+90
-90
-200 o +200Dipolar Splitting I MHz
Figure 4.5DCBP(TCNQ)3Angular variation of dipolar splitting atl20K for crystal 3.Approximate orientations: Hllx-axis at +37°.
Hllz-axis at -53°.Computer simulation.

+90
o
-90 oI
2.0CJ60 2.0064
Figure 4.6DCBP(TCNQ)3Angular variation of g factor at l20K forcrystal 1.Approximate orientations as for Figure 4.3.--- Computer simulation.
o
o
o
o
2.0056
g factor

+90
o<,Q)r-Itn~<
-90
o
2.0063 2.0065 2.0067
g factorFigure 4.7DCBP (TCNQ) 3
Angular variation of g factor at l20K forcrystal 2.Approximate orientations as for Figure 4.4.------ Computer simulation.
o
o

+90
-90
oo
2.0060 2.0064 2.0068
g factor
figure 4.8.DCBP(TCNQ)3Angular variation of g factor" at l20Kfor crystal 3. "Approximate orLent.at.Lonsas for Figure 4.5.
Computer simulation.
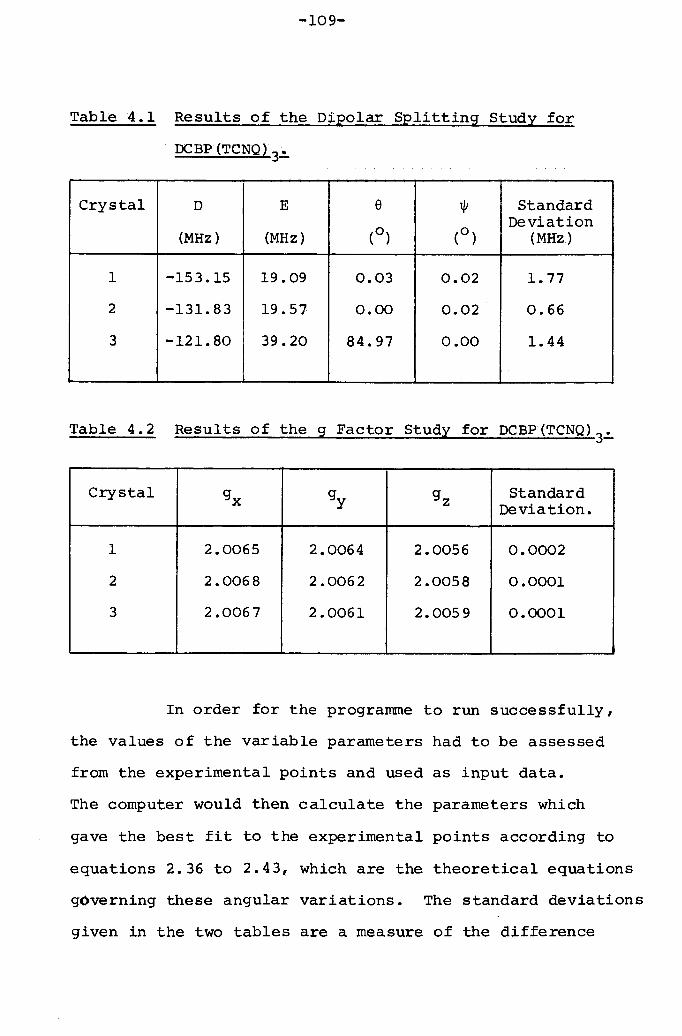
-109-
Table4.l Results of the Dipolar Splitting Study for
DCBP (TCNQ)3..!.
Crystal D E e 1jJ StandardDeviation
(MHz) (MHz) (0) (0 ) (MHz)
1 -153.15 19.09 0.03 0.02 1.772 -131.83 19.57 0.00 0.02 0.663 -121. 80 39.20 84.97 0.00 1.44
Table 4.2 Results of the g Factor Study for DCBP(TCNQ)3~
Crystal gx gy gz StandardDeviation.
1 2.0065 2.0064 2.0056 0.00022 2.0068 2.0062 2.0058 0.00013 2.0067 2.0061 2.0059 0.0001
In order for the programme to run successfully,
the values of the variable parameters had to be assessed
from the experimental pOints and used as input data.
The computer would then calculate the parameters which
gave the best fit to the experimental points according to
equations 2.36 to 2.43, which are the theoretical equations
g6verning these angular variations. The standard deviations
given in the two tables are a measure of the difference
-110-
between the calculated and experimental values of the
variable parameters. The standard deviation in Table 4.1
is less than the ±2% error estimated in section 3.2.2(iv)
for measurement of the splittings. Similarly, in Table
4.2 the standard deviation is seen to be less than the
error involved in the g factor measurement, estimated in
section 3.2.3(i).
The signs of D and E values given in Table 4.1
are those given by the computer and show that these two
parameters must be opposite in sign for a fit to the
experimental data. However, it is not possible to
definitely assign D and E as positive or negative, as this153can only be done from low temperature measurements •
Therefore, the average values obtained in this work for
the zero-field splitting parameters of DCBP(TCNQ)3 are
±(136±18)MHz for D and ± (26±13)MHz for E.
The dimensionality of these complex salts hasbeen shown23,Sl,lS4 to be reflected by the g factor
variation in single crystals. These studies have shown
that the g tensor most closely associated with the
stacking direction is closer to the free electron value
of 2.00232 than those associated with the other two
directions. It can be seen from the values of the g
factors in Table 4.2 that there is not a great deal of
anisotropy of the g factor in this complex salt. The

-111-
average values obtained for gx' gy and gz are 2.0067,
2.0062 and 2.0058 respectively with an experimental error
of ±O.0003. The stacking direction (z-axis) has thesmallest principal value of the g tensor, that is, the g
factor closest to the free electron value. However, the
differences between the three g values are not well outside
the error involved, and this small degree of anisotropy
relates well with the crystal structure analysis. Therefore,
the g factor measurements and comparison of the d.c.
conductivity with DBBP(TCNQ)4 both suggest that the degree
of one-dimensionality in this compound has been reduced by
the intrusion of the end groups of the cations into the
TCNQ stack.
Chestnut and Phillips23 have compared 0 and E
values obtained with various TCNQ complexes with the
parameters observed for naphthalene, in which the triplet
state is confined to a single molecule, and also with
ethylene. From these comparisons, it became clear that
the greater 0 is with respect to E, the greater is the
two-dimensional extent of the molecular plane. Also, the
magnitudes of 0 and E reflect the average spacial
distribution of the correlated spins of the exciton.
Therefore, as the spins remain near each other so that
they interact more strongly, the 0 and E values increase.
The results obtained for DCBP{TCNQ)3' from similar
comparisons, agree well with this interpretation, as the

-112-
relatively small values of D and E indicate the tripletexciton does not reside on a single molecule, but is
delocalised over several TCNQ molecules, which allows the
effective distance of separation of the electrons to be
comparatively large.
The crystal structure analysis indicated that the
two unpaired electrons constituting the triplet exciton are
mainly residing on the two outer TCNQ's of the triad at a
distance O.644nm apart, the intermolecular spacing being O.322nm.
The most recent approximate treatment of the variation of D and, h hi ,121, h 'E w~t t 1S average separat10n ,assum1ng t e Slze of the
triplet exciton is a unit cell along the stack, shows that
the D and E values for DCBP(TCNQ)3 indicate an average
separation of O.583nm, which is consistent with the charge
distribution obtained in the crystal structure analysis. Itis interesting to note that, because of the small singlet-
triplet energy gap of the majority of TCNQ complex salts,the
information obtained at room temperature from crystallography
data will largely reflect the electron distribution in the
triplet state.
The results obtained127 for DBBP(TCNQ)4 give Das ±202MHz and E as *3CMHz, and the distance calculated
between the two electrons agrees well with the crystal
structure analysis, which indicates that the electrons
are localised mainly on the two central TCNQ molecules in
the tetrad. The small D and E values obtained for
-113-
DCBP(TCNQ)3 in this work are consistent with these
results as they are of the correct order of magnitude
expected for the electrons being localised on the outer
TCNQ molecules of a triad. Furthermore, as previously
mentioned in section 2.5.1, Frenkel spin excitons are
strongly correlated electrons which move as a pair,
whereas Wannier spin excitons are not strongly correlated
and the electrons move independently of each other.
Therefore, the observation of measurable dipolar
splittings in this complex salt provides evidence for
Frenkel triplet excitons localised on the triad, which
indicates a value close to zero for the alternation
parameter, y.
Flandrois and Chasseaul55 have examined most of
the known crystal structures of TCNQ complexes and have
determined a correlation between the zero-field splitting
parameters with the degree of charge density, calculated
from the bond lengths of the TCNQ molecules, and the
separation of the molecules on which the two electrons
reside. This treatment has been applied in this work and
the results are shown for this and other reported TCNQ
complex salts in Figure 4.9. The calculation of the
charge density, p, for DCBP(TCNQ)3 used the TCNQ bond
lengths obtained from the crystallography data and a value
of 0.644nm for the separation, d , between the two TCNQ
molecules. It can be seen from Figure 4.9 that the results
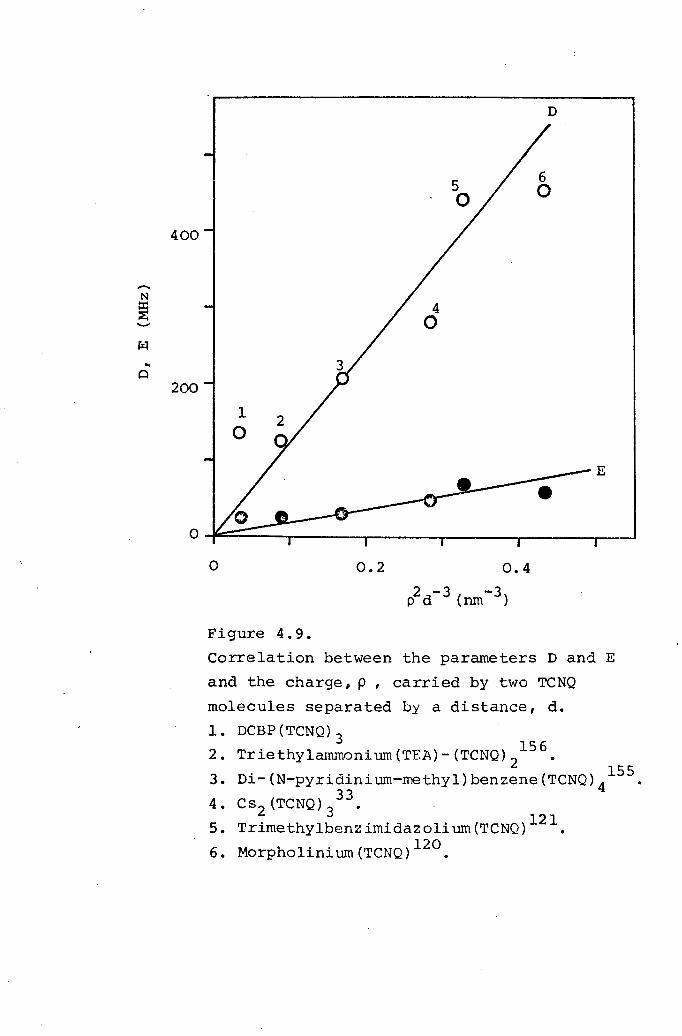
400
1o
D
-N~
6o
- 4o
...Cl
200
E
o 0.2 0.4p2d-3 (run -3)
Figure 4.9.Correlation between the parameters D and. Eand the charge, p , carried by two TCNQmolecules separated by a distance, d.1. DCBP(TCNQ)32. TriethYlammoniurn(TEA)-(TCNQ)2156•3. Di-(N-pyridiniurn-methYl)benzene(TCNQ)4155•
334. CS2(TCNQ)3. .5. Trimethylbenzimidazoliurn(TCNQ)121.6. Morpholini urn('rCNQ)120.
-114-
for the compound under study are in reasonable agreement
with results of other complexes.
The collapse of the fine structure observed and
the subsequent narrowing of the resulting single e.s.r.
peak were investigated from 300 to 120K. As discussed in
section 2.5.2, the exchange phenomenon resulting in this
behaviour is well described by equations 2.44 and 2.46,
and the values of the exchange frequency, v, obtained from
these equations can be plotted in the form of log v againstliT. Figure 4.10 illustrates a typical example of such a
plot for DCBP{TCNQ)3 and it can be seen that, although re-
sults obtained using equations 2.45 and 2.46 agree, there
is a discrepancy between these results and those calculated
from equation 2.44. Results similar to these, alsoshowing such an anomaly, have been previously
t d120,122,151,157 f th TCNQ 1 salts.repor e or 0 er comp ex The
linearity of the plots indicates that the exchange
interaction is activated and, using equation 2.47, the
activation energy for exchange, ~Ee' can be obtained from
the slopes. The average value of flEe for the three crystals
studied in this work, using equations 2.45 and 2.46, is-1l3.5±2.0kJ mol ,whilst the value using equation 2.44 is
-1only 2.5±1.lkJ mol •
The persistent occurrence of this anoma Ly with
respect to the doublet separation data has so far defied

4 8
Figure 4.10tear (TCNQ) 3'
Semilog plot of the frequency (in MHz) ofexciton spin exchange interaction againstreciprocal temperature for crystal 2.H is approximat~ly parallel to the y-axis.Frequencies calculated from: (:.,Equation 2.44
• Equation 2.45o Equation 2.46

-115-
explanation although several proposals have been made.104Lynden-Bell and McConnell postulated a temperature
dependent do value arising from the existence of broad
exciton bands having a bandwidth of the order of kT.However,
the 'observations made on complex salts displaying measurable
dipolar splittings strongly indicate that the effective
exciton bandwidth must be very small, because the motion ofthe exciton is diffusional rather than wavelikel16• Therefore,this would not be expected to be the case in the localised
( ) . 158 hDCBP TCNQ 3' The most reasonable explanatlon of t etemperature dependence of the dipolar splittings considers
the exciton as a result of correlation between an electron
and a hole,and proposes that the mean distance between themincreases with temperature. This might be caused by expansion
of the lattice, which would be expected to result in a temper-
ature dependent value for the singlet-triplet energy gap,J.
Kepler24 originally discussed such a possibility but also
pointed out that any change in the value of J could only be
detected from absolute susceptibility measurements over the
temperature range under consideration. As the determination ofthis quantity is not sufficiently accurate using e.s.r.,the
proposal could not be investigated for this compound.However,it is generally considered that the activation energies for
exchange calculated from the linewidth data are more likely to
be correct, as values obtained from the line separation data
have been found to be less than J in this and other
k 122,151wor s • Explanation of the behaviour resulting from
-116-
exchange interactions relies on the presence of the triplet
excitons, therefore an activation energy for exchange less
than the energy required to form a triplet exciton is
difficult to perceive. Furthermore, calculations from
spin-lattice relaxation measurements159 have supported the
values of ~Ee obtained from the linewidth approximations of
equations 2.45 and 2.46.
Although early considerations23, which only
considered the line separation data, obtained an
equivalence of J and ~E , it only led to confusion as theeauthors concluded that the temperature dependence of the
exchange arose simply from the temperature dependence of
triplet state population. This led to inconsistencies
between experimental results and the theory of exciton-
exciton interactions as they neglected the possibility of
exciton migration which is essential for the explanation
of many of the features of the e.s.r. spectra obtained
with TCNQ complex salts. This contribution to the value
of ~E has been previously mentioned in section 2.5.2 anderesulted in equation 2.49. The average value for the
activation energy for exciton migration, obtained from this
equation, is 5.6±2.1 kJ mol-I, using the average value of
~E obtained from the linewidth approximations. This valueeof ~E is further evidence for localised triplet excitons
min DCBP(TCNQ)3 as it indicates an activated hopping process
as the mechanism for exciton migration,

-117-
The analysis of the observed exchange phenomenon
for DCBP(TCNQ)3 outlined above is in agreement with
published results for other TCNQ complex salts, and yields
values of the exchange parameters consistent with
localised triplet excitons, whose activated motion results
in exciton-exciton collisions causing an averaging of the
dipolar interaction. These conclusions are supported by
line shape analyses performed on the spectra obtained in both
the 'slow' and 'fast' exchange regions, and are presented
in Figures 4.11 and 4.12. As mentioned in section 2.4.8,
a Lorentzian lineshape is a strong indication of the
presence of exchange interactions, and the lineshapes
obtained for DCBP(TCNQ) 3 provide confirmation that the
observed signals are indeed arising from migrating species.
Calculation of the exciton lineshapes, based on the theory
f . 1 . 160 h b . b 107 ho mot~ona narrow~ng , as een g~ven y Soos T e
theory predicts Lorentzian lines for localised diffusional. 161 162excitons in agreement with exper~ment ' ,and also
gives correct residual hyperfine linewidths from the
calculated jumping rate. The fact that the anisotropic
hyperfine interactions ~o contribute to the linewidths at
low exciton densities has been confirmed by their angular
dependence in high magnetic field and by deuterium
substitution162• This contribution to the linewidth is
unresolved even in localised excitons which, although at
high temperatures move by a thermally activated process,
still move by a non-activated process at low temperatures
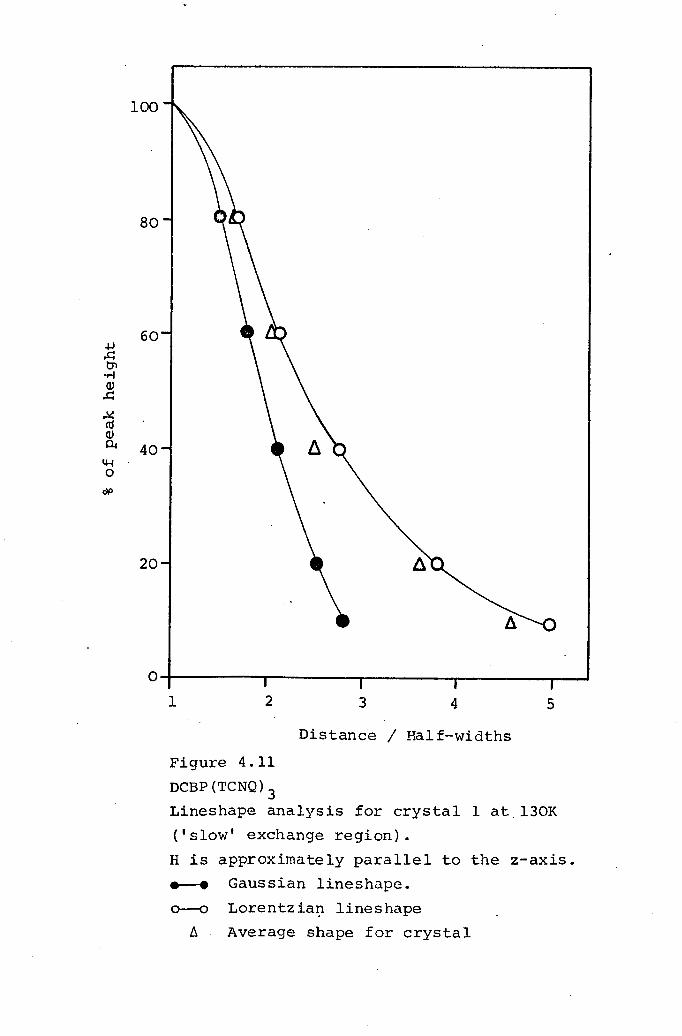
100 --
60.j.J..c:tra-r-!(])..c:~cd(])~ 40IH0
dP
..
80
20
O~--------r-------~--------~--------~~1 2 43
DistanCe / Half-widthsFigure 4.11DCBP(TCNQ)3Lineshape analysis for crystal 1 at.130K('slow' exchange region).H is approximately parallel to the z-axis •....-. Gaussian lineshape.0--0 Lorentzia~ lineshape
~ Average shape for crystal
5

J 10
o;---------~------~r-------~---------r--~1 2 43
Distance / Half-widthsFigure 4.12DCBP(TCNQ)3Lineshape analysis for crystal 1 at 270K('fast' exchange region).H is approximately parallel to the z-axis.____ Gaussian 1ineshape0--0 Lorentzian lineshape.~ Average shape for crystal.
5
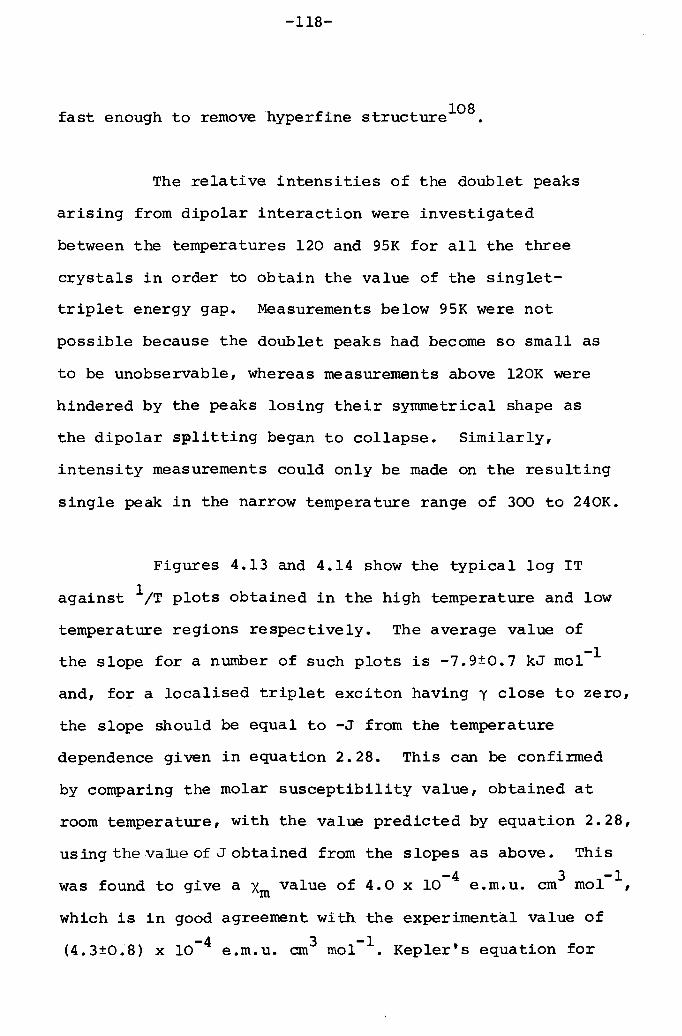
-118-
fast enough to removehyperfine structurel08•
The relative intensities of the doublet peaks
arising from dipolar interaction were investigated
between the temperatures 120 and 95K for all the three
crystals in order to obtain the value of the singlet-
triplet energy gap. Measurements below 95K were not
possible because the doublet peaks had become so small as
to be unobservable, whereas measurements above l20K were
hindered by the peaks losing their symmetrical shape as
the dipolar splitting began to collapse. Similarly,
intensity measurements could only be made on the resulting
single peak in the narrow temperature range of 300 to 240K.
Figures 4.13 and 4.14 show the typical log IT
against liT plots obtained in the high temperature and low
temperature regions respectively. The average value of
the slope for a number of such plots is -7.9±0.7 kJ mol-l
and, for a localised triplet exciton having y close to zero,
the slope should be equal to -J from the temperature
dependence given in equation 2.28. This can be confirmed
by comparing the molar susceptibility value, obtained at
room temperature, with the value predicted by equation 2.28,
using the value of J obtained from the slopes as above. This-4 3-1was found to give a Xm value of 4.0 x 10 e.m.u. cm mol ,
which is in good agreement with the experimental value of
(4.3±0.8) x 10-4 e.m.u. cm3 mol-I. Kepler's equation for
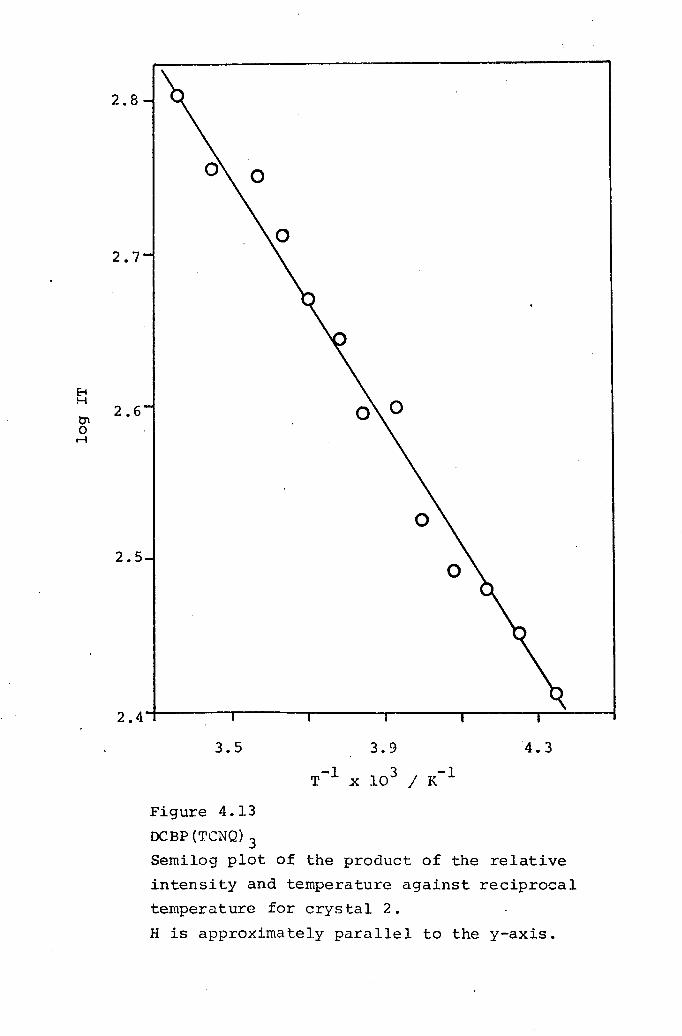
E-tH
0\or-I
3.5 4.3
Figure 4.13DCBP (TCNQ) 3
Semilog plot of the product of the relativeintensity and temperature against reciprocaltemperature for crystal 2.H is approximately parallel to the y-axis.

2.1
1.9
1.78H
1.5
1.3
1.18 9 10
T-1 x 10³ / K-1Figure 4.14DCBP (TCNQ) 3
Sem iLo q plot of the product of the relativeintensity and temperature against reciprocaltemperature for crystal 1.H is approximately parallel to the z-axis.

-119-
localised triplet states, given in equation 2.26, yields
a theoretical value of 3.6 x 10⁻⁴ e.m.u. cm3 mol-l for this
compound. Therefore, comparison of the molar susceptibility
values calculated from equations 2.26 and 2.28 with the
experimental value indicates the presence of localised
triplet excitons in DCBP(TCNQ)3' Although the assessment
of the susceptibility is complicated by the presence of the
central signal, which will make a contribution to the
observed value, the above comparison is considered to be
still valid as this contribution is calculated to be very
small.
As the temperature was decreased from room
temperature, the signal was observed to split into three
symmetrical peaks, as illustrated in Figure 4.2. The
outer two peaks have been interpreted in terms of the
doublet produced as a result of dipolar interaction, and
the broader central signal, which had a g factor close to
the free electron value, was initially thought to be due
to defects in the lattice resulting in isolated monoradical
ions. However, the intensity study of this signal, performed
below 120K, was not found to follow the expected Curie law
behaviour for such doublet state species but followed the
behaviour attributed to a ground singlet state with a
thermally accessible excited triplet state. Spectra of
this type with a central signal have been reported in other
TCNQ complexes but, in the majority of cases, the central

-.L£V-
signal did follow the expected Curie law temperature
d .d 151,157,158,163epen ence • However, there have been23 33 120 121 .reports ' , , of central slgnals displaying triplet
behaviour with smaller values of the exchange integral
than those of the 'regular' excitons.
A typical log IT against liT plot for the central
resonance observed in this work is shown in Figure 4.15,and
the average value of the slope taken from a number of such
plots was found to be -2.l±0.3 kJ mOl-I. The ratio of the
intensity of this signal to the intensity of the doublet
signal was observed to be of the order of 1% and wasapproximately the same in all the three crystals studied.
This central signal,therefore,appears to be a characteristic
property of the system.
As the regular excitons in DCBP(TCNQ)3 are
essentially localised, it is not unreasonable to assumethat this new triplet species is also localised.
Consequently, the above value obtained from the slopes of
the log IT against liT plots should be equal to the singlet-
triplet energy gap for this species. As the value of J isvery dependent on the distance between the electrons
constituting the triplet, this new exciton must be larger
than the regular one in order to have such a small interaction.
Furthermore , for a localised triplet, one might expect to
observe dipolar interaction in this exciton also, althoughsuch interaction from eiectrons situated far apart would

2.6
2.3
2.0
8H
~o...-t 1.7
1.4
1.1
o
o
8 24
Figure 4.15DCBP(TCNQ)3Semilog plot of the product of the relativeintensity and temperature against reciprocaltemperature for the central peak for crystal2. H is approximately parallel to the y-axis.

-121-
not give any measurable sp1i.tting until low tempera.tures
when the exciton density would be small. Even then, any
dipolar splitting might well be smaller than the natural
1inewidth of the e.s.r. signal and so be undetectable.
In fact, at about 30K, the signal observed with crystal 2
did show signs of some splitting, although there was no
broadening of the linewidth which usually accompanies the
onset of such behaviour. On decreasing the temperature
even more, the signal intensity rapidly increased with a
Curie law behaviour, thus obscuring any fine structure
which may have been observed. Therefore, whether this
signal does exhibit dipolar splitting is debatable,
although a 1ineshape analysis (Figure 4.16) showed this
signal to have a Lorentzian 1ineshape, which would be
consistent with the presence of exchange interaction
associated with a migrating species.
Below 80K the central resonance, which was the
only signal observed at this temperature as the doublet
peaks were now almost undetectable, appeared to be composed
of two lines, a broad line with a superimposed sharp spike
at the centre. This type of central signal has been. 1 b d120. h d d I h dpzeva ous y 0 serve a.not er compoun s an a so s owe
a similar temperature dependence to that obtained in this
work. The spectrum persisted down to approximately 20K,
below which a symmetrical signal was observed .following
Curie law behaviour. In addition, the line began to show

.jJ..c:tn-..-I(])
..c: 60
~(])O!4-t0
eN>
40
100
80
20
o1 2 3 4 5
Distance / Half-widths
Figure 4.16
DCBP(TCIJQ)3Lineshape analysis for cen·tral signal at 130K
for crystal 1.
H is approximately parallel to the z-axis.
e--e Gaussian lineshape0--0 Lorentzian lineshape
b. Average shape .j~orcrystal.

-122-
deviations from its regular shape as the temperature was
further decreased, and an asymmetrical line resulted.
Estimates of the intensity hehaviour of this resonance
were, therefore, crude in this low temperature region.
However, the product of the intensity with temperature
appeared to remain nearly constant, shown by the
curvature in Figure 4.15, this type of behaviour being
that expected for a doublet state species suc~ as a single
radical anion of TCNQ existing as an imperfection in the
lattice. As previously mentioned, the low temperature
Curie signal in TCNQ complexes is widely accepted as arising
from such species. Therefore, the problem remains as to
the origin of the exponential temperature dependence
exhibited at higher temperatures by the central resonance.
The singlet-triplet behaviour of the new exciton
could arise from two possible interactions. Firstly,
interaction between spins situated on sites which are
located on different TCNQ stacks (all of which are
equivalent from the crystal structure determination) and,
secondly, interaction between unpaired electrons situated
on different sites within the same stack. Both these cases
would result in triplet excitons having a small interaction
from their greater distance separation, which results in a
small exchange integral and small dipolar splittings. The
first possibility seems unlikely, not only from the fact
that TCNQ complex salts are known to have negll.gible
interstack interactions, but also from the angular

-123-
dependence of the observed linew1.dth of this central
signal. A typical exaIl'Pleis shown in Figure 4.17 and
illustrates the same linewidth anisotropy for both the
regular exciton and the new exciton, as was the case in
all the three crystals studied. It should be noted that
the g factors of the signals arising from both species also
follow the same angular variation, and this identical
orientation behaviour is consistent with the two triplet
excitons being located on the same TCNQ stack.
As can be seen from Figure 4.17, the linewidth
observed for the new triplet species is larger than that
observed for the regular exciton and, in fact, the
linewidth of the central signal remained essentially
constant with variation of temperature at a given
orientation. There is little dispute that the narrow
lines observed for the zero-field components of the regularexciton at low concentrations are due to the rapid motion
of the exciton. In the case of the central signal, the
interpretation is more difficult as the structure of this
triplet species is not known in terms of the number of
TCNQ molecules over which the two electrons are
delocalised. However, it is considered that the greater
linewidth could possibly be due to a smaller hopping
frequency, although this is only tentatively proposed
owing to the lack of available evidence. This' would be
consistent with a species having such a low energy,

+90-
0-
-90-
o
o
•G 0
• 0
o-
-~00
o 000
-o.
o •- o
00
et)
oI
6
11
I
8
16t.H/MHz
Figure 4.17DCBP(TCNQ)3Angular variation of linewidths at '120K (forcrystal 3).Approximate orientations as for Figure 4.5.o t.Hvalues for outer doublet pe aks (upper
linewidth scale) •• L\H values for central sig-nal(lower linewidth
scale •
•

-124-
indicated by the small value of the singlet-triplet energy
gap, as this new exciton would require the same energy as
the regular exciton in order to exhibit the same degree of
motion. In other words, the new triplet exciton is
trapped. Hyperfine interactions would, therefore, be
expected to make considerable contribution to the linewidth.
Yet another possibility exists which, although
seemingly remote, should be mentioned. This is the possible
presence of Wannier excitons as a cause of the central
resonance. As previously mentioned, these are non-tightly
bound electron pairs exhibiting no fine structure splitting
and an exponential temperature dependence of the intensity.
Such spin excitations are apparently present in certain
donor-acceptor CT complexes as, for example,p-phenylenediamine-
chloranil(PDC}142. In view of the evidence already discussed
in terms of a localised species, the origin of this central
signal would not seem to be attributable to delocalised
Wannier'excitons. A treatment of the linewidth witht f b th t f' 't t' h h 142emperature or 0 ypes 0 spln eXCl a lons as s own
that Frenkel excitons have a greater exchange-narrowed
linewidth, which exhibi ts a different tempera ture dependence
from Wannier excitons. The linewidth of the new exciton in
DCBP(TCNQ}3 remained constant as the temperature was
decreased, consistent with the behaviour expected from
Wannier excitons. However, the fact that the new exciton
has a greater linewidth than the regular exciton is

-125-
contradictory to this evidence. It would appear, therefore,
that no definite conclusions can be made one way or the.
other, but the data would seem more consistent with the
proposal of localised triplet excitons having a small degree
of motion.
The interpretation of the origin of the species
giving rise to the central signal is considered to be most
probably due to a number of lattice imperfections capable
of triplet states with small values of the singlet-triplet
energy gap and small zero-field splittings, these species
residing on the same TCNQ stack as the regular excitons.
The estimation of the percentage of these new species which
would give the observed intensity ratio is consistent with
such a proposal. The existence of such imperfections is
not difficult to visualise in DCBP(TCNQ)3' as misalignment
of a cation could well result in the situation where the
end groups do not protrude into the TCNQ stack. This
would allow for the presence of tetrads of TCNQ molecules
in the stack, which allows for a greater separation between
the two electrons constituting the new triplet and
consequently smaller interaction. Such imperfections and
broadening by hyperfine interactions, since a localised
paramagnetic state is a.ssumed, could well lead to the
observed character of the central resonance. However, it
must be pointed out that the ~nterpretation of"this signal
is somewhat speculative as defects in the lattice could

-126-
also give r i set 0 doublet species which can be thermally
activated into excited states. Such species would exhibit
a similar exponential temperature dependence of the signal
intensity, consistent with the observed results.
From the extrapolated limit of the curvature obtained
at low temperatures from Figure 4.15, and from a knowledge
of the room temperature susceptibility, the number of doublet
species giving rise to the Curie signal can be estimated.
The value obtained for a number of such plots is (3.6±0.8) x1021, 1-1 h' h d t f 0 6sp~ns rna , w ~c correspon s 0 a percentage 0 .,
and can be reasonably attributed to the presence of non-
interacting monoradical anions possibly originating from
sites located at chain ends.
It has been shown154 that Frenkel and Wannier
excitons exhibit strikingly different spin-lattice
relaxation rates. Therefore, it was considered that such
a study might cast some light on the nature of the species
giving rise to the central resonance. Since the e.s.r.
lines for both the regular and new excitons were
Lorentzian, the spin-lattice relaxation time, Tl, could be
obtained by the method of progressive saturation as
described in section 3.2.3(vi). However, unfortunately
the maximum microwave power available fram the klystron
used in this work was not sufficient to saturate the
broad central signal and, therefore, the nature of the species

-127-
giving rise to this resonance remains speculative. The
available power did, however, saturate the outer doublet
peaks in the temperature range 120 to lSOK, and also the
resulting single peak above 260K. The range ISO to 260K
was unavailable for study due to the very broad lines
observed and the distortion of the signals as the splittingcommenced.
Typical examples of the effect of increasing the
microwave power on the linewidths of the derivative
signals, given by equations 3.4 and 3.6, is shown in
Figure 4.1S for two of the temperatures studied. Values
of Tl and T2* obtained from such plots were then plotted
against reciprocal temperature and the results are '_
presented in Figure 4.19. The values of T2* reflect the
change in the e.s.r. linewidth with temperature, and the
values of Tl appear from the plot to exhibit a minimum at
a temperature of approximately 220-230K. This type of
behaviour has been previously observedl54,159 in TCNQ
complexes and is representative of a Frenkel spin exciton
system. These results for DCBP(TCNQ)3 are, therefore,
consistent with the proposal of localised triplet excitons
in this complex salt.
The dependence of the minimum in T1 with
spectrometer frequency has been investigated by Jones159,
and the results showed that the temperature at which it

150N
Ng<,
N::r:<l
100
I200
50·
o 50 100
Fi.gure 4.18DCBP(TCNQ)3Plot of the square of the linewidth againstthe square of the microwave magnetic fieldstrength for crystal 3 at two temperatures.H is approximately parallel to the z-axis.o 150K, • 120K.

II)
'0I::oUQ)til
<,ofC lxlO-7N
E-i..
•• o
••
00
0 0 00
lxlO-8 00
I4 6 8
-1 103 / -1T x K
Figure 4.19DCBP ('l'CNQ) 3
Semilog plot of Tl and T2* against reciprocaltemperature for crystal 3.H is approximately parallel to the z-axis •• Tl ' 0 T2*

-128-
occurs. does in fact depend on the frequency. The most
plausible cause for this behaviour and for the
observation of such a minimum was considered to be due
to spin-spin interactions.
Gorter and Van Vleck164,165 first suggested
that for substances which are characterised by large spin-
spin exchange interactions, the dipolar interaction is
randomly modulated by exchange interactions in much the
same way it is modulated by random motions in liquids.
In other words, the exchange interaction in TCNQ
complex salts due to exciton-exciton collisions changes the
spin states of the colliding triplets and these collisions
amount to an averaging of the dipolar interaction.
In order to discuss Tl for a strongly
exchange-coupled system, it is convenient to consider
that, in an external magnetic field, the spin system and
the lattice may be regarded as three heat reservoirs.
These are the Zeeman, exchange and lattice systems,
and this model was first proposed by Bloembergen and166Wang • Energy absorbed by the Zeeman system from the
electromagnetic radiation is eventually transferred to
the lattice by a relaxation process involving coupling
interactions. Spin-lattice relaxation, in the l8:aseof
the three-reservoir m9ded, is dominated by the' spin-
spin interactions characteristic of energy transfer from
-129-
the Zeeman system to the exchange system, since direct
Zeeman-lattice relaxation is slow and the exchange-lattice
1 t· . f t167re axa aon as as • When circumstances are such that
the exchange energy is comparable to, or greater than, the
Zeeman energy, the dipolar interaction causes the transfer
of energy from the Zeeman system to the exchange system
where it is then transferred to the lattice. This can be
expressed in terms of the Larmor and exchange frequencies,
denoted by Vz and ve respectively. When ve ~ vz' themeasured Tl corresponds to the relaxation time associated
with energy transfer from the Zeeman system to the exchange
system168• This is the minimum value of Tl observed and
corresponds to the most efficient relaxation. However, as
the temperature is decreased, ve decreases and the Zeeman-
exchange and exchange-lattice couplings become weaker and
less important in the relaxation process. This results in
direct but less efficient Zeeman-lattice processes and Tl
increases in the region v < v (the region of 'slow'e zexchange). The resulting minimum in Tl is a result of
induced downward transitions in the spin system when
v ~ v. As v is increased, by increasing the temperature,e z e
to a value above that of the Larmor frequency, it is less
~ffective in inducing downward transitions, therefore Tl
again increases in the region v > v (the region of 'fast'e z
exchange) •
The exchange frequency is inversely related to

-130-
the correlation time, t , which can be expressed as the. c
time a particular orientation of the dipole persists in
the magnetic field. If it is assumed that the Tl dependence
upon correlation time is of the same general form as in the
case of thermal motion in liquids, equation 4.1 can be
applied to the results obtained for DCBP (TCNQ)3.
,4.....:1'1.:...,2,.....s(S+l)[ Le j= kl rr6 (1 + v 2 L 2)z c
•••• (4.1)
The only symbols not previously defined are~, rand kl•
~ is Planck's constant divided by 2n, r is the minimum
distance of closest approach of the colliding species, and
kl is a collection of constants with a value near unity.
It has been found159 that, as the number of neutral TCNQ
molecules is increased in the crystalline lattice relative
to the number of TCNQ anions, r also increases. For
example, r increases from approximately 0.8nm for (TCNQ);-2-to approximately 1.0nm for (TCNQ)4. Therefore, for the
case of DCBP(TCEQ)3' a value of 0.8nm for r was used in
the calculations of L •C
Equation 4.2 gives the temperature dependence of
the correlation times and, from a plot of log LC against
liT, the activation energy, ~E , can be obtained from theeslope.
L = L 0 exp(~E IkT)c c e•••• (4.2)
Figure 4.20 shows such a plot obtained from the relaxation

lxlO-9
U)
'8ooQ)U)
lxlO-lO
4 6
Figure 4.20DCBP(TCNQ)3Semilog plot of T against reciprocal temperaturecfor crystal 3.H is approximately parallel to the z-axis.

-131-
results for DCBP(TCNQ)3' and the value of AEe from the slope
is a.6±2.9 kJ mol-I. This value is taken from the slope
through the points considered to be the most reliable.
The results obtained in the temperature region ISO-laOK were
not so good owing to the lack of enough microwave power to
broaden the already broad resonance lines sufficiently for
accurate measurements to be made. However, it is
considered that the value of &Ee obtained from the
relaxation data is in reasonable agreement with the value
obtained from the exchange analysis data using the line-
width approximations. The inverse of the pre-exponentialfactor, (T 0)-1, is 3.1±1.1 THz and is also closer to thecvalue of the pre-exponential factor vo from the linewidth
approximations than to the value obtained from the line
separation approximation, these values being O.7±O.3 and
O.OOl±O.OOl THz respectively.
In conclusion, the results presented in this
section for DCBP(TCNQ)3 indicate the presence of localised
Frenkel excitons, consistent with the low d.c. conductivity
exhibited by this compound and the crystal structure
determination. No definite conclusions, however, can be
proposed for the origin of the species giving rise to the
central resonance, although it is felt that a possible
explanation would be the existence of lattice imperfections
giving rise to larger localised triplet excitons.

-132-
4.2 DMPA(TCNQ)4l!l
The complex salt DMPA(TCNQ)4 contains two
neutral TCNQ molecules and two TCNQ anion radicals for
electrical neutrality with the divalent cation 1,2-di (N-
methyl-4-pyridinium)ethane (DMPA). Both single crystals
and polycrystalline samples have been prepared in this
department and, although found to have the same
stoichiometry, they exhibited very different d.c. electrical
conductivi ties126 • The crystals are semiconducting, having-3 -1 -1a d.c. conductivity of 2 x 10 ohm cm along the
direction of the TCNQ stack, whereas the polycrystalline
form has a much higher conductivity of the order of unity
at room temperature. Normally, polycrystalline samples
of the same compound have lower conductivities due to the
activation energy required to surmount intercrystalline
boundaries. Therefore, there appears to be two phases of
DMPA(TCNQ)4 in existence. This situation is not unique
in TCNQ complex salts as 1,2-di(N-ethyl-4-pyridinium)-
ethylene (DEPE)-(TCNQ)4 has also been found to exist in
two phases, one being semiconducting and the other
metallic169•
The crystal structure determination and
conductivity results for the crystal form of DMPA(TCNQ)4'
designated as phase I, have been publishedl70, and Figure
4.21 shows the projection of the structure along the
crystallographic c-axis. The TCNQ molecules are stacked

r---------~-------------------------------'----------------~
Figure 4.21
DMPA(TCNQ)4(I)
Projection of the crystal structure along the c-axis.

-133-
plane-to-plane in groups of four wi.th no direct overlap
between adjacent tetrads, which are held together by
Van der Waals forces. The distance of closest contact
between stacks, in the a-direction, is O.330nm, which is
of a similar magnitude to the distance between the TCNQ
molecules along the stack. Within the tetrads, two types
of overlap are observed. There is a good 'ideal' overlap
between the TCNQ molecules labelled A and B in Figure 4.21,
with a perpendicular separation of O.320nm. However,
there is a much poorer overlap between A and A', with a
perpendicular separation of O.339nm. Therefore, the
crystal structure determination indicates that there is
a tendency towards two dimers rather than a tetrad, and
the data also suggests the charge is delocalised within
each dimer, the TCNQ molecules being indistinguishable
with a net charge of ~- on each.
The crystals of DMPA (TCNQ)4 (I) form in a
rectangular platelet shape.; and it has been shown that the
stacking direction (the crystallographic b-axis) is
approximately parallel to the perpendicular to the plate
(z-direction). The long dimension of the crystal (x-
direction) is approximately parallel to the short
dimension of each TCNQ molecule, and corresponds to the
crystallographic a-axis. Consequently, the intermediate
crystal dimension (y-direction) corresponds to the
crystallographic c-axis, perpendicular to the cation planes.

-134-
For the crystals studied in this work, the X-,' y- and z-
axes were those oriented as the rotation axes for crystals
1, 2 and 3 respectively.
At room temperature, a single, symmetrical signal
was observed which did not show any evidence of dipolar
splitting as the temperature was decreased. Therefore,
the angular variation of the g factor was monitored at room
temperature, the experimental results being given in
Figures 4.22 to 4.24, together with the computer simulations.
From these results, the three principal values of the g
factor in the x-, y- and z-directions were found to be
2.0039, 2.0032 and 2.6;27 respectively, all with an
experimental error of ±0.0003. The value associated with
the TCNQ stacking direction is once again closest to the
free electron value. However, the values of gx and gy do
not agree with the crystal structure and conductivity
results. It has been shown that the y-direction has the
lowest conductivity, this being expected along the direction
through the cation planes and, therefore, would be expected
to have the greatest value of the g factor. This
discrepancy could possibly have occurred by misorientation
of the crystals as, a.Lthough rectangular platelets, the
crystals of the correct size for the e.s.r. experiments
were more square-like and, consequently, identification of
the x- and y-axes became ambiguous.

2.0026 2.0029 2.0032g factor
Figure 4.22DMPA(TCNQ)4(I) ~Angular variation of g factor at 300K forcrystal 1.Approximate orientations: H//y-axis at +18°.
°H//z-axis at -72 •Computer simulation.

-90
+90
o
2.0030 2.0034 2.0038g factor
Figure 4.23DMPA(TCNQ)4(I)
Angular variation of g factor at 300K forcrystal 2.Approxi~ate orientations: H//x-axis at +160
H//z-axis at -740
Computer simulation.

+90
o
-90
2.0032 2.0036 2.0040g factor
Figure 4.24
DMPA(TCNQ)4(I)
Angular variation of g factor 'at 300K forcrystal 3.Approximate orientations: Hlly-axis at +380
I _520H lx-axis atComputer simulation.

-135-
The angular dependence of the linewidth was also
investigated during this study at room temperature and the
results are presented in Figures 4.25 to 4.27. The
behaviour exhibited in Figures 4.25 and 4.27 are unusual,
as the normal behaviour for compounds of this type, having
all TCNQ chains equivalent, should match the g factor1 .. 154angu ar var~at~on • The angular variations of the g
factor and the linewidth, shown in Figures 4.23 and 4.26,
do in fact match and these results were obtained with y as
the rotation axis. The pattern shown for crystals 1 and 3
has been observed in TCNQ complex salts by otherworkers17l,172 and has been attributed to specific
properties associated with the collapse of fine structure
in a nearly two-dimensional conductor. It is interesting
to note that the criterion necessary to fulfil in order to
observe this unusual pattern is that a highly conducting
direction and a poorly conducting direction must be under
investigation. This is in fact fulfilled for crystal 1,
where the z- and y-axes are under study, and also for
crystal 3, where the intermediate-conductivity x-axis and
the poorly conducting y-axis are under study. Also,a
weak angular dependence of the linewidth is observed for
crystal 2, in which the two most highly conducting axes
are investigated, this being consistent with the observa-
tions made in the previous studies of this behaviour17l,172.
These results are consi stent with the crystal 'structure
data, which indicates the stack-to-stack distance is

+90 - 0
0
.0
-00
0
- 0
0
0
0- 00<, 0Q)rltn 0s:::~
- 0
0
0
- 0
0
0
-90 - oI
0.6I
0.8I
1.0hH/MHz
Figure 4.25DMPA(TCNQ)4(I)
Angular variation of linewidth at 300K forcrystal 1.Approximate orientations as for Figure 4.22
I
1.2

+90 0
0
0
0
0
0
0
0
0 0<,
ID 0 0rl0"1~.:x: 0
0
0
0
0
0
0
0
-90 0
0.6 0.7I1H/MHz
Figure 4.26DMPA(TCNQ)4(I)
Angular variation of lineVlidth at'300K forcrystal 2.Approximate orientations as for Figure 4.23!

+90 - 0
0
0
- 0
0
0
- 0
0
0 0<,
Q) o - 0...-1tYI~ 0~
0
- 0
0
0
- 0
0
0
-90 - 0I I I
0.6 0.8 1.0 1.2AH/HHz
Figure 4.27DMPA ('I'CNQ)4 (I)
Angular variation of linewidth at 300K forcrystal 3.Approxiwate orientations as for Figure 4.24.

-136-
similar to the distance between dlmers along. the stack
and, therefore, suggests some degree of two-dimensionality.
However, the d.c. conductivity results do not reflect
such behaviour, although the two most highly conducting
directions are in the plane of TCNQ molecules, and the
poorly conducting axis is along the direction through the
cation planes.
An orientation resulting in a maximum or
minimum value of the g factor was selected for each of
the three crystals, and the variation of the signal
intensity was studied as a function of temperature at this
orientation. In all cases, the intensity showed a
monotonic increase as the temperature was lowered from
300 to lOOK. Below this temperature, however, the
intensity increased more rapidly, an a Curie law fashion,
peaking at 50K and rapidly decreasing in intensity from 50
to 10K, this behaviour being shown in Figure 4.28.
Figure 4.29 shows the log IT against liT plot
obtained from the intensity results and it can be seen
that a linear dependence is exhibited in the region
where the rapid decrease in intensity is observed. This
corresponds to the depopulation of the triplet state in
the region where J > kT, which is the criterion required
for calculation of the singlet-triplet energy "gap from the
relationship given in equation 2.25. The value of the slope

·Ul+I-r-!~;:l
:>tHn::lH+I 3--r-!.QHn::l
<,
:>t+I-r-!Ul~ID+I~H
4 -
2 -
1 -
o
o oo
oo
o oo ooo o
oo
I
200I
300I
100oT / K
Figure 4.28m·1PA(TCNQ) 4 (I)
Plot of relative intensity against ternperature forcrystal 3.H is approximately parallel to the y-axis.
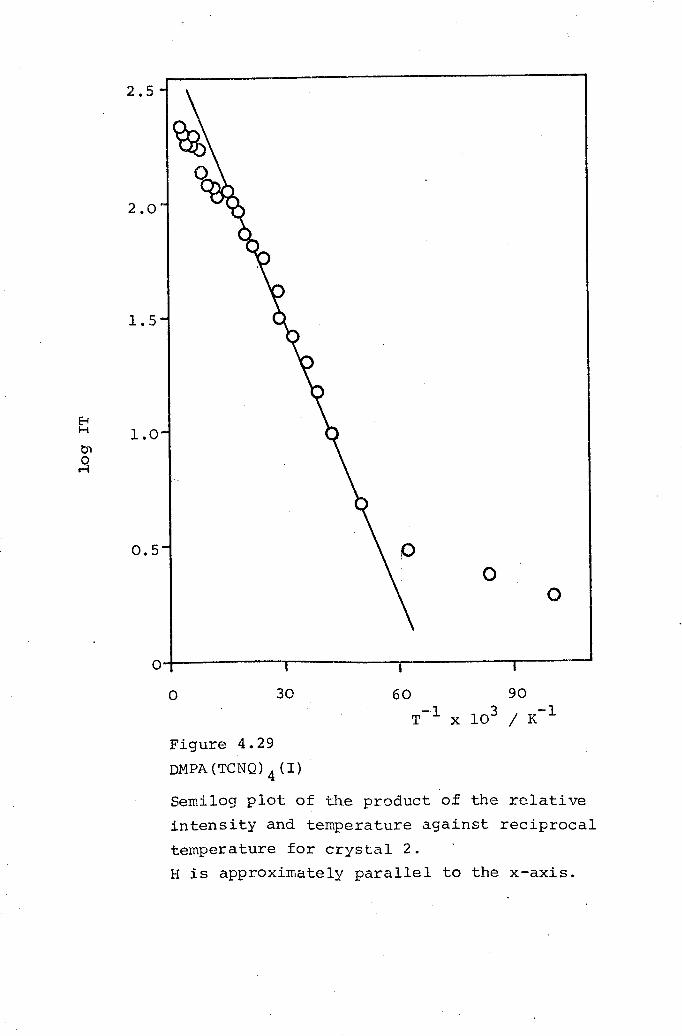
8H
2.5
o
2.0
1.5
1.0
0.5
o~----------r----------r----------~----'~o 30 60 90
T-l x 103 / K-l
o
Figure 4.29DMPA(TCNQ)4(I}
Semilog plot of the product of the relativeintensity and temperature against reciprocaltemperature for crystal 2.H is approximately parallel to the x-axis.

-137-
for a number of such plots was found to be -0.65±0.12 kJ
mol-I. By substituting a value of J of 0.65 kJ mol-l into
equation 2.26 for localised triplet states, the predicted
value of the room temperature molar susceptibility was-3 3-1calculated and found to be 2.38 x 10 e.m.u.cm mol •
This is in excellent agreement with the experimentally-3 3-1determined value of (2.2±0.4) x 10 e.m.u.cm mol and,
therefore, infers the triplet excitons are essentially
localised in DMPA(TCNQ)4 (I).
Calculations using this value of J in equation-3 32.28, however, yield a value of 7.83 x 10 e.m.u. cm
-1mol ,which is substantially larger than the observed
value and the value predicted by Kepler's equation. The
lack of agreement between the values calculated from
equations 2.26 and 2.28 is due to the inequality, given in
equation 2.29, being no longer applicable due to the very
low value of J, which reflects the large distance
separation between the two electrons constituting the
triplet state. Etemad's treatment, discussed in section
2.5.1, cannot therefore be used as the situation in this
case is outside the range of validity.
Soos and McConnelll08 proposed that, as the
temperature is increased, triplet excitons become
'statistically delocalised' even in strongly alternating
systems. Thermal energy has the effect of increasing

-138-
the separation between the spins forming a triplet
excitation for any value of y. This results in a deviation
from triplet behaviour and the excitations resemble pairs
of doublets. This is the cause of the deviation from
linearity at high temperatures shown in Figure 4.29, and
is observed in the region where the experimental term in
equation 2.25 becomes smaller than 3, this equation then
reducing to that of Curie law behaviour. The observed
maximum in intensity resulting from this phenomenon was24predicted by Kepler , who proposed the relationship given
in 4.3, in which TM is the temperature the intensity curve
exhibits a maximum.
J = 1.61 kTM .••• (4.3)
The value of J calculated from this, using a value of 50K
for TM, is in excellent agreement with the value obtained
from the slopes of the log IT against liT plots.
It would appear, therefore, that the triplet
excitons in DMPA(TCNQ)4(I) are best described as localised
Frenkel spin excitons, but at high temperatures this
triplet character is removed by thermal energy and results
in magnetic behaviour attributable to non-correlated Curie-
type spins.
The curvature at low temperatures shown in
Figure 4.29 is, as previously discussed, due to Curie
species resulting from isolated monoradical anions

-139-
originating from chain-ends and defects in the crystal
lattice. Although the intensity with temperature plots
only show evidence of a Curie signal below 10K, the
effect of the paramagnetism of this signal can be seen in
the log IT against liT plots at much higher temperatures.
From the results for all the three crystals studied, an
estimate of the number of such species existing per mole
of host of (S.8±1.S) x 1021 spins mol-l was obtained.
This value corresponds to a percentage of only 1% and,
therefore, is reasonable for such a proposed species.
All the crystals of this complex salt exhibited
a very unusual linewidth variation with temperature, this
behaviour being illustrated in Figure 4.30. It is
interesting to note the close similarity between this plot
and that shown in Figure 4.28. It is also interesting that
no evidence of dipolar splitting was observed as would be
expected from a localised triplet species at temperatures
below the region of linewidth broadening. However,
although the triplet excitons are considered as localised
and, therefore, will have a finite value for the dipolar
interaction, this value will only be very small, as
indicated by the large distance separation from the
crystal structure determination and the very small J value.
Consequently, although dipolar interaction will exist, the
very small, but finite, value of the splitting will be
undetectable.
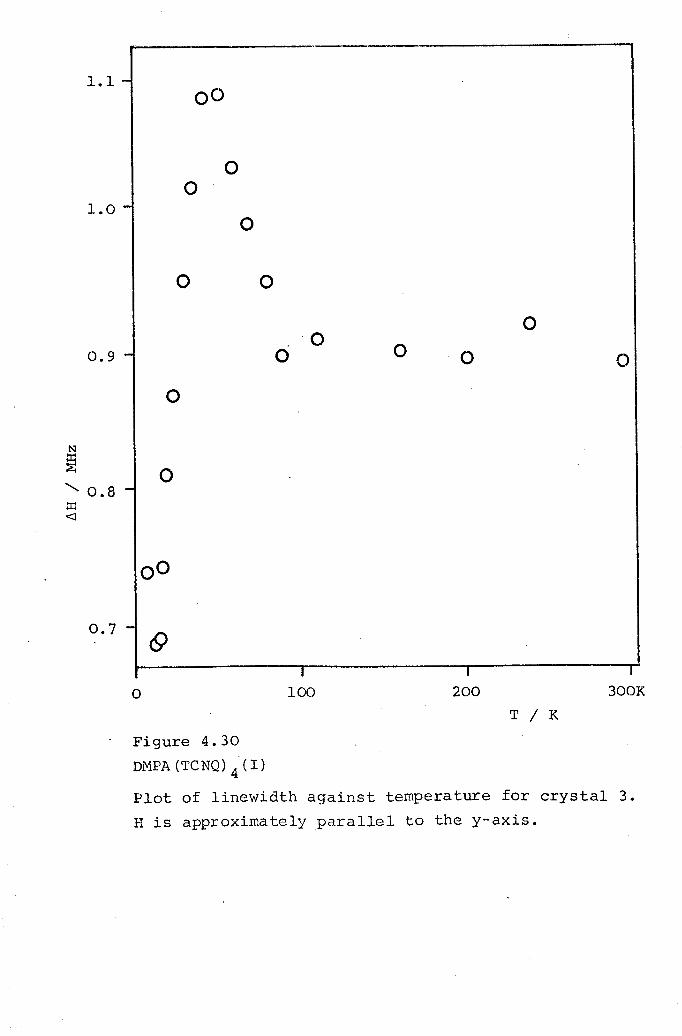
1.1 -
1.0 -
0.9 -
'" 0.8 -:r:<l
0.7 -. C)
00
oo
o
o 0
oo o oo o
o
o
I
200I
300KI
100oT / K
Figure 4.30Dt>1PA(TCNQ) 4 (I)
Plot of linewidth against temperature for crystal 3.H is approximately parallel to the y-axis.
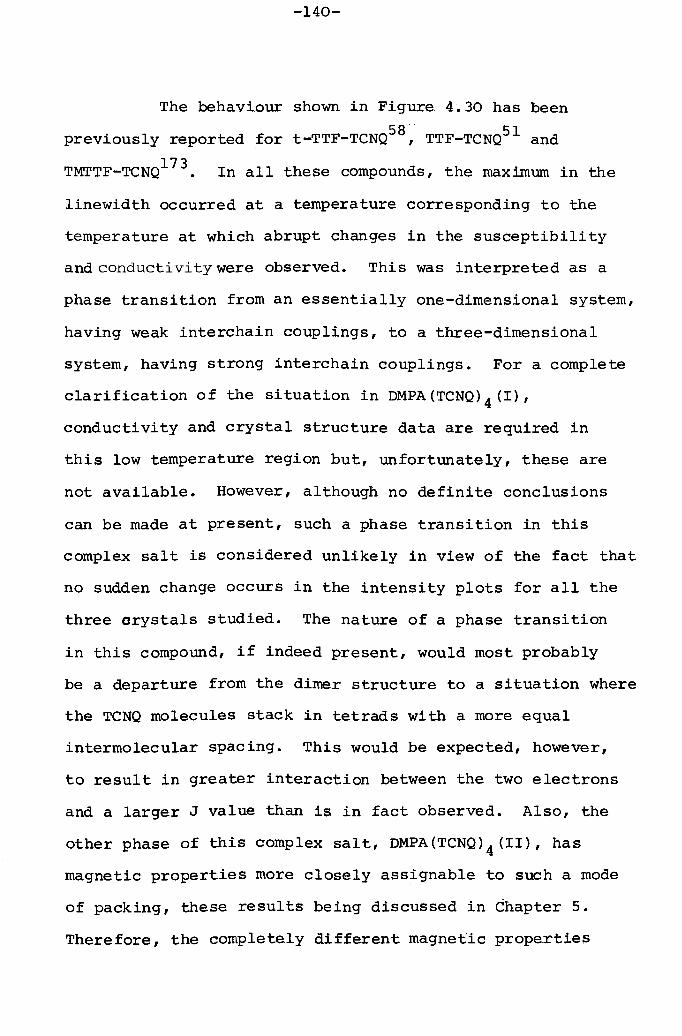
-140-
The behavi.our shown in Figure 4.30 has been. 58 51prev~ously reported for t-TTF-TCNQ ,TTF-TCNQ and
TMTTF-TCNQ173. In all these compounds, the maximum in the
linewidth occurred at a temperature corresponding to the
temperature at which abrupt changes in the susceptibility
and conductivi ty were observed. This was interpreted as a
phase transition from an essentially one-dimensional system,
having weak interchain couplings, to a three-dimensional
system, having strong interchain couplings. For a complete
clarification of the situation in DMPA(TCNQ}4(I},
conductivity and crystal structure data are required in
this low temperature region but, unfortunately, these are
not available. However, although no definite conclusions
can be made at present, such a phase transition in this
complex salt is considered unlikely in view of the fact that
no sudden change occurs in the intensity plots for all the
three srystals studied. The nature of a phase transition
in this compound, if indeed present, would most probably
be a departure from the dimer structure to a situation where
the TCNQ molecules stack in tetrads with a more equal
intermolecular spacing. This would be expected, however,
to result in greater interaction between the two electrons
and a larger J value than is in fact observed. Also, the
other phase of this complex salt, DMPA(TCNQ}4(II}, has
magnetic properties more closely assignable to such a mode
of packing, these results being discussed in Chapter 5.
Therefore, the completely different magnetic prope.rties

-141-
exhibited by these two phases would appear inconsistent
with such a phase transition.
In order to possibly cast some light on the
cause of the unusual linewidth behaviour, relaxation
studies were undertaken on a crystal of DMPA(TCNQ)4(I).
Since the lineshapes of the signals were found to be
Lorentzian in the entire temperature region above and
below the observed maximum in linewidth (figures 4.31 and
4.32), the method described in section 3.2.3(vi) could be
used. Figure 4.33 shows typical results obtained for
this compound at two of the temperatures studied. The*values of Tl and T2 were obtained from the slope and ~
intercept respectively of such plots, and the resulting
temperature variation of these parameters is presented in
Figure 4.34.
It can be seen that the spin lattice-relaxation
time,Tl, exhibits a minimum at 50-60K, the exact
temperature region at which a maximum in linewidth is
observed. Therefore, some phenomenon causing changes in
the spin-lattice relaxation time must account for the
unusual linewidth behaviour. As discussed in section 4.1,
the 'v'-shaped pattern is char.acteristic of strong exchange
interactions in Frenkel exciton systems. Such an
explanation in the case of DMPA(TCNQ)4(I) is indeed feasible,
as the very small J valueFresults in a high exciton density

+J-§,•.-1OJ 40..q
~coOJ0..
I.H0
0.0 20
1 2 3 4 5
Distance / Half-widthsFigure 4.31DMPA(TCNQ)4(I)
Lineshape analysis for crystal 1 at SDK.H is approximately parallel to the z-axis.• • Gaussian lineshape.0---0 Lorentzian lineshape.
~ Average shape for crystal.

60.+J
~'.-1Q).G~CtlQ) 40O!4-l0(Jp
2 3 4 5
Distance / Half-widthsFigure. 4.32DMPA(TCNQ)4(I)Lineshape analysis for cryst~l I at 20K.H is approximately parallel to the z-axis.• • Gaussian lineshape.0---0 Lorentzian lineshape.
6 Average shape for crystal.

N
N::r:~
<, 1.6N
::r:<J
3.2
2.4
0.8
oo 40 80
H 2 x 10² / (MHz)21Figure 4.33
DMPA(TCNQ)4(I)
Plot of the square of the linewidth againstthe square of the microwave magnetic fieldstrength for crystal 3 at two temp~ratures.H is approximately parallel to the y-axis.o 300K r • 60K.

•4xlO-7 - •
•3xl~ -7_ ., •
• 0
. 0 0til-oI::00 2xlO-7-ID 0til
<, 00 .-Ie 0N 000E-t..r-I
E-I
lxlO -7-1-. "-.----rl---- •..-----r--I----rl---.I
20 40o
Figure 4.34
DMPA ('l'CNQ) 4 (I)
Semilog plot of Tl and T2* against reciprocaltemperature for crystal 3.H is approximately parallel to the y--axis.• "i ' 0 T2*·

-142-
at low temperatures. Exciton-exciton collisions will,
therefore,be substantial at low temperatures and any effect
on the spin-lattice relaxation time, similar to the
mechanism proposed for DCBP(TCNQ)3' will have a maximum at
the temperature of effective maximum triplet exciton
concentration. This is in fact observed, as the position of
the maximum in linewidth not only coincides with the minimum
in the Tl plot, but also with the maximum in the intensityvariation. The Lorentzian lineshape in the entire temperature
region studied supports the proposal of exchange interaction
existing even at low temperatures. Such a high exciton density
and exchange frequency might also contribute to the cause ofthe lack of observable dipolar splitting, the exchange
interaction possibly modulating the dipolar levels.
Finally, although it has been established that
the spin excitations are not the same as the charge. . 174,175 t .excltatlons , suppor for the proposed locallsed
exciton model is given by the d.c. conductivity of
DMPA(TCNQ)4(I). The conduction states are higher inenergy than the exciton states and so are expected to be
more extended in character. Therefore, the low d.c.
conductivity observed in these crystals is consistent with
a localised model for the interpretation of the magnetic
properties.

-143-
4.3 DPB(TCNQ)-___;.---= .....4This complex salt readily crystallises from
solution with four TCNQ molecules, two formally neutral
and two anionic, to each divalent cation 1,4-di(N-
pyridinium)butane (DPB). Two types of crystal were
obtained, differing in shape and size, and are shown in
Figure 4.35. From the crystal structure determination, it
appeared that the smaller crystals were crystallographically
the same as the larger hexagonal shaped crystals which,
if cleaved along one of the diagonals, produced the former
type. The diagram illustrates the crystallographic axes a,
band c, these corresponding to the stack-to stack, along
the stack and perpendicular to the cation plane directions.
The crystals of the type shown in Figure 4.35(a) were those
used in the e.s.r. studies, and the axes x, y and z of the
laboratory co-ordinate system are therefore, also given in
the diagram.
The crystal structure analysis showed the TCNQ
molecules to be stacked along the b-axis with groupings
of four TCNQ's within the stack. As was the case for
DMPA(TCNQ)4(I), the perpendicular separation of O.32lnm
between molecules labelled A and A' (Figure 4.36) in
DPB(TCNQ)4 is larger than the perpendicular separation of
O.3l9nm between A and B. Furthermore, there is good
'ideal' overlap between A and B, whereas only'poor overlap
between A and A'. Therefore, once again the situation is

c(x}
a (y)
IJ- _
b(z}
(a)
a
////
b ./,,,,,
c
(b)
Figure 4.35
DPB(TCNQ)4
The two types of crystal shapes obtained for thiscomplex salt. The c1ystallographic axes a, band care indicated in both diagrams (For (b) the b-axis is1to the plane of this figure). The labelling of theexternal axes is also shown in (a).

r
~ -- -~
J
~-'"""" '"'4 '"e-~
~~~ -~'
A ,,_~(~-," s:s.'T~~ J ~~~
Figure 4.36DPB(TCNQ)4
. n ofProjectlo the c-axis.along1 structurethe crysta

-144-
more closely described by a pair of dimers rather than a
tetrad. However, the similarity between the crystal
structures of DMPA(TCNQ)4 (I) and DPB(TCNQ)4 ends at this
point. In the latter complex salt, the stack-to-stack
distance is greater than the distance between the stacks
and the cation molecules. This gives rise to some degree
of two-dimensionality in the physical properties of this
compound, not of the usual type within the TCNQ sheet,
but in the bc plane. The d.c. conductivity results176 are
consistent with the crystal structure, which predicts the
conductivity 0 should change in such an order 0b~o >0 •c a
The angular variation of the g factor was
investigated at room temperature for crystals 1, 2 and 3,
which were oriented with the x-, y- and z-axes respectively
as the rotation axis. The results for this study are
presented in Figures 4.37 to 4.39, and the average values
obtained for gx' gy and gz were 2.0039, 2.0035 and 2.0030
respectively, all with an error of ±0.0003. It is
generally considered that the g values for these compounds
reflect the degree to which the unpaired electrons are
'free' and, therefore, the magnitudes would be expected to
follow the same order as exhibited by the conductivities
along the same axes. However, although this prediction
generally holds in these compounds, the g values do not
appear to reflect the electron delocalisation'indicated by
the conductivity Eesults. Therefore, the g factors do not

+90
o
-90
2.0030 2.0034g factor
Figure 4.37
DPB(TCNQ)4Angular variation of g factor at 300K forcrystal 1.Approximate orientations: H//y-axis at +15°.
°H//z-axis at -75 •Computer simulation.
o

+90
-90
2.0032 2.0036 2.0040g factor
Figure 4.38
DPB(TCNQ)4
Angular variation of g factor at 300K forcrystal 2.Approximate orientations: H//x-axis at +16°.
°H//z-axis at -74 •--- Computer simulation.
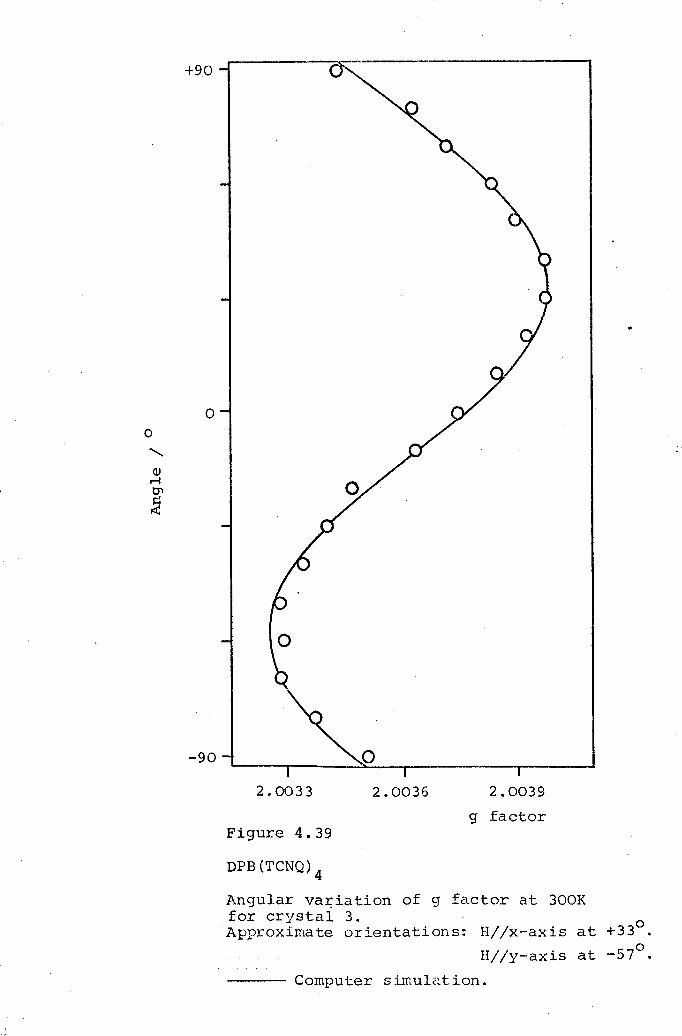
+90
o
-902.0033 2.0036 2.0039
g factorFigure 4.39
DPB(TCNQ)4
Angular variation of g factor at 300Kfor crystai 3.Approximate orientations: H//x-axis at +33°.
H// -57°.y-axis at------ Computer sliuulation.
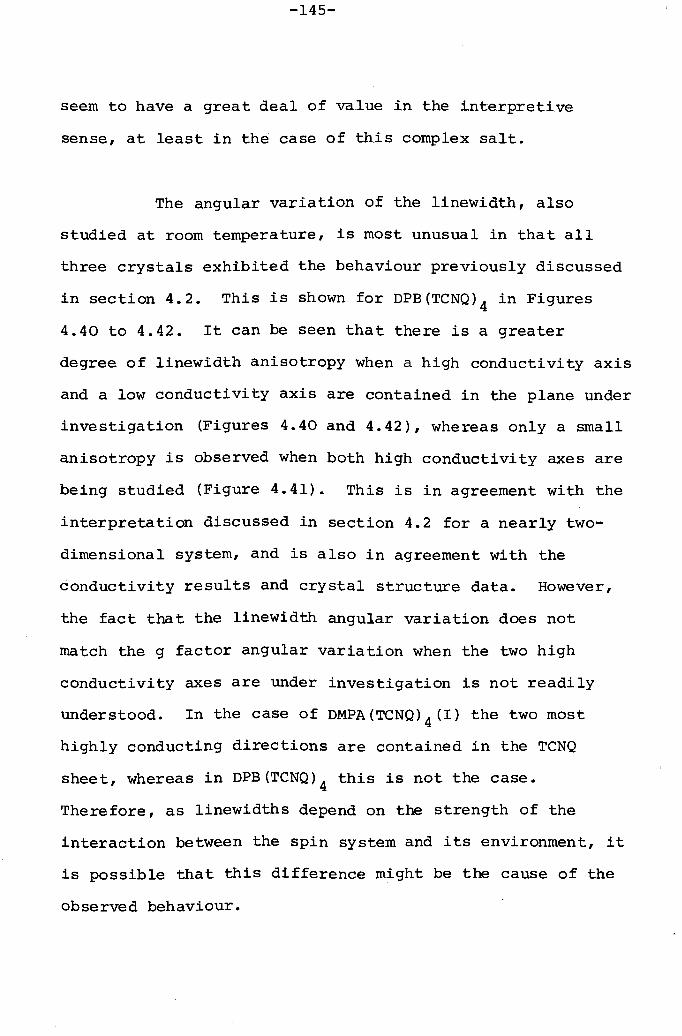
-145-
seem to have a great deal of value in the interpretive
sense, at least in the case of this complex salt.
The angular variation of the linewidth, also
studied at room temperature, is most unusual in that all
three crystals exhibited the behaviour previously discussed
in section 4.2. This is shown for DPB(TCNQ)4 in Figures
4.40 to 4.42. It can be seen that there is a greater
degree of linewidth anisotropy when a high conductivity axis
and a low conductivity axis are contained in the plane under
investigation (Figures 4.40 and 4.42), whereas only a small
anisotropy is observed when both high conductivity axes are
being studied (Figure 4.41). This is in agreement with the
interpretation discussed in section 4.2 for a nearly two-
dimensional system, and is also in agreement with the
conductivity results and crystal structure data. However,
the fact that the linewidth angular variation does not
match the g factor angular variation when the two high
conductivity axes are under investigation is not readily
understood. In the case of DMPA(TCNQ)4(I) the two most
highly conducting directions are contained in the TCNQ
sheet, whereas in DPB(TCNQ)4 this is not the case.
Therefore, as linewidths depend on the strength of the
interaction between the spin system and its environment, it
is possible that this difference might be the cause of the
observed behaviour.

+9.0 - oo
o- o
oo
- o
0 0<,
Q) - 0,.....j 0til~r::t: 0
0
- 0
0
0
- 0
0
0
-90 - 0I I I
0.4 0.6 0.8 1.0
o
DPB(TCNQ)4
Angular variation of Li.newi.d+hat 300K for crystal 1-
Approximate orientations as for Figure 4.37.
nH I MHzFigure 4.40

+90 - 0
0
0
- 0
0
0
- 0
0
00<, o - 0Q)rl 0b"\~~ 0
- 0
0
0
- 0
0
0
-90 - 0r , I
0.5 0.6 0.7~H / MHz
Figure 4.41DPB(TCNQ)4Angular variation of linewidth at, 300K forcrystal 2.Approximate orientations as for Figure 4.38.

-+90 - 0
0
0
- 0
0
0
- 0
00 0<,
Q)0r-I o -tJ'I
~f:!! 0
0
- 0
0
0
- 0
0
0
-90 - 0T I I
0.6 0.8 1.0bH/MHz
Figure 4.42DPB(TCNQ)4
Angular variation of linewidth at 300Kfor crystal 3.Approximate orientations as for Figure 4.39.

-146-
The temperature dependence of the e.s.r. signal
intensity was investigated for all the three crystals, and
a typical plot is shown in Figure 4.43. There is a
marked similarity between this behaviour and that exhibited
by DMPA(TCNQ)4(I), as is expected from the similarity
between the crystal structure data. The intensity plots
all show a maximum at approximately 40K and, from the
relationship given in equation 4.3, the predicted J value
is 0.52 kJ mol-I. This value is very small indeed and
reflects the large distance separation, and corresponding
small interaction, between the two electrons of the triplet
exciton, in agreement with the dimer interpretation of the
crystal structure. This small value results in a Curie-
like behaviour observed in the temperature region above
40K, as discussed for DMPA(TCNQ)4(I).
A typical example of the log IT against lIT plots
for DPB(TCNQ)4 is shown in Figure 4.44 and, again
considering only the linear portion where depopulation of
the triplet state is occurring in the region J > kT, the-1average slope obtained has a value of -0.52±0.05 kJ mol ,
in excellent agreement with that predicted from equation
4.3. Substituting this value for J in equation 2.26 yields
a room temperature molar susceptibility value of 2.42 x 10+3
e.m.u. cm3 mol-I, which is in good agreement with the-3 3experimentally observed value of (2.9±0.5) x 10 e.m.u. cm
mol-I. This indicates that the triplet excitons are
localised in this complex salt, which is not surprising in

- 00
Ul 0.jJ6 -.r-! 0I=:
::1 0~ 0HcOH 0.jJ -.r-! 0.QHcO 0<,
~ 4 - 0.jJ.r-!.tilI=: 0Cl).jJI=: - 0H
,..;cOI=: 0 0tTl.r-!Cl)
2 - 0 0
00
0- 00
O~-----------------r-I------------~I-------------~200o 100 300
T/KFigure 4.43
DPB(TCNQ)4Plot of relative intensity against temperaturefor crystal 3.H is approximately parallel to the y-axis.

E-iH
b'lo -1r-I
o
o
o
-2 ~---------------.---------,o 40 80 120
Figure 4.44
DPB (TCNQ)4Semilog plot of the product of the relative intensityand temperature against reciprocal temperature forcrystal 1-H is approximately parallel to the z-axis.
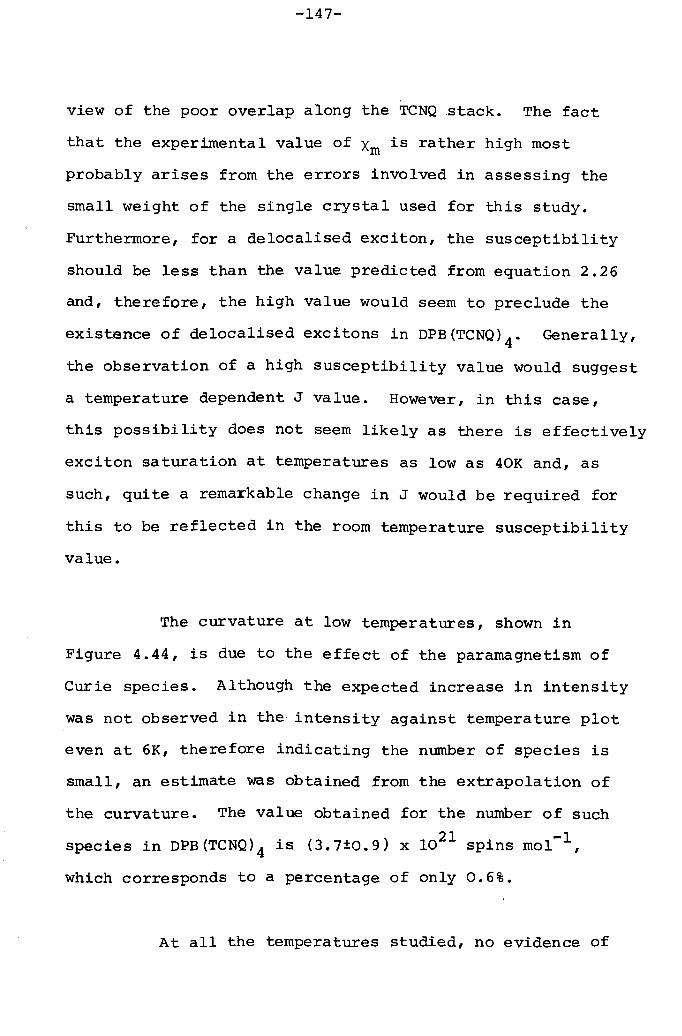
-147-
view of the poor overlap along the TCNQ stack. The fact
that the experimental value of Xro is rather high most
probably arises from the errors involved in assessing the
small weight of the single crystal used for this study.
Furthermore, for a delocalised exciton, the susceptibility
should be less than the value predicted from equation 2.26
and, therefore, the high value would seem to preclude the
existence of delocalised excitons in DPB(TCNQ)4. Generally,
the observation of a high susceptibility value would suggest
a temperature dependent J value. However, in this case,
this possibility does not seem likely as there is effectively
exciton saturation at temperatures as low as 40K and, as
such, quite a remarkable change in J would be required for
this to be reflected in the room temperature susceptibility
value.
The curvature at low temperatures, shown in
Figure 4.44, is due to the effect of the paramagnetism of
Curie species. Although the expected increase in intensity
was not observed in the intensity against temperature plot
even at 6K, therefore indicating the number of species is
small, an estimate was obtained from the extrapolation of
the curvature. The value obtained for the number of such
species in DPB(TCNQ)4 is (3.7±0.9) x 1021 spins mol-I,
which corresponds to a percentage of only 0.6%.
At all the temperatures studied, no evidence of

-148-
dipolar splitting was observed. Although a localised model
is proposed for this complex salt, th.every low J value
indicates that the dipolar interaction will also be very
small and, consequently, undetectable as was the case ~or
the similar situation for DMPA(TCNQ)4 (I). The d.c.
conductivity data place this compound in the intermediate-
conductivity class and indicate that a hopping mechanism
between localised conduction states most closely describes
the electrical properties. Therefore, in view of this
evidence, localised magnetic exciton states would also be
expected. It must be pointed out that, although the
observation of dipolar splittings is a firm indication of
localised triplet species, the lack of such an observation
does not necessarily mean the species are delocalised.
The magnetic properties of DPB(TCNQ)4 and
DMPA(TCNQ)4(I) are very similar in most respects. However,
a striking difference was observed in the temperature
dependence of the linewidths. The results for DPB(TCNQ)4
are presented in Figure 4.45. It can be seen from this
plot that the linewidth remained essentially constant as
the temperature was lowered from 300 to 20K, but increased
below this temperature. The same behaviour was exhibited
for all the crystals studied, and the linewidth maximum
observed for DMPA(TCNQ)4(I) was not evident at any
orientation.
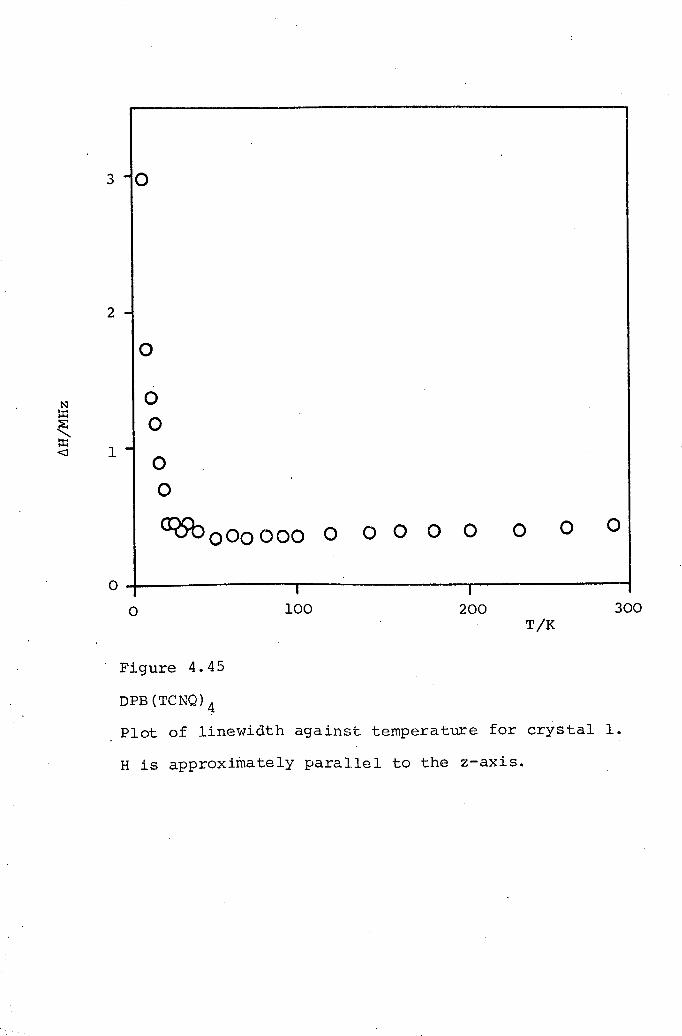
3 - 0
2 -
0
N 0::x::
0~::x::
1-<J00
CIOboooooo 0 o 0 0 0 0 0 0
o ~---------------'-I--------------~I~------------~100 200o 300
T/K
Figure 4.45
DPB ('l'CNQ) 4
Plot of linewidth against temperature for crystal 1.
H is approximately parallel to the z-axis.
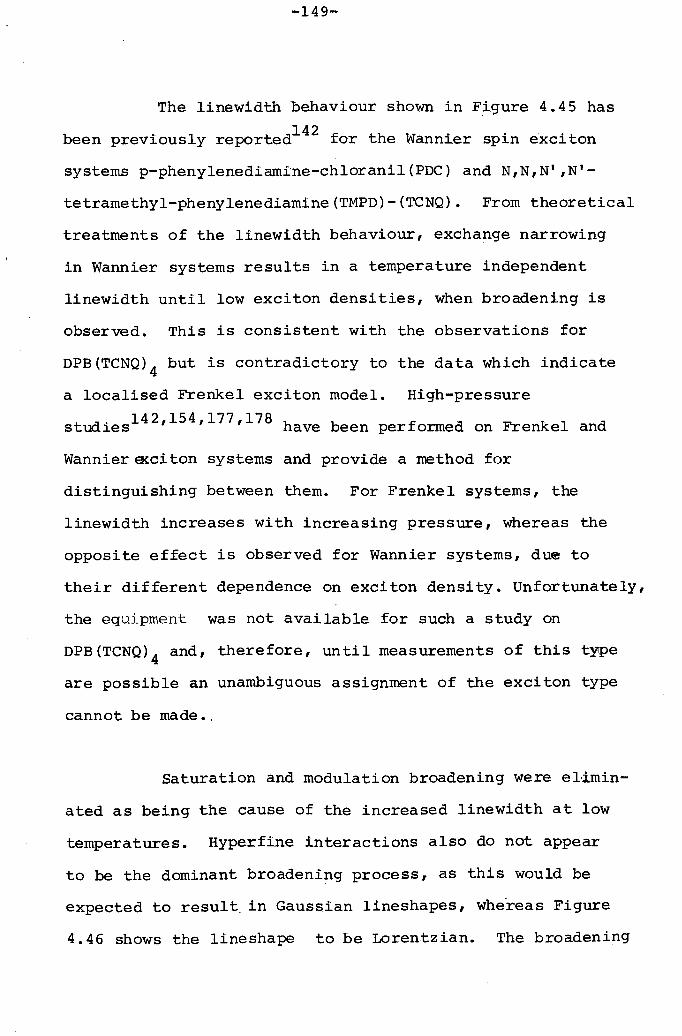
-149-
The linewidthbehaviour shown in Figure 4.45 has142been previously reported for the Wannier spin exciton
systems p-phenylenediamrne-chloranil(PDC) and N,N,N' ,N'-
tetramethyl-phenylenediamine(TMPD)-(TCNQ). From theoretical
treatments of the linewidth behaviour, exchange narrowing
in Wannier systems results in a temperature independent
linewidth until low exciton densities, when broadening is
observed. This is consistent with the observations for
DPB(TCNQ)4 but is contradictory to the data which indicate
a localised Frenkel exciton model. High-pressurestudies142,154,177,178 have been performed on Frenkel and
Wannier~citon systems and provide a method for
distinguishing between them. For Frenkel systems, the
linewidth increases with increasing pressure, whereas the
opposite effect is observed for Wannier systems, due to
their different dependence on exciton density. Unfortunately,
the equipment was not available for such a study on
DPB(TCNQ)4 and, therefore, until measurements of this tytpe
are possible an unambiguous assignment of the exciton type
cannot be made ,.
Saturation and modulation broadening were eLdrntrr-
ated as being the cause of the increased linewidth at low
temperatures. Hyperfine interactions also do not appear
to be the dominant broadening process, as this would be
expected to result. in Gaussian lineshapes, wherea s Figure
4.46 shows the lineshape to be Lorentzian. The broadening

60.jJ..c:01.r-!Ql..c:~ItS 40ID~IH0
dP
100
80
20
1 2 43
Distance / Half-widthsFigure 4.46
DPB(TCNQ)4Lineshape analysis for crystal 1 at 10K.H is approximately parallel to the z-axis.• • Gaussian lineshape.0--0 IJorentzian line shape •
~ Average shape for crystal.
5

-150-
could possibly arise from the onse-t of dipolar splitting
in the 'fast' exchange region and an analysis of the low
temperature linewidth data, using equation 2.46, yields
the points plotted in Figure 4.47. Since the value of do
is not available, (~H-~H )-1 is plotted in this figure.o
However, the slopes obtained from such plots gave
activation energies for exchange slightly smaller than
the singlet-triplet energy gap. Therefore, the broadening
seems unlikely to be due entirely to the onset of dipolar
splitting.
Relaxation studies were also undertaken and the
resulting temperature variation of Tl and T2* is shown in
Figure 4.48. In the temperature region where the
broadening occurs, the values of Tl do decrease slightly,
apart from the measurement taken at 10K. This trend would
be consistent with that expected for line broadening at
the onset of dipolar splitting. However, it is felt that
the relaxation results are not in any way conclusive.
Consequently, the linewidth broadening below 20K is
considered to be due to a number of effects, namely the
finite value of the dipolar interaction, hyper fine
interaction and the influence of the Curie signal, which
begins to have an effect in this temperature region and
would be expected to have a broader linewidth.
From the results obtained in this study, it

r-lI
0=r::: 0.6<J
I
=r:::<J........tTl0...-t
o.
1.8
1.2
-0.6
80 120 160
Figure 4.47
DPB(TCNQ)4Semi10g plot of (AH- 6H )-1 against reciprocal
otemperature for crystal 1.H is approximately parallel to the z-axis.6H is the 1inewidth in MHz.6H is the limiting high temperature linewidthoin MHz (=0.4MHz in this case).

lxlO-6 ---- 00 0- • ., •
Ul - 0 0re 0~ •0 - 000 0Q)
0Ul
<, - 0-Ie 0NE-t -..r-f
E-t
lxlO -7 ----
I
oI ,I
40
Figure 4.48
DPB(TCNQ)4Semilog plot of Tl and T2* againsttemperature for crystal 2.H is approximately parallel to the• "i ' 0 T2*
reciprocal
x-axis •

-151-
would be reasonable to say that it is not possible to make
any definite suggestions concerning the degree of
localisation of the low lying electronic states in this
complex salt. The crystal structure,conductivity and
susceptibility data, plus comparison with the very similar
DMPA(TCNQ)4(I), would seem to suggest localised excitons
are more likely in DPB(TCNQ)4. Investigations including
high-pressure studies for this and other analogous
complex salts in this series would be of interest to
determine the parameters influencing the linewidth
behaviour.
4.4 TPT(TCNQ) 4
The cation used in the preparation of this
complex salt is 2,4,6-tri-(N-methyl-2-pyridinium)triazine
(TPT) and is the only trivalent cation studied in this
work. Consequently, there are potentially three unpaired
electrons for each tetrad of TCNQ molecules in the complex
salt. There have been many complexes prepared having
mono- and divalent cations and so it was considered to be
of interest to study the effect of cations with higher
valencies on the physical properties of TCNQ complex salts.
The crystals were needle-shaped and the external
axes were labelled as shown in Figure 3.10(a), with x as
the long dimension, y the intermediate and z the short
dimension, although the y- and z-axes were almost

-152-
indistinguishable due to the pronounced needle shape. The
three crystals used in this study were mounted with the
x-, y- and z-axes as the rotation axes for crystals 1, 2
and 3 respectively.
This complex salt proved to be most unusual in
many respects. The three electrons per tetrad of TCNQ
molecules would be expected to be situated quite close
together and, therefore, interact more strongly than the
usual case of two electrons per tetrad. Preliminary e.s.r.
investigations, however, showed no evidence of any
splitting, a single symmetrical peak being observed in the
entire temperature range studied. Not only were the
predictions of the magnetic properties proved to'be wrong,
but the d.c. conductivity and crystal structure data were
also surprising. The crystal structure determination is
currently in progress in this department, but the
completion of this study has been severely hindered by the
apparent high degree of disorder existing within the
crystals. At the present time, only a tentative
assignment of the crystallographic axes has been made, the
external axes x-, y- and z probably corresponding to the
TCNQ stacking direction, the direction perpendicular to
the cation sheets, and the stack-to-stack direction
P I,· ,. d t' 't t 179respectively. re ~m~nary con uc ~v~ y measuremen s
showed a temperature dependent conductivity, the activation
energy being very small, with similar conductivity values

-153-
along the short and intermediate axes, but an almost
semi-metallic value along the long axis.
In order to loeate the principal magnetic axes,
the angular dependence of the g factor was investigated
at room temperature. The results for the three crystals
studied are presented in Figures 4.49 to 4.51, and the
average values of gx' gy and gz obtained from the maximaand minima of these plots are 2.0040, 2.0034 and 2.0035
respectively, all with an experimental error of ±0.0003.
The values of g and g are very similar, in agreement withy zthe similarity observed between the conductivities along
these directions. However, the high conductivity x-axis,
which is usually expected to have the g value closest to
the free electron value, has the largest g factor. This
is contradictory to the majority of studies on TCNQ
complex salts, which show the stacking direction to have
the smallest g value. The simple explanation of the g
factor anisotropy being governed by electron delocalisation
would not seem to hold for TPT(TCNQ)4 and is possibly due
to the disorder in some way. Therefore, the interpretive
value of the g factors in these compounds appears to once
again be suspect.
The angular variation of the linewidth at room
temperature for the three crystals is shown in Figures 4.52
to 4.54. The behaviour is very similar to that discussed
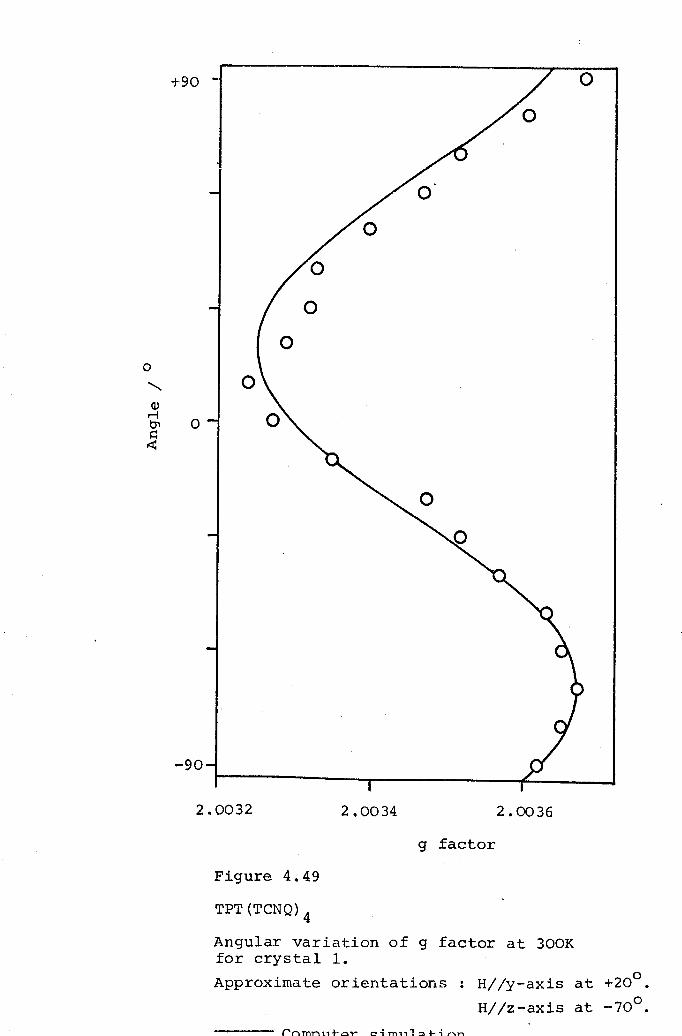
+90
-90
o
2.0032
o
2.0034 2.0036
g £actor
Figure 4.49
TPT (TCNQ) 4
Angular variation o£ g factor at 300Kfor crystal 1.
Approximate orientations Hlly-axis at +20°.Hllz-axis at -70°.

+90
o
-90
2.0033 2.0037g factor
2.0035 2.0039
Figure 4.50TPT(TCNQ)4Angular variation of g factor at 300Kfor crystal 2.Approximate orientations: H//x-axis at +54°.
H//Ziaxis at -36°.
------- Computer simulation.

+90
o
-90. 1 - I2.00382.0034
g factorF,igure 4.51
TPT(TCNQ)4
Angular variation of g factor at 300Kfor crystal '3.
Approximate orientations: HI/x-axis at +4°.Hlly-axis at -86°.
------ Computer simulation.

+9.0 - 0
0
0
- 0
0
0
- 0
0
00
0<, 0-a>
0r-Itns::I"l! 0
- 0
0
0
- 0
0
0
-90- 0I I I
0.5 0.6 o , 7 0.8
~H/MHz
F~gure 4.52TPT(TCNQ)4
Angular variation of linewidth at 300K forcrystal 1.Approximate orientations as for Figure 4.49.

+90 - oo
o- o
oo
- oo
oo - o
oo
- 0
oo
- 0o
o-90- 0~----'Ir-------------~I------------I----~
0.6 0.8 1.0ilH/l:.nrz
Fig-ure 4.53TPT (TCNQ) 4
Angular vari.ation of Lf.newLdt.h.at 300Kforcrystal 2.Approximate orientations as for Figure 4.50.

+90 0
0
0
0
0
0
0
0 0<,
Q) 0Mt)'\s:: 0 0r:t:
0
0
0
0
0
0
0
0
-90 0
0.5 0.6 0.7 0.8llH/MHz
Figure 4.54TPT(TCNQ)4
Angular variati'on of linewidth at 300K forcrystal 3.Approximate orientations as for Figure 4.51.

-154-
for DMPA(TCNQ)4(I) and sU<jgests some degree of two-
dimensionality in the xz plane for TPT(TCNQ)4' which is
the plane containing only TCNQ molecules, although this is
not reflected in the conductivity results.
The intensity of the e.s.r. signal also
exhibited an unusual temperature dependenqe, shown in
Figure 4.55. From the observation of a small activation
energy for electrical conduction, the magnetic properties
were also expected to show an energy gap in the excitation
spectrum and a corresponding activated temperature
dependence. However, all the crystals studied had essent-
ially temperature independent intensities from 300K to
approximately 100-120K. In all cases, the intensity
showed a slight increase in the region 100 to 20K,
manifesting itself as a small 'hump' in the intensity plots.
Below 20K,the intensity increased rapidly with decreasing
temperature indicative of the usual Curie law behaviour.
This intensity variation could not be attributed to either
singlet-triplet or Curie law behaviour, and log IT against
liT plots gave no meaningful results, merely reflecting the
slope mathematically expected from a plot of log T against
liT, this being shown in Figure 4.56. The curvature at low
temperatures gave an estimate of (6.8±3.0) x 1022 spins
mol-l for the number of Curie species dominating the e.s.r.
signal below 20K.

Ul 0+J•.-1 8-~::l
~ttlH+J•.-1..QHttl 6 -<,
>t+J•.-1
0Ul~aJ+J~H 4-r-ittl~tJ'l <0'.-1 0Cl)
§ 00 0o 02- 000
0 0 0 0 0 0 0
O~------------__"'__"'~Ir-----__"'--__"'~I----------------~100 200o 300
T/KFigure 4.55TPT(TCNQ)4
Plot of relative intensity against temperaturefor crystal l.
H is approximately parallel to the z-axis.
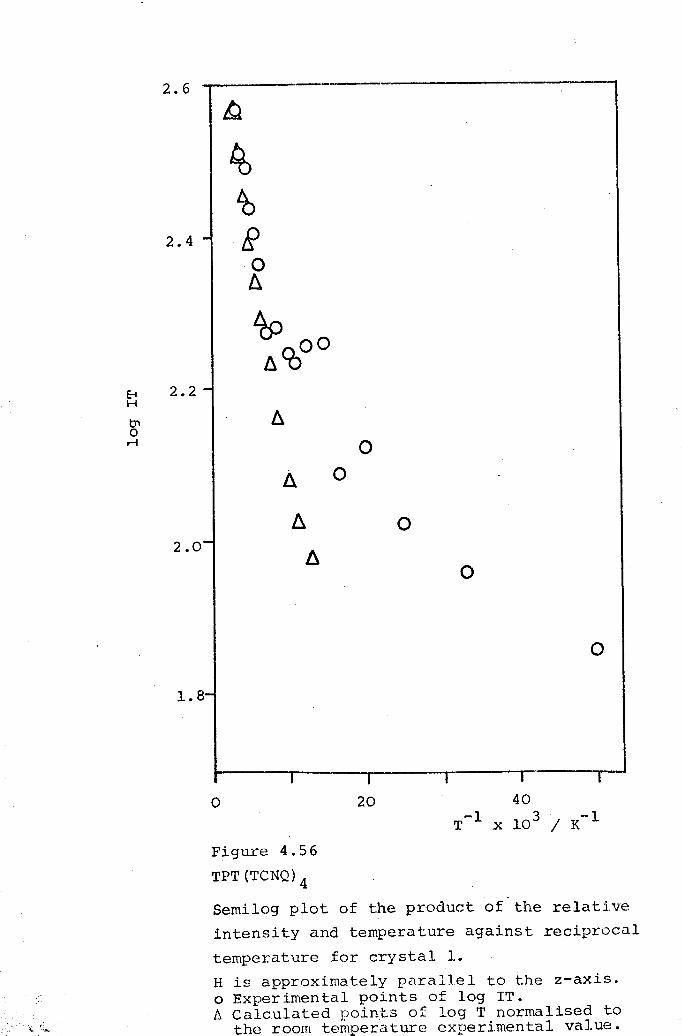
2.6tJ.
~
'b2.4 - R
0~
~ 00/lCO
E-t 2.2-H
tJI0r-l 0
A 0
~ 02.0-
II0
1.8-
o
I I I I
0 20 40-1 103 / -1T x K
Figure 4.56TPT(TCNQ}4
Semi log plot of the product of the relati.veintensity and temperature against reciprocaltemperature for crystal 1.H is approximately parallel to the z-axis.o Experimental points of log IT.6 Calculated points of log T normalised to
the room tent erature experimental value.
-155-
High temperature equipment, described in section
3.2.1(iii), was used to investigate whether the intensity
remained constant above 300K. The intensity did, in fact,
continue to be temperature independent up to 340K, the
maximum temperature available. Therefore, it appeared that
TPT(TCNQ)4 exhibited the behaviour of Pauli paramagnetism
characteristic of metallic systems. This is consistent with
the lack of any observable correlation between the electrons
and also the observed semi-metallic d.c. conductivity.
Just as the impurities in semiconductors produce
energy states in the normally forbidden band gap close to
the valence or conduction bands, disorder in TCNQ complex
salts also causes this phenomenon, known as band-tailing.This is most commonly found in amorphous solids180,181,
but a crystal exhibiting a high degree of disorder will
produce many states in the band gap and, if sufficient, a
merging of the excitation spectrum results with the
possibility of metal-like transport properties180• This
could indeed adequately explain the observed high
conductivity, the apparent Pauli paramagnetism and the
difficulty encountered in the crystal structure
determination. Therefore, the effect of disorder on the
energy states forms the basis for a model to explain the
phyaical properties of this complex salt.
Interpretation of the magnetic behaviour of many

-156-
other metallic TCNQ complexes h.as been complicated by the
existence of two potentially conducting chains, as for ex-
ample in TTF-TCNQ. However, a similar sh.ape to that shown
in Figure 4.55 for the temperature dependence of the
paramagnetism has been observed for the organic metal
quinOlinium{Qn)-(TCNQ)2182• The interpretation of the
behaviour regarded the susceptibility as the sum of two
terms. Firstly, there is a contribution from unpaired
electrons situated at chain-ends, which gives rise to a
Curie temperature dependence, and secondly, an inherent
susceptibility arising from singlet-triplet behaviour for
which there is a spread of J values. The existence of a
band gap was indicated by the small activation energy for
conduction observed and, for small band gaps, the effect
of disorder is enhanced, therefore producing the spread of
J values. However, this treatment predicts a small
minimum in intensity in the temperature region where, in
fact, a broad maximum was observed for TPT(TCNQ)4. The
slight increase in intensity between 100 and 20K would be
expected from the effect of the Curie signal superimposed
on the constant Pauli paramagnetism, rather than on the
decreasing paramagnetism exhibited by triplet species'.
The interpretation proposed for Qn(TCNQ)2 also
considers disorder as the basis for the model, but does
not attribute the magnetic behaviour to Pauli paramagnetism.
Therefore, the situation for TPT(TCNQ)4 is unclear, although

-157-
it is considered that Pauli paramagnetism is likely, and
the small activation energy for conduction could possibly
arise from interruptions in the conduction pathway, which
form metallic strands similar to those proposed by Zuse
and Kellerl83•
The room temperature susceptibility of TPT(TCNQ)4-3 3-1was found to be (1.1±0.2) x 10 e.m.u. cm mol •
Assuming the intensity behaviour can be attributed to Pauli
paramagnetism, equation 2.12 can be used to calculate a
value for the density of states at the Fermi level. Such
a calculation for this complex salt gave a value of 17±3
per eV per TPT(TCNQ)4 unit. This corresponds to 6±1 states
per eV per (TCNQ)~.3 unit, which is simialr to the values
obtained for Qn(TCNQ)2 which lie in the range 2.3 to 24states per eV per (TCNQ); unit24,100,184,185.
The linewidth variation with temperature is
shown in Figure 4.57 for two orientations of TPT(TCNQ)4.
For all the crystals studied, a decrease in linewidth
from room temperature to lOO-12K was observed, followed by
a continued decrease from lOOK to approximately 40K. The
linewidth then increased with further decrease in
temperature, producing the minimum shown in Figure 4.57.
Similar behaviour has been previously reported64,67 for
the metallic (TTT)2I3 and TTF-TNAP. In both cases, a
sudden change in linewidth was observed, which was

0.8
o
•
00
0.7 0 000
0 00
00 0 •
0.6 00
N •::r:: 0 0~::r:: 0.5 00<I 0 e
00
• •e •0.4
00 a00
e°0
o 100 200T/K
Figure 4.57TPT ('l'CNQ) 4
Plot of linewidth against temperature for twoorientations.o For crystal 1, H approximately parallel to the
z-axis .• For crystal 2, H approximately parallel to the
x-axis.
o
300
-158-
accompanied by a change in conductivity and susceptibility,
and interpreted in terms of a phase transition at the
temperature involved. Such a phase transition is feasible
in TPT{TCNQ)4' although its nature is somewhat obscure,and is consistent with the apparent change in the intensity
at approximately lOOK observed for all the crystals studied.
The Bloch equations predict Lorentzian lineshapes
for a homogeneous spin system in which the relaxation is
controlled by spin-lattice interactions, and Figures 4.58
to 4.60 show the lineshape to be Lorentzian throughout the
temperature range studied. Indeed, relaxation studies,
the results of which are given in Figures 4.61 and 4.62,
show the spin-lattice relaxation time to dominate the
behaviour of the observed linewidths.
The two most commonly discussed mechanisms for
spin-lattice relaxation include a direct process, whereby
the spins exchange quanta of energy with lattice modes
having the same frequency as the spin resonance frequency,
and an indirect process, whereby a spin interacts
simultaneously with two lattice modes whose difference
frequency is the spin resonance frequency. Although the
latter mechanism is a second order and less probable process
than the direct process, the number of different
combinations of frequency satisfying the necessary resonance
condition is very large, and, therefore, dominates at
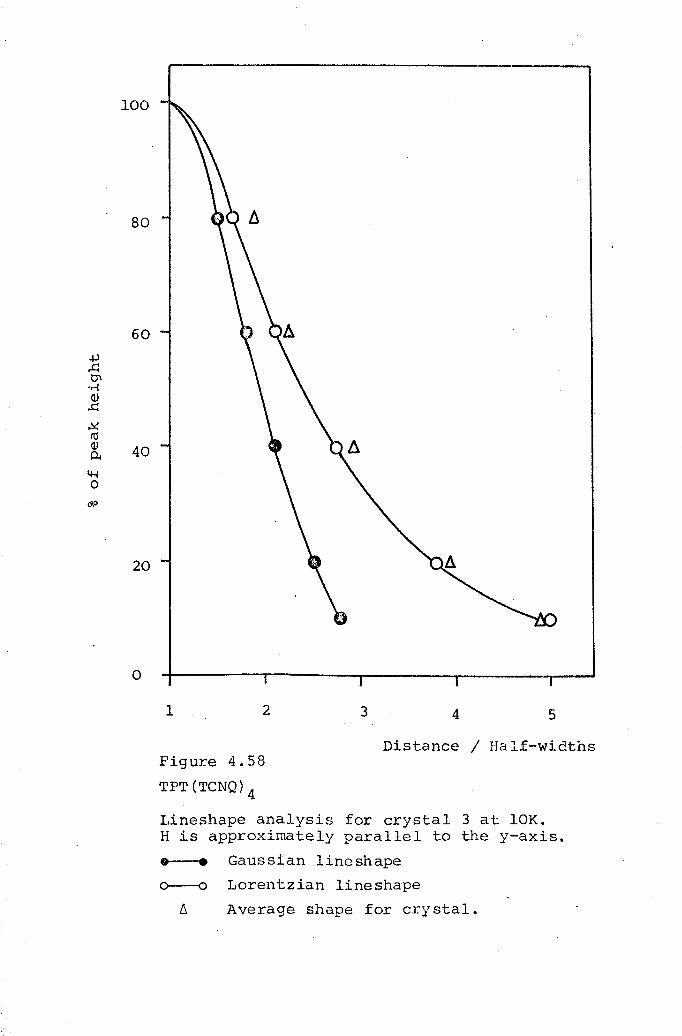
100
60+l..c::tn.r-!OJ..c::~cOOJ 40O-!4-l0
0.0
80
20
o
1 2 53 4
Distance / Half-widthsFigure 4.58TPT(TCNQ)4
Lineshape analysis for crystal 3 at 10K.H is approximately parallel to the y-axis.• • Gaussian line shape0---0 Lorentzian line shape
6. Average shape for crystal.

.en+J..c:b1or;Q) 40..c:~cd(!)Pol4-10
dP 20
1 2 3 4 5
Distance / Half-widthsFigure 4.59TPT ('reNQ) 4
Lineshape analysis for crystal 3 at aOK.H is approximately parallel to the y-axis.• • Gaussian lineshape.
Lorentzian lineshape.Average shape for crystal.
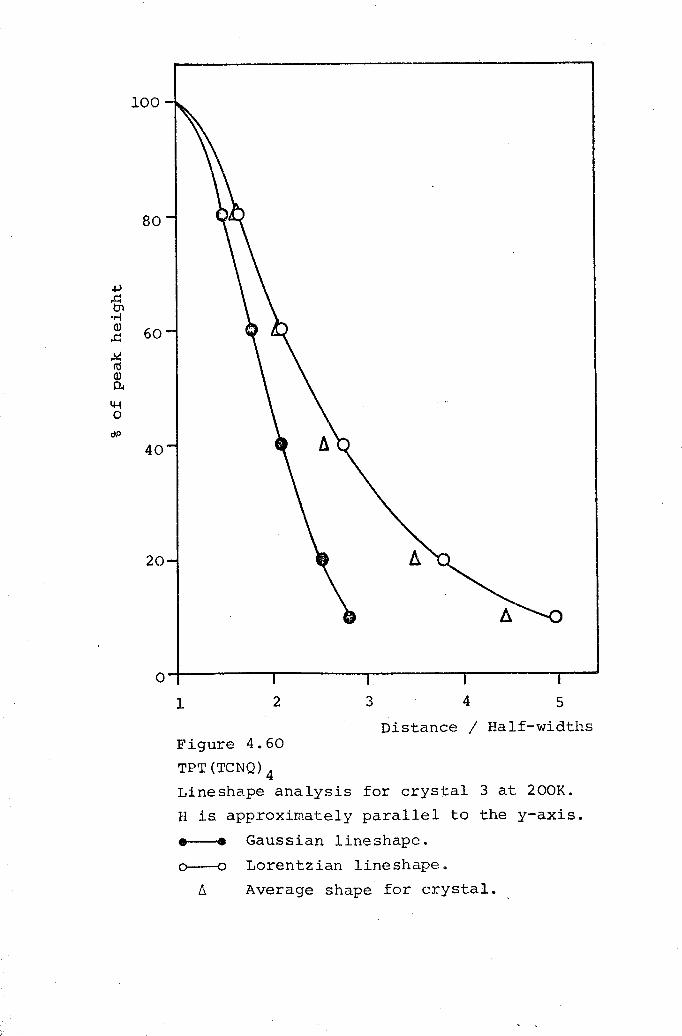
+l..c:tn.r-!Q)..c:~rOQ)Ut4-l0
dP
40
I 2 3 4 5
Distance / Half-widthsFigure 4.60TPT (TCNQ) 4
Lineshape analysis for crystal 3 at 200K.H is approximately parallel to the y-axis.
• • Gaussian lineshape.Lorentzian lineshape.Average shape for crystal.

N
N:r:<J
3
2
1
co ~~----------------~------------------~~o 40 80
Figure 4.61TPT(TCNQ)4Plot of the square of the linewidth againstthe square of the microwave ITagnetic fieldstrength for crystal 3 at two temperatures.H is approximately parallel to the y-axis.o 300K • 40K.
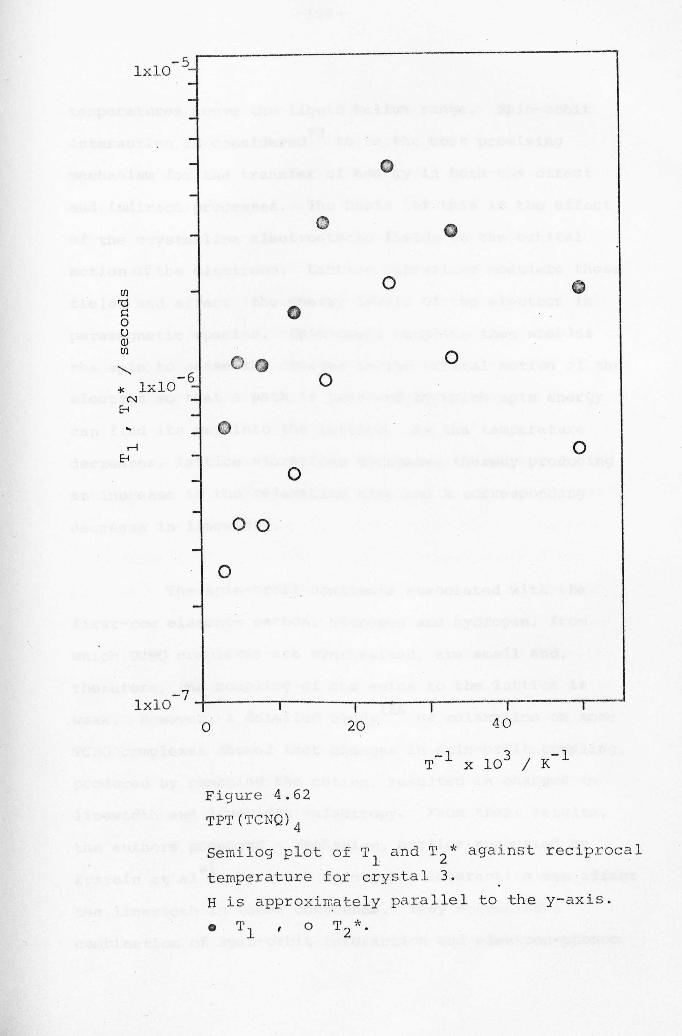
-5lxlO -------
CD CD-
Cfl - 0'I,j~ e0oQ)Cfl 0'-, 0 0-6 0oj( lxlO -N -
E-i -- er-I 0
E-i -- 0
- 0 0-0
-
--..,lxlO-' ~--.-----'---------r-------I I T---r--
20 40o
Figure 4.62TPT(TCNQ)4Semilog plot of T and T2* against reciprocal
1temperature for crystal 3.H is approxiIT~ately parallel to the y-axis.
'II1 '1, *2 .o

-159-
tempera tures above th.eliquid helium range. Spin-orbi t
interaction is considered93 to be the most promising
mechanism for the transfer of energy in both the direct
and indirect processes. The basis for this is the effect
of the crystalline electrostatic fields on the orbital
motion of the electrons. Lattice vibrations modulate these
fields and affect the energy levels of the electron in
paramagnetic species. Spin-orbit coupling then enables
the spin to sense the changes in the orbital motion of the
electron so that a path is provided by which spin energy
can find its way into the lattice. As the temperature
decreases, lattice vibrations decrease, thereby producing
an increase in the relaxation time and a corresponding
decrease in linewidth.
The spin-orbit constants associated with the
first-row elements carbon, nitrogen and hydrogen, from
which TCNQ complexes are synthesised, are small and,
therefore, the coupling of the spins to the lattice is
weak. However, a detailed studyl86 of relaxation on some
TCNQ complexes showed that changes in spin-orbit coupling,
produced by changing the cation, resulted in changes in
linewidth and linewidth anisotropy. From their results,
the authors proposed a mechanism, earlier suggested by
Epstein et al4l, by which spin-orbit interaction can afifect
the linewidth in these compounds. They suggested a
combination of spin-orbit interaction and electron-phonon

-160-
interaction, the latter playing a major role in the spin
relaxation. The differences in linewidth behaviour
exhibited within this family of organic compounds can,
therefore, be interpreted in terms of the differences in
electron-phonon coupling. The electrons are scattered by
lattice phonons, and any scattering mechanism present
whereby spins can exchange energy with lattice modes will
increase the relaxation process. As temperature is
increased, the effects of scattering are increased, which
results in a decrease in TI and an increase in linewidth.
For the case of TPT(TCNQ)4' the high degree of
disorder present within the crystal would be expected to
result in greater scattering of the electrons. Therefore,
the mechanism discussed above could indeed explain the
linewidth behaviour in the temperature region 300 to 40K.
Below this temperature, the increase in linewidth can be
attributed to the effect of the Curie signal which begins
to d~minate at these low temperatures. It is interesting
to note that the TI temperature dependence shows a change
at 120K also. This is consistent with a possible phase
transition in this temperature region, which might be
expected to produce such a change.
In conclusion, this cample~ salt has proved to be
most intriguing and outlines the complexity of the
interactions and resulting complications to be encountered
-161-
in the study of TCNQ complex salts. The mode of packing
in these crystals obviously has a large part to play in
determining the magnetic properties of these compounds,
and it would be of enormous interest to investigate other
complex salts having trivalent cations of differing types
and sizes, to establish whether the high degree of
disorder in TPT(TCNQ)4 is a direct result of a particular
property associated with this cation. With regard to a
possible phase transition, the magnetic results on their
own provide no conclusive evidence, and any definite
conclusions must await more extensive conductivity
investigations at low temperatures and the results of the
crystal structure analysis. This study provides a good
illustration of the need f~r more than one type of
technique for a complete interpretation of the physical
properties of TCNQ complex salts.

·CHAPTERS
RESULTS AND DISCUSSION OF E.S.R. STUDIES
OF TCNQ COMPLEX SALTS AVAILABLE ONLY IN
POLYCRYSTALLINE FORM.
"Nothing exists except atoms and empty space;
everything else is opinion."
Democritos
460-370 BC

-162-
5.1 DMPA(TCNQ)4 (II)
The crystal phase of this complex salt has been
discussed in section 4.2 and the magnetic properties were
interpreted in terms of localised triplet excitons having
a small interaction between each pair of unpaired electrons,
in agreement with the crystal structure. Polycrystalline
samples show distinct differences in the physical properties,exhibiting a higher d.c. conductivity than the crystal
phase, although microanalysis and spectroscopic analysis
confirmed the two phases were of the same stoichiometry.
However, X-ray powder photographs indicated there was a
crystallographic difference between the two forms, and this
difference accounts for the differences in the electricaland magnetic results.
Two polycrystalline samples of DMPA(TCNQ)4(II) were
studied, each sample being prepared for investigation as
described in section 3.2.I(v). Both samples exhibited
spectra of the shape illustrated in Figure 3.9, which is
attributed to an axially symmetric g factor. On rotating
sample 2 with respect to the static magnetic field, no
change in the spectrum was observed. Therefore, the spectrum
contained contributions from all possible orientations of
the microcrystals, and values of giland go!.could be obtained,
these values being 2.0042±O.OO03 and 2.0031±O.0003
respectively. It can be seen that these values are very
similar to the g values obtained for the crystal phase of
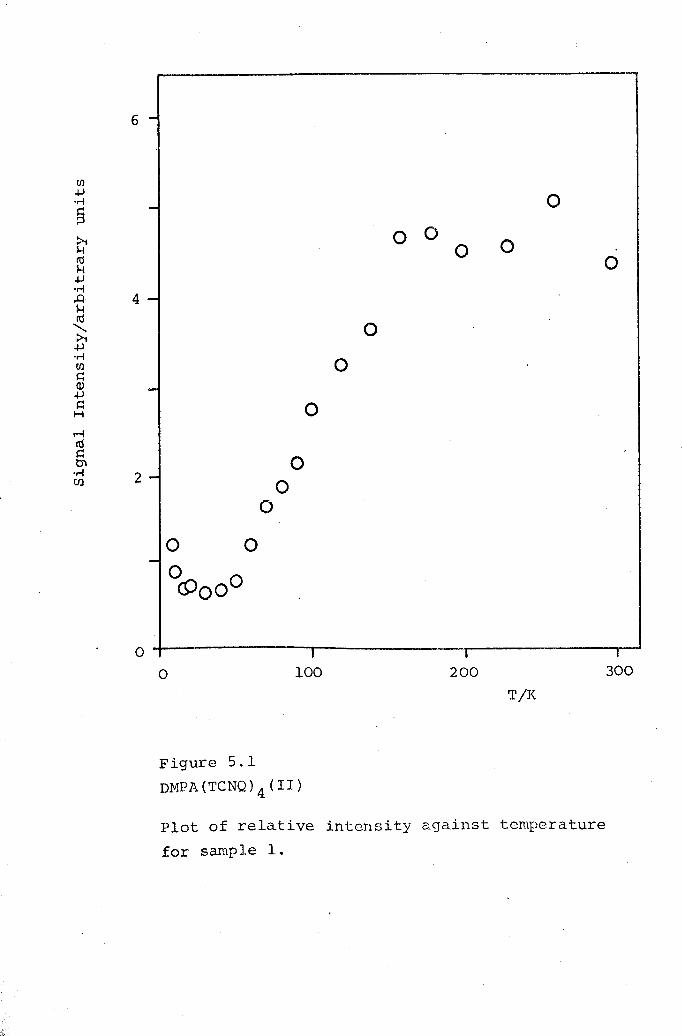
Ul+J• ..-1
§
6 -
-
4 -
-
2 -
o 0- oePOOO
oo 0
o oo
oo
o
oo
o
oo ~---------------'I----------------~I----------------~I'~
100 200 300T/K
Figure 5.1DMPA(TCNQ)4(II)
Plot of relative intensity against temperaturefor sample 1.
-163-
this complex salt. The fact that g, was found to be
closer to the free electron g value indicates there is
some degree of two-dimensionality within this phase of
DMPA(TCNQ)4. It would be expected perhaps that the one-
dimensionality of the TCNQ stack would result in a spectrum
where the unique g factor would be the high field peak, and
the low field peak would correspond to g~ , if the g factors
do in fact reflect the electron delocalisation. Indeed, a
polycrystalline sample of K(TCNQ) was found to have a
value of 2.0024 for gIland 2.0051 for gl187. However, many127other TCNQ complex salts also exhibit spectra of the type
shown in Figure 3.9 and this is usually interpreted as
reflecting the delocalisation of the excitons in the two
directions of the TCNQ sheet, with the unique g factor (g,,)
corresponding to the direction perpendicular to the cation
shae t s ,
Figure 5.1 shows the temperature dependence of
the integrated e.s.r. intensity for this complex salt.
It can be seen that the intensity is essentially constant
in the temperature region 300 to l50K and, in fact, the Q
of the cavity was markedly reduced to a value below 3,000,
the usual value being between 3,000 and 4,000, and is
typical c£ a highly conducting sample. However, below 150K
there is a steady decrease in intensity indicative of
singlet-triplet behaviour in a semiconducting complex salt,
and the Q value was observed to increase. The results

-164-
obtained from this study were used to obtain the log IT
against liT plot shown in Figure 5.2. The average slope
for both samples studied is equivalent to -1.7±0.1 kJ mol-I,
and the room temperature susceptibility was found to be-3 3-1(1.4±0.3) x 10 e.m.u. ern mol . Substituting a value
of 1.7 kJ mol-l for J in equation 2.26 for localised triplet-3 3-1states, yields a value of 2.0 x 10 e.m.u. cm mol for
the room temperature susceptibility. The experimental value
is smaller than predicted for localised triplet excitons
and, therefore, suggests some degree of delocalisation of
the excitons in DMPA(TCNQ)4(II}. Consequently, Etemad's
treatment was used to estimate the extent of this
delocalisation, which is reflected in the values of y, a(y}
and /J.(y)calculated from the experimental results.
By extrapolating the linear slope obtained in
Figure 5.2, it is possible to obtain an estimate of the
intercept on the log IT axis expressed in units of
susceptibility. From this estimation a value of 0.7±0.1
is obtained for a(y) in equation 2.30. In order to use
this to obtain a value of Y in Etemad's treatment, it is
necessary to know the ratio of the absolute temperature T
to the singlet-triplet energy gap J. However, since the
slope of Figure 5.2 is equal to -JA(y), the value of J is
unknown. Therefore, Bulaevskii's treatmentl13 must be
used at this stage to obtainey, which is found to be 0.5±
0.1. For the same reason, Bulaevskii's approach must also

1.0
-0.5
0.5
0.0
o
o
o 10 20
T-l x 103 / K-l
Figure 5.2DMPA(TCNQ)4(II)
Semilog plot of the product of the relativeintensity and temperature against reciprocaltemperature for sample 1.
-165-
be used to obtain a value ofO.8±O.1 for Ll(y). It is now
possible to calculate the value for J and, consequently,
the ratio T/J in the temperature range studied. Using the
values of T/J values in the range of validity given in
section 2.5.1, Etemad's treatment oan then be used to obtain
y from a(y). By an iterative procedure through the
calculations of y, Ll(y)and J, it is possible to obtain self-
consistent estimates of these three parameters. Having
found a final value for y, the exciton bandwidth W can be
obtained. Copies of the relevant graphs from Etemad's work
for obtaining all these parameters are presented in Appendix 1.
Using the approach outlined above, values of 0.5±0.1, 0.8±0.1, 2.l±0.3 kJ mol-l and 1.3±0.2 kJ mol-l are
obtained for y, Ll(y), J and W respectively. These
calculations indicate that there is a triplet exciton band
in DMPA(TCNQ)4(II) of width 1.3±0.2 kJ mol-l centred at 2.l±
0.3 kJ mol-l above a singlet state. This gives an effective
singlet-triplet energy gap of 1.7 kJ mol-I, which is in
excellent agreement with the value obtained from the slope
of the log IT against liT plots.
Previous applications of this treatment have
been supported by X-ray crystal stucture determinations,
where available, which show equal spacing between molecules
in the stacking direction' of complexes displaying weak
alternation188• Although a crystal structure has not been

-166-
performed on this phase of DMPA (TCNQ)4' because of the lack
of single crystals, the interpretation of the magnetic
behaviour is consistent with the electrical properties,
which are also interpreted in terms of a band model126.
Also, no dipolar splitting was observed throughout the
entire temperature range studied, in agreement with a
delocalised model.
As sample 1 was cooled below 40K, the spectral
shape shown in Figure 3.9 gradually changed into an almost
symmetrical signal. Consequently, the intensity variation
of this signal could be investigated using the oscilloscope
technique described in section 3.2.2(vi). Figure 5.3 shows
a typical example of a series of results obtained using this
method in the form of reciprocal relative intensity against
temperature. The linear relationship observed shows this
signal arises from species obeying the Curie law and, as
previously mentioned, these are considered to result from
defects in the lattice and chain ends. From the slope of21 -1a number of plots, a value of (S.2±1.1) x 10 spins mol
was obtained for the number of Curie species per mole of
sample. The deviation of the high temperature points from
a linear relationship (Figure 5.3) is the result of a
gradual population of hhe triplet state, just as the
curvature at low temperatures in Figure 5.2 results from
a significant contribution to the signal intensity from
the Curie species. From the extrapolated limit of this

6 o
Cl)
+J•.-1~~>t
~ 4+J.,..{..0HId
<,,..,IH
2
o 12 24
T/K
Figure 5.3
DMPA(TCNQ)4(II)
Plot of the reciprocal relative intensity(obtained from oscilloscope measurements)against temperature for sample 1.
o

-167-
low temperature curvature, and using the room temperature
molar susceptibility value, a value of (5.3±1.9) x 1021
spins mol-l is calculated for the number of such species,
which is in excellent agreement with the value obtained
using the oscilloscope technique.
From 300 to l50K the separation of the peaks
coincident with giland g! for sample 2 remained constant.
However, below l50K this separation increased with
decreasing temperature. A g factor study was performed at
80K but was not accurate enough to distinguish any change
in the g factors. This peak separation behaviour is shown
in Figure 5.4, error bars also being shown at each end of
the temperature scale, although the error in all the points
is ±2%. It is interesting to note that the temperature at
which this increase in peak separation begins is the same
temperature at which a maximum in intensity is observed(Figure 5.1).
Similar observations to this have been reported142,189
and two explanations emerged. Firstly, hopping of an exciton
between crystallographically inequivalent chains in the
lattice was proposed and, secondly, the effect was explained
in terms of motional averaging of the g factors as a result
of exciton migration from one crystallite to another. The
latter explanation would seem more reasonable in the case
of DMPA(TCNQ)4(II) because the TCNQ chains are generally

0.45-~ .- ~ ~I I I
100 200 300
N:I!::E:<,
s::o.r-!.jJcO
~ 0.50-0..OJfIl
0.55 -
)
o ,0o .ooo o oo o
o
oT/K
Figure 5.4DMPA(TCNQ)4(II)Plot of the peak separation against temperaturefor sample 2.

-168-
known to be equivalent in these complex salts, as shown by
the reported crystal structures for these compounds150, 170, 190.
Although separation of the crystallites has been found 127
not to remove this behaviour, this explanation is nevertheless
still considered possible. Many of the crystallites exist
in 'clumps' consisting of several microcrystals attached to
each other, and the observation of an activation energy
could certainly result from migration of excitons from one
portion of the crystallite to another across the interface.
This proposal for intracrystallite migration has beenconsidered 127 as inconsistent with the existence of an.i
exciton band, since such migration should be non-activated.
However, the interface between adjoining crystallites
represents an interruption in the band and an activation
energy is, therefore, not surprising.
The appropriate equation to describe such
behaviour would be equation 2.44, in which do would
represent the limiting peak separation at low temperature,
d would represent the peak separation at a given
temperature, and v would represent the rate of exciton
migration at that particular temperature. The results of
this analysis for DMPA(TCNQ)4(II) are presented in Figure
5.5, and the observed linear relationship indicates the
migration process is activated, the slope of this plot. -1
giving an activation energy for migration of 0.3 kJ mol •
Thi 5 value is of the correct order of magnitude expected

0.2
0.1
o 10I20
Figure 5.5
DMPA(TCNQ)4 (II)Semilog plot of the rate (in MHz) of excitonmigration (calculated from equation 2.46) againstreciprocal temperature for sample 2.'

-169-
from exciton migration and, therefore, the decrease of the
peak separation as the temperature increases to l50K, can
be reasonably attributed to averaging of the g factor
resulting from exciton motion.
It must be mentioned that the observed magnetic
behaviour can also be interpreted in terms of a metallic
phase above 150K and a semiconducting phase below this
temperature. A phase transition of this kind incorporates
change of lattice dimensions and would be expected to produce
changes in the g factor and Q values. However, this
possibility can only be verified by additional conductivity
results in this temperature region and by investtgation of
single crystals.
In conclusion, the differences in the magnetic
properties of the two phases of DMPA(TCNQ)4 appear to be
due to the mode of packing within the solid. The very low
J value observed for DMPA(TCNQ)4(I) shows the interaction
between the two electrons constituting the triplet state
to be weak, in agreement with the large separation indicated
by the crystal structure. The much higher J value, however,
for the polycrystalline phase reflects the greater
interaction between the electrons. In the absence of
structural data, the magnetic results can be interpreted as
indicating the existence of tetrads of TCNQ molecules in
DMPA (TCNQ)4 (II), as opposed to the dimer structure of the

-170-
crystal phase. Also, the magnetic susceptibility results
for both phases indicate the crystal form contains localised
triplet excitons, whereas delocalised excitons are proposed
for the polycrystalline samples. This interpretation is
consistent with the electrical data, which shows the
polycrystalline samples to be more highly conducting b¥ a
factor of 103 and requires a band model for the
interpretation of the conductivity behaviour.
5.2 DPPE(TCNQ)5
Since the discovery of the organic metal
1,2-di(N-ethyl-4-pyridinium)ethylene(DEPE)-<,TCNQ)4 in this
department, interest has obviously been aroused in other
TCNQ complex salts containing cations in the same series
as DEPE. The next one along the series is 1,2-di(N-npropyl-
4-pyridinium) ethylene (DPPE) and microanalysis and
spectroscopic results indicated the complex salt has a
stoichiometry of five TCNQ molecules per cation.
Unfortunately, although many preparations were undertaken,
only polycrystalline samples could be obtained, this series
of compounds apparently being very difficult to obtain in
crystal form.
The d ;c, conductivity was measured as part of this
work, the results being given in Appendix 2. The conductivity
was found to be in the semi-metallic region, having a room-1 -1temperature average value of 0.3 ohm cm with a small

-171-
. -1activation energy of 10.6 kJ mol •
Two weighed samples were prepared for the e.s.r.
measurements and both displayed the spectrum type shown
in Figure 3.9. A g factor study could not be performed,
however, as the spectra obtained were not representative
of all possible orientations of the crystallites. The
intensity of the e.s.r. signals was studied as a function
of temperature and exhibited the previously discussed
intensity behaviour for triplet excitons having a low
value of the singlet-triplet energy gap. The broad
intensity maximum was observed at approximately 80K, with
a slight decrease in intensity above this temperature due
to thermal energy partially removing the triplet character
of the electrons. Below 80K the intensity decreased
rapidly, and the slope obtained from the log IT against
liT plots, a typical example being shown in Figure 5.6,-1was calculated as -0.9±0.1 kJ mol • Using this value
for3cm
J in equation 2.26 yields a value of 2.3 x 10⁻³
mol-l, which is considerably larger than thee .m. u.
experimental value of (1.3±0.4) x 10-3 e.m.u. cm3 mol-I.
This suggests that delocalised triplet excitons exist in1DPPE(TCNQ)5 and the slope of the logIT against IT plots
is representative of an effective energy gap of at: (y) •
This is also supported by the lack of any observed dipolar
splitting throughout the temperature range investigated.

0.5
E-IH
tnor-I
-0.5
1.0
o
0.0
.....o 20 40
Figure 5.6
DPPE(TCNQ)S
Semilog plot of the product of the relative intensityand temperature against reciprocal temper.ature forsample 1.

.-172-
Using th.e approach outlined in the previous
sections, estimations of a(y), y, b.(y), J and W can be
calculated and are found to be O.S±O.l, O.6±O.1, O.7±O.1,
1.3±O.2 kJ mol-l and 1.1±O.2 kJ mol-l respectively. It can
be seen from these values that the degree of delocalisation
is similar to that found for DMPA(TCNQ)4(II) which has
similar magnetic properties and high value for the
conductivity. However, the values for J are slightly
different and this reflects the interaction between the
electrons in the solid. In DMPA(TCNQ)4(II), the two
unpaired electrons are distributed over four TCNQ molecules
and, therefore, a greater interaction is expected than for
DPPE(TCNQ)S in which the electrons are distributed over
five molecules, assuming the extent of molecular overlap
is the same.
The value of y obtained for DPPE(TCNQ)S indicates
the exchange coupling is not strongly alternating and the
exciton is delocalised, but the value is bordering on th.e
region where Etemad's treatment is specified as being no
longer valid. However, this treatment has been used by
other workers191 outside the limits in which the theory
can be applied and, since this treatment is only
approximate, it is considered to give a reasonable descrip-
tion of the energy states in this complex salt. Also, the
continued linearity of the log IT against liT plot supports
the view taken as to the wider application of the theory.

-173-
Below 14K, the signal intens.ity was observed to
increase due to the usual ons-et of Curie law behaviour.
As the spectra from both samples collapsed at low
temperatures to give a single symmetrical peak, an estimate
of the number of these doublet species could be obtained
using the oscilloscope technique. A typical plot of the
results is presented in Figure 5.7 and shows the intensity
does in fact obey the Curie law. The average value of this
estimate, calculated from a number of such plots is (3.1±
1.5) x 1021 spins mol-l and compares very well with the
average value of (2.8±0.8) x 1021 spins mol-l obtained
from the low temperature curvature of the log IT against
liT plots. The signal was found to be symmetrical enough
for a lineshape analysis to be performed in this
temperature region, and Figure 5.8 shows the lineshape to
deviate from the Lorentzian shape associated with migrating
species. This supports the suggestion that the signal is
caused by isolated monanion radicals rather than by triplet
excitons.
The magnetic behaviour of DPPE(TCNQ)5 is well
described by the model of delocalised triplet excitons and
is consistent with the high d.c. electrical conductivity
observed. Whether the properties of the cation or the
extra TCNQ molecule per cation are responsible for the
differences in magnetic properties between this complex
salt and the metallic phase of DEPE(TCNQ)4 is not clear and

[J)
+l• ..-1
§:>t 4HctIH+l• ..-1..QHctI
<,
,.;IH
2
o 6 12T/K
Figure 5.7
DPPE(TCNQ)5
Plot of the reciprocal relative intensity(obtained from oscilloscope measurements)against temperature for sample 2.
o
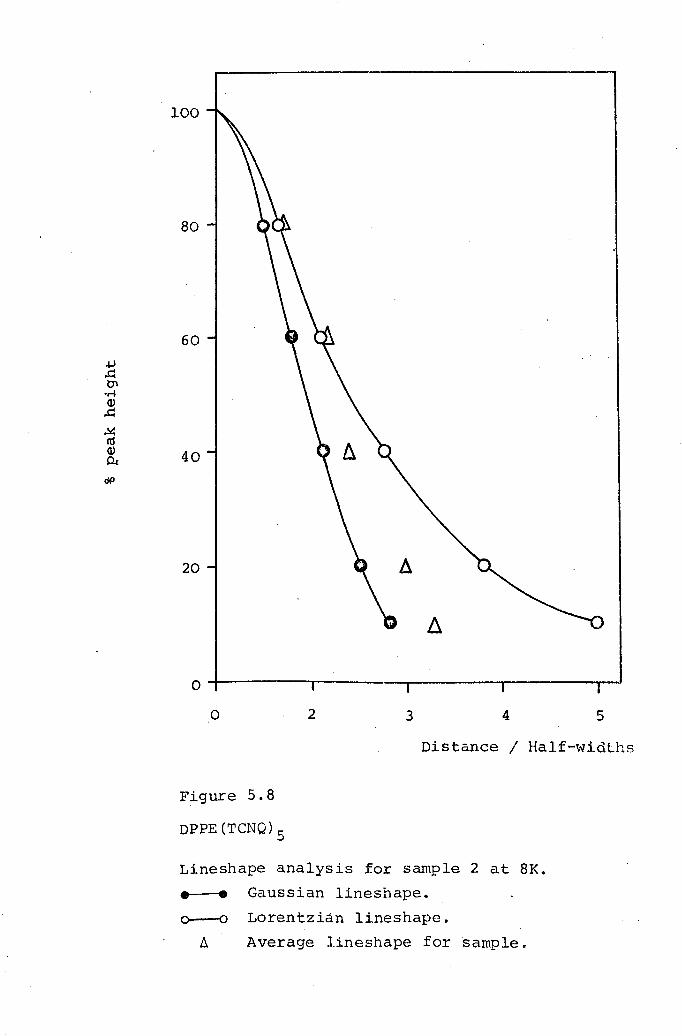
60+J,qtJlor-{OJ,q
..!oI!n1OJ 40Ol:
tiP
o 2 3 4 5
Distance / Half-widths
Figure S.S
DPPE(TCNQ)S
Lineshape analysis for sample 2 at SK.__ • Gaussian lineshape.0---0 Lorentzian lineshape.
/:,. Average lineshape for sample .
-174-
studies of single crystals of th.ese compounds might prove
useful, as th.e information derived from polycrystalline
samples is somewhat limited.
5.3 DBPE(TCNQ) 5
The cation used in the preparation of this complex
salt is also from the same series as DEPE, and is
1,2-di(N-nbutyl-4-pyridinium)ethylene(DBPE). Again, only
polycrystalline samples were available, and the d.c.
conductivity results for this complex salt are presented
in Appendix 2. The room temperature value of the
conductivity was observed to be much lower than f~~
DPPE(TCNQ)5' being 3.6 x 10⁻² ohm-l cm-l with an activation-1energy for conduction of 15.4 kJ mol •
The magnetic properties of two samples were
studied and both exhibited the spectrum typical of an
axially symmetric g factor with the high field and low
field peaks corresponding to g.!.and gilrespectively. As
with DPPE(TCNQ)5' the spectrum was observed not to
contain contributions from all possible orientations of
the microcrystals. Consequently, a g factor study was not
possible. This is due to the large size of the microcrystals
in these particular samples, which were obtained during
attempts to achieve the correct experimental conditions
for preparation of single crystals. Therefore, in the
small weight of sample required for the e.s.r. experiments,

-175-
a sufficient number of microcrystals was not present for a
g factor study to be pos'sible.
The signal intensity of both samples increased
slightly from 300K to approximately SOK, below which the
intensity rapidly decreased. A typical log IT against liT
plot is shown in Figure 5.9 and the average slope obtained-1from these plots is -1. 3±0.1 kJ mol • The value of the
room temperature susceptibility was found to be (1.S±0.2)-3 3 -1 -1x 10 e.m.u. cm mol and, using a value of 1.3 kJ mol
for J in equation 2.26 for localised triplet states, the
predicted susceptibility is 2.2 x 10⁻³ e.m.u. cm3 mol-I.
The experimental value is slightly lower than this, although
the agreement is very close. Therefore, any degree of
delocalisation in this complex salt is small. An attempt
was made to assess any such degree of delocalisation using
Etemad's treatment, but the value of Y calculated from the
experimental results was found to be zero, the value
expected ~or strongly alternating localised triplet excitons.
Consequently, it might be expected that the evidence for
dipolar splitting would be observed at low temperatures if
indeed a localised model is applicable for DBPE(TCNQ)5. No
such evidence was observed in the entire temperature range
investigated. However, the value for the singlet-triplet
energy gap indicates the overlap of the wave functions is
small. Therefore, any dipolar interaction between them may
also be small and result in fine structure smaller in

E-t -1H
b1or-I
1
o
o
-2
-3+---~----'---------'---------'-------~o 20 60
-1 3 -]T x 10 / K -
40
Figure 5.9
DBPE(TCNQ)5
Semi10g plot of the product of the relativeintensity and temperature against reciprocaltemperature for sample 1.
o
80

-176-
magnitude than the g factor anisotropy. Furthermore, at
low temperatures, where only a sing1e almost symmetrical
signal was observed, the linewidth for DBPE(TCNQ)s was
considerably larger than observed for the other polycryst-
alline complex salts studied. This would be expected from
localised spec:ies experiencing hyperfine and dipolar
broadening at low temperatures.
Below 10K, the intensity increased as the signal
from the Curie species began to dominate. The spectrum
displayed on the oscilloscope was approximately symmetrical
and, consequently, the number of such species could be
evaluated using measurements taken from the screen. A
typical set of results is presented in Figure 5.10 and
this study gave an estimate of (1.2±0.6) x 1021 spins per
mole offsample, which compares well with the value of
( 8 3) 1021. 1-1 .o. ±o. x spans mo obcanned from the log IT
against liT plots.
The magnetic properties of DBPE(TCNQ)s appear,
from the results obtained in this work, to be best
described by a localised triplet exciton model, and this
is consistent with the semiconducting electrical properties
observed and the high actLvation energy for conduction.
These results differ from those obtained for the closely
related DPPE(TCNQ)s' which has a higher semi-metallic
conductivity, small activation energy, and magnetic
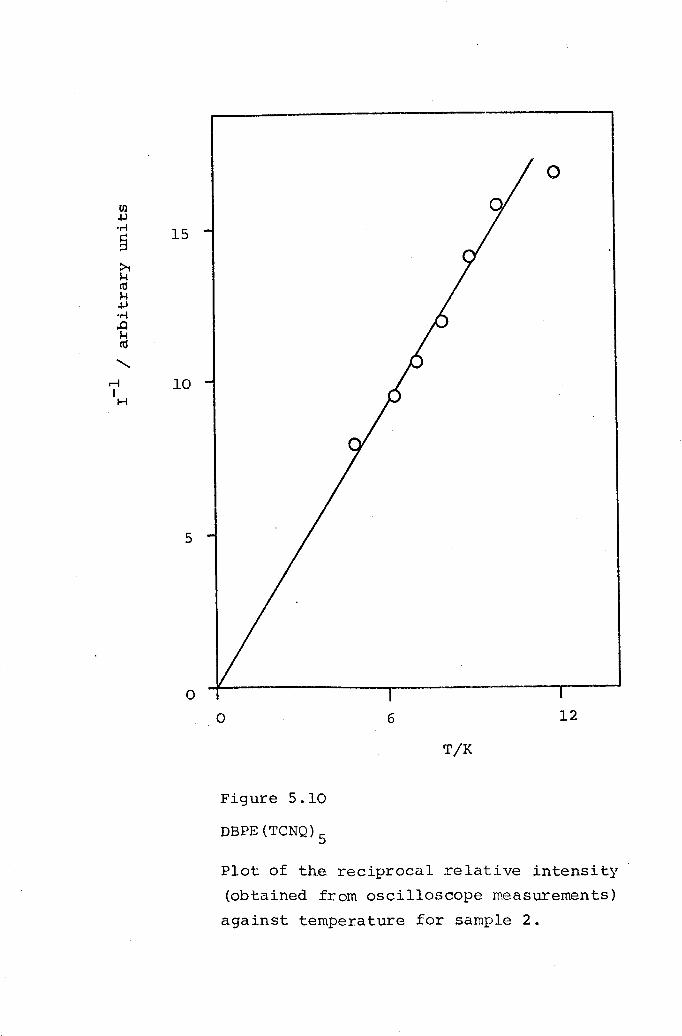
0
til4.l.~ 15§>cHCISH4.l.~.0HCIS
<,
r-l 10IH
5
oo 6 12
T/K
Figure 5.10
DBPE(TCNQ)5
Plot of the reciprocal relative intensity(obtained from oscilloscope measurements)against temperature for sample 2.

-177-
proper tie s associa.ted with delocalis.ed tr iplet exci tons.
The only structural difference between DBPE(TCNQ)S and
DPPE(TCNQ)S is the presence of an extra methylene group at
each end of the c·ation DBPE. It would appear, therefore,
that the differences in the physical properties are due to
the change in cation and degree of polarisability. The
number of defect sites in both compounds is similar and
would not be expected to cause such differences in the
physical properties. Indeed, the activation energy for
conduction would be expected to be greater, not smaller,
in DPPE(TCNQ)S merely from considering the effect of
defects on the transport properties. Therefore, the
effect of the cation would seem to playa major role in
determining the extent of overlap of the molecular wave
functions and, subsequently, the energy states in these
compounds. However, once again, single crystals are
required for definite statements to be made concerning
the structural differences between these two complex salts.
5.4 DHPE (TCNQ)5
The cation 1,2-di(N-cyclohexyl-4-pyridinium)-
ethylene (DHPE) is also from the same series as DEPE, DPPEand DBPE. As was the case for the latter two cations,
preparations of the TCNQ complex salt of DHPE yielded
only polycrystalline samples.
The two samplesused for the e.s.r. investigations

-17S-
gave spectra of the type shown in Figure 3.9, and.were
observed to contain contributions from all possible
orientations of the microcrystals. Therefore, a g factor
study could be performed and the values for giland g, were
found to be 2.0043±0.OO03 and 2.0034±0.0003 respectively.
The.se values can be interpreted as reflecting the two-
dimensionality within the cation sheet, with the unique g
factor corresponding to the direction through the cation
planes.
The temperature dependence of the signal intensity
was very similar to the behaviour observed for DPPE{TCNQ)S
and DBPE{TCNQ)S. A typical example of the log IT against
liT plots for this complex is shown in Fmgure 5.11, and
the average value of the slope was found to be -1.4±0.1 kJ
mol-le If this were a true representation 0; J, a room
temperature susceptibility of 2.2 x 10⁻³ e.m.u. cm3 mol-l
would be expected. However, the experimental value was-3 3-1only (0.9±0.2) x 10 e.m.u. cm mol , which is
considerably lower than the predicted value. Therefore,
the slope of the log IT against liT plots is only
representative of the effective singlet-triplet energy g~p
J~{y) produced by delocalisation of the excitons to give
an exciton band. Application of Etemad's treatment for
DHPE{TCNQ)S gives rise to values of 0.3~0.1, O.S±O.l, 0.4±-1 -1 .0.1, 3.S±0.S kJ mol , and 4.l±0.S kJ mol for a{y), y,
~ (y), J and W respectively. These results show that there

0.4
E-iH
C10r-I 0
0o.0
0.8
Figure 5.11
DHPE (TCNQ) 5
Semilog plot of the product of the relativeintensity and temperature against reciprocaltemperature for sample 1.

-179-
is a very broad exciton band of width 4.1±0.8 kJ mol-l-1centred at 3.S±O. 8 kJ mol above a ground singlet state.
This gives an effective singlet-triplet energy gap of 1.5
kJ mol-l which is in very good agreement with the value
obtained from the log IT against liT plots. The
interactions which produce this broad exciton band would
be expected to also produce a broad conduction band, and
this is borne out by the high conductivity of 0.2 ohm-l cm-I
for DHPE(TCNQ)S' Also, if it is assumed that the very small
activation energy for conduction (5.8 kJ mol-I) mostly arises
from crystallite boundary effects, the results obtained from
polycrystalline samples indicate that single crystals of
this complex salt may possibly be metallic.
The value for y of 0.8 is greater than 0.5 and,
therefore, is outside the range of validity specified in
Etemad's work. However, the continued linearity of Figure
5.11 gives confidence that this treatment provides a
reasonable description of the exciton states in this
complex salt. Further support is given by the d.c.
conductivity data, measured as part of this work, the
results of which are presented in Appendix 2. Lack of any
dipolar splitting is also consistent with the interpretation
of delocalised excitons.
Below SOK, the spectra began to collapse and
produced a single symmetrical peak at low temperatures.
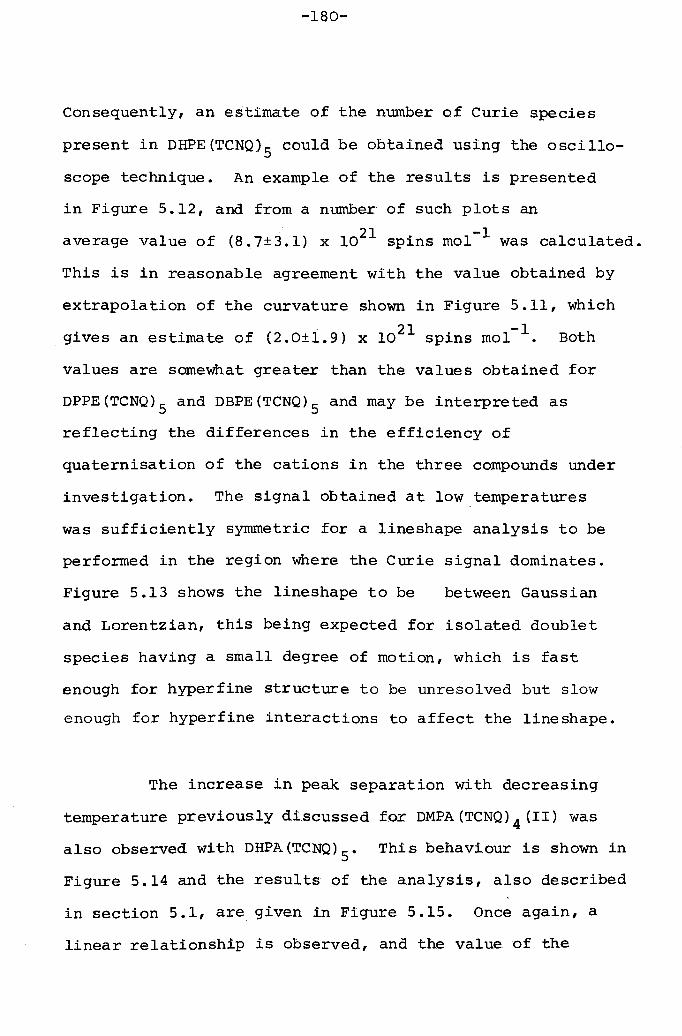
-180-
Consequently, an estimate of the number of Curie species
present in DHPE (TCNQ)5 could be obtained using the oscillo-
scope technique. An example of the results is presented
in Figure 5.12, and from a number of such plots an21 -1average value of (8.7±3.l) x 10 spins mol was calculated.
This is in reasonable agreement with the value obtained by
extrapolation of the curvature shown in Figure 5.11, which
gives an estimate of (2.0±1.9) x 1021 spins mol-I. Both
values are somewhat greater than the values obtained for
DPPE(TCNQ)S and DBPE(TCNQ)S and may be interpreted asreflecting the differences in the efficiency of
quaternisation of the cations in the three compounds under
investigation. The signal obtained at low.temperatures
was sufficiently symmetric for a line shape analysis to be
performed in the region where the Curie signal dominates.
Figure 5.13 shows the lineshape to be between Gaussian
and Lorentzian, this being expected for isolated doublet
species having a small degree of motion, which is fast
enough for hyper fine structure to be unresolved but slowenough for hyperfine interactions to affect the lineshape.
The increase in peak separation with decreasing
temperature previously discussed for DMPA(TCNQ)4(II) was
also observed with DHPA(TCNQ)S. This behaviour is shown in
Figure 5.14 and the results of the analysis, also described
in section 5.1, are given in Figure 5.15. Once again, a
linear relationship is observed, and the value of the

en+.I.r-!~ 3::l:>t1-1ttl1-1+.I.r-!.o1-1ttl<, 2
nIH
o 6 12T/K
Figure 5.12DHPE(TCNQ)5
Plot. of the reciprocal relative intensity(obtained from oscilloscope measurements)against temperature for sample 2.
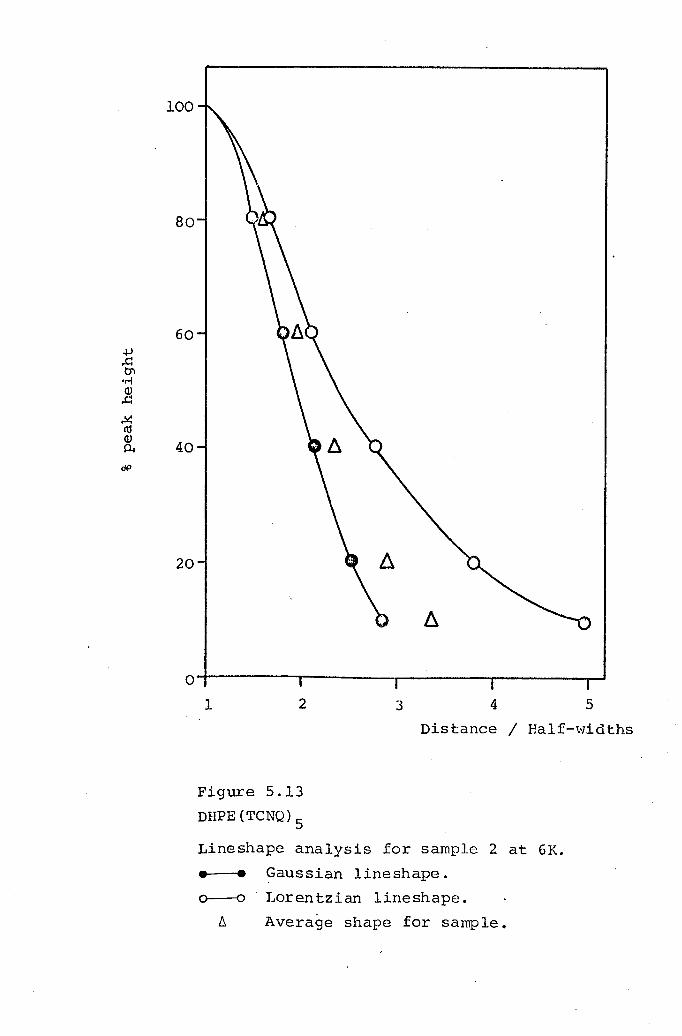
60.j..J..c:tn'r-!Q)..c:..!<toQ) 40PoldP
1 2 3 4 5
Distance / Half-widths
Figure 5.13DHPE(TCNQ)5
Lineshape analysis for sample 2 at 6K.• • Gaussian lineshape.0--0 Lorentzian lineshape.
~ Average shape for sample.

o
4.8- 00
Np::~<, 0~ -0.r-!.j.Jn:l
0Hn:l'4<LlUl
~ 4.4- 0 0n:l<Ll
0Ili
o-
4.0-
I
100I
200I
300
T/K
Figure 5.14DHPE(TCNQ)5
Plot of the peak separation against temperaturefor sample 2.

0.2
0.0
-0.2
o 5 10 15
Figure 5.15DHPE(TCNQ)S
Semilog plot of the rate (in MHz) of excitonmigration (calculated from equation 2.46)against reciprocal temperature for sample 2.
-181-
activation energy for exciton migration obtained from the-1slope is 1.0 kJ mol • This value is larger than that
observed for DMPA(TCNQ)4(II) and this is most probably
due to differences in the interfaces of the microcrystals.
Nevertheless, this value is reasonable for the peak
separation behaviour to be attributed to exciton migration.
The three compounds discussed in sections 5.2 to
5.4 have cations belonging to the same series and, therefore,
their TCNQ complex salts might be expected to exhibit similar
properties. ,Indeed, DPPE(TCNQ)5 and DHPE(TCNQ}5 do have
similar physical properties, both having semi-metallic d.c.
conductivities and magnetic properties associated with
delocalised triplet excitons. However, DBPE(TCNQ)5 has a
lower conductivity, and a localised triplet exciton model
most closely describes the observed magnetic properties.
As all three complex salts have five TCNQ molecules per
cation, it appears that the cation governs the properties
of these compounds. Consequently, further investigations
on ~ther cations in this series and the preparation of
single crystals of these compounds could prove most
interesting.

CHAPTER 6
CONCLUDING REMARKS
"Science has the first word on everything,
and the last word on nothing."
Victor Hugo
1802 - 1885

-182-
The results presented in this thesis are
consistent with the majority of literature in this field
with respect to the observation of singlet-triplet
magnetic behaviour in TCNQ complex salts. The triplet
state is relatively uncommon in e.s.r. studies and these
compounds provide a unique opportunity for theoreticians
and experimentalists to investigate such species and the
associated phenomena. Indeed, explanations of the observed
behaviour of triplet excitons have been difficult in the
past because of the lack of theoretical models, but the
intensive attention focused on TCNQ complex salts has led
to a partial understanding of these systems.
The common factor in all the compounds studied,
with the exception of TPT(TCNQ)4' is the presence of
triplet excitons, whe'hher these be localised or delocalised.
However, the various manifestations of this behaviour vary
from compound to compound depending on the interactions
occurring within the solid. Although the common structural
features are the stacking behaviour of the TCNQ molecules,
some degree of two-dimensionality in the TCNQ sheets, and
segregation of these sheets by cation planes, the very
small variations in distance separation and overlap of these
molecules give rise to di;fferent magnetic properties. This
confirms the suggestion that these properties are a sensitive
function of the mode of packing in the solid, in which the
cation plays an important role, as indicated by the results

-183-
for DPPE(TCNQ)S' DBPE(TCNQ)S and DHPE(TCNQ)S. Furthermore,
this sensitivity to slight structural differences illustrates
the complexity of the interactions within these systems and
why a fully comprehensive understanding of the properties
governing the electrical and magnetic behaviour has not yet
been achieved.
The majority of past studies has been concentrated
on TCNQ complex salts of monovalent and divalent cations,
whose structures fall into the categories of one-dimensional
TCNQ stacks and two-dimensional TCNQ sheets. The trivalent
cation, TPT, studied in this work is a good example of how
drastically the change of cation type can alter the
structure of the solid and, consequently, the physical
properties. Therefore, it is felt that the next phase in
the study of TCNQ complex salts should be directed towards
compounds of differing structural types.
The technique of low temperature e.s.r. has proved
to be a valuable tool in the investigation of TCNQ complex
salts, providing a great deal of information regarding the
existing magnetic states, particularly in the single
crystal studies. However, although these results provide
a basis for proposed interpretations, they do not on their
own provide conclusive evidence for definite statements to
be made, as examplified by all the cases discussed in
this work. Certain correlations exist between the magnetic

-184-
and electrical properties, both of which bear a relationship
to the crystal structure. Unfortunately, only preliminary
investigations of the electrical properties of DCBP(TCNQ)3
and TPT(TCNQ)4 have been performed and, therefore, the
interpretation of the magnetic behaviour must at present
remain speculative. Similarly, the possibility of phase
transitions in some of these compounds can only be verified
with electrical and structural data in the low temperature
region of interest, which currently remains an obstacle to
be overcome in this department. This illustrates the
interdependence of the various techniques required to
adequately explain the properties of these compounds.
However, it is felt that, even with these limitations,
the low lying electronic states can be reasonably
described from their magnetic behaviour, and provide
valuable evidence in the quest to elucidate the theoretical
models applicable.
The role of defect sites in the lattice has
proved most interesting. The existence of these sites
would appear to have several different effects on the
magnetic properties, as shown by the central signal in
DCBP(TCNQ)3' the unusual temperature independence of the
signal intensity in TPT(TCNQ)4' and the usual Curie signal
observed at low temperatures in the vast majority of TCNQ
complexes. Consequently, further work may be of value in
investigating these species, combined with different

-185-
preparative techniques to study how these species might
be either eliminated or their number controlled. This is
particularly important with respect to the transport
properties in these compounds, as the presence of defects
has quite a significant effect on the conductivity.
It has been mentioned that the g factors do
not seem to have much value in the interpretive sense
although, on the whole, the g values are in agreement with
the degree of delocalisation of the electrons, as indicated
by the conductivity results.· However, it is considered
that the interpretation of the g factor anisotropy is valid
but possibly over-simplified, the interactions which govern
these values being of a more complex nature in TCNQ
complex salts.
The unusual angular variation of the linewidth
observed at room temperature with DMPA(TCNQ)4(I),
DPB(TCNQi4 and TPT(TCNQ)4 has been interpreted in previous
reports for other compounds in terms of incomplete
averaging of dipolar splitting in nearly two-dimensional
magnetic systems. However, in all the three complex
salts mentioned above no evidence of dipolar splitting was
observed even at low temperatures and, therefore, any
effect from such a small interaction would be expected to
be completely removed at room temperature. Consequently,
this explanation would not seem valid for these particular

-186-
compounds. Al though this phenomenon has. been reported
by other workers, no detailed theoretical investigation
has been undertaken. However, the compounds do appear
to have some degree of two-dimensionality, as indicated by
the crystal structure and electrical results and, therefore,
are in partial agreement with the interpretation.
The temperature dependence of the linewidths in
these compounds also proved most interesting. The
complex salts DMPA(TCNQ)4(I) and DPB(TCNQ)4 have very
similar crystal structures, d.c. conductivities, and
magnetic properties, with the exception of the linewidth
behaviour. Once again, although such variations of
behaviour have been experimentally reported, few
theoretical investigations havebbeen performed. The
explanation in terms of Wannier excitons in DBP(TCNQ)4
would not be consistent with the susceptibility and
electrical data, although this possibility cannot be
entirely ruled out until high-pressure studies are
available.
There have been many suggestions concerning the
mechanism of spin-lattice relaxation and all consider
selective transfer of electron spin energy to lattice
modes resonant with the spins. However, although the
phenomenon of e.s.r. is quite well understood,' the
position of relaxation effects is not nearly as

-187-
satisfactory. Experimental observations have been
numerous, but theoretical accounts have had varying degrees
of success. It is clear from the wide range of linewidth
behaviour exhibited by the TCNQ complex salts discussed in
this thesis, particularly in the single crystal studies,that more intensive investigations including other
relaxation techniques are required for a complete
understanding of the parameters governing the linewidth.
The intention of this work was to investigate themagnetic properties of TCNQ complex salts and use these
results, together with crystal structure and electrical
data to propose consistent theoretical models to account
for the observations. Although all aspects of the magnetic
behaviour cannot be readily explained, correlations with
the crystal structure determinations and conductivity
results were obtained, and the models proposed in this
work are indeed consistent with these properties. Therefore,
it would seem reasonable to conclude that the aim of thiswork has been successfully fulfilled.

REFERENCES1. A.Pochettino, Acad.Lincei Rendiconti,lS(l), 355(1906)•2. A.Szent-Gyorgyi,Nature, 148, 157(1941).3. S.BaxteF and A.B.D.Cassie, Nature, 148, 408(1941).4. S.Baxter, Trans.Faraday Soc.,34, 207(1943).5. A.Szent-Gyorgyi, Nature, 157, 875(1946).6. D.D.Eley, Nature, 162,819(1948).7. A.T.Vartanyan, Zhur.Fiz.Khim., 22, 769 (1948).8. H.Akamatu and H.lnokuchi, J.Chem.Phys.,18, 810(1950).9. H.Akamatu, H.lnokuchi, and Y.MatsunaSa, Nature, 173,
168 (1954)•10. D.Bijl, H.Kainer, and A.C.Rose-Innes, J.Chem.Phys.,
30, 765(1959).11. J.Bardeen, L.N.Cooper, and J.R.Schrieffer, Phys.Rev.,
108, 1175(1957).12. W.A.Little, Phys.Rev.,134A, 1416(1964).13. R.A.Ferrel1, Phys.Rev.Lett.,13, 3'130(1966).14. C.G.Kuper, Phys.Rev., 150, 189(1966).15. K.F.G.Paulus, Mol.Phys.,10, 381(1966).16. D.S.Acker, R.J.Harder, W.R.Hertler, W.Mahler, L.R.Melby,
R.E .Benson, and W.E.Mochel, J.Am. Chern.Soc., 82, 6408(1960)•
17. P.H.Rieger and G.K.Frenkel, J.Chem.Phys., 37, 2795(1962)•
18. R.E.Long, R.A.Sparks, and K.N.Treeblood, Acta Cryst.,18,932(1965).
19. C.J.Fritchie,Jr., Acta Cryst., 20, 892(1966).20. D.A.Lowitz, J .Chem.Phys.,46, 4698(1967).21. L.R.Melby, R.J.Harder, W.R.Hertler, W.Mah)..er, R.E.
Benson, and W.E.Mochel, J.Am.Chem.Soc.,84,3374(1962).22. W.J.Siemons, P.E.Bierstedt, and R.G.Kepler, J.Chem.
Phys.,39, 3523 (1963).

23. D.B.Chestnut and W.D.Phillips, J.Chem.Phys., 35,1002 (1961).
24. R.G.Kepler, J.Chem.Phys., 39,3528(1963).25. o. H.LeBlanc,Jr., J.Chern.Phys.,42, 4307(1965).26. J.H.Lupinsk1 and K.D.Kopple, Science,146, 1038(1964).27. A.Rembaum, A.M.Hermann, F.E.Stewart, and F.Gutmann,
J.Phys.Chem., 73, 513(1969).28. D.W.Bonniface, M.J.Braithwaite, D.D.Eley, R.G.Evans,
R.Pethig, and M.R.Willis, Disc.Faraday Soc., 51, 131(1971)•
29. H.Hatano, S.Kambara, and S.Okamoto, J.Polymer Sci.,51, 526(1961)•
30. W.Slough, Trans.Faraday Soc., 58, 2360(1962).'31. I.F.Shchegolev, Phys.Stat.Sol.,12{a), 9(1972).32. P.A.Fedders and J.Kommandeur, J.Chem.Phys., 52, 2014
(1970).33. D.B.Chestnut and P.Arthur, J.Chem.Phys.,36, 2969(1962).34. R.G.Kepler, P.E.Bierstedt, and P.E.Merrifield, Phys.
Rev.Lett., ~, 503(1960).35. D.J.Dahm, P.Horn, G.R.Johnson, M.G.Miles, and
J.D.Wilson, J.Cryst.Mol.Structure,~, 27(1975).36. D.B.Chestnut and R.W.Mosely, Theor.Chim.Acta,13,
230(1969).37. J.B.Torrance, Conf. on Synth. and Prop. of Low-
Dimensional Materials, ed. J.S.Miller, 1977.38. A.N.Bloch, R.B.Weisman, and C.M.Varma, Phys.Rev.Lett.,
28, 753(1972).39. G.Milhaly, K.Holczer, A.Janossy, G.Gruner, and.M.
Miljak, Proc. Conf. on Organic Conduct. and Semi-Conduct., Siofok, Hungary, 553(1976).
40. A.F.Garito and A.J.Heeger, Accts. of Chem.Res.,I,232 (1974)•
41. A.J.Epstein, S.Etemad, A.F.Garito, and A.J.Heeger,Phys.Rev.,5B, 952(1972).
42. W.L.McCubbin, Phys.Lett.,·19, 461(1965).

43. J.M.Thomas, Nature, 3,!!, 56(1973).
44. A.J.Epstein,S.Etemad, A.F.Garito, andA.J.Heeger,Solid State Comm., 2., 1803 (1971) .
45. V.Walatka and J.H.Perlstein~ Mol.Cryst. and Org.Cryst.,15, 269 (1971) .
46. J.H.Perlstein, M.J.Minot, and V.Walatka, MaterialsResearch Bull., 1,44(1972).
47. J.Ferraris, D.O.Cowan, V.Waiatka, and J.H.Perlstein,J.Arn.Chem.Soc., '95, 943(1973).
48. T.J.Kistenmacher, T.E.Phillips, and D.O.Cowan, ActaCryst., B30, 763(1974).
49. D.L.Coffen, J.Q.Chambers, D.R.Williams, P.E.Garrett,and N.D.Canfield, J.Am.Chem.Soc., 21, 2258(1971).
50. L.B.Coleman, M.J.Cohen, D.J.Sandman, F.G.Yamagishi,A.F.Garito, and A.J.Heeger, Solid State Comm., 12,1125(1973).
51. Y.Tomkiewicz, B.A.Scott, L.J.Tao, and R.S.Title,Phys.Rev.Lett., 32, 1363(1974).
52. A.N.Bloch, J.P.Ferraris, D.O.Cowan, and T.O.Poehler,Solid State Comm. ,13, 753(1973).
53. D.E.Shafer, G.A.Thomas, F.Wudl, J.P.Ferraris, andD.O.Cowan, Solid State Comm. ,14, 347 (1974).
54. R.E.Peierls, "Quantum Theory of Solids", OxfordUniversity Press, London, 1955.
55 A.N.Bloch, D.O.Cowan, K.Bechgaard, R.E.Pyle, R.H.Banks,and T.O.Poehler, Phys.Rev.Lett.,34, 1561(1975).
56. G.J.Ashwell, D.D.Eley, and M.R.Willis, Nature, 259,201(1976).
57. S.Etemad, T.Penney, E.M.Engler, B.A.Scott, and P.E.Seiden, Phys.Rev.Lett., 34, 741 (1975) .
58. G.Keryer, J.Amiell, S.Flandrois, P.Delhaes, E.Toreilles,J .M.Fabre, and L.Giral, Solid State Comm., 26, 541(1978). -
59. R.E.Pyle, A.N.BlocD, D.O.Cowan, K.Bechgaard, T.O.Poehler,T.J.Kistenmacher, V.Wa1atka, R.Banks , W.Krug, and T.E.Phillips, Bu11.Arn.Phys.Soc., 20, 415(1975).

60. L.I.Buravov, O.N.Eremenko, R.B.Lyubovskii,L.P.Rozenberg, M.L .Khidekel, R.P.Shibaeva, I.F. Shchegolev,and E.B.Yagubskii, J.E.T.P. Letters, 20, 208(1974).
61. L.C. Isett and E.A.Perez-A1buerne, Solid StateComm ., 21,433(1977).
62. V.F.Karninskii, M.L.Khidske1, R.B.Ljubovskii,I.F.Shchegolev, R.P.Shibaeva, E.B.Yagubskii, A.V.Zvarykina, and G.L.Zvereva, Phys.Stat.So1.A, 44(1),77 (1977) .
63. G.Milha1y, A.Janossy, and G.Gruner, Solid State Comm.,22,771(1977).
64. R.B.Sornoano, S.P.S.Yen, V.Hadek, S.K.Khanna, M.Novotny,T.Datta, A.M.Herrnann, and J.A.Woo11arn, Phys.Rev.,17B, 2853(1978).
65. L.V.lnterrante, K.W.Browa11, H.R.Hart,Jr., I.S.Jacobs,G.D.Watkins, and S.H.Wee, J.Arn.Chern.Soc., 97, 889(1975). --
66. K.W.Browal1 and L.V.lnterrante, J.Coord.Chern.,l, 27(1973) .
67. P.A.Berger, D.J.Dahm, G.R.Johnson, M.G.Miles, andJ.D.Wi1son, Phys.Rev.,12B, 4085(1975).
68. I.Maki, Y.Matsunaga, M.Nakakura, and A.Nonaka, Bull.Chern.Soc.Japan, 48, 1368 (1975) .
69. Y.Matsunaga and Y.Narita, Bu11.Chern.Soc.Japan., 45,408(1972).
70. D.Gordon and M.J.Hove, J.Chern.Phys., 59, 3419(1973).
71. H.R.Ze11er, "Low Dimensional Cooperative Phenomena",ed.H.J.Ke11er,New York:P1enum, 215(1975).
72. F.B.Burt, J.Chem.Soc., 1171(1910).
73. R.L.Greene, G.B.Street, and L.J.Suter, Phys.Rev.Lett.,34, 577(1975).
74. E.Zavoisky, J.Phys., U.S.S.R., 2.,211(1945).
75. B.M.Kozyrev and S.G.Salikhov, Doklady Akad.Nauk S.S.S.R.,58, 1023(1947).
76. L.S.Singer and J.Kommandeur, Bu11.Arn.Phys.Soc.,!,421(1959).
77. P.L.Nordior Z.G.Soos, and H.M.McConnell, Ann.Rev.Phys.Chem., l7, 237(1966}.
78. H.Goldstein, "Classical Mechanics", Addison-Wesley,Reading, Mass., 1957.
79. P.Pascal, Compt.Rend.,·"147,56, 242, 742(1908);148, 143 (1909);150, ·1167(1910);152, 862, 1010(1911);Ann.de.Chim.et.Phys.,19, 5(1910);"25, 289(1912); 28,218(1913).
80. S.S.Bhatnagar and K.N.Mathur, "Physical Principle andApplications of Magnetochemistry", Macmillan and Co.,London, 1935.
81. C.Kitte1, "Introduction to Solid State Physics",John Wiley and Sons, New York, 4th ed., 1971.
82. W.Pau1i, Z.Physik.,41, 81(1927).83. L.Landau, Z.Physik, ~, 629(1930}.84. A.H.Wi1son, "The Theory of Metals", Cambridge
University Press, New York, 2nd ed., 1953.85. P.Weiss, J.Phys., §_, 667(1907).86. N.Bohr, Phi1.Mag., 26, 1, 476, 857(1913).87. G.E.Uh1enbeck and S.Goudsmit, Nature, 117, 264(1926).88. W.Pau1i, Z.Physik,43, 601(1927).89. C.G.Darwin, Proc.Roy.Soc.A,116, 227(1927).90. P.A.M.Dirac, Proc.Roy.Soc.A,117, 610(1928).91. O.Stern, Z.Physik, 1,249(1921).
92. W.Ger1ach and O.Stern, Ann.Phys.Leipzig, 74, 673(1924).93. P.B.Ayscough, "Electron Spin Resonance in Chemistry",
Methuen and Co.Ltd., London, 1967.94. N.Atherton, "Electron Spin Resonance", John Wiley
and Sons, New York, 1973.95. F.B1och, Phys.Rev., 70, 460(1946).96. A.M.Portis, Phys.Rev.,91, 1071(1953).97. G.E.Pake,"Paramagnetie Resonance", W.A.Benjamin,Inc.,
New York, 1963.

98. A.Abragam and M.H.L. Pryce, Proc .Roy.Soc .A.,205,135 (1951) • -
99. W.Slough, Trans.Farad.Soc.,61, 408(1965).
100. P .Delhaes,F .Aly, and P.Dupuis, Sol. Stat.Comm., 12,1099(1973).
101. R.S.Mulliken, J.Arn.Chem.Soc., 74,811(1952).
102. D.B.Chestnut, H.Foster, and W.D.Phi11ips, J.Chem.Phys., 34, 684(1961).
103. H.M.McConnell and R.M.Lynden-Bel1, J.Chem.Phys.,~, 2393(1962).
104. R.M.Lynden-Be11 and H.M.McConnel1, J.Chem.Phys.,37, 794 (1962).
105. R.M.Lynden-Bell, Mol.Phys., ~, 71(1964).
106. D.B.Chestnut, J.Chem.Phys., 40, 405(1964).
107. Z.G.Soos, J.Ch[em.Phys.,43, 1121(1965); 44,1729(1966);46, 4284(1967); Ann.Rev.Phys.Chem., 25, 121(1974).
108. Z.G.Soos and H.M.McConne11, J.Chem.Phys., 43, 3780(1965) •
109. Z.G.Soos. and R.C.Hughes, J.Chem.Phys.,46, 253(1967).
110. Z.G.Soos and D.J.Klein, J.Chem.Phys., 55, 3284(1971).
Ill. J.Des C10izeaux and J.J.Pearson, Phys.Rev., 128,2131(1962).
112. J.C.Bonner and M.E.Fisher, Phys.Rev.,135A, 640(1964).
113. L.N.Bulaevskii, J .E.T.P. ,16, 685 (1963); 17, 684 (1963);Sov.Phys.Sol.Stat.,ll, 9211I969). -
114. W.Duffy and K.P.Barr, Phys.Rev., 165, 647(1968).
115. J.G.Vegter, Ph.D. Thesis, University of Groningen,1972.
116. T.Hibma, Ph.D. Thesis, University of Groningen, 1974.
117. R.S.Knox, "Theory of EKcitons", Solid State Physics,Supplement 5, Academic Press, New York, 1.963.
118. S.Etemad, Ph.D. Thesis, University of Pennsylvania,1972.

119. J.H.Van der Waals and M.S.de Groot, Mol.Phys.,~,333(1959).
120. J.C.Bailey and D.B.Chestnut, J.Chem.Phys., 51, 5118(1969).
121. T.Hibma, P.Dupuis, and J.Kornmandeur,Chem.Phys.Lett.,15, 17(1972).
122. M.T.Jones and D.B.Chestnut, J.Chem.Phys., 38, 1311(1963).
123. D.D.Thomas, H.Keller, and H.M.McConnell, J.Chem.Phys.,39, 2321(1963).
124. G.J.Ashwell, Ph.D.Thesis, University of Nottingham,1973.
125. G.D.Welch, Ph.D. Thesis, University of Nottingham,1976.
126. N.J.Drew, Ph.D.Thesis, University of Nottingham,1978.
127. J.Woodward, Ph.D.Thesis, University of Nottingham,1976.
128. P.L.Hall, J.Phys.,5D, 673(1972).129. M.L.Randolph, Rev.Sci.lnstr., 31, 949(1960).130. B.Venkataraman, B.G.Segal, and G.K.Frenkel, J.Chem.
Phys., 30, 1006(1959).131. W.Duffy and D.L.Strandburg, J.Chem.Phys., 46, 456
(1967).132. J.A.Lyons and W.E.Watson, J.Poly.Sci., 18, 141(1955).133. S.A.Al'tschuler and B.M.Kozyrev, "Electron
Paramagnetic Resonance", Academic Press, New York,1964.
134. J.R.Singer, "Paramagnetic Resonance", Vo1.2, Proc.ofthe 1st Int.Conf., Academic Press, New York, 1963.
135. A.Van Itterbeek and M.Labro, Physica, 30, 157(1964).136. R.H.Poirer, E.J.Kahler, and F.Benington, J.Org.Chem.,
17, 1437 (1952).137. R.S.Alger, "Electron Paramagnetic Resonance", John
Wiley and Sons, New York, 1968.
138. J.E.Wertz, Chem.Rev., "55,829(1955).139. P.C.Taylor, J.F.Baugher, and H.M.Kriz, Chem.Rev.,
75, 203 (1975).140. J.H.Van der Waals and M.S.de Groot, Mol.Phys., 1,
190 (1960).141. W.A.Yager, E.Wasserman, and R.M.R.Cramer, J.Chem.Phys.,
37,1148(1962).I,142. R.C.Hughes and Z.G.Soos, J.Chem.Phys., 48, 1066(1968).:!
143. H.lnokuchi, K.lkeda, and H.Akamatu, Bull.Chem.Soc.Jap ., 33, 1622(1960).
144. M.E.Browne, A.Ottenberg, and R.L.Brandon, J.Chem.Phys.,41, 3265(1965).
145. G.J.Ashwell, D.D.Eley, S.C.Wallwork, and M.R.Willis,Proc.Roy.Soc.Lond.A.,343, 461(1975).
146. F.K.KneubUhl, J.Chem.Phys., 33, 1074(1960).147. J.W.Searl, R.C.Smith, and S.J.Wyard, Proc.Phys.Soc.A,
2!,491.(1959).148. J.W.H.Schreurs, G.E.Blomgren, and G.K.Frenkel,
J.Chem.Phys.,32, 1861(1960).149. D.Bell, private communication.150. T.Sundareson and S.C.Wal1work, Acta Cryst., B28,
2474(1972).151. Y.Suzuki and Y.lida, Bull.Chem.Soc.Jap., 46, 2056
(1973).152. L.Shields, J.Chem.Soc., Farad.Trans.II, 70, 1372
(1974)•153. A.W.Hornig and J.S.Hyde, Mol.Phys., &' 33(1963).154. B.M.Hoffman and R.C.Hughes, J.Chem.Phys.,·52, 4011
(1970)•155. S.Flandrois and D.Chasseau, Acta Cryst., B33, 2744
(1977)•156. A.J.Silverstein and Z.G.Soos, Chem.Phys.L~tt.,~,
525(1976).157. S.Flandrois, J.Amiell, F.Carmona, and P.Delhaes,
Solid State Comm.,17, 287(1975).

158. T.Hibma.and J.Kommandeur, Phys.Rev.B,12, 2608(1975).159. M.T.Jones, J.Chem.Phys., 40, 1837(1964).160. P.W.Anderson, J.Phys.Soc.Jap., 2" 316(1954).161. D.D.Thomas, A.W.Merkl, A.F.Hildebrandt, and
H.M.McConnel1, J.Chem.Phys.,40, 2588(1964).162. T.D.Buckman, O.H.Griffith, and H.M.McConnell, J.Chem.
Phys., 43, 2907(1965).163. I.M.Brown and M.T.Jones, J.Chem.Phys., 51, 4687(1969).164. G.J.Gorter and J.H.Van Vleck, Phys.Rev., 72, 1128~(l947).165. J.H.Van Vleck, Phys.Rev., 74, 1168(1948).166. N.Bloembergen and S.Wang, Phys.Rev., 93, 72 (1954).167. R.B.Griffiths, Phys.Rev., 124, 1023(1961).168. J.P.Goldsborough, M.Mandel, and G.E.Pake, Phys.Rev.
Lett., !, 13(1960).169. G.J.Ashwell, D.D.E1ey, M.R.Wil1is, and J.Woodward,
Phys.Stat.So1idi (b), 79, 629(1977).170. G.J.Ashwe11, D.D.Eley, N.J.Drew, S.C.Wallwork, and
M.R.Wil1is, Acta Cryst.,B33, 2598(1977).171. S.Takagi and K.Kawabe, Solid State Comm., 18, 1467
(1976)•172. S.Takagi, S.Izumida, and K.Kawabe, Phys.Lett., 57A,
189(1976).173. E.Ehrenfreund, S.K.Khanna, A.F.Garito, and A.J.Heeger,
Solid State Comm., 22, 139(1977).174. Y.Tomkiewicz, A.R.Taranko, and J.B.Torrance, Phys.
Rev., 15B, 1017(1977).175. S.Takagi, S.Izumida, and K.Kawabe, Phys.Lett.,63A,
161(1977).176. D.D.Eley, G.A.Owens, W.Waclawek, S.C.Wal1work, and
M.R.Willis, Proc.Roy.Soc.Lond.(to be published).177. A.W.Merkl, R.C.Hughes, L.J.Berliner, and H.M.McConnell,
J.Chem.Phys.,43, 953(1965). .178. R.C.Hughes, A.W.Merkl, and H.M.McConnell, J.Chem.Phys.,
44, 1720(1966)•

179. D.Bates, private communication.
180. N.F.Mott and E.A.Davis,"Electronic Processes inNon-Crystalline Materials", Clarendon Press, Oxford,1971.
181. E.A.Davis, Endeavour, 30, 55(1971).
182. K.Holczer, G.Milhaly, A.Janossy, and G.Gruner, Mol.Cryst.Liq.Cryst., 32, 199(1976).
183. D.Kuse and H.R.Keller, Phys.Rev.Lett., 27,1060(1971).
184. E.Ehrenfreund, S.Eternad, L.B.Coleman, E.F.Rybaczewski,A.F.Garito, and A.J.Heeger, Phys.Rev.Lett., 29, 269(1972) .
185. S.Etemad, A.F.Garito, and A.J.Heeger, Phys.Lett.,40A, 45 (1972) .
186. Y.Tomkiewicz, E.M.Engler, and T.D.Schultz, Phys.Rev.Lett. ,35, 456 (1975).
187. J.P.Faucher and H.Robert, C.R.Acad.Sci.Paris, Ser.B,270, 174(1970).
188. A.W.Hanson, Acta Cryst.ij,19, 610(1965); .£i, 768 (1968).
189. A.Kriesler and G.Alquie, J.Mag.Res., 16, 377(1974).
190. G.J.Ashwell, D.D.Eley, S.C.Wallwork, and M.R.Willis,Proc.Roy.Soc.Lond.A,343, 461(1975).
191. R.Somoano, V.Hadek, S.P.S.Yen, A.Rembaum, and R.Deck,J.Chem.Phys., 62, 106l(1975).

APPENDIX 1
Graphs showing the triplet exciton bandparameters as a function of thealternation parameter.

T
1.0 IJ
1.00.80.6
0.40.5
0.3
0.2<-.._,cO 0.1
0.0 -t---,--r----r-_-.,.-.,.-r----r-..---f
0.50.0 l.0
y
<- 1.0......<I 0.8
0.5 0.60.40.30.20.1
O.O~-.--.--r--r-~·-,~~~--~~0.0' 0.5 1.0
y
Figures A.I.l and A.l.2
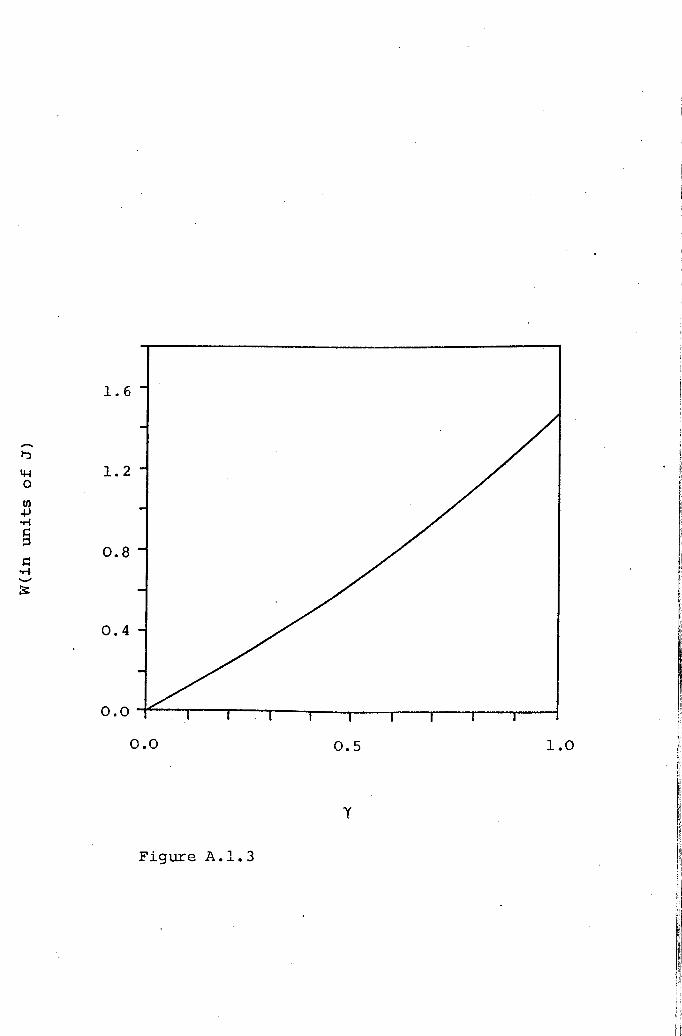
I")
4-1 1.20
til.jJ.r-!s::::ls:: 0.8.r-!.._,~
0.4
0.0 0.5 1.0
y
Figure A.l.3
APPENDIX 2
Conductivity results for the polycrystalline
TCNQ complex salts DPPE(TCNQ)S' DBPE(TCNQ)S'and DHPE(TCNQ)S.

The d.c. conductivities of most of the TCNQ
complex salts, the magnetic properties of which are
presented in this thesis, were measured by various members
of the semiconductor group in this department. However,
the electrical properties of DPPE(TCNQ)S' DBPE(TCNQ)S and
DHPE(TCNQ)S have not been previously investigated.
Therefore, as such information is of value in the
interpretation of the magnetic properties, the conductivities
of these compounds were measured as part of this work.
Polycrystalline samples were compressed for two
minutes at 7SMPa in an evacuated die. The resulting disc
was prepared for the experiment by attaching copper wires
to either side of the disc using Acheson high-conductivity
silver paint as electrodes. The compactions were then
placed in a conductivity cell and degassed at 330K for
sixteen hours under vacuum. Conductivity measurements were
then made using standard potentiometer circuits, and helium
as a heat transfer gas, for temperatures ranging from 330K
to lSOK.
Typical results obtained are presented in
Figures A.2.1 to A.2.3 and, from the average slopes of a
number of such graphs, the activation energies for
conduction were found to be 10.6, lS.4, and S.8 kJ mol-l
for DPPE(TCNQ)S' DBPE(TCNQ)S' and DHPE(TCNQ)~ respectively.
The conductivity values at 300K were also obtained and

-2 -1 -1found to be 0.3, 3.6 x 10 ,and 0.2 ohm em for DPPE(TCNQ)S' DBPE(TCNQ)S' and DHPE(TCNQ)S.
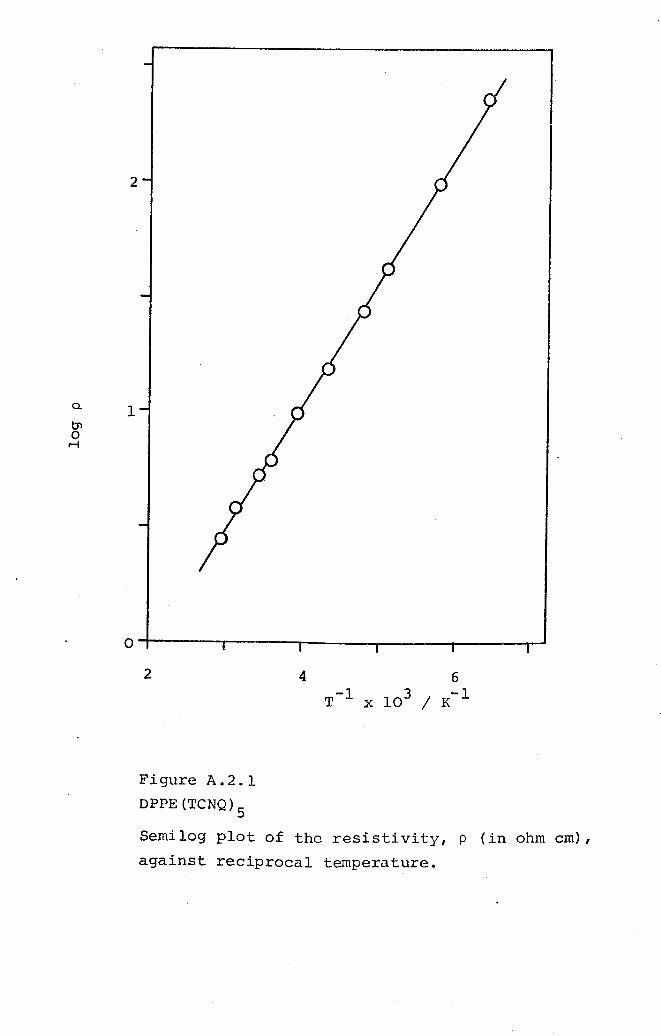
b"lo,.....,
a.
2
Figure A.2.lDPPE(TCNQ)S
Semilog plot of the resistivity, p (in ohm em),against reciprocal temperature.

tnorl
4
2
o 4-------~----~~----~------~------~2 4
Figure A.2.2
DBPE(TCNQ)S
Semilog plot of the resistivity, p (in ohm cm),against reciprocal temperature.
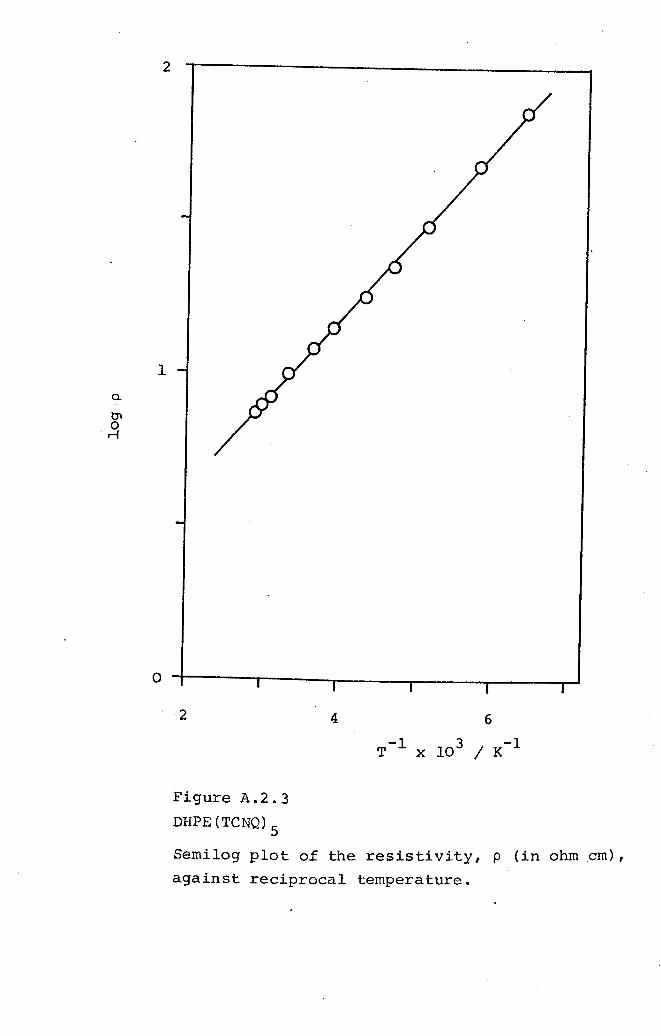
a.
2
1
o
2 4.
Figure A.2.3DHPE(TCNQ)S
Semilog plot of the resistivity, p (in ohm .cm),against reciprocal temperature.