overviewof governmentperformancemanagementsysteminindia
TRANSCRIPT

OVERVIEW OF
GOVERNMENT PERFORMANCE MANAGEMENT SYSTEM IN INDIA
Former Secretary to Government of India
Performance Management Division
Cabinet Secretariat
Government of India1
Senior Fellow (Governance)
Bharti Institute of Public Policy
Adjunct Professor of Public Policy
Indian School of Business
Professor Prajapati Trivedi

Performance Monitoring & Evaluation System
2

Results-Framework DocumentAn Instrument for Improving Government Performance
3

Presentation Outline
1. What do we do?
2. What is new about it?
3. Why do we do it this way?
4. International Experience
5. Impact of what we do?
4

Select Key Points
1. Countries in the world can be classified according
to their ability to implement policies and programs
2. Implementation depends on effective follow-up
(M&E) (another name for accountability and
Results-Based Management)
3. Effectiveness of follow-up and monitoring depends
on quality and not quantity of M&E (Effective
evaluation requires explicit rankings).
4. Degree of Accountability for results is synonymous
with Evaluation.5

Select Key Points
5. Evaluation techniques for management control in
government are different from evaluation
techniques for strategic control.
6. Evaluation is one of the three systems required for
performance improvement – Information and
incentive systems being other two.
7. Accountability for results trickles down
8. Performance Evaluation is different from
Performance Explanation and Performance
Monitoring. 6

Economic Development
Implementation of Policies
Effective Follow-up (M & E)
Results-Framework Document (RFD)
The Essence…
7

M & E
Monitoring Evaluation
Budget Performance
BudgetOutcome
BudgetRFD
1 Financial
Inputs1 Financial
Inputs
2 Activities
3 Outputs
1 Financial
Inputs
2 Activities
3 Outputs
4 Outcomes
1 Financial
Inputs
2 Activities
3 Outputs
4 Outcomes
5 Non-financial
Outcomes8

9

Success Indicator BudgetPerformance
Budget
Outcome
BudgetRFD
1How closely is it related to Organizational
Objectives
2 Are the objectives prioritized? No No No Yes
3 Are the success indicators prioritized? No No No Yes
4 Are the deviations agreed ex-ante? No No No Yes
5What percentage of success indicators are
outcome-oriented?
6 How high does the accountability rest for results?
7 How well aligned are the targets with budget?
8Is there an independent scrutiny of targets as well
as achievements?No No No Yes
9Is there a built in mechanism for medium term
expenditure and results perspective?
10 Is it linked to incentives? No No No Yes
11 Does it have political support?
12 Does the system produce a composite index? No No No Yes
Meta Evaluation:
Evaluating Evaluation Systems
10

www.performance.gov.in
11

12

Presentation Outline
1. What do we do?
2. What is new about it?
3. Why do we do it this way?
4. International Experience
5. Impact of what we do?
13

Kerala
Population: 35 Million
14
15

16

Karnataka
Population: 62 Million
17

18

19

20

Results-Framework DocumentAn Instrument for Improving Government Performance
1. What is RFD?
2. How does RFD work? (The Process)
3. Origins of RFD Policy
4. What has been the progress in implementation?
21

1. What is RFD? (The Content of RFD)
1. What are department’s main
objectives for the year?
2. What actions are proposed to
achieve these objectives?
3. How to determine progress made in
implementing these actions?
seeks to address three basic questions:
22

Format of Result-Framework Document (RFD)
Section 1 Ministry’s Vision, Mission, Objectives and Functions.
Section 2 Inter se priorities among key objectives, success
indicators and targets.
Section 3 Trend values of the success indicators.
Section 4 Description and definition of success indicators and
proposed measurement methodology.
Section 5 Specific performance requirements from other
departments that are critical for delivering agreed
results.
Section 6 Outcome / Impact of activities of department/ ministry
23

Criteria /
Success IndicatorsWeight
Target / Criteria Values
ExcellentVery
GoodGood Fair Poor
100% 90% 80% 70% 60%
1
% Increase in number
of primary health care
centers
.50 30 25 20 10 5
2
% Increase in number
of people with access to
a primary health center
within 20 KMs
.30 20 18 16 14 12
3
Number of hospitals
with ISO 9000
certification by
December 31, 2009
.20 500 450 400 300 250
Section 2 of Results-Framework Document
24

Section 3:Trend Value of Success Indicators
Objective ActionsSuccess
IndicatorUnit
Actual
Value
for
FY 12/13
Actual
Value
for
FY 13/14
Target
Value
for
FY 14/15
Projected
Value
for
FY 15/16
Projected
Value
for
FY 16/17
Objective 1
Action 1 No. of Schools No. 500 650 800 1000 1400
Action 2
Action 3
Objective 2
Action 1
Action 2
Action 3
Objective 3
Action 1
Action 2
5-year Trend
25

Criteria /
Success IndicatorsWeight
Target / Criteria Values
AchievementRaw
Score
Weighted
Raw ScoreExcellent
Very
GoodGood Fair Poor
100% 90% 80% 70% 60%
1% Increase in number of
primary health care centers.50 30 25 20 10 5 15 75% 37.5%
2
% Increase in number of
people with access to a
primary health center
within 20 KMs
.30 20 18 16 14 12 18 90% 27%
3
Number of hospitals with
ISO 9000 certification by
December 31, 2009.20 500 450 400 300 250 600 100% 20%
Composite Score 84.5%
Calculation of Composite ScoreStep 1 Step 2 Step 3 Step 4
26

Prepare
RFD
Beginning
of Year
April 1
Monitor
Progress
During
the Year
October 1
Evaluate
Performance
End
of Year
June 1
1 2 3
How does RFD work? (The Process)
27

Departments send RFD to
Cabinet Secretariat
RFDs reviewed by
PMD and ATF
Departments incorporate
PMD / ATF suggestions
RFDs approved by HPC on
Government Performance
Departments place RFDs
on Departmental WebsitesMinister approves RFD
How does RFD work? (The Process)
28

10th Report of
Second Administrative Reforms Commission
“Performance agreement is the most
common accountability mechanism in
most countries that have reformed their
public administration systems.”
Origins of PMD
6th Central Pay Commission
“Introduce Performance Related Incentive
Scheme (PRIS)
2008
2008
29

June
2009
September
2009
Prime Minister issued an order to
implement “Performance
Monitoring and Evaluation
System (PMES)”
President announced that the
Government will within 100 days:
Establish mechanisms for
performance monitoring and
performance evaluation in
government on a regular basis
Origins and Coverage of RFD Policy
30
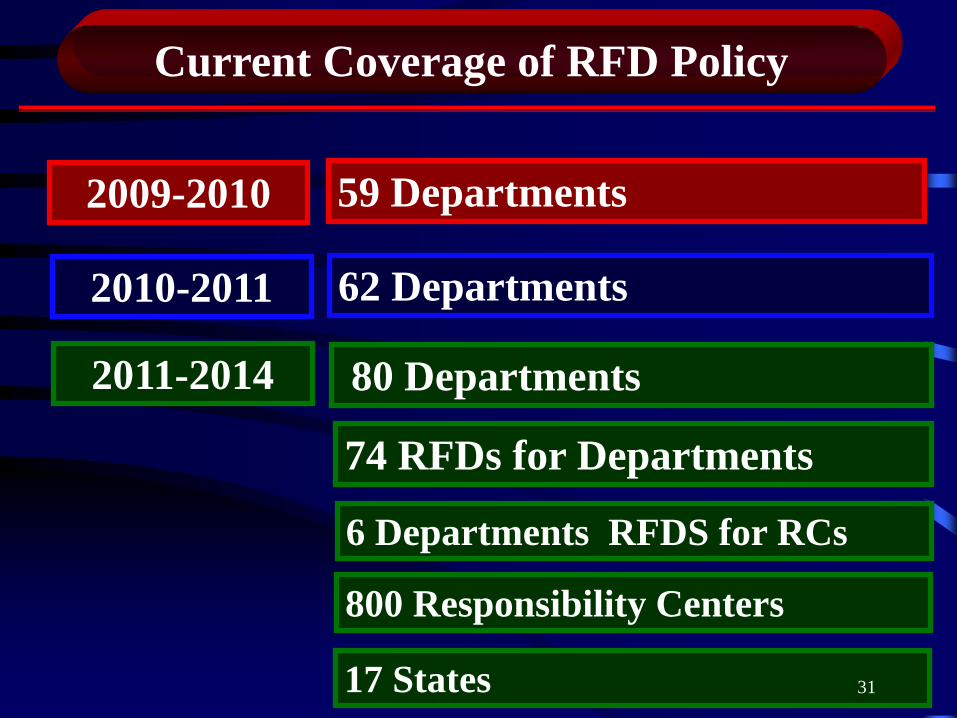
2009-2010 59 Departments
2010-2011 62 Departments
Current Coverage of RFD Policy
2011-2014 80 Departments
74 RFDs for Departments
6 Departments RFDS for RCs
800 Responsibility Centers
17 States 31

Implementation at State-Level
1. Maharashtra
2. Punjab
3. Karnataka
4. Kerala
5. Himachal Pradesh
6. Assam
7. Haryana
8. Chhattisgarh
9. Tripura
10.Rajasthan
11.Andhra Pradesh
12.Mizoram
13.Jammu & Kashmir
14.Meghalaya
15.Odisha
16.UP (request)
17. Puducherry (request)
Already Begun Implementation
32
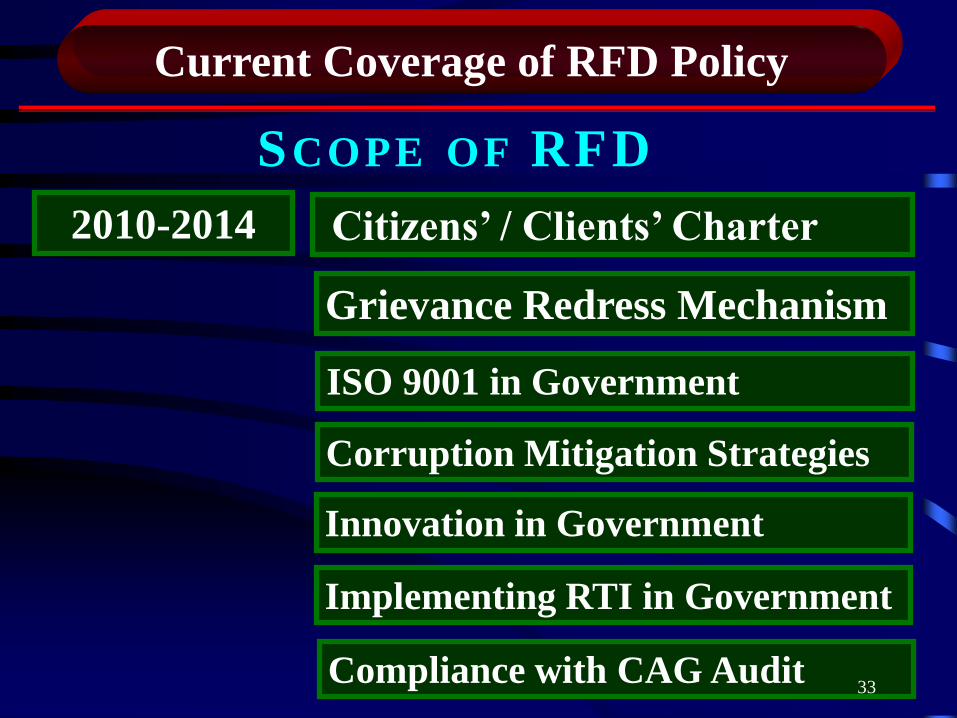
2010-2014 Citizens’ / Clients’ Charter
Grievance Redress Mechanism
ISO 9001 in Government
Corruption Mitigation Strategies
Innovation in Government
Current Coverage of RFD Policy
SCOPE OF RFD
Implementing RTI in Government
Compliance with CAG Audit33

Presentation Outline
What do we do?
2. What is new about it?
3. Why do we do it this way?
4. International Experience
5. Impact of what we do
34

M & E
Monitoring Evaluation
Budget Performance
BudgetOutcome
BudgetRFD
1 Financial
Inputs1 Financial
Inputs
2 Activities
3 Outputs
1 Financial
Inputs
2 Activities
3 Outputs
4 Outcomes
1 Financial
Inputs
2 Activities
3 Outputs
4 Outcomes
5 Non-financial
Outcomes35

36

Success Indicator BudgetPerformance
Budget
Outcome
BudgetRFD
1How closely is it related to Organizational
Objectives
2 Are the objectives prioritized? No No No Yes
3 Are the success indicators prioritized? No No No Yes
4 Are the deviations agreed ex-ante? No No No Yes
5What percentage of success indicators are
outcome-oriented?
6 How high does the accountability rest for results?
7 How well aligned are the targets with budget?
8Is there an independent scrutiny of targets as well
as achievements?No No No Yes
9Is there a built in mechanism for medium term
expenditure and results perspective?
10 Is it linked to incentives? No No No Yes
11 Does it have political support?
12 Does the system produce a composite index? No No No Yes
Meta Evaluation:
Evaluating Evaluation Systems
37

Presentation Outline
What do we do?
What is new about it?
3. Why do we do it this way?
4. International Experience
5. Impact of what we do
38

3. Why do we do it this way?
3.3 Overall Approach
3.1 Diagnosis
3.2 Prescription
3.4 International Experience
39

Problems of Government Agencies - I
ADMINISTRATIVE MINISTRY EQUITY EFFICIENCY
MULTIPLE
PRINCIPALS
MULTIPLE
GOALS
FUZZY GOALS &
OBJECTIVES
PLANNING MINISTRY
FINANCE MINISTRY
PARLIAMENT
POLITICAL NON-POLITICAL
40

Problem of Government Agencies -II
“NOT ME”Syndrome
People
Public Enterprise
Government
Parliament
41

3. Why do we do it this way?
3.3 Overall Approach
3.1 Diagnosis
3.2 Prescription
3.4 International Experience
42

43

New Public Management
The Path
44

Malaysia in
1970`
New Zealand
France
United Kingdom
Canada, Australia
Sweden, Netherlands
United States Denmark
Finland
Administrator
Manager
Bureaucracy
Market-type Mechanisms
Malaysia in
2005
New Public Management:
International Comparison
45

One Principle of NPM
Accountability for Results
Trickles Down
46

Accountability
47

Principle # 1
Systems Matter Most
48

80 %
20 %
Determinants of Performance
49

Leader
R
E
S
T
People
80 % 20 %
Determinants of Performance50

Reduce Quantity of
GovernmentIncrease Quality of
Government
What can be done to solve the problem?
Government Agencies have not delivered
what was expected from them
Trickle-down
Approach
Direct
ApproachPrivatization Traditional
Civil Service Reforms51

3. Why do we do it this way?
3.3 Overall Approach
3.1 Diagnosis
3.2 Prescription
3.4 International Experience
52

Story of 3 Three-legged Stools
Elements of
Government Performance Management1
Elements of
Performance Improvement2
Determinants of
Performance Perception3
53

Government Performance
Management
Elements of
Government Performance Management
Stool # 1
54

Performance
Improvement
Elements of
Performance Improvement
Stool # 2
56

Elements of
Performance Improvement
Stool # 2
57

Performance
Perception
Determinants of
Performance Perception
Stool # 3
58

Perception = Achieving Targets
+ Quality of Interface
+ Communication
What explains the Perception Gap?
Citizen’s /
Clients
Charter
Grievance
Redress
Mechanism59

2
Citizen’s/
Client’s
Charter
3
Grievance
Redress
Mechanism
Perception = 1 + 22
+ 33
1
Results
Determinants of Perception
Perception
60

Compendium of Citizens’ / Clients’ Charters (CCC):
61

62

63

64

65

66

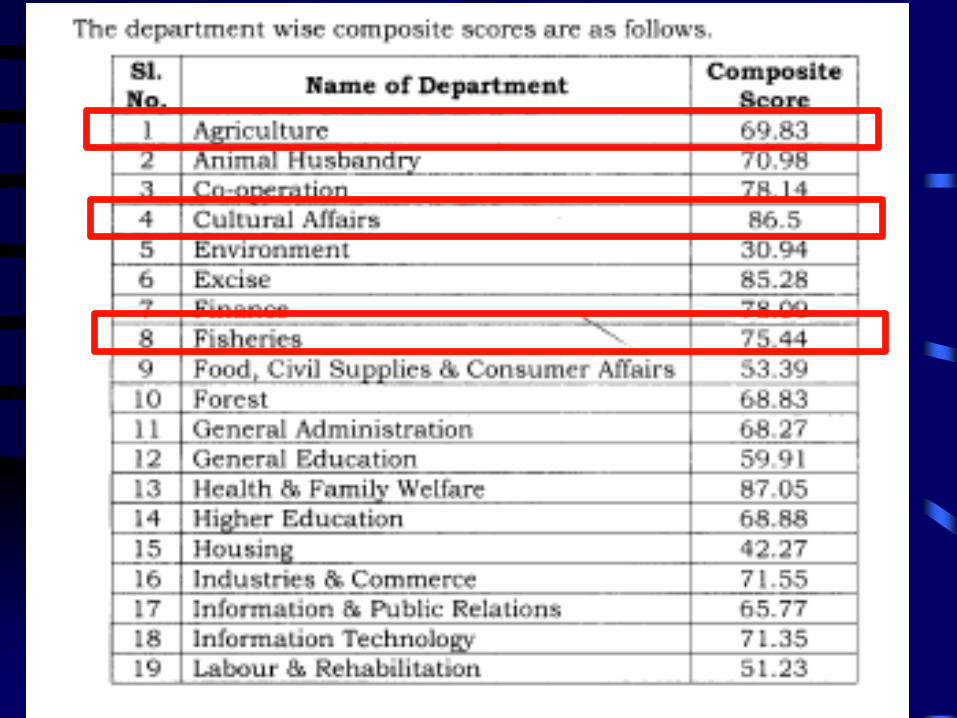
CCC Evaluation Results
67

68

69

70
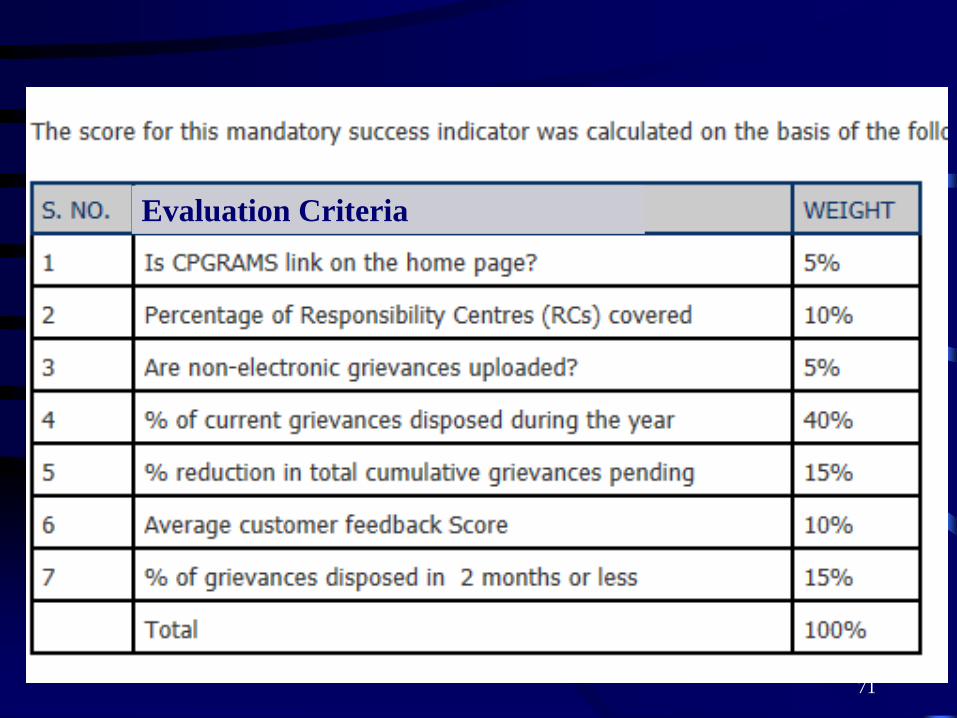
Evaluation Criteria
71

GRM
Evaluation
Results
72

GRM Evaluation Results
73

3. Why do we do it this way?
3.3 Overall Approach
3.1 Diagnosis
3.2 Prescription
3.4 International Experience
74

75

Sample
Performance
Agreement
From
New Zealand
76

77

Sample
Performance
Agreement
From
USAPerformance
Agreement
between
The President of USA
William Jefferson Clinton
and
The Secretary of Energy
Hazel O’Leary
78

79

80
81

82

83

84

85

A Message From The President's Management Agenda...
"Government should be results-oriented—guided not by process but guided by performance. There comes a time when every program must be judged either a success or a failure. Where we find success, we should repeat it, share it, and make it the standard. And where we find failure, we must call it by its name." - President George W. Bush
86

87

88

89

90

Sample
Performance
Agreement
From
Malaysia
91

Sample
Performance
Agreement
92

Sample
Performance
Agreement
93

94

95
96

97

98

99

Karnataka Kerala Himachal
Pradesh
100

Haryana
101

102

Presentation Outline
What do we do?
What is new about it?
Why do we do it this way?
International Experience
4. Impact of what we do
103

Impact of PMES / RFD
Caveats
1. System not fully implemented
– Coverage (all remaining departments should be covered)
– Results (results should be declared officially)
– Consequence (there should be explicit consequence)
2. Impact follows 2-3 years after full implementation
104
Quantitative Evidence
1. Impact on departments

Impact of RFDGrievance Redress in GOI
0
50000
100000
150000
200000
250000
2009 2010 2011 2012 2013
107961
139240
172520
201197
113896
53075
117612
147027
168308
113151
Receipts
Disposals
105

4216
533
0
500
1000
1500
2000
2500
3000
3500
4000
4500
2010 (June) 2014 (March)
Impact of RFDReduction in Pendency of CAG Paras in GOI
RFD
106
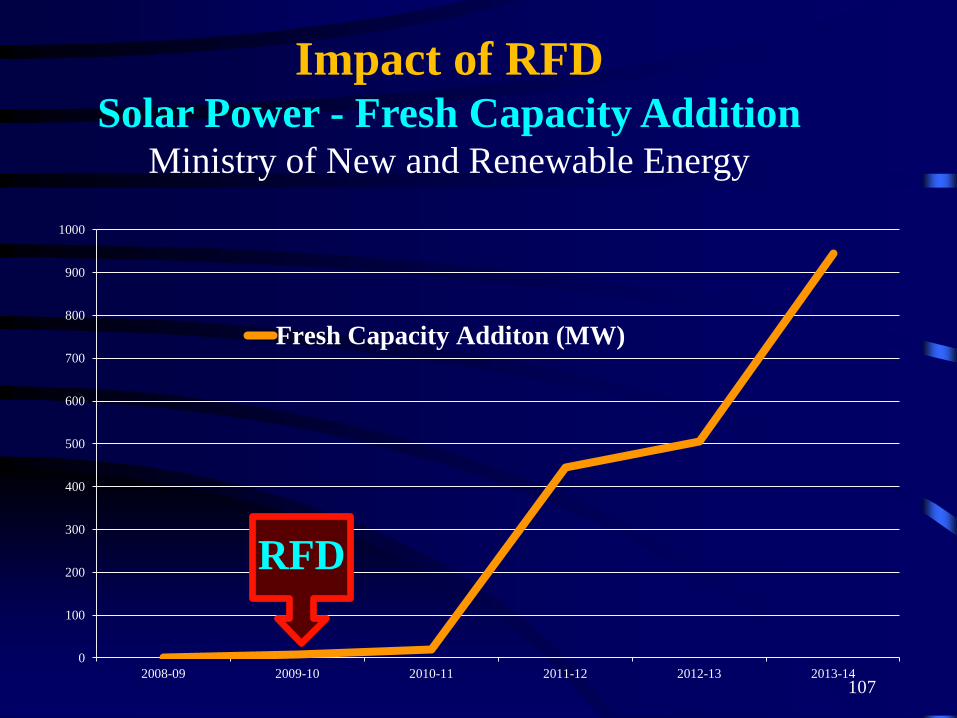
0
100
200
300
400
500
600
700
800
900
1000
2008-09 2009-10 2010-11 2011-12 2012-13 2013-14
Fresh Capacity Additon (MW)
RFD
Impact of RFDSolar Power - Fresh Capacity Addition
Ministry of New and Renewable Energy
107

108
0
2
4
6
8
10
12
14
16
18
Average 2005-08 Average 2009-14
Coverage of SC students for Post-matric scholarship

109
0
5
10
15
20
25
30
35
40
45
50
Average 2005-08
Average 2009-14
28.13
47.26
Coverage of SC students for Post-matric scholarship

0
1
2
3
4
5
6
7
8
2005-06 to 2009-10
(Pre - RFD period)
2009-10 to 2013-14
(Post - RFD period)
Impact of RFDRural Teledensity (Average Annual Growth Rate)
Department of Telecommunications
RFD
110

0
5000
10000
15000
20000
25000
Fresh Capacity Addition (MW)
Impact of RFDFresh Capacity Addition of Power
(Ministry of Power)
RFD
111

55.75
43.8
0
10
20
30
40
50
60
Average 2005-08 Average 2009-14
Impact of RFDReduction in Infant Mortality Rate (IMR) per 1000 live births
Health and Family Welfare
RFD
112
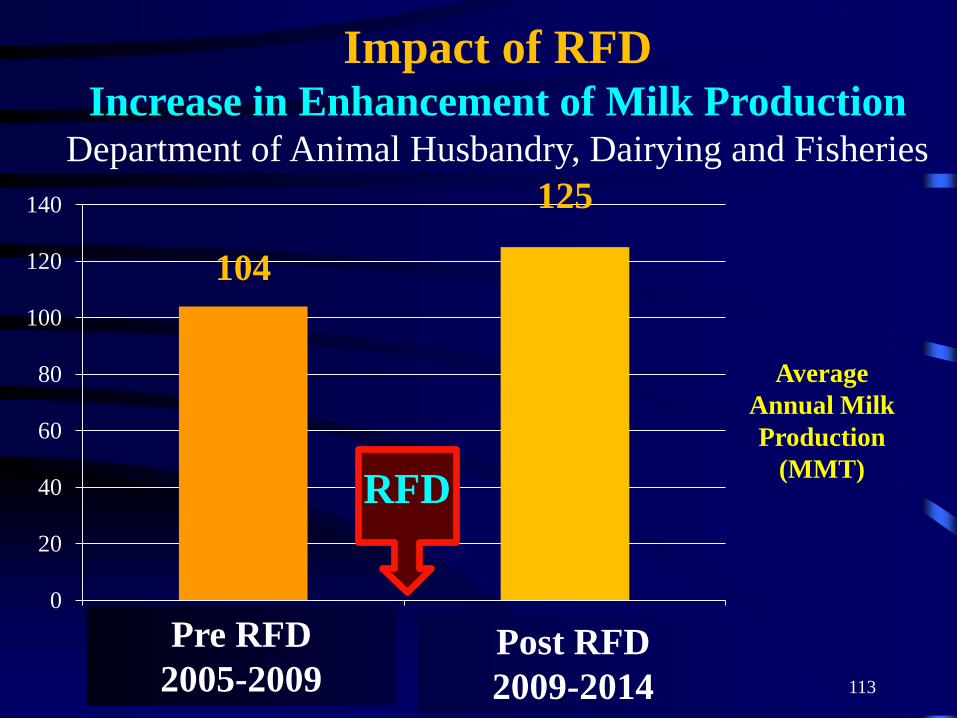
104
125
0
20
40
60
80
100
120
140
Pre RFD… Post RFD…
Impact of RFDIncrease in Enhancement of Milk Production
Department of Animal Husbandry, Dairying and Fisheries
Pre RFD
2005-2009Post RFD
2009-2014
Average
Annual Milk
Production
(MMT)RFD
113

Impact of PMES / RFD
Qualitative Evidence
1. Findings of Ph. D. thesis on RFDConclusion that RFD has made a huge impact through
a. Development of a template to assess the
performance of Ministries objectively
b. Facilitating objective performance appraisal of
civil servants
c. Inculcating performance orientation in the civil
servants by channelizing their efforts towards
meeting organizational objectives114

Impact of PMES / RFD
Qualitative Evidenced. Facilitating a critical review of the schemes, programs
and internal organisational processes
e. Facilitating the policy makers to re-evaluate and redefine
the Ministry’s ‘Vision, Mission and Objectives
2. New Initiatives Introduced
a. Complete liquidation of stocks procured up to 2012-13
b. Procurement in non-conventional states
c. Preparation of National Register for GOI Lands
115

Impact of PMES / RFD
Qualitative Evidence
3. Larger Outputs
Target for Housing for Bidi workers increased from 10 K to
25 K (150% increase)
4. More Efficient Service DeliveryTarget for settlement of EPF claims in 20 days 69 % to 90 %
5. Procedural ReformsIntroduced Award for best employer of Ex-Service Men
(ESM)
116

Impact of PMES / RFD
Qualitative Evidence
6. Better Decision Making
a. Timelines as Success Indicator have accelerated the
process of decision making, issue of sanctions and
release of funds, etc.
b. helped in development and adoption of better and
regular systems of monitoring and faster
introduction of IT based monitoring systems.
117

Impact of PMES / RFD
Qualitative Evidence
6. Better Decision Making
c. With a focus on RFDs for the Responsibility
Centres which are directly involved in
implementation of the schemes, the implementation
of the programmes and its monitoring has
improved.
d. RFDs clearly identify the shortcomings and critical
areas of concern in each Min/Dept.
118

Impact of PMES / RFD
Qualitative Evidence
6. Impact of MOUs
MOUs represent the counterpart of RFDs in public
enterprises. Given that they have had an overall
significant positive impact on the performance of
Central Public Sector Enterprises (CPSEs), it is
reasonable to expect RFDs to have a similar impact on
the performance of Government Departments.
Some data on CPSEs’ performance is presented next…119

120
0
20,000
40,000
60,000
80,000
1,00,000
1,20,000
1,40,000
1,60,000
1,80,000
9,06112,08415,13216,35218,26419,52019,951
22,44922,988
27,47230,878
39,00942,28946,934
56,15761,03762,753
81,86789,036
1,10,599
1,25,384
1,48,783
1,65,994
1,51,672
1,39,918
1,56,1241,62,4021,62,762
Series1
Contribution of CPSEs to Exchequer

Lessons Learned
• Audacity of size – Pilots remain pilots
• Must have a composite index for
performance
– There must be rankings for it to work
• Accountability must be assigned to a person
• Accountability trickles down
• Vertical and Horizontal alignment
necessary
• It must be wholly indigenous effort121

Vision
Long-Term
Strategy
Five-Year
Development
Plan
Results
Framework
Policies
Projects / Schemes
Objectives
Vision
Long-Term
Strategy
Five-Year
Development
Plan
Results
Framework
Policies
Projects / Schemes
Objectives
Vision
Long-Term
Strategy
Five-Year
Development
Plan
Results
Framework
Policies
Projects / Schemes
Objectives
Vision
Long-Term
Strategy
Five-Year
Development
Plan
Results
Framework
Policies
Projects / Schemes
Objectives
Vision
Long-Term
Strategy
Five-Year
Development
Plan
Results
Framework
Policies
Projects / Schemes
Objectives
122

Lessons Learned
• Large-scale intensive training important
• You need a champion
• Location of Champion Matters
• Collaborate with academic institutions &
other government departments
• Effective Communications is important
123

Why the Focus on Performance ?
• First general point
– The power of performance management is now
widely recognized.
124

Former Prime Minister Mahathir Mohamad in his speech at
Commonwealth Association for Public Administration and
Management (CAPAM) Conference said:
“The quality of an effective government administration
can not be lower than that of its clients–
specifically the private sector .”
(Malta, November 1, 1996)
Government
Effectiveness Risk125

A Taxonomy of
Performance Evaluation Approaches
Managerial
PerformanceAgency
Performance
Ex
-ante
Per
form
ance
Ex
-po
st
Per
form
ance
C
C
P
P
Performance
Management
Performance
Audits
Productivity
126

Performance Management
Productivity Effectiveness Accountability Incentives
127

• Financial Audit
presupposes existence of
Financial Statements
• Similarly Performance
Audit requires existence
of Performance
Statements
– Performance Management
• Indeed they are
Complementary
128

Financial Audit
1. A financial audit, or more accurately, an audit of
financial statements, is the verification of the
financial statements of a legal entity, with a view to
express an audit opinion.
2. The audit opinion is intended to provide reasonable
assurance that the financial statements are presented
fairly, in all material respects, and/or give a true and
fair view in accordance with the financial reporting
framework.
3. The purpose of an audit is to enhance the degree of
confidence of intended users in the financial
statements.
Performance AuditA Performance audit
Performance
Performance
Performance
Performance reporting
Performance
129

What are the key challenges?
130

What are the key challenges?
131

Selecting Success Indicators
132

Best Practice Methodology
133

134

135

136

137

138

139

140

141

142

143

144

145

146

Performance against
RFD Targets X Quality of RFD =TRUE PERFORMANCE OF
THE ORGANIZATION
100 %
(RFD Composite Score) X70 %
(Quality Rating
for RFD)= 70 %
147

148

149

Results Framework Management System
150

Thank You
151
Professor Prajapati Trivedi
Senior Fellow (Governance)
Bharti Institute of Public Policy
Adjunct Professor of Public Policy
Indian School of Business