overview · web viewin contrast, pressure ulcers result in relatively low additional costs per...
TRANSCRIPT
Australian Commission on Safety and Quality in Health
CareAnalysis of hospital-acquired
diagnoses and their effect on case complexity and resource use

Suggested citationHealth Policy Analysis 2013, Analysis of hospital-acquired diagnoses and their effect on case complexity and resource use – Final report, Australian Commission on Safety and Quality in Health Care, Sydney.
DisclaimerIn accordance with Health Policy Analysis’ policy, we are obliged to advise that neither Health Policy Analysis nor any employee nor sub-contractor undertakes responsibility in any way whatsoever to any person or organisation (other than the Australian Commission on Safety and Quality in Health Care) in respect of information set out in this report, including any errors or omissions therein, arising through negligence or otherwise however caused.
Health Policy Analysis Pty Ltd Suite 102, 30 Atchison Street, St Leonards 2065ABN: 54 105 830 920Phone: +61 2 8065 6491Fax: +61 2 8905 9151
Table of contents1. Overview.............................................................................................................................1
Data sources and concepts..................................................................................................4How well is COF reported by hospitals?...............................................................................4To what extent is the coding correct?..................................................................................5How should the codes be interpreted?.................................................................................5What are the limitations of the COF?...................................................................................6What is the impact on AR-DRG assignment if hospital-acquired diagnoses are excluded?............................................................................................................................6What additional costs and/ or length of stay are associated with hospital-acquired diagnoses?...........................................................................................................................7Implications for activity based funding (ABF).....................................................................10What is the potential for hospitals to use the COF for monitoring patient safety?.............12What steps can be taken to improve the capture and/ or interpretation of hospital-acquired diagnoses?..........................................................................................................12
2. Introduction.......................................................................................................................14
Project objectives..............................................................................................................14Structure of report.............................................................................................................14
3. Data sources and issues....................................................................................................16
The Condition Onset Flag (COF).........................................................................................16Data sets...........................................................................................................................18Limitations.........................................................................................................................19
4. Characteristics of hospital-acquired diagnoses and associated episodes..........................20
Episodes with hospital-acquired diagnoses........................................................................20Initial exclusions................................................................................................................25Characteristics of hospital-acquired diagnosis codes.........................................................25Implications for analysis of the NHCDC..............................................................................29
5. Impact of hospital-acquired diagnoses on AR-DRG assignment.........................................33
6. Impact on cost and length of stay.....................................................................................36
Methods.............................................................................................................................36Control variables................................................................................................................38Sample characteristics.......................................................................................................40Results...............................................................................................................................44Sector wide estimates.......................................................................................................51
Appendix 1: Descriptive statistics.........................................................................................53
Appendix 2: NHCDC sample characteristics..........................................................................61
Appendix 3: Detailed results.................................................................................................67
Appendix 4: Methodological issues in estimating the impact on cost and length of stay of hospital-acquired conditions.................................................................................................83
Literature on methods.......................................................................................................83Studies of national/state level hospital morbidity data......................................................87

AcronymsADRG Adjacent Diagnosis Related GroupAPC Admitted Patient Care (National Minimum Data Set)APR-DRG All Patient Refined Diagnosis Related Group (3M)AR-DRG Australian Refined Diagnosis Related GroupCCL Complication and Comorbidity LevelCHADx Classification of Hospital-acquired DiagnosesCOF Condition Onset FlagDRG Diagnosis Related GroupGLM Generalised Linear ModelHAI Hospital-acquired infectionsICD-10-AM International Classification of Diseases – 10th Revision – Australian
ModificationICD-9-CM International Classification of Diseases – 9th Revision – Clinical ModificationMDC Major Diagnostic CategoryNHCDC National Hospital Cost Data CollectionNMDS National Minimum Data SetOLS Ordinary Least SquaresPCCL Patient Clinical Complexity Level
Executive summaryThe Australian Commission on Safety and Quality in Health Care (the Commission), working in collaboration with the Independent Hospital Pricing Authority (IHPA), engaged Health Policy Analysis to analyse hospital-acquired diagnoses and their effect on case complexity and resource use.The Commission and IHPA are exploring ways in which data routinely collected by hospitals can be used towards improving safety and quality. One of the variables available in these data is a flag against each diagnosis for a patient, identifying which ones were pre-existing at the time of the patient’s admission to hospital, and which ones arose during the hospital stay. This is known as the condition onset flag (COF), and has been collected in a standardised way on a national basis in Australia since 1 July 2008. The COF provides a basis for examining hospital-acquired diagnoses.
While it is acknowledged that the COF has limitations as a measure of quality of care, one of the purposes of this project is to explore its potential use. The specific issues examined in this study included:
The completeness and accuracy with which public hospitals record the COF.
The impact of excluding hospital-acquired diagnoses in assigning Australian-Refined Diagnosis Related groups (AR-DRGs) and, hence, the impact on the prices payable for certain services.
The incremental impact of hospital-acquired diagnoses on costs and bed days that are incurred over and above the cost of uncomplicated care.
The analysis undertaken to address these questions referenced a range of technical concepts which are described in the box below. Key findings from this research include:
The COF is reported by about 81% of public hospitals nationally. Reporting varies between states, ranging from 62% of New South Wales public hospitals to 98% of Victorian public hospitals. Use of the COF is highest among larger hospitals that provide the majority of public hospital services. However, its use is still relatively common (upwards of 78%) even in small rural and remote hospitals. Lower rates of reporting of the COF are found in specialist psychiatric and rehabilitation facilities.
For hospitals reporting the COF, an estimated 10% of episodes have at least one hospital-acquired diagnosis reported, and for these there is an average 2.19 diagnoses flagged as hospital-acquired reported per episode.
The exclusion of hospital-acquired diagnoses in determining each patient’s AR-DRG changes a patient’s AR-DRG in 3.1% of all patient episodes. One of the reasons that there is not a larger impact is that many of the hospital-acquired diagnosis codes do not have an impact on AR-DRG assignment (i.e. they are not in
Health Policy Analysis Pty Ltd | Analysis of hospital-acquired diagnoses P a g e | i

Project commissioned by the Australian Commission on Safety and Quality in Health Care
the list of codes that attract a complexity score greater than zero). Also, any procedures necessitated by treatment of hospital-acquired diagnoses cannot be identified as such, and therefore, remain in the reallocation process. If these procedures could be removed from AR-DRG assignment, the impact on AR-DRG assignment would be greater.
There are many methodological challenges in analysing the impact of hospital-acquired diagnoses on cost and length of stay. These are explored in Appendix 4 of this report. The current project has provided an opportunity to develop enhanced approaches to analysing these data, compared with the existing literature, but limitations should be taken into account in interpreting the findings.
Using data from the National Hospital Cost Data Collection (NHCDC) for 2011-12, the impact of the presence of hospital-acquired diagnoses on cost and length of stay was explored for a subset of high volume and high priority conditions/ interventions that was identified by the Commissiona. It was found the costs for episodes with hospital-acquired diagnoses present were $9,200 per episode higher on average than was the case for episodes without these conditions. The length of stay averaged 5.3 days longer. Many of these episodes have more than one hospital-acquired diagnosis reported, so these estimates reflect the combined impact of all hospital-acquired diagnoses present within a particular episode.
Modelling at a more detailed level revealed that the cost and length of stay impacts vary significantly according to the type of hospital-acquired diagnosis. The total cost impact is a function of both the additional costs and the frequency with which particular types of hospital-acquired diagnoses occur. For example, there were relatively few instances of a foreign body being retained in a patient after a procedure, but each instance costs almost $10,000. In contrast, pressure ulcers result in relatively low additional costs per episode (about $1,850), but they are estimated to cost a total of $11 million nationally due to their relatively high prevalence within the AR-DRGs modelled. Note that these estimates also relate to a single hospitalisation rather than ongoing costs of treatment.
Modelling suggested that hospital-acquired diagnoses potentially explained between 12.0% and 16.5% of total costs within the sample hospitals for the high volume ADRGs analysed.
This analysis suggests that in setting priorities for improved patient safety, there needs to be sufficient attention on low cost but relatively common complications, such as hypotension, electrolyte disorders and urinary tract infections, as well as high cost hospital-acquired diagnoses.
There are four recommendations arising from the study. These are:
1. That the COF becomes part of routine auditing of clinical coding undertaken by states and territories.
2. That a system for grouping together related hospital ‘events’ (i.e. diagnoses and procedures) to assist in accurately counting hospital-acquired events, and the procedures that result from them be further pursued.
a The list of conditions/interventions and the criteria by which they were selected are in Table 9, page 32.
Health Policy Analysis Pty Ltd | Analysis of hospital-acquired diagnoses P a g e | ii

Project commissioned by the Australian Commission on Safety and Quality in Health Care
3. That further work on identifying false positives (i.e. complications that are not hospital-acquired but are flagged as such) and false negatives (i.e. complications that are most certainly hospital-acquired but are not flagged as such) in the APC NMDS be undertaken. The work should involve clinicians as well as reviewing the rich literature on these issues.
4. COF coding be extended to capture complications arising during care provided at another facility or during a preceding admission (e.g. an infection acquired during a same day surgical procedure or a fall in a previous sub- or non-acute admission requiring a ‘type change’ to acute).
Health Policy Analysis Pty Ltd | Analysis of hospital-acquired diagnoses P a g e | iii
11. OverviewThis Chapter provides a more detailed summary of the project methodology and results.The Australian Commission on Safety and Quality in Health Care (the Commission) engaged Health Policy Analysis to analyse hospital-acquired diagnoses and their effect on case complexity and resource use. This project is of joint interest to the Commission and the Independent Hospital Pricing Authority (IHPA). Responding to submissions received by IHPA in its consultation around the Pricing Framework, the Commission and IHPA created a Joint Working Party for Safety and Quality in Health Care (JWP) to consider options on the most appropriate approaches for ensuring safety and quality in the provision of health care services under the new funding reforms of the National Health Reform Agreement (NHRA). On 1 July 2012, a national system of activity based funding (ABF) was introduced under the NHRA for the funding of public hospital services in Australia. For acute admitted patient care, the system is based on weights (National Weighted Activity Units or NWAUs) developed for Australian Refined Diagnosis Related Groups (AR-DRGs). The resulting weight for each patient episode is then multiplied by the National Efficient Price, which will ultimately be used to determine the Commonwealth component of funding to public hospitals.
The payment system does not incorporate an explicit quality dimension. All episodes are included in the development of the NWAUs, and all episodes in scope are paid for, which includes the entire spectrum of quality of care delivered.
Internationally, there have been efforts in recent years to adjust hospital funding based on the quality of care provided by the hospital. A variety of approaches has been used by different countries and payers.
The Commission and IHPA jointly commissioned a systematic review of the literature on this issue. It found no material impact on the outcomes of care of the introduction of payment systems incorporating a quality component. However, it did find evidence for the impact of providing relevant and timely data and information for driving safety and quality improvements.
The Commission and IHPA are now undertaking further work on ways in which data routinely generated by hospitals can be used towards improving safety and quality. One of the variables available in these data is a flag against each diagnosis for a patient identifying which ones were pre-existing at the time of the patient’s admission to hospital, and which diagnoses arose during the hospital stay. This is known as the condition onset flag (COF), and has been collected in a standardised way on a national basis in Australia since 1 July 2008.
It is acknowledged that the COF has limitations as a measure of quality of care. Quality in the context of health care is defined as “the degree to which health services for individuals and populations increase the likelihood of desired health outcomes and are consistent with current professional knowledge” (Institute of Medicine, 2013). Quality of care encompasses dimensions such as timeliness and clinical appropriateness. The main contribution of COF is as a measure of safety; that is, flagging adverse events (see
Health Policy Analysis Pty Ltd | Analysis of hospital-acquired diagnoses P a g e | 1

Project commissioned by the Australian Commission on Safety and Quality in Health Care
discussion below under ‘What is the potential for hospitals to use the COF for monitoring patient safety?’).
Concepts used in this report
Condition onset flag (COF): A flag to indicate whether a diagnosis reported for an admitted episode of care had an onset during the episode or otherwise. A COF is assigned to each diagnosis reported for each patient for an episode of care. It is assigned to the principal as well as additional diagnoses. The principal diagnosis code is always assigned a flag of not noted as arising during the episode of admitted patient care. The exception to this is neonates in their admitted birth episode where codes sequenced as the principal diagnosis may be assigned as having an onset during the episode of admitted patient care, if appropriate.
COF diagnoses: Diagnoses flagged as having an onset during the episode of admitted patient care.
Hospital-acquired diagnoses: Synonymous with COF diagnoses, that is, diagnoses flagged as having an onset during the episode of admitted patient care.
Principal diagnosis: The diagnosis established after study to be chiefly responsible for occasioning an episode of admitted patient care.
Additional diagnoses: Conditions or complaints either coexisting with the principal diagnosis or arising during the episode of admitted patient care.
Australian Refined Diagnosis Related Groups (AR-DRGs): A method of grouping acute admitted episodes into clinically meaningful, resource homogenous categories. Episodes are assigned to AR-DRGs based on an algorithm that first partitions episodes into MDCs, which in turn is based on the principal diagnosis assigned to the episode. The version of AR-DRGs used in this report is 6.0x. There are 708 AR-DRGs in this version.
Major Diagnostic Categories (MDCs): These represent body systems or conditions, broadly reflecting specialties providing care.
Adjacent Diagnosis Related Groups (ADRGs): These are groupings of procedures and conditions within an MDC. They are the next level of grouping following MDC, and preceding AR-DRGs. There are 399 ADRGs in the version 6.0x AR-DRG classification.
Complication and Co-morbidity Level (CCL): To determine the severity level of an episode to assign it to the appropriate AR-DRG within an ADRG, additional diagnoses are analysed. Each additional diagnosis attracts a Complication and Comorbidity Level (CCL). The level assigned may range from 0 to 4. An assignment of a CCL level of 0 means that the additional diagnosis is not recognised as a complication or comorbidity (CC) for the purposes of AR-DRG assignment. Of the approximately 19,500 valid ICD-10-AM diagnosis codes, just over 3,000 are recognised as CCs for neonates for AR-DRG version 6.0x (i.e. have a CCL value of greater than zero) and just under 3,000 codes are recognised as CCs for all other patients.
Patient Clinical Complexity Level (PCCL): The combined effect of each CCL for each additional diagnosis is then determined using an algorithm to calculate what is known as the PCCL. The PCCL is a summary of the combined impact of each additional diagnosis reported to a single episode of care with a CCL of greater than 0. PCCL will have a value of between 0 and 4. Depending on the ADRG (i.e. whether or not it is split into severity levels), the PCCL will be used to allocate episodes to more or less complicated AR-DRGs.
Severity level in AR-DRGs: ADRGs may be split further based on the severity level assigned to the episode (i.e. the PCCL score). In version 6.0x, 148 ADRGs have a single severity level, indicated by a ‘Z’ suffix of the corresponding AR-DRG. The remainder may be split into two or three severity levels indicated by an ‘A’, ’B’ or ‘C’ suffix on the AR-DRG.
Health Policy Analysis Pty Ltd | Analysis of hospital-acquired diagnoses P a g e | 2

Project commissioned by the Australian Commission on Safety and Quality in Health Care
International Classification of Diseases – 10th Revision – Australian Modification (ICD-10-AM): This is a system used to represent diagnoses assigned to each patient, as abstracted from their medical record. The system is hierarchical in that codes assigned can be grouped up in various ways (e.g. major conditions such as stroke), ultimately up to chapters representing body systems or major events (such as childbirth and the perinatal period).
Classification of Hospital-Acquired Diagnoses (CHADx): A system for grouping of hospital-acquired diagnoses developed by researchers at the Australian Centre for Economic Research on Health at the University of Queensland, with funding from the Commission. The CHADx groups the 4,500 ICD-10-AM codes identified as hospital-acquired into a hierarchical set of 17 classes, with 145 sub-classes. Examples include post-procedural complications; adverse drug events; accidental injuries; specific infections; and metabolic disorders.
Data cleaning algorithm: An algorithm enabling cleaning of COF in patient morbidity data, particularly identifying false positives and some false negatives, developed by Jackson et al. (2009). The algorithm also groups up related diagnoses into ‘events’ using the rules for sequencing of codes specified in the Australian Coding Standards.
Australian Classification of Healthcare Interventions (ACHI): This forms part of the ICD-10-AM suite, and is used to represent procedures undergone by patients during their admitted episode.
Australian Coding Standards: This also forms part of the ICD-10-AM suite, and is a guide to professional clinical coders on the diagnoses and procedures to abstract for each episode, and how to represent them using an ICD-10-AM or ACHI code. It also includes instructions on sequencing codes to represent related events (e.g. the organism responsible for an infection follows the infection/ infectious site).
Hospital peer groups: Groupings of hospitals based on similarity in size and/ or complexity and/ or specialist role. The peer hospital groups referred to in this report are the ones developed by the Australian Institute of Health and Welfare (AIHW), published in Australian hospital statistics.
Overall, understanding the interaction of the effects of ABF and the Commission’s efforts to achieve national standards for safety and quality is important in the initial years of ABF implementation in Australia.
The specific questions that were raised by this study are as follows:
1. How well is COF reported by hospitals?2. To what extent is the coding correct?3. How should the codes be interpreted?4. What are the limitations of the COF?5. What is the impact on AR-DRG assignment if hospital-acquired diagnoses are
excluded?6. What additional costs and/ or length of stay are there associated with hospital-
acquired diagnoses?
An additional question, although not specifically the target of this study, is:
7. What is the potential for hospitals to use the COF for monitoring patient safety?
Lastly, in answering the questions above, another question is:
Health Policy Analysis Pty Ltd | Analysis of hospital-acquired diagnoses P a g e | 3

Project commissioned by the Australian Commission on Safety and Quality in Health Care
8. What are the limitations of the COF, and what steps can be taken to improve its capture and/ or interpretation?
These are examined in turn.
Data sources and conceptsBefore proceeding to outline the findings in relation to each of the above questions, it is important to outline the data that were used for this analysis, and the concepts that are referred to throughout this report.
The data sets used for analysis for this project are the Admitted Patient Care (APC) National Minimum Data Set (NMDS) and the National Hospital Cost Data Collection (NHCDC). The reasons for using both of these collections are that:
The APC NMDS provides the full range of variables associated with hospital ‘activity’ (i.e. relating to the events of each episode of admitted care) in all hospitals within Australia.
The NHCDC provides costs for episodes of care.
Concepts referred to throughout this report are outlined in the text box in the Overview.
How well is COF reported by hospitals?The analysis in this report showed that since it was introduced as a national standard in 2008, reporting of the COF has improved over time. Overall, 81% of public hospitals reported COF in 2011-12, an increase on 74% in 2009-10. Public hospitals are reporting it more consistently than private hospitals (about 60% of private hospitals reported COF in 2010-11).
COF reporting was generally higher amongst the larger hospitals, that is, ones grouped to the Australian Institute of Health and Welfare (AIHW) hospital peer groups of: Principal referral (A1), Specialist women’s and children’s (A2), Major city (B1), Major regional and remote (B2), Medium Group 1 (C1) and Medium Group 2 (C2). The proportion of hospitals reporting COF was lower for hospitals with a designated sub-acute role. However, episodes with a care type of sub-acute or non-acute (which often are reported for acute hospitals) generally had more COF diagnoses than acute episodes (e.g. 21.5% of rehabilitation episodes had at least one COF diagnosis reported compared with 8.8% of acute episodes in 2011-12).
Following this exploratory analysis it was decided to limit the analysis relating to the impact on AR-DRG assignment and on length of stay and cost to:
Public hospitals reporting COF in AIHW peer groups A1 to C2. The reasons for this were that the scope of this project was limited to public hospitals at the outset; and cost data (which is required for analysing the cost impact of hospital-acquired diagnoses), was predominantly available for these peer groups.
Financial year 2011-12. This year was selected as it is the latest year for which both activity and cost data are available. After analysis, this year was shown to have better quality COF reporting than the previous two years.
Health Policy Analysis Pty Ltd | Analysis of hospital-acquired diagnoses P a g e | 4

Project commissioned by the Australian Commission on Safety and Quality in Health Care
Episodes with a care type of acute and newborn care (the latter with ‘qualified’ days). The reason for selecting these was that it is not clear with other care types, which generally have a longer length of stay, whether the hospital-acquired diagnoses result from the fact that they stay longer.
One issue that was not examined was the extent to which the breadth of coding at each hospital reflected their reporting of the COF. This is an extensive piece of work requiring analysis of COF reporting by the number of diagnoses reported by episode, standardised by AR-DRG (and potentially age group). Systematically recording less additional diagnoses per episode may under-estimate the number of hospital-acquired conditions.
Another related issue, not examined in this report, is the use of non-specific codes in favour of more specific ones within each ICD-10-AM category. An example is the use of G97.9 Postprocedural disorder of nervous system, unspecified, rather than any one of:
G97.0 Cerebrospinal fluid leak from spinal puncture G97.1 Other reaction to spinal and lumbar puncture G97.2 Intracranial hypotension following ventricular shunting G97.8 Other postprocedural disorders of nervous system
This impacts on the collection of information on hospital-acquired diagnoses as it does not identify the specific complication. This may occur due to the skills and experience of the clinical coder, and potentially also the time that they have to code a record, as well as the documentation that is available to them. Hospitals capturing fewer codes are also more likely to have under-coding of the COF.
To what extent is the coding correct?The quality of COF coding cannot easily be ascertained through data available in the APC NMDS. An algorithm enabling cleaning of data, particularly identifying false positives and some false negativesb, has been developed by Jackson et al. (2009) and could be used in improving coding of the COF. The COF has not traditionally been part of routine clinical coding audits undertaken by states and territories. If the COF is to be used to guide quality and safety efforts, it is recommended that it forms part of these audits.
Recommendation
1. That the COF becomes part of routine auditing of clinical coding undertaken by states and territories.
How should the codes be interpreted?The ICD-10-AM system, which is used to represent patient diagnoses in the admitted patient data set, is structured in a way that sometimes more than one code is required to adequately describe a health issue. Also, at other times, multiple concepts are captured within a single code. Therefore, one hospital-acquired event can have multiple codes associated with it, and one code may represent a component of a condition that is
b False positives are diagnoses that are flagged as hospital-acquired but it is certain that they were present on admission (e.g. neoplasms). False negatives are diagnoses not flagged as hospital-acquired, when it is certain that they arose subsequent to admission (e.g. codes related to child birth).
Health Policy Analysis Pty Ltd | Analysis of hospital-acquired diagnoses P a g e | 5

Project commissioned by the Australian Commission on Safety and Quality in Health Care
hospital-acquired, and a component that is not. In the analysis presented in this report, the data cleaning algorithm referred to above was used to group together hospital-acquired diagnoses that are likely to be part of the same event. This is necessary for any system of counting hospital-acquired diagnoses. A ‘straight-out’ count would misrepresent (i.e. over specify) the number of hospital-acquired events.
What are the limitations of the COF?Conditions acquired during hospitalisation are not necessarily conditions that can be prevented, and do not necessarily imply that the care provided to a patient was suboptimal (Pronovost, Goeschel, & Wachter, 2008). This study has considered the impact of all hospital-acquired conditions, rather than a subset of conditions.
Some hospital-acquired conditions relate to complications of the primary conditions leading to the hospital admission, rather than hospital care itself. For example, patients admitted to hospital with subarachnoid haemorrhage will sometimes suffer from vasospasm (delayed cerebral ischaemia) usually days after the original haemorrhage. This will typically result in the need for additional procedures and drugs, and adds significantly to cost and length of stay. Vasospasm is a complication of the original condition and there is little evidence that the nature of hospital treatment impacts the likelihood of a patient experiencing this complication.
However, many hospital-acquired conditions have been shown to be amenable to a reduction in their rates (Umscheid et al., 2011; Wilson et al., 1995; Berenholtz et al., 2011; Pronovost et al., 2006).
The COF is applied to diagnoses in the context of a single episode of care. This means that the condition onset may not be picked up in certain circumstances, such as where a patient is admitted to hospital as a result of a complication arising from treatment at another hospital or a preceding admission (e.g. following an episode of same day surgery after which the patient went home but needed to be readmitted as a result of a hospital-acquired infection, or the patient had a fall during sub- and non-acute episode, after which they are type-changed to acute).
The COF is also applied to diagnoses and not to procedures. The full clinical impact of hospital-acquired diagnoses cannot be ascertained without also identifying the procedure(s) or other interventions that the patient had to undergo as a result of a complication.
What is the impact on AR-DRG assignment if hospital-acquired diagnoses are excluded? The analysis undertaken for this project included regrouping of episodes to AR-DRGs once diagnoses flagged as onset during the hospital stay were removed. Overall, there was a change in AR-DRG for 3.1% of episodes. This was made up of 0.2% episodes being grouped to another ADRG, and 2.9% of episodes changing severity level within an ADRG block. Therefore, close to 97% of episodes did not result in a changed AR-DRG once the diagnosis(es) being reported as onset during the hospital stay was removed. There are a number of reasons for this:
Health Policy Analysis Pty Ltd | Analysis of hospital-acquired diagnoses P a g e | 6

Project commissioned by the Australian Commission on Safety and Quality in Health Care
a. Of the 708 AR-DRGs in version 6.0x, 148 (21%) only have a single severity level (i.e. those with a ‘Z’ suffix).
b. Of the approximately 19,500 valid ICD-10-AM diagnosis codes, just over 3,000 codes are recognised as complications that may impact AR-DRG assignment for neonates and just under 3,000 are recognised as such for all other patients. Also, although an additional diagnosis might be recognised as potentially affecting AR-DRG assignment, its severity level is overwritten with a zero if 1) the diagnosis is part of the definition of the ADRG (e.g. multiple trauma); 2) it is closely related to the principal diagnosis; or 3) it is already in the record (i.e. duplicate code).
c. Procedures are retained in the re-assignment process, whether or not they are necessitated by a hospital-acquired diagnosis. Procedures determine AR-DRG assignment in 364 of the 708 (51%) AR-DRGs in version 6.0x. With the current data collection specifications and standards used in Australia (and comparable countries), it is not possible to directly link the provision of a particular procedure with any diagnosis(es), including those that are acquired during a hospital stay. Therefore, an implicit assumption in this analysis (and prior analyses of similar data (e.g. Jackson, Nghiem, Rowell, Jorm, & Wakefield, 2011, Fuller, McCullough, Bao, & Averill, 2009, Zhan & Miller, 2003) is that procedures are not related to diagnoses that were flagged as hospital-acquired (except in the case of tracheostomy and ventilation procedures – see point c, page 34). Although it may be possible to link individual procedures to specific diagnoses, this would require considerable investment in conceptualising and researching the issue, and in developing relevant data standards (including education in applying these).
In short, there are several limitations of examining the effect of hospital-acquired conditions on case complexity and AR-DRG grouping. The classification system is not sensitive to factoring in secondary diagnoses (whether pre-existing or hospital-acquired)c. In addition, only the removal of conditions is possible. Procedures that are the result of a hospital-acquired diagnosis are not specifically identified.
What additional costs and/ or length of stay are associated with hospital-acquired diagnoses?Across the sample of high volume and high priority conditions/interventions identified by the Commission, the mean incremental impact of the presence of any COF diagnosis was estimated to be $9,244 and 5.3 days. The median incremental cost impact was estimated to be $6,710. Many of these episodes have more than one hospital-acquired diagnosis reported, so these estimates reflect the combined impact of all hospital-acquired conditions present within a particular episode.
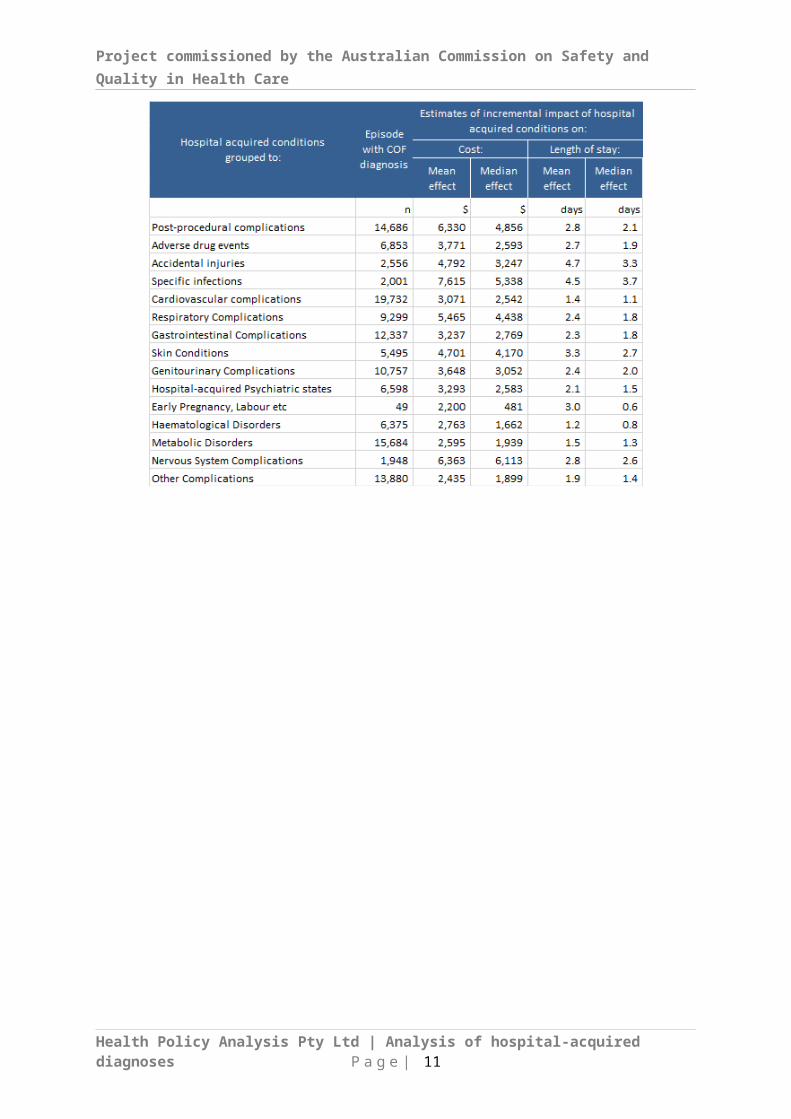
Several models were estimated examining the incremental costs of selected groups of conditions (Table 1). These varied from between $2,000 and $3,000 (e.g. metabolic disorders and haematological disorders) up to over $6,000 (e.g. the post-procedural complications, specific infections, and nervous system complications). The largest incremental costs are estimated for the specific infections which add an estimated $7,615 per episode. c Note that this is potentially not desirable for some additional diagnoses. That is, preventable hospital-acquired diagnoses should not lead to assignment to an AR-DRG with a higher level of severity, which in turn attracts a higher payment under ABF.
Health Policy Analysis Pty Ltd | Analysis of hospital-acquired diagnoses P a g e | 7
Project commissioned by the Australian Commission on Safety and Quality in Health Care
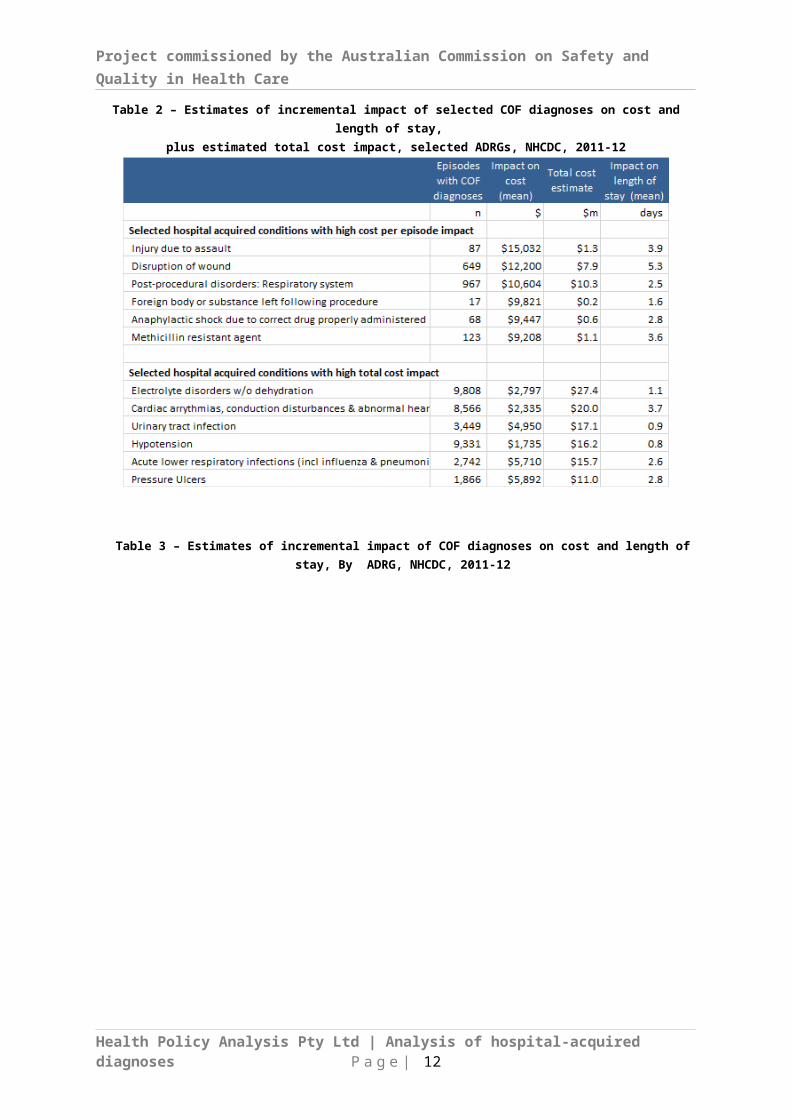
Costs of specific hospital-acquired conditions were also estimated. These estimates revealed a number of conditions with a very high cost impact per episode. For some of these conditions (sepsis, gas embolism and complications of transplants), the number of occurrences in the sample was very low. Estimates were suppressed in these instances. Table 2 shows the estimated impact of other conditions with a high cost per episode impact. These ranged from between $9,208 for methicillin resistant agent to $15,032 for injury due to assault. The numbers of episodes with these conditions was between 17 and 967. As a consequence, the total cost impact of these conditions was not always very high relative to other conditions.
In contrast there were a number of other conditions which had relatively lower cost per episode impacts, but because there were larger numbers of the episodes, the total cost impact was very high. These are also shown in Table 2. Total cost impacts of these conditions ranged from $10.9 million for pressure ulcers (1,866 episodes) to $27.4 million for electrolyte disorders without dehydration (9,808 episodes). As has been pointed out elsewhere (Jackson et al., 2011), this perspective suggests that in setting priority for safety initiatives, it may be beneficial to consider conditions that have a relatively low cost impact on the individual episode of care, but may be very common.
Table 1 – Estimates of incremental impact of major COF diagnoses groupson cost and length of stay, selected ADRGs, NHCDC, 2011-12
Health Policy Analysis Pty Ltd | Analysis of hospital-acquired diagnoses P a g e | 8
Project commissioned by the Australian Commission on Safety and Quality in Health Care
Table 2 – Estimates of incremental impact of selected COF diagnoses on cost and length of stay,
plus estimated total cost impact, selected ADRGs, NHCDC, 2011-12
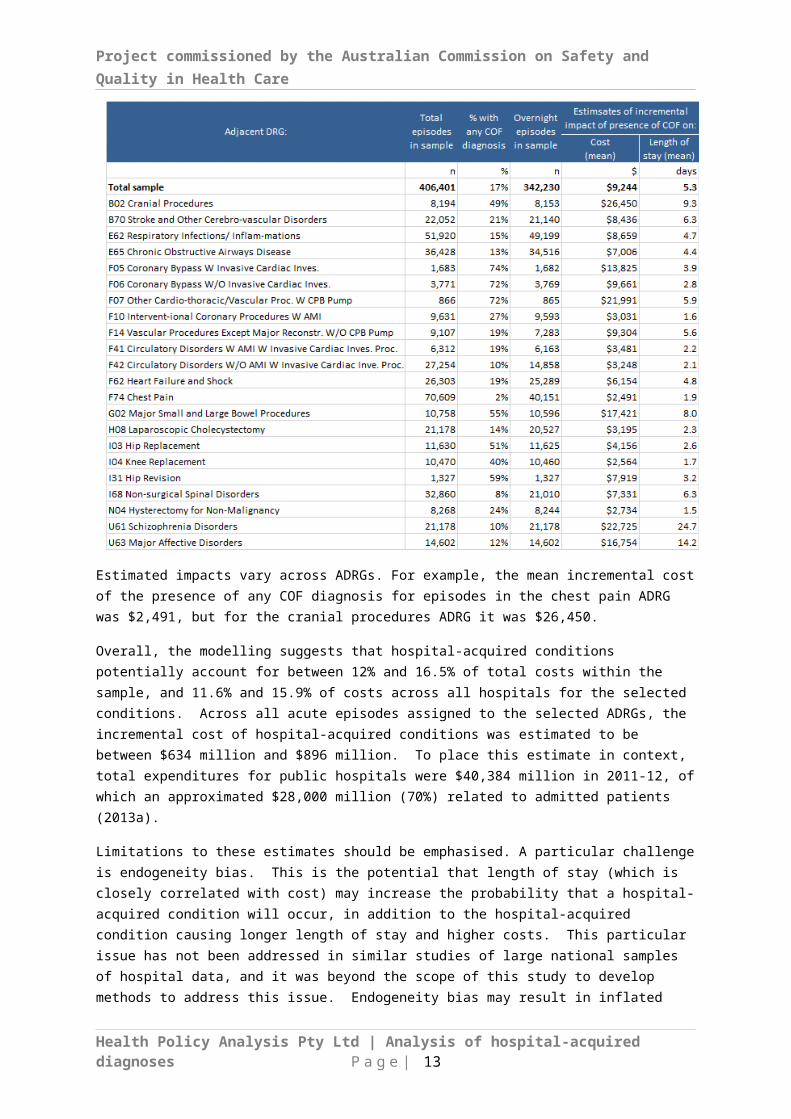
Table 3 – Estimates of incremental impact of COF diagnoses on cost and length of stay, By ADRG, NHCDC, 2011-12
Health Policy Analysis Pty Ltd | Analysis of hospital-acquired diagnoses P a g e | 9

Project commissioned by the Australian Commission on Safety and Quality in Health Care
Estimated impacts vary across ADRGs. For example, the mean incremental cost of the presence of any COF diagnosis for episodes in the chest pain ADRG was $2,491, but for the cranial procedures ADRG it was $26,450.
Overall, the modelling suggests that hospital-acquired conditions potentially account for between 12% and 16.5% of total costs within the sample, and 11.6% and 15.9% of costs across all hospitals for the selected conditions. Across all acute episodes assigned to the selected ADRGs, the incremental cost of hospital-acquired conditions was estimated to be between $634 million and $896 million. To place this estimate in context, total expenditures for public hospitals were $40,384 million in 2011-12, of which an approximated $28,000 million (70%) related to admitted patients (2013a).
Limitations to these estimates should be emphasised. A particular challenge is endogeneity bias. This is the potential that length of stay (which is closely correlated with cost) may increase the probability that a hospital-acquired condition will occur, in addition to the hospital-acquired condition causing longer length of stay and higher costs. This particular issue has not been addressed in similar studies of large national samples of hospital data, and it was beyond the scope of this study to develop methods to address this issue. Endogeneity bias may result in inflated estimates of the impact of hospital-acquired conditions. Endogeneity bias is likely to vary across different types of hospital-acquired conditions, which is one of the reasons approaches to this issue were not feasible within the scope of this project. At the extremes, procedural related conditions are less likely to be impacted by this problem, but conditions commonly associated with long lengths of stay (e.g. pressure ulcers), may be more likely to be impacted.
A further limitation is that the differences in the quality of coding of diagnoses and the COF may impact the estimates. This problem may result in under-estimates of the impact of hospital-acquired conditions.
Finally, it is important to re-emphasise that hospital-acquired conditions may not all be preventable. Some hospital-acquired conditions relate to complications of the primary condition leading to the hospital admission, rather than hospital care itself. Other hospital-acquired conditions may be able to be significantly reduced, but not entirely eliminated.
The results of this study are not directly comparable with previous studies due to the focus on a specific sample defined by specific conditions of interest which had been determined by the Commission. One previous Australian study estimated that hospital-acquired conditions add 17.3% to treatment costs (Jackson et al., 2011), which is slightly higher than the range estimated for the current project. Factors that may contribute to differences include that the Jackson et al. study included maternity services, which have a relatively higher rate of reported hospital-acquired conditions, and that there were variables introduced to control for differences between the complicated and uncomplicated patient episodes. An earlier study (Ehsani, Jackson, & Duckett, 2006) estimated that adverse events accounted for 18.6% of the total inpatient hospital budget in Victorian hospitals in 2003-04.
Implications for activity based funding (ABF)On 1 July 2012, a national system of ABF was introduced for the funding of Australian hospitals. For acute admitted patient care, the system is based on weights (National
Health Policy Analysis Pty Ltd | Analysis of hospital-acquired diagnoses P a g e | 10
Project commissioned by the Australian Commission on Safety and Quality in Health Care
Weighted Activity Units or NWAUs) developed for AR-DRGs, including adjustments for a range of factors, such as patients staying much shorter or longer than expected within a DRG. The resulting weight for each patient episode is then multiplied by the National Efficient Price, which will ultimately be used to determine the Commonwealth component of funding to public hospitals.
The payment system does not incorporate a specific quality dimension – all episodes are included in the development of the NWAUs, and all episodes in scope are paid for, which includes the entire spectrum of quality of care delivered.
Internationally, there have been efforts in recent years to adjust hospital funding based on the quality of care provided by the hospital. A variety of approaches has been used by different countries and payers. One of these approaches is to identify any component of care provided to an admitted patient that was suboptimal (i.e. resulting in an adverse event or the patient acquiring a condition that could have been prevented with better care), and to withhold or reduce payment for that component.
The Commission and IHPA jointly commissioned a systematic review of the literature on this issue. The review found evidence for material impact on the outcomes of care of the introduction of payment systems incorporating a quality component was lacking. The review suggested there was evidence for the impact of providing relevant and timely data and information for driving safety and quality improvements.
It is this finding which has led the Commission and IHPA to commission the current study. Understanding the interaction of the effects of ABF and the Commission’s efforts to achieve national standards for safety and quality is important, at least in these initial years of ABF implementation in Australia.
This study provides some insights into the implications of approaches that attempt to include a quality dimension into the ABF systems. The broad approaches available include:
Excluding hospital-acquired complications in the AR-DRG assignment, so that they do not impact on the patient’s DRG (including changing this to a higher cost DRG in a small proportion of episodes). This means that the price payable to the hospital would reflect the average costs of providing care across episodes complicated by hospital-acquired conditions and those with no hospital-acquired conditions. This approach involves changes only to the AR-DRG assignment processes, but otherwise the setting of prices by IHPA would be undertaken in an identical fashion to present. Under this approach, hospitals with lower than average hospital-acquired diagnoses would receive the same funding as hospitals with higher than average numbers of hospital-acquired diagnoses. This study has indicated that taking this approach would impact AR-DRG assignment for around 3% of episodes. This approach might have a range of impacts on NWAUs, including the base weights applied, but also how short and long stay outliers are identified and weighted.
Excluding a subset of hospital-acquired complications in the AR-DRG assignment. A variation on the first approach is that a subset of hospital-acquired conditions could be ignored in the AR-DRG assignment, where there is good evidence concerning the preventability of the complications. This is effectively the model adopted by US Medicare.
Health Policy Analysis Pty Ltd | Analysis of hospital-acquired diagnoses P a g e | 11

Project commissioned by the Australian Commission on Safety and Quality in Health Care
Excluding the costs of hospital-acquired complications, in calculating the NWAU for each AR-DRG. This means that the price payable to hospitals would reflect the average costs of providing uncomplicated care and the prices would not incorporate the additional costs of managing hospital-acquired conditions. This approach requires estimation and exclusion of costs associated with hospital-acquired complications. This study indicates that in taking this approach, up to 15% of costs would be excluded in calculating prices, if the costs of all hospital-acquired conditions were excluded. A lower proportion would apply if the approach was taken to a subset of hospital-acquired conditions where there was good evidence concerning preventability. The study also highlights that there are significant methodological challenges that impact the estimates of hospital-acquired conditions on cost. Having a stable and well-validated basis for excluding costs would be necessary prior to implementation.
What is the potential for hospitals to use the COF for monitoring patient safety?Although the primary objective of this project was to assess the impact of hospital-acquired diagnoses on length of stay and cost, it is worth mentioning the value of this work for monitoring patient safety at the local level. The use of the COF for this purpose offers the health care system an efficient means of monitoring these issues, as it uses data collected for other purposes to screen for quality and safety issues. Other similar systems that are used within the Australian health care system are the Commission’s core, hospital based outcome indicators (CHBOI) and Queensland’s variable life adjusted display (VLAD) system (although the former is applied as a global indication of safety). Vincent et al. (2008) assert that the health system move “away from unsystematic voluntary reporting towards systematic measurement”. They advocate “a broad but manageable spectrum of indicators that are genuinely useful to the clinical teams that monitor quality and safety day to day”, using “local data that are relevant to clinical concerns . . . how a team is doing compared with last month and last year” (cited in Jackson, Michel, Roberts, Jorm, & Wakefield, 2009, p. 544). The COF lends itself to this.
Another application of analysing hospital-acquired conditions is to prioritise quality and safety efforts. For example, Jackson et al. (2011) found that common, often neglected, conditions such as urinary tract infections, add considerably to the costs of inpatient care in addition to the detrimental effect to the patient. The identification and quantification of common hospital-acquired conditions can help to prioritise initiatives to areas that have a large impact.
What steps can be taken to improve the capture and/ or interpretation of hospital-acquired diagnoses?An important piece of work would be to determine the extent to which COF reporting is impacted by depth of clinical coding at each hospital and/ or at a state/ territory level. That is, there are known differences in the comprehensiveness of coding amongst hospitals and amongst states and territories. The differences between the public and private sectors are particularly marked. The specific question is: Are the number of COF
Health Policy Analysis Pty Ltd | Analysis of hospital-acquired diagnoses P a g e | 12
Project commissioned by the Australian Commission on Safety and Quality in Health Care
diagnoses reported by any one hospital as a result of hospital-acquired events, or the extent to which the hospital tends to capture diagnoses, as compared with other hospitals for similar patients?
As described above, an algorithm exists for grouping hospital-acquired ‘events’ as opposed to counting single diagnoses codes. This relies on codes being sequenced as per the Australian Coding Standards (National Casemix and Classification Centre, 2012). However, standards are only available for some code combinations and not others. Also, the extent to which this is followed by coders is not known. This could potentially lead to multiple counts of what is actually a single hospital-acquired event (Michel, Nghiem, & Jackson, 2009). In addition, as mentioned earlier, procedures are currently not identified as having arisen due to a hospital-acquired event (i.e. versus those planned on admission or indicated at the point of admission by the patient’s diagnosis(es) occasioning the admission). A system whereby ICD-10-AM diagnoses and procedure codes can be related to one another in the routine data collection would assist in addressing these issues.
Recommendation
2. That a system for grouping together related hospital ‘events’ (i.e. diagnoses and procedures) to assist in accurately counting hospital-acquired events, and the procedures that result from them be further pursued.
The data cleaning algorithm currently only identifies false positives (i.e. diagnoses that are not hospital-acquired but are flagged as such) (e.g. congenital conditions or cancers). False negatives (conditions that are most certainly hospital-acquired but are not flagged as such) are identified only for obstetric and perinatal events, as indicated by the specified ICD-10-AM codes, whether or not a coder has flagged them as such. There is rich literature on this, particularly in the United States. A potential issue with this is that the COF currently flags as hospital-acquired only those diagnoses that arose during an episode of care. It could be envisaged that separate codes might be used to flag conditions acquired during or as a result of a previous admission. In any case, further work could be done on identifying false positives and false negatives, and using this as an additional data quality check and/ or for coder education.
Recommendation
3. That further work on identifying false positives (i.e. complications that are not hospital-acquired but are flagged as such) and false negatives (i.e. complications that are most certainly hospital-acquired but are not flagged as such) in the APC NMDS be undertaken. The work should involve clinicians as well as reviewing the rich literature on these issues.
4. COF coding be extended to capture complications arising during care provided at another facility or during a preceding admission (e.g. an infection acquired during a same day surgical procedure or a fall in a previous sub- or non-acute admission requiring a ‘type change’ to acute).
Health Policy Analysis Pty Ltd | Analysis of hospital-acquired diagnoses P a g e | 13
Project commissioned by the Australian Commission on Safety and Quality in Health Care
Health Policy Analysis Pty Ltd | Analysis of hospital-acquired diagnoses P a g e | 14
22. IntroductionProject objectivesThe Australian Commission on Safety and Quality in Health Care (the Commission) engaged Health Policy Analysis Pty Ltd to analyse hospital-acquired diagnoses and their effect on case complexity and resource use. This project is of joint interest to the Commission and the Independent Hospital Pricing Authority (IHPA). Responding to submissions received by IHPA in its consultation on the 2012 Draft Pricing Framework, the Commission and IHPA created a Joint Working Party for Safety and Quality in Health Care (JWP) to consider options on the most appropriate approaches for ensuring safety and quality in the provision of health care services under the funding reforms of the National Health Reform Agreement 2011. This project is of specific interest to this group.The principal objective of this project, as requested by the Commission and IHPA, is “to analyse hospital-acquired diagnoses and their effect on case complexity and resource use” through the following steps:
i. analyse the impact on selected DRGs of excluding hospital-acquired diagnosesii. examine the impact of hospital-acquired diagnoses on costs and bed daysiii. report on the findings, making appropriate and relevant recommendations for
future activity.
Hospital-acquired diagnoses are indicated by the COF. This is a flag that clinical coders assign to each diagnosis for each admitted episode of care to indicate whether the diagnosis was present on admission or acquired during the hospital stay. It was introduced into the Admitted Patient Care (APC) National Minimum Data Set (NMDS) on 1 July 2008, although some states (e.g. Queensland and Victoria) were already collecting it prior to it becoming a national standard.
Conditions acquired during hospitalisation are not necessarily conditions that can be prevented, and do not necessarily imply that the care provided to a patient was suboptimal (Pronovost et al., 2008). However, many hospital-acquired conditions have been shown to be amenable to a reduction in their rates (Wilson et al., 1995; Berenholtz et al., 2011; Pronovost et al., 2006).
Structure of reportThis report is structured as follows:
Chapter 3 defines the COF, and introduces the data sets analysed for this project and their limitations.
Chapter 4 describes the nature of the COF diagnosis codes that are reported in the national data, and high level analysis of the characteristics of episodes within which these are reported. It then introduces the exclusion criteria designed to focus the remaining analyses on the issues of relevance for this project.
Health Policy Analysis Pty Ltd | Analysis of hospital-acquired diagnoses P a g e | 14

Project commissioned by the Australian Commission on Safety and Quality in Health Care
Chapter 5 examines the impact of the change to AR-DRG assignment once hospital-acquired diagnoses are removed from each episode of care.
Chapter 6 shows the results of the impact of the presence of COF diagnoses on cost and length of stay (within the selected AR-DRGs), and estimates the impact of specific groups of COF diagnoses.
Appendix 1 shows descriptive statistics of the COF according to a number of dimensions (e.g. by state/ territory, hospital peer group).
Appendix 2 shows the characteristics of the NHCDC sample.
Appendix 3 shows detailed results.
Appendix 4 details the model specifications for the results shown in Chapter 4: Impact on cost and length of stay, including a review of the literature on methods.
Health Policy Analysis Pty Ltd | Analysis of hospital-acquired diagnoses P a g e | 15

33. Data sources and issuesThis Chapter defines the COF, and introduces the data sets analysed for this project and their limitations.
The Condition Onset Flag (COF)A COF is assigned to each diagnosis reported for each patient for an episode of care indicating whether the diagnosis arose during the episode or otherwise. Reporting of the COFd was agreed as a national standard from 1 July 2008. Several jurisdictions had already implemented reporting this flag (or a similar version) prior to that date.
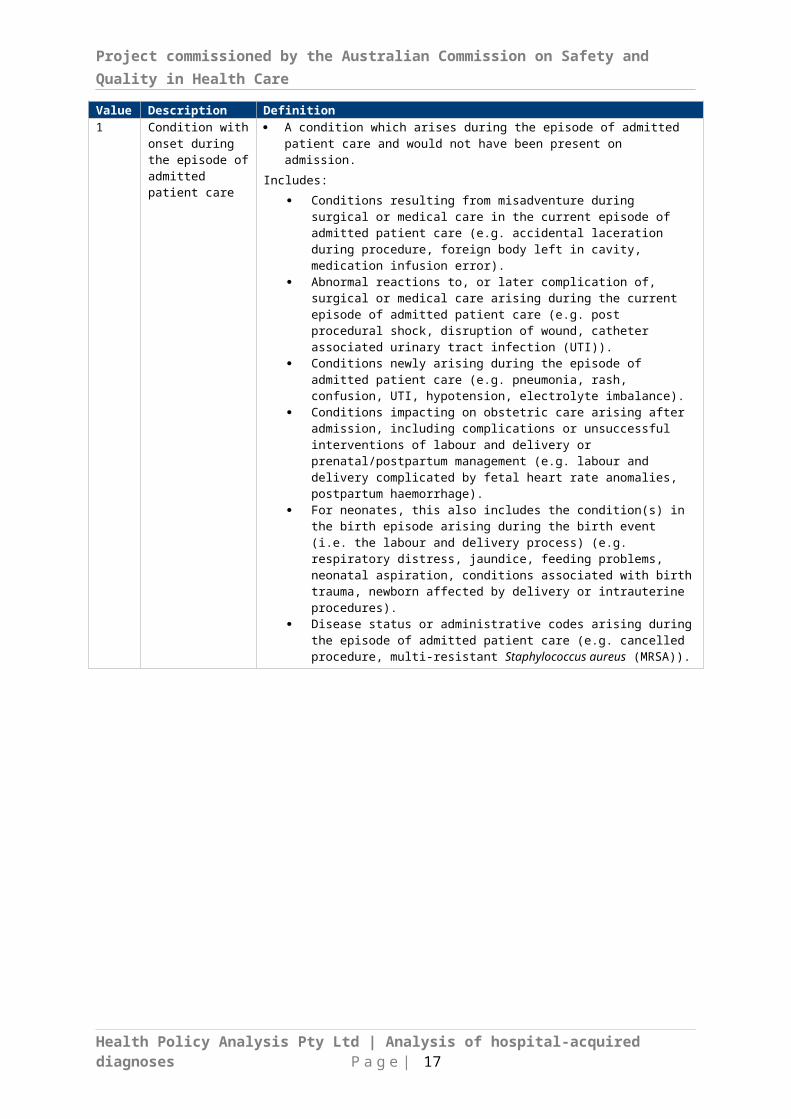
The COF data element in the national standard is represented by three values. These are described in Table 4.
Table 4 – National standard for the representation of the COF
Value
Description Definition
1 Condition with onset during the episode of admitted patient care
A condition which arises during the episode of admitted patient care and would not have been present on admission.
Includes: Conditions resulting from misadventure during surgical or
medical care in the current episode of admitted patient care (e.g. accidental laceration during procedure, foreign body left in cavity, medication infusion error).
Abnormal reactions to, or later complication of, surgical or medical care arising during the current episode of admitted patient care (e.g. post procedural shock, disruption of wound, catheter associated urinary tract infection (UTI)).
Conditions newly arising during the episode of admitted patient care (e.g. pneumonia, rash, confusion, UTI, hypotension, electrolyte imbalance).
Conditions impacting on obstetric care arising after admission, including complications or unsuccessful interventions of labour and delivery or prenatal/postpartum management (e.g. labour and delivery complicated by fetal heart rate anomalies, postpartum haemorrhage).
For neonates, this also includes the condition(s) in the birth episode arising during the birth event (i.e. the labour and delivery process) (e.g. respiratory distress, jaundice, feeding problems, neonatal aspiration, conditions associated with birth trauma, newborn affected by delivery or intrauterine procedures).
Disease status or administrative codes arising during the episode of admitted patient care (e.g. cancelled procedure, multi-resistant Staphylococcus aureus (MRSA)).
d METeOR identifier 496512.
Health Policy Analysis Pty Ltd | Analysis of hospital-acquired diagnoses P a g e | 16

Project commissioned by the Australian Commission on Safety and Quality in Health Care
Value
Description Definition
2 Condition not noted as arising during the episode of admitted patient care
A condition present on admission, such as the presenting problem, a comorbidity or chronic disease.
Includes: Conditions that have not been documented at the time of
admission, but clearly did not develop after admission (e.g. newly diagnosed diabetes mellitus, malignancy and morphology).
A previously existing condition that is exacerbated during the current episode of admitted patient care (e.g. atrial fibrillation, unstable angina).
Conditions that are suspected at the time of admission and subsequently confirmed during the current episode of admitted patient care (e.g. pneumonia, acute myocardial infarction (AMI), stroke, unstable angina).
Conditions impacting on obstetric care arising prior to admission (e.g. venous complications, maternal disproportion).
For neonates, this also includes the condition(s) in the birth episode arising before the labour and delivery process (e.g. prematurity, birth weight, talipes, clicking hip).
Disease status or administrative codes not arising during the episode of admitted patient care (e.g. history of tobacco use, duration of pregnancy, colostomy status).
Outcome of delivery (Z37) and place of birth (Z38) codes.9 Not reported The COF could not be reported due to limitations of the data
management system.Source: 2013b
The following guide for use is also provided:
“Assign the relevant COF value only to ICD-10-AM codes assigned in the principal diagnosis and additional diagnosis fields for the National Hospital Morbidity Database collection.
Sequencing of ICD-10-AM codes must comply with the Australian Coding Standards and therefore codes should not be re-sequenced in an attempt to list codes with the same COF values together.
The principal diagnosis code is always assigned COF 2. The exception to this is neonates in their admitted birth episode in that hospital where codes sequenced as the principal diagnosis may be assigned COF 1 if appropriate.
For neonates, where a condition in the admitted birth episode is determined to have arisen during the birth event (i.e. labour and delivery process), these conditions should be considered as arising during the episode of admitted patient care and assigned COF 1.
When a single ICD-10-AM code describes multiple concepts (i.e. a combination code) and any concept within that code meets the criteria of COF 1, assign COF 1.
When it is difficult to decide if a condition was present at the beginning of the episode of care or if it arose during the episode, assign a COF 2.
Health Policy Analysis Pty Ltd | Analysis of hospital-acquired diagnoses P a g e | 17

Project commissioned by the Australian Commission on Safety and Quality in Health Care
Explanatory notes:
The COF value assigned to external cause, place of occurrence and activity codes should match that of the corresponding injury or disease code. Injuries which occur during the admitted episode of care but not on the hospital grounds (e.g. hospital in the home (HITH)) should be assigned COF 1 as 'arising during the episode of admitted patient care'.
The COF value assigned to morphology codes should match that on the corresponding neoplasm code.
The COF value on Z codes related to the outcome of delivery on the mother’s record (Z37), or the place of birth on the baby's record (Z38) should always be assigned COF 2.
The COF value on aetiology and manifestation (dagger and asterisk) codes should be appropriate to each condition and therefore the dagger and asterisk codes may be assigned different COF values.
An episode of admitted patient care includes all periods when the patient remains admitted and under the responsibility of the health care provider, including periods of authorised leave and HITH. Where diagnoses arising during this period meet the criteria for ACS 0002 Additional diagnoses, coders should apply the COF Guide for use instructions and assign COF 1 if appropriate. Unauthorised leave does not fall under the responsibility of the health care provider and conditions arising during this time should be assigned COF 2.
Where an admission has multiple admitted patient episode 'care type' changes (e.g. acute to rehabilitation), COF assignment should be relevant to each episode. A condition arising in an episode should be assigned COF 1. If care for that condition continues in subsequent episodes those conditions should be assigned COF 2.
(2013b)
Data setsThe data sets used for analysis for this project are the Admitted Patient Care (APC) National Minimum Data Set (NMDS) and the National Hospital Cost Data Collection (NHCDC). The reasons for using both of these collections are that:
The APC NMDS provides the full range of variables associated with hospital ‘activity’ (i.e. relating to the events of each episode of admitted care) in all public and private hospitals within Australia, and incorporating all care types (i.e. acute, newborn, sub- and non-acute, etc.).
The NHCDC provides costs for episodes of care. Although the collection also captures costs for other episodes other than acute, the costs for acute episodes are the most robust due to their long history (on a national level, the collection has been going for more than 15 years) and investments by states and territories and the Commonwealth (e.g. in the development of ‘feeder’ systems and relative value units).
Health Policy Analysis Pty Ltd | Analysis of hospital-acquired diagnoses P a g e | 18

Project commissioned by the Australian Commission on Safety and Quality in Health Care
LimitationsThere are several characteristics of the available national data set related to admitted patient care (APC and NHCDC) which limit the capacity to analyse COF diagnoses and their consequences. These include:
The NHCDC is a voluntary collection, and therefore, not all hospitals reporting to the APC NMDS have corresponding records in the NHCDC. The representativeness of the NCHCDC has been estimated against the APC NMDS in this report.
The later years are reported to have better quality of COF assignment than the previous years. This was also explored, and documented in this report.
The NHCDC data set has 30 diagnoses, whereas the APC has 100. However, IHPA merges these data sets and generally uses the diagnoses reported in the APC for analysis purposes. There are some records in which the NHCDC items do not match the APC items. However, these have a minimal impact in this analysis.
There are ICD coding version changes between 2009-10 and 2010-11 (2009-10 uses 6th edition, and 2010-11 and 2011-12 use 7th edition). In this report, the focus is on the 2011-12 data. Where previous years’ data has been used, this is for showing the level of COF coding rather than attempting to map individual ICD-10-AM diagnoses over time. Therefore, this has not been a problem for the analysis in this project.
Health Policy Analysis Pty Ltd | Analysis of hospital-acquired diagnoses P a g e | 19

44. Characteristics of hospital-acquired diagnoses and associated episodesThis Chapter provides an initial profile of episodes in which diagnoses are reported with onset occurring after admission (COF diagnoses), and the nature of the COF diagnosis codes themselves. This analysis was conducted initially using the full APC NMDS, and the scope was then narrowed to reflect the objectives of this project.
Episodes with hospital-acquired diagnosesReporting of the COF in the APC NMDS was analysed according to a range of variables, including state/territory, care type, peer group, day only/overnight status and elective/non elective admission. These analyses are presented in Appendix 1. The analysis was conducted using three years of data, from 2009-10 to 2011-12. Initial analysis sought evidence that hospitals were reporting COF, and the level of reporting that was occurring. While data is summarised and presented at the state/territory level, the analysis was undertaken at the hospital level.
The initial analysis revealed the following:
Reporting by the public sector and the private sector was examined. Data was not available for private hospitals for 2011-12 for several jurisdictions (New South Wales, South Australia, Western Australia, Tasmania, Northern Territory, and the Australian Capital Territory). In three jurisdictions (Victoria, Western Australia, Australian Capital Territory), all private hospitals were reporting COF in 2010-11. In a further three jurisdictions (Queensland, South Australia, Tasmania), around 60-70% of private hospitals were reporting COF. In NSW and NT, no private hospitals were reporting COF. Across the private sector for 2010-11, around 3.8% of episodes had at least one COF diagnosis reported. The jurisdiction with highest level of reporting was Victoria, with 7.0% of episodes reporting the COF in private hospitals. Private hospitals were excluded for all further analyses, as the focus of this project was public hospitals.
Health Policy Analysis Pty Ltd | Analysis of hospital-acquired diagnoses P a g e | 20

Project commissioned by the Australian Commission on Safety and Quality in Health Care
Within the public sector, there were just over 700 hospitals reporting to the APC NMDS. The proportion of hospitals reporting at least one episode with a COF diagnosis increased from 74% in 2009-10 to 81% in to 2011-12. In 2011-12, these hospitals accounted for 91% of all public sector episodes.
Reporting of the COF has increased overall from 6.2% of episodes in public hospitals in 2009-10 to 8.3% of episodes in 2011-12.
Increases in reporting have mainly related to New South Wales hospitals. The number of public hospitals reporting COF in New South Wales has increased from 96 to 130 over the three years. While 96 hospitals reported COF diagnoses in 2009-10, the level of reporting for that year was very low (with only 1.9% of episodes having a COF assigned in those hospitals). In subsequent years, the reporting level increased to approach the levels seen in other states.
There have also been increases in numbers of hospitals reporting COF in Queensland and Tasmania.
When restricted to hospitals which are reporting at least one episode with a COF, the proportion of episodes with COF diagnoses has increased from 7.5% of episodes in 2009-10 to 9.1% in 2011-12 (see Figure 1). There have been increases in reporting for all states and territories, except the Northern Territory.
Figure 1 – Percentage of episodes within hospitals reporting COF, where at least one COF diagnosis is reported, public hospitals, 2009-10 to 2011-12
This analysis shows some of the differences in reporting at the jurisdiction level. However, as will be discussed below (see p. 27), it is important to consider the quality of reporting at the individual hospital level. Hospitals not reporting the COF were excluded from the subsequent analysis.
A range of other characteristics was investigated to identify particular issues that would assist in focussing the analysis. These are described below.
Health Policy Analysis Pty Ltd | Analysis of hospital-acquired diagnoses P a g e | 21
Project commissioned by the Australian Commission on Safety and Quality in Health Care
Hospital peer groupHospitals were examined with respect to the Australian Institute of Health and Welfare’s (AIHW’s) hospital peer groups (Figure 2). Reporting is generally lower for smaller hospitals and for hospitals with a designated sub-acute role.
A decision was taken to focus the analysis on episodes within hospitals with a peer group of A1- C2 (i.e. Principal referral (A1), Specialist women’s and children’s (A2), Major city (B1), Major regional and remote (B2), Medium Group 1 (C1) and Medium Group 2 (C2)). These hospitals account for 93% of episodes in public hospitals (Figure 3). One of the key factors influencing the decision to focus on this subset of hospitals was that the analysis of costs, reported later in this report (based on the NHCDC), requires costing data reported at the patient level. Generally the smaller hospitals (e.g. in the ‘D’ peer groups) do not report patient level costing data, and therefore were excluded from further analysis.
Figure 2 – Proportion of hospitals reporting COF byby AIHW hospital peer group, public hospitals reporting COF, 2011-12
Health Policy Analysis Pty Ltd | Analysis of hospital-acquired diagnoses P a g e | 22
Project commissioned by the Australian Commission on Safety and Quality in Health Care
Figure 3 – Total number of episodes by AIHW hospital peer group, public hospitals reporting COF, 2011-12
Care typeLevels of reporting by care type were reviewed. The analysis revealed that levels of reporting of COF diagnoses were much higher for sub and non-acute episodes. This is shown in Figure 4. A possible explanation for this is that these episodes are generally much longer, and hence the likelihood of a new problem emerging during the stay is higher. While there are interesting issues to be explored with respect to sub and non-acute episodes, this project focussed on acute episodes.
Figure 4 – Proportion of episodes with at least one COF diagnosis reported by care type, public hospitals reporting COF, 2011-12
Acute episodes include those with a care type of ‘acute’ and ‘newborn’. Episodes with a care type of ‘newborn’ are grouped into those where ‘qualified days’ are reported, and those where there are no ‘qualified days’ reported. In the costing of episodes, the costs of unqualified newborns are bundled with the costs of the mother. The associated costs of unqualified newborns are generally considered to be relatively minor. As a consequence, a usual practice is to exclude these episodes from analysis. However, it is worth noting that some unqualified newborns do have COF diagnoses reported (around 3,000 episodes in 2011-12). These were reported in public hospitals in all states and territories, although rates of reporting were higher in some jurisdictions. Further investigation revealed that these rates may interact with the probability that a newborn episode is reported with qualified days. Hospitals in some states have slightly lower proportions of newborns reported with qualified days than would be expected using national rates. After considering all options, it was decided to exclude unqualified newborns from the analysis of the NHCDC episodes.
Day only and admission statusReporting of COF was examined by whether the episode occurred as a day only or overnight stay. Overnight episodes in this context are defined as episodes with at least an overnight hospital stay. As shown in Figure 5, 0.9% of day only episodes and 17.4% overnight episodes had a COF diagnosis reported. Day only episodes account for 50.3% of the episodes within the hospitals included in the analysis.
The categories were further split by whether the admission status was ‘emergency’, ‘planned’ or ‘other’. Overall, episodes with an emergency admission status had a higher proportion of episodes with at least one COF diagnosis compared with planned episodes
Health Policy Analysis Pty Ltd | Analysis of hospital-acquired diagnoses P a g e | 23
Project commissioned by the Australian Commission on Safety and Quality in Health Care
(10.2% vs. 6.0%). Episodes with the ‘other’ category for admission status have the highest proportion (13.1%). (This is partially explained by the fact that obstetric admissions, which generally have a larger number of COF diagnoses reported, are typically allocated to the ‘other’ category.) When split by day only and overnight, an interesting observation is that for overnight episodes, a lower proportion of episodes with ‘emergency’ admission status have at least one COF compared with ‘planned’ episodes (13.4% vs. 20.5%). This was not expected, and warrants further investigation.
Figure 5 – Proportion of episodes with at least one COF diagnosis reported, by day only/overnight status and admission status, public hospitals reporting COF with peer
group A1-C2, 2011-12
This analysis suggests that there are potentially important differences between day only and overnight episodes with respect to diagnoses being flagged as hospital-acquired. These differences may diminish once other factors are taken into account (e.g. assignment to AR-DRG). Rather than excluding day only episodes from the analysis, an alternative approach is to control for this factor in modelling the impact of COF diagnoses on costs.
Health Policy Analysis Pty Ltd | Analysis of hospital-acquired diagnoses P a g e | 24

Project commissioned by the Australian Commission on Safety and Quality in Health Care
Similarly, the analysis suggests that admission status may be an important factor to control for in the model specification for modelling the impact of COF diagnoses on length of stay and cost, which is reported later in this report.
Health Policy Analysis Pty Ltd | Analysis of hospital-acquired diagnoses P a g e | 25

Project commissioned by the Australian Commission on Safety and Quality in Health Care
Initial exclusionsBased on the analysis conducted above, it was decided to apply a number of exclusions for the next phase of the analysis. The exclusions agreed with the project team were:
Private hospitals were excluded from the analysis due to the fact that the primary focus on this review was public hospitals.
The analysis was focussed on 2011-12. This was because overall reporting rates of COF by hospitals were better for that year (which is the most current year of data available) than previous years.
Hospitals that did not report the COF were excluded from the analysis.
The analysis was focussed on episodes with an acute care type plus episodes with a newborn care type reporting qualified days. This was due to the fact that other care types generally have much longer lengths of stay, and therefore, issues may arise for patients during the hospital stay because of the longer length of stay rather than the care provided.
The analysis was focussed on hospitals with an AIHW hospital peer groups of: A1, A2, B1, B2, C1 or C2. This was for the reasons in relation to length of stay and the availability of cost data.
These exclusions have been applied in the analyses presented in Table 5, Table 6, and Table 7. These initial exclusions were also applied with respect to the analysis of the NHCDC (see discussion below).
Characteristics of hospital-acquired diagnosis codesThe analysis presented above examined the characteristics of episodes of care in which hospital-acquired diagnoses were reported. Further analysis was undertaken on the nature of hospital-acquired diagnosis codes reported in the APC NMDS in 2011-12. This analysis also examined the implications of applying a data cleaning algorithm originally proposed by Jackson et al. (2009).
Many of issues with the interpretation of COF diagnoses have been previously highlighted in the literature (Jackson, Michel, Roberts, Shepheard, et al., 2009; Jackson, Michel, Roberts, Jorm, et al., 2009; Michel et al., 2009). These issues motivated the development of the data cleaning algorithm (Jackson, Michel, Roberts, Shepheard, et al., 2009) and a system for classifying hospital-acquired-diagnoses known as the Classification of Hospital-Acquired Diagnoses (CHADx) (Jackson, Michel, Roberts, Jorm, et al., 2009; Michel et al., 2009). Particular elements of the data cleaning algorithm include:
Removing false positives, that is, diagnoses that are assigned a flag that are clearly implausible. An example is codes related to neoplasms, which are likely to have been present on admission.
Flagging false negatives, that is codes are flagged as present on admission, when it is certain that these codes arose subsequent to admission. An example is complications arising during child birth. However, only false negatives identified
Health Policy Analysis Pty Ltd | Analysis of hospital-acquired diagnoses P a g e | 26
Project commissioned by the Australian Commission on Safety and Quality in Health Care
by the Jackson et al. (2009) data cleaning algorithm relate to obstetrics and neonates.
Reducing double counting of codes. Some conditions/events require several codes to properly describe the relevant event or diagnosis. Examples include post procedural complications, injury and adverse effects due to treatment and hospital-acquired infections (Michel et al., 2009). While there are national standards to guide how coders should sequence the recording of these additional codes (i.e. the Australian Coding Standards, National Casemix and Classification Centre, 2012), there remains room for ambiguity in the interpretation in some instances. Also, some ICD-10-AM codes represent two concepts within one code, of which one concept may be present on admission and the other arising following admission. An example is E10.64 Type 1 diabetes mellitus with hypoglycaemia (Jackson, Michel, Roberts, Shepheard, et al., 2009). There are coding conventions in some of these situations that allow for two codes to be recorded, one of which may be flagged as occurring after admission. However, there are a number of areas where interpretation is potentially ambiguous (Jackson, Michel, Roberts, Shepheard, et al., 2009).
The data cleaning algorithm was applied to the 2011-12 APC (and subsequently the NHCDC data).
Hospital-acquired diagnosis codes were also grouped into classes to illustrate some specific issues in their interpretation. This also helps to make sense of the large number of individual diagnosis codes flagged as hospital-acquired. (In the analysis presented below, there were approximately 1.3 million ICD-10-AM codes flagged as hospital-acquired.)
While there are several systems that have been developed around the world for grouping COF diagnoses (mostly in the United States using the ICD-9-CM classification), these have a number of limitations (Jackson et al., 2013, under review). One major limitation is that the classifications are not comprehensive. That is, they focus on particular conditions, and not all COF diagnoses. The Classification of Hospital-Acquired Diagnoses (CHADx) was developed to address these limitations, and is also based on ICD-10-AM. It was developed by researchers at the Australian Centre for Economic Research on Health at the University of Queensland with funding from the Commission. The CHADx identifies 4,500 ICD-10-AM codes as being hospital-acquired. It groups these into a hierarchical set of 17 classes, with 145 sub-classes (2013). Examples include post-procedural complications; adverse drug events; accidental injuries; specific infections; and metabolic disorders.
Frequency of reported COF diagnoses codesAs an initial step, the frequency of COF diagnoses was explored together with the frequency of diagnoses after the application of the data cleaning algorithm. This analysis was conducted at the level of ‘diagnosis codes’ rather than episodes. (Note that several diagnoses are usually reported for a single episode.)
There was also an interest in understanding the potential impact of COF on AR-DRG assignment. To provide an initial understanding of this impact, the Complication and Comorbidity Level (CCL) of each diagnosis was assessed (based on Australian Refined Diagnosis Related Groups (AR-DRGs) version 6.0x, the version in which the data have been costed through the NHCDC). Diagnosis codes with a CCL of greater than 0
Health Policy Analysis Pty Ltd | Analysis of hospital-acquired diagnoses P a g e | 27

Project commissioned by the Australian Commission on Safety and Quality in Health Care
(implying that they could potentially impact AR-DRG assignment) were then identified. The text box below provides further description of the AR-DRG assignment process.
Assignment of Australian Refined Diagnosis Related Groups (AR-DRGs)
Episodes of admitted patient care are assigned to AR-DRGs based on an algorithm, which firstly involves assigning episodes to Major Diagnostic Categories (MDCs) based on the patient’s principal diagnosis (i.e. the diagnosis that, after study, is found to be chiefly responsible for the patient’s admission to hospital). There is also a ‘pre-MDC’ category, which partitions out episodes that have undergone major procedures (high cost and complex), regardless of the principal diagnosis (e.g. complex organ transplants and tracheostomy). Within MDCs, episodes are than assigned to Adjacent DRGs (ADRGs). These are groupings of procedures (for patient’s having undergone a procedure in a surgical suite or operating theatre) or conditions (for patients not having undergone a procedure). There are 399 ADRGs in the version 6.0x classification.
ADRGs may be split further based on the severity level assigned to the episode, which in turn is based on the analysis of additional diagnoses. One hundred and fifty-six ADRGs have a single severity level, indicated by a ‘Z’ suffix added to the corresponding AR-DRG. The remainder may be split into two or three severity levels indicated by an ‘A’, ’B’ or ‘C’ suffix on the AR-DRG.
To determine the severity level of an episode to assign it to the appropriate AR-DRG within an ADRG, additional diagnoses are analysed. Each additional diagnosis attracts a Complication and Comorbidity Level (CCL). The level assigned may range from 0 to 4. An assignment of a CCL level of 0 means that the additional diagnosis is not recognised as a complication or comorbidity (CC) for the purposes of AR-DRG assignment. Of the approximately 19,500 valid ICD-10-AM diagnosis codes, just over 3,000 are recognised as CCs for neonates in AR-DRG version 6.0x (i.e. have a CCL value of greater than zero) and just under 3,000 codes are recognised as CCs for all other patients. The analysis in Table 5, shows the number of additional diagnoses with a CCL greater than 0, and the number of COF diagnoses with a CCL greater than 0. It is only these diagnosis codes which will have an impact on AR-DRG assignment.
Although an additional diagnosis might be recognised as a CC, the severity level is overwritten with a zero if 1) the CC is part of definition of the ADRG (e.g. multiple trauma); 2) it is closely related to the principal diagnosis; or 3) it is already in the record (i.e. duplicate code).
The combined effect of each CCL for each additional diagnosis is then determined using an algorithm to calculate what is known as the Patient Clinical Complexity Level (PCCL). The PCCL, is in effect, a summary of the combined impact of each additional diagnosis reported to a single episode of care with a CCL of greater than 0. PCCL will have a value of between 0 and 4. Depending on the ADRG (i.e. whether or not it is split into severity levels), the PCCL will be used to allocate episodes to more or less complicated AR-DRGs.
Table 5 shows the resulting frequencies of diagnosis codes grouped by ICD Chapter, using the APC NMDS. The Table shows 9.87 million additional diagnosese codes reported. Of these, 1.28 million are coded with COF, indicating onset during the episode of admitted patient care, representing 12.9% of additional diagnosis codes. This reduction results from two factors: removal of false positive diagnoses, and grouping of related codes. When the data cleaning algorithm is applied, there are 0.88 million codes identified (a reduction of around 28%).
e METeOR identifier: 514271, defined as “A condition or complaint either coexisting with the principal diagnosis or arising during the episode of admitted patient care, episode of residential care or attendance at a health care establishment, as represented by a code.”
Health Policy Analysis Pty Ltd | Analysis of hospital-acquired diagnoses P a g e | 28

Project commissioned by the Australian Commission on Safety and Quality in Health Care
Table 5 – Additional diagnosis codes, COF diagnosis codes and diagnosis codes after application of the data cleaning algorithm, by ICD Chapter, APC NMDS with initial
exclusions applied, 2011-12
Note: see ’Initial exclusions’ (p. 26) for details of exclusions applied. Also excludes morphology codes.
Of all the additional diagnoses recorded, 1.85 million (18.7%) have been assigned a CCL of 1 or greater. Of the COF diagnoses, after the data cleaning algorithms are applied, 0.30 million additional codes have a CCL of 1 or greater, making up around 3.0% of all additional diagnoses.
In the application of the data cleaning algorithm, it can be seen that all codes related to neoplasms are excluded. Most diagnosis codes within the External causes and Factors influencing health status chapters (20 and 21) are also excluded. There is a substantial increase in the number of codes for the Certain conditions originating in the perinatal period chapter (16).
Codes were also grouped to the CHADx classes. This is shown in Table 6. The CHADx group with the largest number of diagnoses was 12 Labour, delivery & postpartum complications (20.9%), followed by 05 Cardiovascular complications (10.4%), 15 Metabolic disorders (9.0%), 17 Other complications (8.7%) and 01 Post-procedural complications (8.1%). Table 35 in the Appendix provides details of each individual CHADx class.
Health Policy Analysis Pty Ltd | Analysis of hospital-acquired diagnoses P a g e | 29
Project commissioned by the Australian Commission on Safety and Quality in Health Care
Table 6 – Additional diagnosis codes, COF diagnosis codes and diagnosis codes after application of CHADx data cleaning algorithm, by CHADx group, APC with initial
exclusions applied, 2011-12
Note: see ’Initial exclusions’ (p. 26) for details of exclusions applied. Also excludes morphology codes.
Frequency of episodes in which COF diagnoses are reportedAnother perspective is to consider the number of episodes in which a COF diagnosis is reported. Overall, across the APC NMDS (after exclusion criteria are applied), 9.2% of episodes have a COF reported. For these episodes there are on average 3.06 COF diagnosis codes reported per episode. After data cleaning, 10.0% of episodes have at least one COF diagnosis reported. For these episodes, an average of 2.19 COF diagnoses are reported. Episodes with a COF with CCL of 1 or greater account for 4.4% of episodes. This is shown in Table 7.
Table 7 – Episodes in which COF diagnoses, APC NMDS with initial exclusions applied, 2011-12
Note: see ’Initial exclusions’ (p. 26) for details of exclusions applied.
Implications for analysis of the NHCDCThe initial exclusions discussed earlier (see p. 26) were also considered appropriate for the analysis of the NHCDC. In particular:
Health Policy Analysis Pty Ltd | Analysis of hospital-acquired diagnoses P a g e | 30
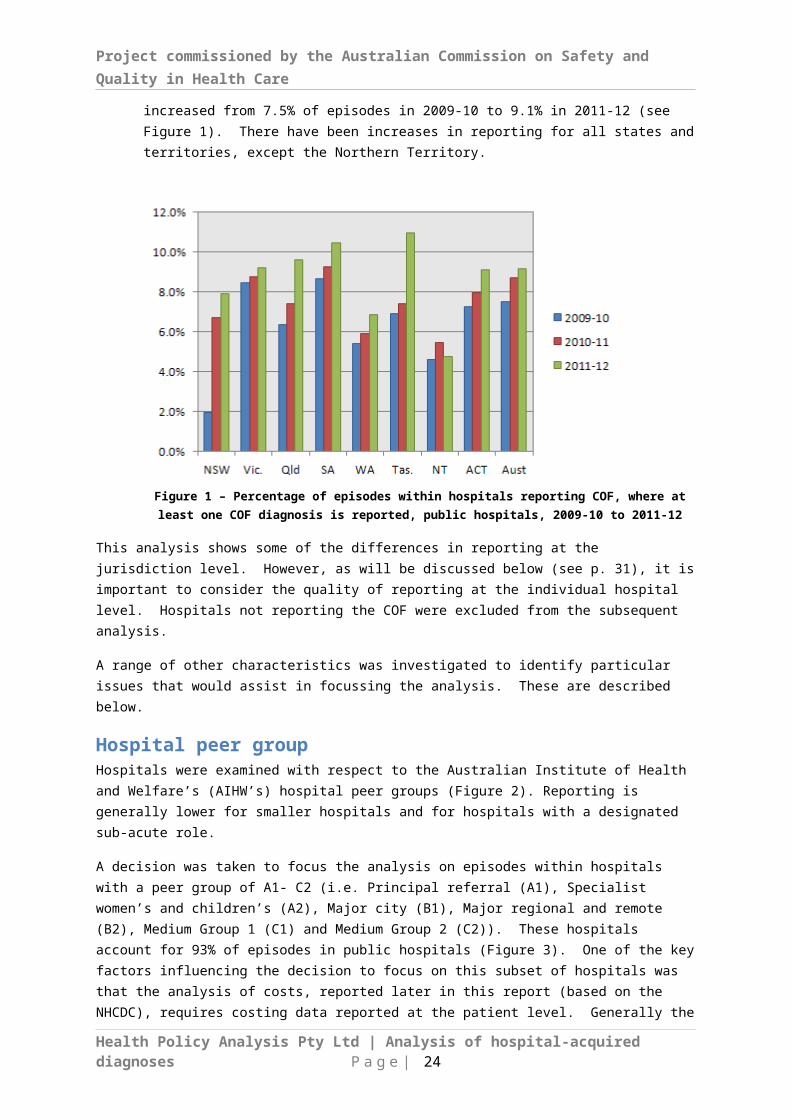
Project commissioned by the Australian Commission on Safety and Quality in Health Care
Excluding hospitals not reporting the COF was necessary for the analysis to be conducted.
Patient level cost data (i.e. as opposed to cost modelled data), which was necessary for the analysis of the impact of COF on cost, was not available for the majority of private hospitals.
Patient level cost was also not available for many hospitals outside the peer groups A1, A2, B1, B2, C1 or C2.
While some patient level cost data is available for sub and non-acute episodes, its quality is mixed.
Table 8 shows that applying the exclusion criteria to the APC NMDS results in the identification of 194 public hospitals with 4.5 million episodes. Within the NHCDC, there were 157 hospitals that met these criteria (81% of the APC hospitals) and 3.9 million episodes (88% of the APC episodes). When analysed by state and territory, the NHCDC sample as a proportion of the APC ranges from around 77% of episodes to 100% of episodes.
Table 8 –National Hospital Cost Data Collection (NHCDC) hospitals and episodes as a proportion of the Admitted Patient Care (APC) NMDS, within initial exclusions applied,
2011-12
Note: see ’Initial exclusions’ (p. 26) for details of exclusions applied.
The following chapter, which explores the impact of COF diagnoses on AR-DRG assignment, is based on analysis of the NHCDC data after applying the initial exclusion criteria discussed earlier (p. 26).
For the estimated impact of COF diagnoses on cost, the project was required to focus on a subset of conditions/procedures and associated AR-DRGs. These conditions and procedures, which were specified by the Commission at the outset of the project, were identified based on criteria including the volume of activity, the costs of activity and the current priority areas for the Commission. These conditions and associated AR-DRGs are shown in Table 9.
Health Policy Analysis Pty Ltd | Analysis of hospital-acquired diagnoses P a g e | 31

Project commissioned by the Australian Commission on Safety and Quality in Health Care
Table 9 – Conditions and procedures for which cost and length of stay impacts of COF diagnoses were estimated
All NHCDC episodes were first regrouped to AR-DRG version 6.0x excluding the COF diagnoses (see discussion in next Chapter). Episodes grouped to the AR-DRGs shown in Table 9 above were then selected for the sample. Hospitals and episodes that did not meet the criteria discussed previously were also excluded from the sample (see p. 26). After applying these steps, there were 406,401 episodes remaining in the sample.
As shown in Table 10, of these episodes, 16.8% had at least one COF diagnosis reported (after data cleaning). Episodes with COF diagnosis had an average of 2.24 COF diagnosis codes per episode. For episodes assigned to the surgical/procedural AR-DRGs of interest, 29.5% had at least one COF diagnosis reported, with an average 2.49 COF diagnosis codes per episode. For episodes assigned to medical AR-DRGs of interest, 10.8% had at least one COF diagnosis, with an average of 1.91 COF diagnoses for these episodes.
Compared with the total APC dataset, the episodes analysed in this sample tend to have a higher level of reporting of COF diagnoses (16.8% vs. 10.0%) and a higher mean
Health Policy Analysis Pty Ltd | Analysis of hospital-acquired diagnoses P a g e | 32

Project commissioned by the Australian Commission on Safety and Quality in Health Care
number of diagnoses with a COF of onset during the hospital stay per episode (2.24 vs. 2.19).
There was a wide level of variation between individual ADRGs. This could be a reflection of a combination of the complexity of the conditions and the length of stay. For example, over 70% of episodes with the Coronary bypass ADRGs (F05, F06) had at least one COF diagnosis reported, compared with 1.8% of episodes with Chest pain (ADRG F74). Chest pain episodes tend to have shorter lengths of stay and are assigned to this ADRG because the patient has not undergone a procedure.
While not shown here, episodes assigned to AR-DRGs with a higher level of complexityf had a higher proportion of episodes with at least one COF diagnosis and a higher average number of COF diagnoses per episode.
Table 10 – Presence of COF diagnoses in episodes assigned to the ADRGs of interest to the Commission, NHCDC sample with initial exclusions applied, 2011-12
* After application of data cleaning algorithm
f That is, level A in ADRGs with a two level split, and level A and B in DRGs with a three level split. The only exception was that the level D AR-DRG in the Stroke ADRG (B70) had a slightly higher proportion of COF diagnoses and a higher average number of COF diagnoses per episode than the C level AR-DRG.
Health Policy Analysis Pty Ltd | Analysis of hospital-acquired diagnoses P a g e | 33
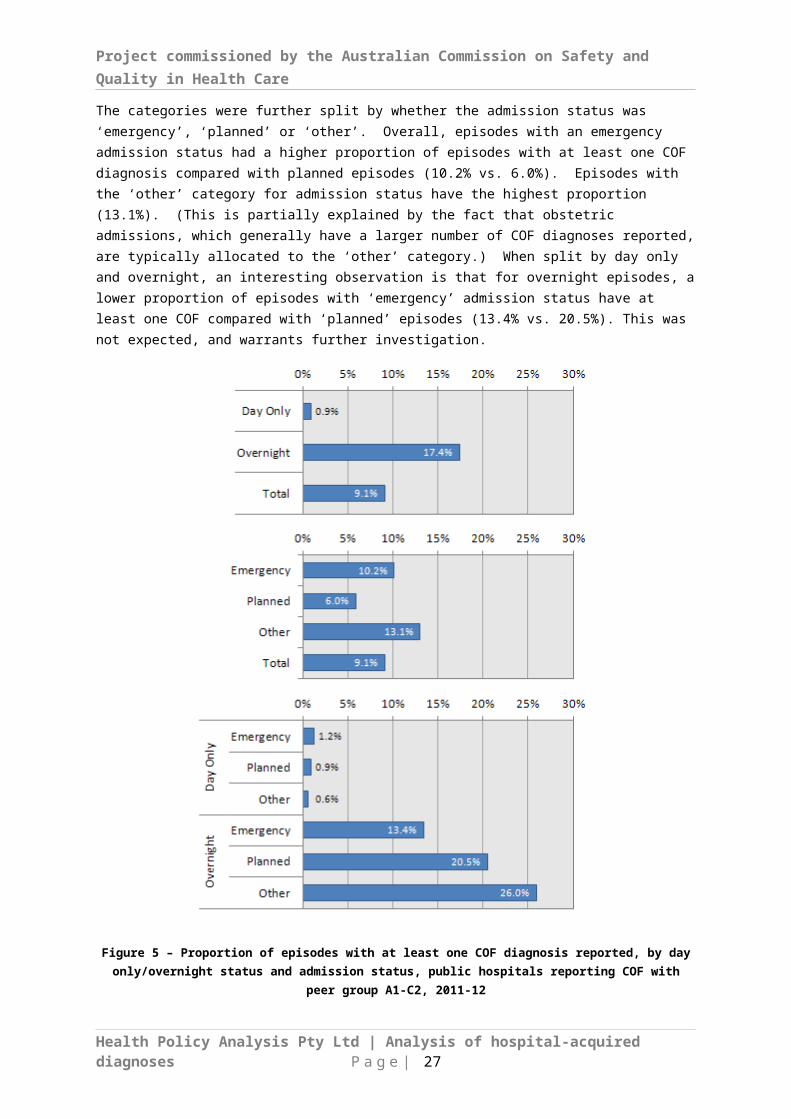
55. Impact of hospital-acquired diagnoses on AR-DRG assignmentThis Chapter examines the impact of the change to AR-DRG assignment once hospital-acquired diagnoses are removed from each episode of care. This analysis illustrates one of the potential implications of implementation of a policy similar to that adopted by the US Medicare system, where potentially preventable complications are removed from DRG assignment (Pronovost et al., 2008).
The analysis conducted was focussed on the NHCDC sample, which included approximately 4 million episodes. While a pre-existing AR-DRG was available in the data, episodes were first regrouped to AR-DRG Version 6.0x, using all available data items. This was to ensure the changes did not reflect differences in the grouping process. The episodes were then regrouped removing the following data:
a. All additional diagnoses with a COF indicating onset during the admitted episode of care (i.e. flag of ‘1’). Within the dataset, there were some principal diagnoses with a COF of 1. In these cases the original principal diagnosis was retained for grouping purposes. National coding standards indicate that principal diagnosis, other than for neonates, should not be assigned a COF of 1.
b. All additional diagnoses flagged as false negatives by the data cleaning algorithm. (These related exclusively to obstetric and neonatal diagnoses). (Note that false positives were ‘un-flagged’, and therefore not removed from the data for regrouping purposes.)
c. Procedures that result in episodes being allocated to tracheostomy and ventilation AR-DRGs (A06A, A06B, A06C and AO6D). This step was undertaken as a result of literature that indicates that many episodes with very significant hospital-acquired conditions are likely to end up in these AR-DRGs (e.g. see McNair, Borovnicar, Jackson, & Gillett, 2009). Removing these procedures ensured that episodes were allocated to AR-DRGs reflecting the removal of the COF diagnoses rather than being driven by the tracheostomy and ventilation procedures (which may or may not have been necessitated by the hospital-acquired condition).
The resulting AR-DRG assigned was compared with the original to determine whether there was a change in the Adjacent DRG (ADRG) or a change in DRG levels within the ADRG. Table 11 summarises the results. Overall there was a change in AR-DRG for 3.1%
Health Policy Analysis Pty Ltd | Analysis of hospital-acquired diagnoses P a g e | 34
Project commissioned by the Australian Commission on Safety and Quality in Health Care
of episodes. Of these, 0.2% involved a change in ADRG and 2.9% of episodes involved a change in ADRG levels.
Table 11 – Number episodes for which there was a change in AR-DRG following regroupingexcluding condition onset diagnoses, NHCDC, 2011-12
The results show that overall, there was a change in AR-DRG for 3.1% of episodes. This was made up of 0.2% episodes being grouped to another ADRG, and 2.9% of episodes changing severity level within an ADRG block. Therefore, close to 97% of episodes did not result in a changed AR-DRG once the diagnosis(es) being reported as onset during the hospital stay was removed. There are a number of reasons for this:
Of the 708 AR-DRGs in version 6.0x, 148 (21%) only have a single severity level (i.e. those with a ‘Z’ suffix).
Of the approximately 19,500 valid ICD-10-AM diagnosis codes, just over 3,000 are recognised as CCs (i.e. have a CCL value of greater than zero) for neonates and just under 3,000 codes are recognised as such for all other patients in the AR-DRG grouper. Also, although an additional diagnosis might be recognised as a CC, the severity level is overwritten with a zero if 1) the CC is part of definition of the ADRG (e.g. multiple trauma); 2) it is closely related to the principal diagnosis; or 3) it is already on the record (i.e. duplicate code).
It is possible that the removal of COF diagnoses does not significantly alter AR-DRG assignment because the ‘remaining’ patient diagnoses ensure the episode stays in the higher complexity AR-DRG. That is, patients with more comorbidities may be more likely to have a COF diagnosis, and these comorbidities contribute to the AR-DRG assignment more significantly than the COF diagnoses.
Procedures are retained in the re-assignment process, whether or not they are necessitated by a hospital-acquired diagnosis. Procedures determine AR-DRG assignment in 364 of the 708 (51%) AR-DRGs in version 6.0x. With the current data collection specifications and standards used in Australia (and comparable countries), it is not possible to directly link the provision of a particular procedure with any diagnosis(es), including those that are acquired during a hospital stay. Therefore, an implicit assumption in this analysis (and prior analyses of similar data e.g. Jackson et al., 2011, Fuller et al., 2009, Zhan & Miller, 2003) is that procedures are not related to diagnoses that were flagged as hospital-acquired (except in the case of tracheostomy and ventilation). Although it may be possible to link individual procedures to specific diagnoses, this would require considerable investment in conceptualising and researching the issue, and in developing relevant data standards (including education in applying these).
Health Policy Analysis Pty Ltd | Analysis of hospital-acquired diagnoses P a g e | 35
Project commissioned by the Australian Commission on Safety and Quality in Health Care
Table 12 highlights the twenty ADRGs in which there was the greatest proportion of episodes that either changed ADRG or the level within an ADRG.
The tracheostomy/ventilation AR-DRGs account for the vast majority of changes in ADRGs. (Note that the tracheostomy and ventilation procedures may or may not have been necessitated by a hospital-acquired diagnosis. See c, page 34 above.) In terms of episode numbers, the vaginal delivery AR-DRGs account for the largest shifts between levels within an ADRG. Otherwise, ADRGs with significant changes are mainly surgical/procedural.
Table 12 – ADRGs where there was a significant change in AR-DRG following regroupingexcluding condition onset diagnoses, NHCDC, 2011-12
In short, there are several limitations of examining the effect of hospital-acquired conditions on case complexity and AR-DRG grouping. The classification system is not particularly sensitive to factoring in additional diagnoses (whether they are pre-existing or hospital-acquired). In addition, only the removal of hospital-acquired conditions is possible. Procedures that are the result of hospital-acquired conditions are not specifically identified, and these may be driving AR-DRG assignment.
Health Policy Analysis Pty Ltd | Analysis of hospital-acquired diagnoses P a g e | 36

66. Impact on cost and length of stayThis Chapter shows the results of the impact of the presence of COF diagnoses on cost and length of stay (within the selected AR-DRGs).
MethodsAppendix 4 provides a review of some of the methodological issues in estimating the impact of hospital-acquired conditions on cost and length of stay. This review has a number of implications for the current study with respect to:
a. The choice of outcome variables.
b. The choice of variables appropriate to incorporate into the model to control for other factors which may independently influence cost and length of stay (to address selection bias).
c. Methods for addressing endogeneity bias, in particular the potential that it is the length of stay (which is closely correlated with cost) that increases the probability that a hospital-acquired condition will occur.
d. Approaches to test for the potential impact of differences in the quality of coding on the results.
Within the scope of this study only the first of these two issues could be adequately addressed. Within the literature there only a few studies that attempt to explicitly address endogeneity bias, but most do not explicitly tackle this issue. The studies that have addressed endogeneity bias are those focussed on a particular hospital-acquired condition, rather than the broad range of all hospital-acquired conditions. While an attempt was made to implement relevant methods for this project, these were not able to yield reasonable results within the timeframe and scope of the project. As there was insufficient time to test alternative model specifications, the project has focussed on applying an approach that addresses the potential for selection biases.
In addition, there was insufficient time available to test the impact of differences in the quality of coding, although methods were developed to tackle this issue.
A set of models were estimated using the general approach adopted by Jackson et al. (2013, under review), but with some enhanced approaches to various issues, including:
The models were estimated separately for each ADRG (AR-DRG version 6.0x) assigned after the removal of COF diagnoses. This means that hospital-acquired conditions did not influence ADRG assignment.
To control for within-ADRG heterogeneity, the Patient Clinical Complexity Level (PCCL) (also assigned after the removal of COF diagnoses) was introduced as a
Health Policy Analysis Pty Ltd | Analysis of hospital-acquired diagnoses P a g e | 37

Project commissioned by the Australian Commission on Safety and Quality in Health Care
control variable within the model along with a range of other controls (see discussion below).
The hospital from which each observation was drawn was introduced as a repeated measures variable.
The models estimated took the following forms:
(1)
(2)
(3)
(4)
(5)
(6)
(7)
(8)
Where:
Cost i is the patient level cost for episode i.
LOSi is the length of stay for episode i.
is an intercept.
COF i is a dummy variable indicating the presence of at least one COF diagnosis for episode i.
MCHADx j is a vector of dummy variables reflecting the presence of major CHADx groups.
SMCHADx j is a vector of dummy variables reflecting the presence of 33 selected CHADx groups.
CHADx j is a vector of dummy variables reflecting the presence of CHADx classes. There are 145 individual CHADx classes, although the 27 classes in CHADx Groups 11 to 13 were not relevant to the current study, and were grouped together.
I 21 is the coefficient for COF i and represents the marginal impact of the presence of at least one COF diagnosis on cost or length of stay.
I 2 j is a vector coefficients related to each group within MCHADx∧CHADx jand represents the marginal impact of the presence of at least one COF diagnosis within the group/class on cost or length of stay.
Health Policy Analysis Pty Ltd | Analysis of hospital-acquired diagnoses P a g e | 38
Project commissioned by the Australian Commission on Safety and Quality in Health Care
In addition, to estimate for major CHADx groups and each CHADx class, costs were estimated for a subset of CHADx groups (models A3 and B3).
Each model was estimated first with all episodes, including same day episodes (with a dummy variable flagging the episode was same day), and secondly removing same day episodes. The results presented below focus on the models related to overnight episodes (i.e. those with at least an overnight stay in hospital).
Each of the models was first estimated using Ordinary Least Square (OLS). However, given the issues related to the skewed nature of cost and length of stay data, the models were also estimated using a generalised linear model (GLM) with a gamma distribution using a log link function. This approach has been recommended and applied with respect to skewed cost and length of stay data. With this functional form, the dependent variable (C osti or LOSi) is related to the independent variables through a link function, in this case a log link function. The following equation illustrates how in this functional form cost is related to the independent variables for the equivalent of Model A2:
(9)
This means that the parameter estimates (the I 2 j‘s), cannot be directly interpreted as cost or length of stay effects. The predicted impact of a particular hospital-acquired condition will vary, according to the presence of other explanatory variables, including other hospital-acquired conditions. To estimate the incremental effects on cost and length of stay, the estimated parameters from the model were used to compare the predicted cost/length of stay for the uncomplicated case (i.e. with the predicted cost and length of stay with the presence of a particular COF diagnoses (i.e. ). This difference was calculated for each episode in the sample and then mean and median effects calculated across the sample.
Some extreme values were identified influenced by extreme costs for some episodes. For example one episode with a cost in excess of $700,000 was identified with a COF diagnosis related to pulmonary embolism. Given the potential for some of the extreme results to impact estimates, median estimates appear to be a better representation of the results.
To control for hospital level effects, we included the hospital identifier as a repeated measures variable in both the OLS and GLM models. This approach removes the impact of variations in efficiency across hospitals (or jurisdictions) from the estimates of the effects of the presence of COFs.
Control variablesEach of the models controlled for a range of factors that potentially impact the comparability between patients who are recorded with hospital-acquired diagnoses, and those without. These were introduced into the models either as control variables, or as repeated measures variables.
Adjacent DRG (ADRG): As discussed above, models were separately estimated for each ADRG. In this case this was the ADRG based on the AR-DRG version 6.0x assigned to the episodes, not taking into account condition onset diagnoses. We excluded from
Health Policy Analysis Pty Ltd | Analysis of hospital-acquired diagnoses P a g e | 39

Project commissioned by the Australian Commission on Safety and Quality in Health Care
the grouping algorithm both COF diagnosis prior to and after data cleaning. The reason for taking this approach is that the presence of COF diagnoses is the variable of interest, therefore modelling should not control for these factors. We considered modelling separately for each AR-DRG 6.0x, but decided instead to model at the ADRG level and introduce the PCCL assigned to the episode (which was assigned also not taking into account condition onset diagnoses). We believed this approach would more accurately control for differences in severity within the ADRG.
The advantage in modelling each ADRG separately, is that certain COFs will have a more significant effect for some DRGs and may not be relevant for other DRGs.
Patient Clinical Complexity Level (PCCL): PCCL is assigned to each episode and is the outcome of the impact of severity scores given to individual diagnoses. It is represented as a score on a scale of 0-4. The PCCL is used to assign episodes with an ADRG to an AR-DRG. However, not all the information within the PCCL is always utilised in the assignment. We decided to include the PCCL (assigned when COF diagnoses are not taken into account) as a control variable, rather than model AR-DRGs separately. PCCL can be thought of as a measure of complexity. The level was introduced as a ‘class’ variable with parameters estimated for each level separately.
Patient age: In preliminary analysis we found that within AR-DRGs, age has an important impact on both length of stay and the likelihood of a COF diagnosis. Age is introduced into the model as a set of dummy variables for the following age groups: 0-14 years, 15-44 years, 70-84 years, 85+ years with the base case being episodes where the patient is aged 45-69 years.
Emergency admission status: In preliminary analysis we found that there were significant differences between emergency and elective episodes in terms of presence of COF diagnoses and length of stay. Therefore, this was introduced as a dummy variable.
Episodes with a discharge status of death: A dummy variable was introduced for these episodes. Episodes ending in death often have shorter lengths of stay and lower costs, but may be impacted by hospital-acquired conditions.
Episodes transferred within less than 2 days (excluding same day episodes): A dummy variable was introduced for these episodes. These episodes have shorter lengths of stay and lower costs, but are often found within ADRG where typically lengths of stay are much longer and costs are higher. In many instances, these patients have been transferred to a referral hospital as a result of the seriousness of their condition.
Same day episodes: A dummy variable was introduced for these episodes. As discussed above, each model was also estimated excluding same day episodes. The presence of COF for same day episodes was much lower. It was found that the models estimated with same day episodes resulted in very similar parameter estimates to those estimated excluding same day episodes. Consequently in the results presented below we have presented results for the models excluding same day episodes.
Health Policy Analysis Pty Ltd | Analysis of hospital-acquired diagnoses P a g e | 40

Project commissioned by the Australian Commission on Safety and Quality in Health Care
Sample characteristicsEach model was estimated using the 406,401 episodes meeting the criteria discussed above, of which 342,230 were related to overnight stays. Table 13 describes some of the key characteristics of the sample with respect to the various control variables discussed. A large proportion (74.4%) had an admission status of ‘emergency’. Around 16% were same day admissions, 3.2% involved a transfer with a length of stay of less than 2 days, and 2.3% ended with the patient dying during the episode.
The ADRGs for the sample have been previously described in Table 10. Overall, 16.8% of the sample had at least one COF diagnosis reported (after applying the data cleaning algorithm). However, there are significant variations between ADRGs in the proportion of episodes with COF diagnoses.
Table 13 – Characteristics of the NHCDC sample, based on selected hospitals and AR-DRGs of interest
n %
Total Episodes 406,401 100.0%Any CoF diagnosis* 68,343 16.8%
PPCL:0 232,220 57.1%1 2,255 0.6%2 47,577 11.7%3 59,787 14.7%4 64,562 15.9%
Emergency Admission Status 302,423 74.4%Day only admissions 64,171 15.8%Transfer in < 2 days 13,051 3.2%Episode ends with death 9,262 2.3%Age Group:
00-14 years 10,280 2.5%15-44 years 77,462 19.1%45-69 years 159,580 39.3%70-84 years 116,737 28.7%85 years + 42,342 10.4%
General CharacteristicsTotal sample
Source: NHCDC 2011-12, subset of selected hospitals and AR-DRGs.Note: * Refers to any COF diagnosis after data cleaning algorithm has been applied.
Table 14 shows the number of episodes with specific major CHADx groups being identified. Overall, 16.8% of the sample had at least one COF diagnosis. Around 4.9% of the sample had a cardiovascular complication reported, 3.9% had metabolic complications, and 3.7% had post procedural complications.
Health Policy Analysis Pty Ltd | Analysis of hospital-acquired diagnoses P a g e | 41

Project commissioned by the Australian Commission on Safety and Quality in Health Care
Table 14 – Number of episodes in which a major CHADx group was present, basedon selected hospitals and selected AR-DRGs
n %
Total Episodes 406,401 Any CoF diagnosis 68,343 16.8%Major CHADx Group:
01 Post-procedural complications 14,922 3.7%02 Adverse drug events 6,931 1.7%03 Accidental injuries 2,563 0.6%04 Specific infections 2,002 0.5%05 Cardiovascular complications 19,915 4.9%06 Respiratory Complications 9,317 2.3%07 Gastrointestinal Complications 12,396 3.1%08 Skin Conditions 5,514 1.4%09 Genitourinary Complications 10,769 2.6%10 Hospital-acquired Psychiatric states 6,622 1.6%11-13 Early Pregnancy, Labour etc 52 0.0%14 Haematological Disorders 6,378 1.6%15 Metabolic Disorders 15,696 3.9%16 Nervous System Complications 1,955 0.5%17 Other Complications 14,026 3.5%
Total sampleMajor CHADx Groups
Source: NHCDC 2011-12, subset of selected hospitals and AR-DRGs.Note: Refers to any COF diagnosis after data cleaning algorithms have been applied.
Health Policy Analysis Pty Ltd | Analysis of hospital-acquired diagnoses P a g e | 42

Project commissioned by the Australian Commission on Safety and Quality in Health Care
Table 15 shows the most common of the CHADx classes within the sample.
Table 15 – Top 20 CHADx classes by number of episodes in which COF diagnoses were present,
based on selected hospitals and selected AR-DRGs
Source: NHCDC 2011-12, subset of selected hospitals and AR-DRGs.Note: Refers to any COF diagnosis after data cleaning algorithms have been applied.
The proportion of episodes with particular major CHADx groups or CHADx classes varies significantly across the ADRGs, as is illustrated in able 16. As might be expected, post procedural complications are more common for the surgical/procedural ADRGs. However, other complications are also more common for the surgical/procedural ADRGs, including cardiovascular, respiratory, gastrointestinal, genitourinary and haematological.
Health Policy Analysis Pty Ltd | Analysis of hospital-acquired diagnoses P a g e | 43

Project commissioned by the Australian Commission on Safety and Quality in Health Care
Table 16 – Proportion of episodes in which Major CHADx groups are reported, by ADRG, based on selected hospitals and selected AR-DRGs
01 Post-proced-
ural comp.
02 Adverse
drug events
03 Accidental
injuries
04 Specific infections
05 Cardio-vascular
comp.
06 Respir-atory Comp.
07 Gastro-intestinal
Comp.
08 Skin Condition
s
09 Genito-urinary Comp.
10 Hospital-acquired
psych. states
11-13 Early
Pregnancy, Labour
etc
14 Haemat-ological
Disorders
15 Metabolic Disorders
16 Nervous System Comp.
17 Other Comp.
% % % % % % % % % % % % % % %
B02 Cranial Procedures 15.7 3.2 1.8 2.3 14.5 7.7 8.4 4.5 10.3 7.7 0.1 3.9 15.7 9.0 17.3
B70 Stroke and Other Cerebro-v 1.5 1.8 1.2 1.1 5.6 3.4 3.9 2.3 5.5 2.7 0.0 0.4 4.4 0.8 5.2
E62 Respiratory Infections/ In 0.9 1.9 0.7 0.7 4.3 2.0 2.9 1.6 2.0 1.4 0.0 0.8 3.9 0.2 2.6
E65 Chronic Obstructive Airway 0.6 1.9 0.8 0.6 3.1 1.5 2.3 1.1 1.4 1.2 0.0 0.3 2.7 0.2 2.9
F05 Coronary Bypass W Invasive 30.7 4.9 0.8 1.4 41.5 23.8 11.6 4.7 14.3 7.5 0.0 16.9 29.7 1.8 10.0
F06 Coronary Bypass W/O Invasi 24.4 4.0 0.9 1.0 41.2 25.4 8.8 3.0 12.4 6.8 0.0 14.6 27.3 1.8 8.9
F07 Other Cardio-thoracic/Vasc 26.8 5.3 0.6 2.0 40.2 27.3 11.2 4.7 13.6 5.8 0.1 16.2 32.9 2.2 15.2
F10 Intervent-ional Coronary P 10.7 2.1 0.3 0.3 10.4 2.3 2.8 0.9 2.5 1.2 0.0 0.9 3.5 0.3 4.6
F14 Vascular Procedures Except 9.6 1.6 0.4 0.4 5.2 1.6 1.8 1.3 2.2 0.9 0.0 1.5 3.4 0.4 3.0
F41 Circulatory Disorders W AM 5.8 1.8 0.3 0.3 6.0 1.5 2.1 0.8 2.0 0.9 0.0 0.7 2.5 0.3 3.1
F42 Circulatory Disorders W/O 3.6 0.8 0.1 0.1 2.8 0.5 0.7 0.4 0.7 0.3 0.0 0.2 1.1 0.1 1.9
F62 Heart Fai lure and Shock 1.2 2.5 1.1 0.5 5.6 2.1 3.0 1.8 3.9 1.4 0.0 0.6 4.8 0.4 3.1
F74 Chest Pain 0.1 0.3 0.1 0.0 0.5 0.1 0.2 0.1 0.1 0.1 0.0 0.0 0.1 0.0 0.5
G02 Major Small and Large Bowe 26.9 4.1 0.9 2.8 17.4 10.8 15.0 4.8 10.5 5.4 0.0 7.5 20.9 0.9 9.3
H08 Laparo-scopic Chole-cystec 5.2 0.8 0.1 0.2 2.6 1.5 2.4 0.5 1.4 0.5 0.0 0.3 2.0 0.1 2.2
I03 Hip Replace-ment 10.9 4.4 1.1 0.8 17.7 7.0 9.3 4.8 10.4 7.1 0.0 14.3 13.6 0.7 10.4
I04 Knee Replace-ment 9.0 3.9 1.0 0.3 11.2 4.0 7.7 3.1 5.5 3.1 0.0 8.7 7.5 0.3 9.1
I31 Hip Revision 17.4 5.7 2.1 1.2 21.0 5.5 9.3 6.1 9.1 5.4 0.0 20.5 14.2 0.5 12.0
I68 Non-surgical Spinal Disord 0.3 1.5 0.4 0.2 1.2 0.7 2.4 0.7 1.6 1.0 0.0 0.2 1.2 0.2 1.5
N04 Hyster-ectomy for Non-Mali 7.9 1.6 0.2 0.2 4.0 1.8 6.3 1.3 3.4 0.5 0.0 2.3 2.8 0.1 4.5
U61 Schizo-phrenia Disorders 0.2 1.4 1.2 0.4 1.2 1.1 2.0 1.0 0.9 1.9 0.0 0.1 0.8 0.5 3.0
U63 Major Affective Disorders 0.5 1.5 1.8 0.5 1.6 1.2 2.5 1.1 1.2 2.5 0.0 0.1 1.2 0.7 3.6Source: NHCDC 2011-12, subset of selected hospitals and AR-DRGs.
Note: Refers to any COF diagnosis after data cleaning algorithms have been applied.
Health Policy Analysis Pty Ltd | Analysis of hospital-acquired diagnoses P a g e | 44
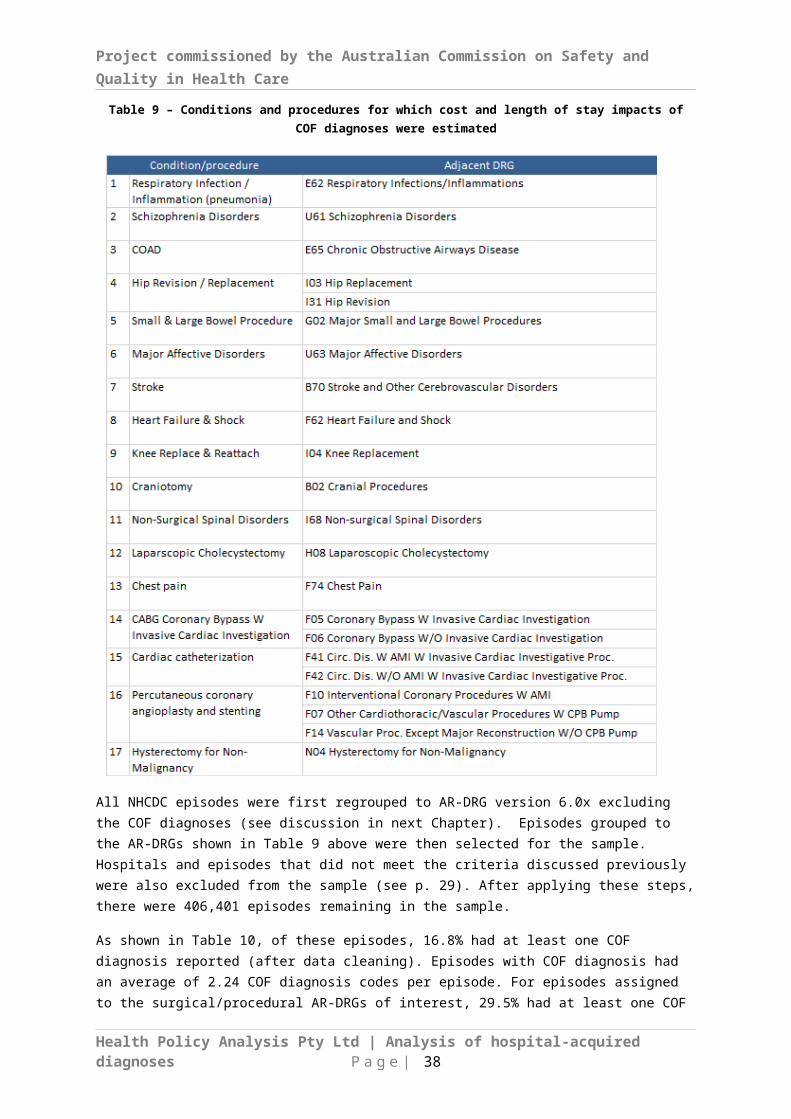
Project commissioned by the Australian Commission on Safety and Quality in Health Care
ResultsThe tables below present estimates of incremental effects of hospital-acquired conditions on cost and length of stay, based on the GLM models. As the modelled cost and length of stay effects will vary between episodes based on a range of characteristics, both the mean and median of the predicted effects have been presented. For comparison we have also presented the results of the OLS models.
Detailed estimates are presented in Appendix 3, as shown in Table 17.
Table 17 – Models estimated and results
Model Hospital acquired conditionsmodelled as:
Impact ofCOF on:
Estimates of mean
incremental impact
Estimates of median
incremental impact
Model A1 Presence of any COF diagnosis Cost able 38, page 70 Table 41, page 77Model A2 Major CHADx groups Cost able 38, page 70 Table 41, page 77Model A3 Selected hospital acquired conditions Cost Table 39, page 72 Table 42, page 80Model A4 All CHADx classes Cost Table 40, page 74 Not presentedModel B1 Presence of any COF diagnosis Length of stay Table 43, page 82 Table 44, page 84Model B2 Major CHADx groups Length of stay Table 43, page 82 Table 44, page 84Model B3 Selected hospital acquired conditions Length of stay Not presented Not presentedModel B4 All CHADx classes Length of stay Table 40, page 74 Not presented
Only the results of models estimated for overnight episodes are shown. Results for models including same day episodes were very similar in most instances.
Across the sample, the mean cost for all episodes was $9,513 and the mean cost for overnight episodes was $11,061. Table 18 summarises the estimates of the cost of hospital-acquired conditions for Models A1 and A2. The distribution of modelled incremental costs is described in Figure 6. Some more detail on these models is provided in Table 19, together with an illustration of the estimated impacts for selected ADRGs.
For model A1, the mean estimated cost for the uncomplicated care was $9,268 (Table 19). The mean estimated impact of the presence of any COF diagnosis was $9,244 for the GLM model and $8,586 for the OLS model (Table 18). These estimates are relatively similar, but for other models, where a greater degree of specificity in the measurement of COF diagnoses was introduced, the OLS based estimates were typically greater than the GLM results.
The median GLM based estimate was $6,710 for each episode with at least one hospital-acquired condition (Table 18). The difference between the mean and median emphasises the skewed distribution of the estimates of impact, which was observed for all the models. This distribution is typically influenced by a relatively smaller number of very high cost cases.
Model A2 results include estimates at the major CHADx group level. Mean GLM estimated costs for these conditions vary from between $2,000 and $3,000 (e.g. 17 Other Complications, 15 Metabolic Disorders and 14 Haematological Disorders) up to over $6,000 (e.g. 01 Post-procedural complications, 04 Specific infections, 16 Nervous System Complications). The largest incremental costs are estimated for the specific infections which add an estimated $7,615 per episode.
Health Policy Analysis Pty Ltd | Analysis of hospital-acquired diagnoses P a g e | 45

Project commissioned by the Australian Commission on Safety and Quality in Health Care
Health Policy Analysis Pty Ltd | Analysis of hospital-acquired diagnoses P a g e | 46
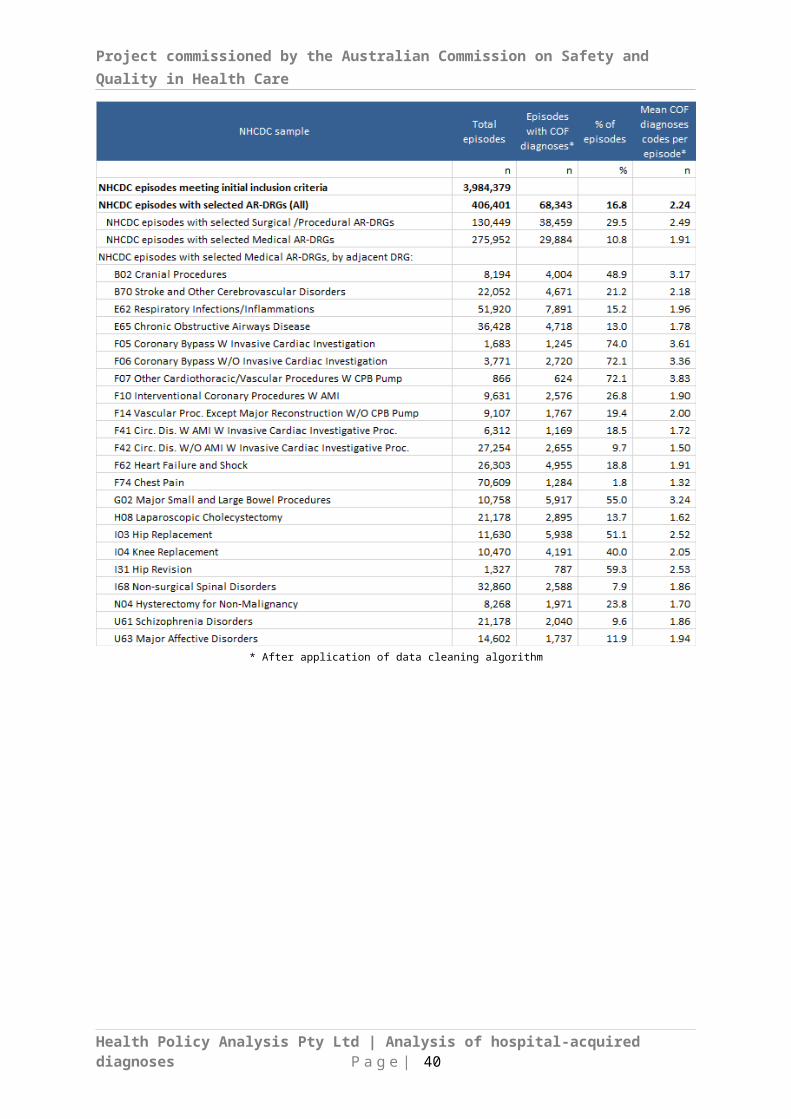
Project commissioned by the Australian Commission on Safety and Quality in Health Care
Table 18 – Estimates of the incremental cost of presence of hospital acquired conditions– Comparison Ordinary Least Squares and Generalised Linear Model (mean
and median) estimatesModels A1 and A2 - Overnight episodes
Health Policy Analysis Pty Ltd | Analysis of hospital-acquired diagnoses P a g e | 47
Project commissioned by the Australian Commission on Safety and Quality in Health Care
Figure 6 – Estimates of the incremental cost of presence of hospital acquired conditions – Distribution of predicted incremental costs derived from the GLM
approachModels A1 and A2 - Overnight episodes
Notes: In this chart, the box (rectangle) represents the interquartile range of predicted costs, with the line through the middle of the box representing the median value. The
diamond shape represents the mean predicted value. The ‘leaf’ components represent the values of 1.5 times interquartile range below the 1 quartile or above the 3rd quartile. Dot
points represent outliers outside these ranges.
The impact of the presence of hospital-acquired conditions varies across ADRGs (Table 19 and Table 20). For example, the GLM mean incremental cost of the presence of any COF diagnosis for episodes in the laparoscopic cholecystectomy ADRG was $3,195, but for the cranial procedures ADRG it was $26,450.
Health Policy Analysis Pty Ltd | Analysis of hospital-acquired diagnoses P a g e | 48

Project commissioned by the Australian Commission on Safety and Quality in Health Care
Table 19 – Estimates of the GLM based mean incremental costModels A1 and A2 - selected ADRGs – Overnight episodes
Note: Shaded values represent estimates based on a parameter which was not statistically significant.
Health Policy Analysis Pty Ltd | Analysis of hospital-acquired diagnoses P a g e | 49

Project commissioned by the Australian Commission on Safety and Quality in Health Care
Table 20 – Estimates of the GLM based mean incremental cost, length of stay and ADRGModel A1 – Overnight episodes
Health Policy Analysis Pty Ltd | Analysis of hospital-acquired diagnoses P a g e | 50
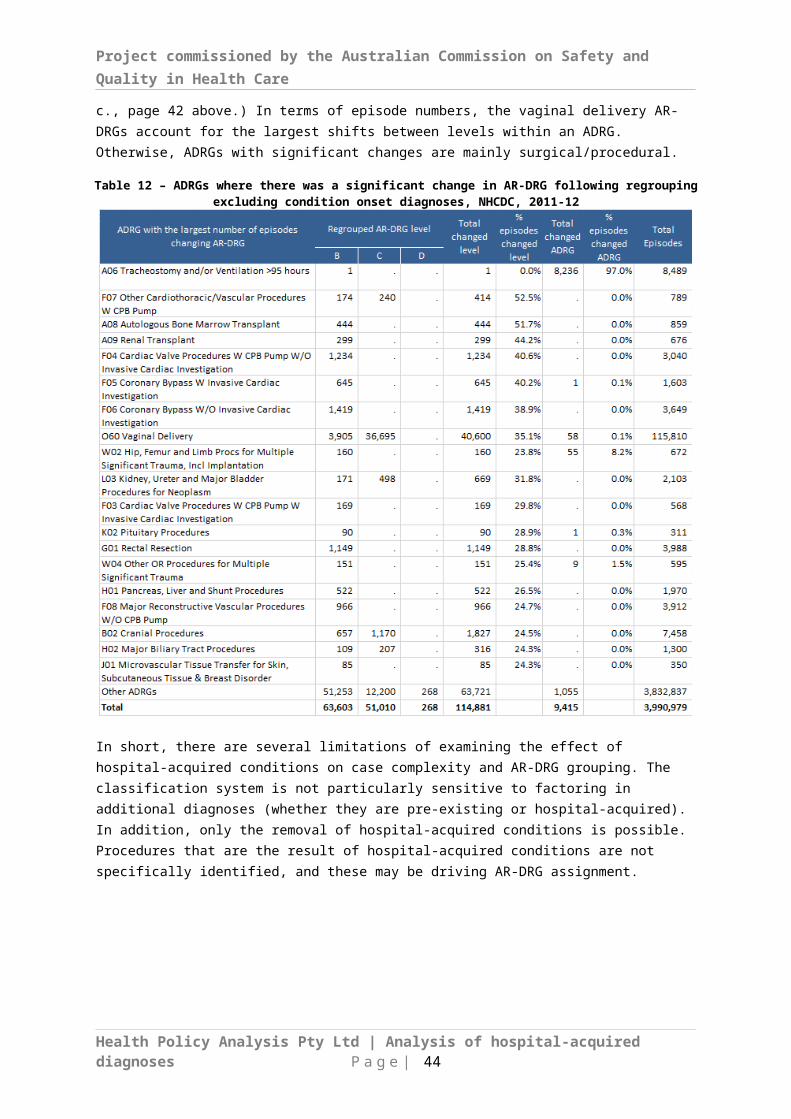
Project commissioned by the Australian Commission on Safety and Quality in Health Care
Table 21 presents GLM based mean and median estimates at a more detailed level. Because of low numbers, many of the parameters within the models were not statistical significant at this level. In some instances the estimated incremental cost is negative. This may reflect interactions with mortality related to the specific hospital-acquired condition. The Table reveals a range of specific hospital-acquired conditions with high incremental costs, including wound infection, pulmonary embolism, pressure ulcers, and Clostridium difficile. The estimates for urinary tract infection are also high, although the median estimates are much lower.
Table 21 – Estimates of the GLM based mean and median incremental costModel A3 - selected ADRGs – Overnight episodes
Table 22 presents the estimates of the incremental effect of hospital-acquired condition on overnight lengths of stay for Models B1 and B2. Overall the presence of a hospital-
Health Policy Analysis Pty Ltd | Analysis of hospital-acquired diagnoses P a g e | 51

Project commissioned by the Australian Commission on Safety and Quality in Health Care
acquired condition is estimated to add 5.3 days to a hospital stay, within the sample of AR-DRGs analysed.
Table 22 – Estimates of the GLM based mean incremental length of stayModels A1 and A2 - selected ADRGs – Overnight episodes
Note: Shaded values represent estimates based on a parameter which was not statistically significant.
Incremental cost and length of stay impacts of specific conditions were also estimated (Models A4 and B4, see Appendix 3, Table 40). These estimates revealed a number of conditions with a very high cost impact per episode. For some of these conditions (sepsis, gas embolism and complications of transplants), the number of occurrences in the sample was very low (estimates were suppressed for these conditions). Table 23 shows the estimated impact of other conditions with a high cost per episode impact. These ranged from between $9,208 for methicillin resistant agent to $15,032 for injury due to assault. The numbers of episodes with these conditions was between 17 and 967. As a consequence, the total cost impact of these conditions was not always very high relative to other conditions.
In contrast there were a number of other conditions which had relatively lower cost per episode impacts, but because there were larger numbers of the episodes, the total cost impact was very high. These are also shown in Table 23. Total cost impacts of these conditions ranged from $10.9 million for pressure ulcers (1,866 episodes) to $27.4 million for electrolyte disorders without dehydration (9,808 episodes). This perspective suggests that in setting priority for safety initiatives, it may be beneficial to consider conditions
Health Policy Analysis Pty Ltd | Analysis of hospital-acquired diagnoses P a g e | 52
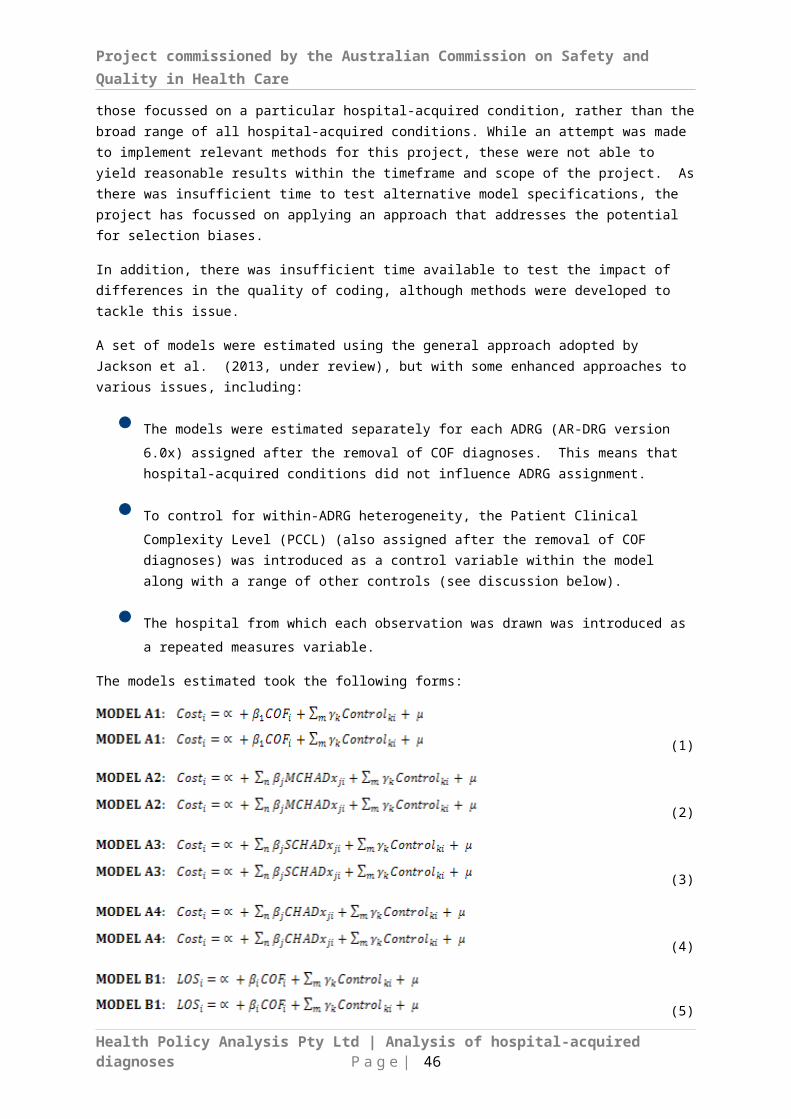
Project commissioned by the Australian Commission on Safety and Quality in Health Care
that have a relatively low cost impact on the individual episode of care, but may be very common. This view was supported in the literature (e.g. see Jackson et al., 2011).
Table 23 – Estimates of incremental impact of selected COF diagnoses on cost and length of stay, plus total cost impact of condition, selected ADRGs, NHCDC, 2011-12
Sector wide estimatesAn estimate was made of the total incremental impact of the presence of hospital-acquired conditions, both within the NHCDC sample and scaling this to reflect all acute episodes allocated to the selected ADRGs in public and private hospitals. The results are presented in Table 24. The Table also presents the total estimated costs associated with the sample ($3.87 billion for all episodes and $3.79 billion for overnight episodes) and the estimated costs across all hospital ($5.6 billion for all episodes and $5.47 billion for overnight episodes) reflecting all acute episodes allocated to the selected ADRGs. The Table also shows the estimated incremental cost for the sample and all hospitals (i.e. all acute episodes assigned to the selected AR-DRGs occurring across all public and private hospitals in Australia). (Table 37 in Appendix 2 shows the sample as a proportion of total episodes for the selected ADRGs and the weights used to derive the estimates for all hospitals.)
The incremental costs for the full set of episodes is very close to the estimates for models developed only for overnight episodes.
One important feature to note is that the model specification, and potentially its interpretation, has an important impact on the estimated incremental costs. In particular, Model A1, which is based on estimating the impact of the presence of any hospital-acquired condition, results in a higher estimate of incremental costs, compared with models designed to estimate the impact of groups of hospital-acquired conditions (Models A2-A4).
Health Policy Analysis Pty Ltd | Analysis of hospital-acquired diagnoses P a g e | 53
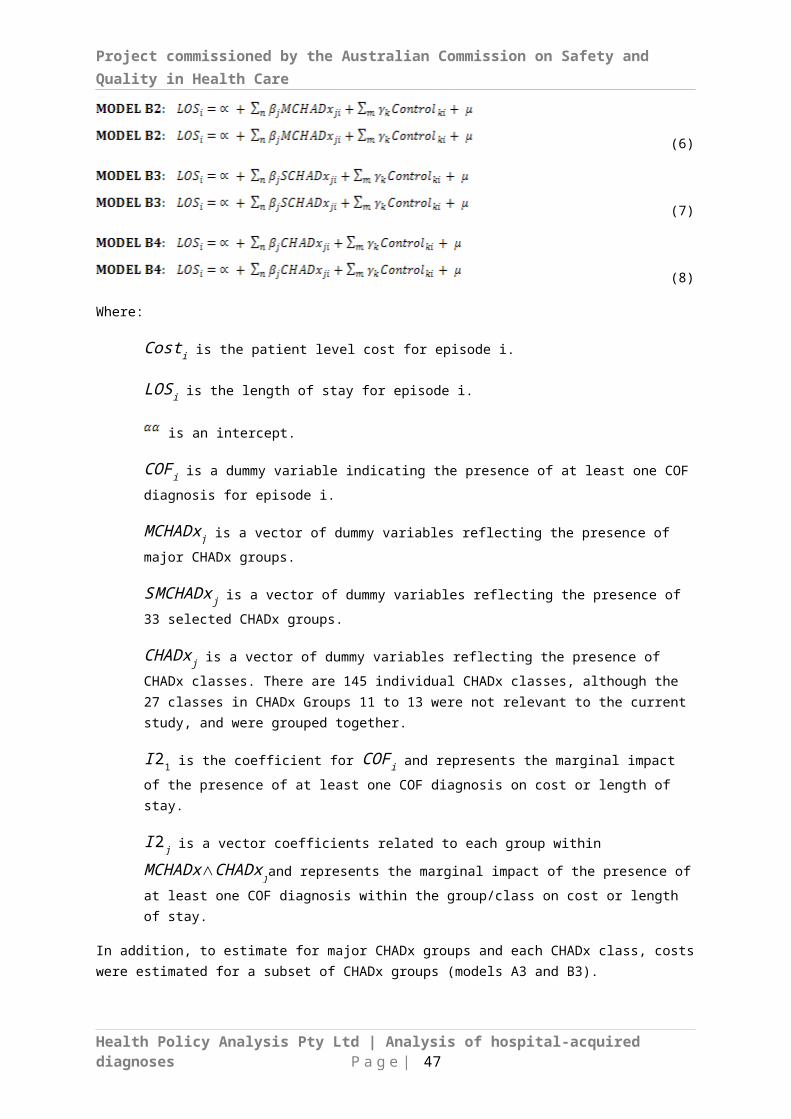
Project commissioned by the Australian Commission on Safety and Quality in Health Care
Overall, the models suggest that hospital-acquired conditions potentially explained between 12.0% and 16.5% of total costs within the sample and 11.6% and 15.9% of costs across all Australian hospitals, for the selected ADRGs. The estimates range from $453 million to $625 million in the sample, and $634 million and $869 million for all hospitals.
Table 24 – Estimates of impact across all acute episodes allocated to the relevant ADRGs
Health Policy Analysis Pty Ltd | Analysis of hospital-acquired diagnoses P a g e | 54

Appendix 1: Descriptive statistics
Table 25 – Reporting of COF by sector, APC NMDS, 2009-10 to 2011-12
Note: Private hospitals are grouped in data reported for several states and territories. Therefore, the ‘number of hospitals’ cannot be derived from the APC data for private hospitals. In this Table the number reflects the number of ‘entity codes’ reported in the NMDS. Private hospital data was
not available in the dataset for 2011-12 for NSW, SA,WA, Tas. NT, ACT.
Table 26 – Reporting of COF for private hospitals by state/territory, APC NMDS, 2009-10 to 2011-12
Note: Small cells have been supressed in this Table. Private hospitals are grouped in data reported for several states and territories. Therefore, the ‘number of hospitals’ cannot be derived from the
APC data for private hospitals. In this table the number reflects the number of ‘entity codes’ reported in the NMDS. Private hospital data was not available in the dataset for 2011-12 for NSW, SA,WA, Tas. NT, ACT. In all subsequent tables below, private hospitals have been excluded from
analysis.
Table 27 – Reporting of COF for public hospitals by state/territory, APC NMDS, 2009-10 to 2011-12
Health Policy Analysis Pty Ltd | Analysis of hospital-acquired diagnoses P a g e | 55
Project commissioned by the Australian Commission on Safety and Quality in Health Care
Table 28 – Reporting of COF by public hospitals by AIHW hospital peer group,public hospitals, APC NMDS, 2009-10 to 2011-12
Table 29 – Number of hospitals, total episodes and proportion of episodes with COF diagnosis reported at least once by AIHW hospital peer group, public hospitals reporting
COF, APC NMDS, 2009-10 to 2011-12
Health Policy Analysis Pty Ltd | Analysis of hospital-acquired diagnoses P a g e | 56

Project commissioned by the Australian Commission on Safety and Quality in Health Care
Table 30 – Total episodes and proportion of episodes with COF diagnosis reported at least once by care type,
public hospitals reporting COF, APC NMDS, 2009-10 to 2011-12
Table 31 – Proportion of newborn episodes reported with qualified days,public hospitals reporting COF, APC NMDS, 2009-10 to 2011-12
Table 32 – Unqualified baby episodes with at least one COF diagnosis report,public hospitals reporting COF, APC NMDS, 2009-10 to 2011-12
Health Policy Analysis Pty Ltd | Analysis of hospital-acquired diagnoses P a g e | 57

Project commissioned by the Australian Commission on Safety and Quality in Health Care
Table 33 – Total episodes and proportion of episodes with COF diagnosis reported at least once by day only/overnight status and admission status,
public hospitals reporting COF, APC NMDS, 2009-10 to 2011-12
Table 34 – Reporting of COF with all proposed exclusion applied, NHCDC 2009-10 to 2011-12
Health Policy Analysis Pty Ltd | Analysis of hospital-acquired diagnoses P a g e | 58
Project commissioned by the Australian Commission on Safety and Quality in Health Care
Table 35 – CHADx codes, after application of data cleaning algorithms, by CHADx Class,APC within initial exclusions applied, 2011-12
CHADx classesCHADx
codes after data
cleaning
% of all
CHADx
codes1.01 Complications of Infusion /Transfusion 2,215 0.3%1.02 Gas Embolism 21 0.0%1.03 Failed or Difficult Intubation 903 0.1%1.04 Other haemorrhage & haematoma complicating a procedure (not elsewhere classified)
10,982 1.3%
1.05 Accidental puncture/lac during procedure 5,705 0.7%1.06 Foreign body or substance left following procedure 105 0.0%1.07 Other complications of surgical and Medical NEC (including shock) 5,234 0.6%1.08 Disruption of wound 2,720 0.3%1.09 Wound infection (excluding sepsis) 4,511 0.5%1.10 Complications of cardiac and vascular implants (excluding sepsis) 11,169 1.3%1.11 Complications of genitourinary implants (excluding Septicaemia) 2,838 0.3%1.12 Complications of orthopaedic implants (excluding Septicaemia) 1,202 0.1%1.13 Complications of other implants (excluding Septicaemia) 4,082 0.5%1.14 Complications of Transplants 563 0.1%1.15 Complications of reattachment and amputations 181 0.0%1.16 Post-procedural disorders: Endocrine & Metabolic 126 0.0%1.17 Post-procedural disorders: Nervous system 1,048 0.1%1.18 Post-procedural disorders: Eye & Ear 228 0.0%1.19 Post-procedural disorders: Circulatory system 4,831 0.6%1.20 Post-procedural disorders: Respiratory system 4,263 0.5%1.21 Post-procedural disorders: Digestive system 5,304 0.6%1.22 Post-procedural disorders: Musculoskeletal system 240 0.0%1.23 Post-procedural disorders: Genitourinary system 2,354 0.3%2.01 Skin adverse effects due to systemic antibiotics, anti-infectives and other antiparasitics
2,113 0.2%
2.02 Other adverse effects due to Systemic antibiotics, anti-infectives and other antiparasitics.
3,620 0.4%
2.03 Nausea and vomiting due to antineoplastic drugs 231 0.0%2.04 Other adverse effects due to antineoplastic drugs 1,473 0.2%2.05 Coagulation defect due to drugs affecting blood constituents 503 0.1%2.06 Other adverse effects due to drugs affecting blood constituents 3,748 0.4%2.07 Nausea and vomiting due to opioids and related analgesics 1,024 0.1%2.08 Alterations to mental state due to opioids and related analgesics 2,009 0.2%2.09 Other adverse effects due to opioids and related analgesics 3,220 0.4%2.10 Adverse effects due to anaesthesia (Incl. misadventure) 898 0.1%2.11 Hypotension due to anaesthesia 575 0.1%2.12 Alterations to mental state due to anaesthesia 404 0.0%2.13 Other adverse effects due to drugs affecting the cardiovascular system 1,454 0.2%2.14 Hypotension due to drugs affecting the cardiovascular system 1,196 0.1%2.15 Adverse effects due to insulin & oral hypoglycaemics 140 0.0%2.16 Adverse effects due to other drugs 8,046 0.9%2.17 Anaphylactic shock due to correct drug properly administered 455 0.1%
Health Policy Analysis Pty Ltd | Analysis of hospital-acquired diagnoses P a g e | 59
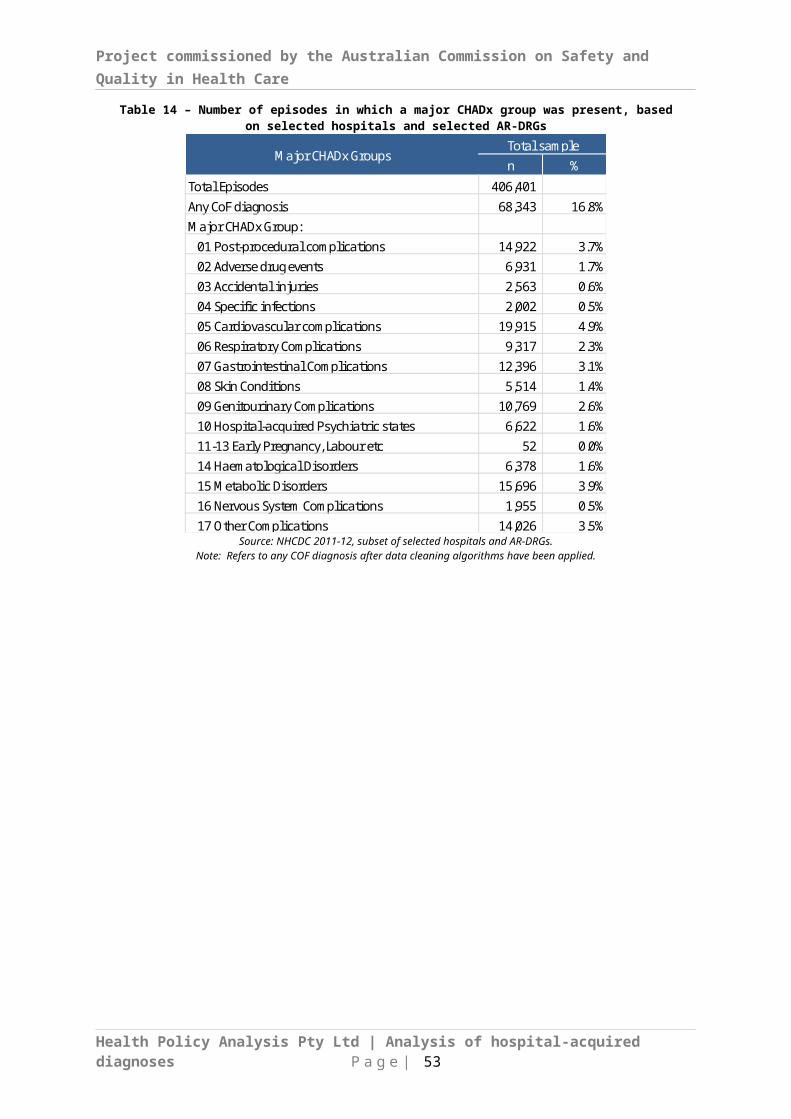
Project commissioned by the Australian Commission on Safety and Quality in Health Care
CHADx classesCHADx
codes after data
cleaning
% of all
CHADx
2.18 Accidental overdose of drug or wrong drug given or taken in error 729 0.1%3.01 Falls with fractured femur 286 0.0%3.02 Falls with intracranial injury 295 0.0%3.03 All other falls 8,453 1.0%3.04 Injury due to assault 204 0.0%3.05 Other patient accidents (exc poisoning) 4,169 0.5%4.01 Sepsis 8 0.0%4.02 Mycoses 6,226 0.7%4.03 Methicillin resistant agent 607 0.1%4.04 Other drug resistant infections 1,677 0.2%4.05 Other infectious agents 1,933 0.2%5.01 AMI 4,482 0.5%5.02 Pulmonary Embolism (PE) 1,218 0.1%5.03 Cardiac arrythmias, conduction disturbances & abnormal heart beat 33,074 3.8%5.04 Ventricular Fibrillation/ Cardiac arrest 2,788 0.3%5.05 Heart Failure 4,800 0.5%5.06 Hypotension 35,738 4.1%5.07 Cerebro-vascular Disease & TIA 2,406 0.3%5.08 Venous thrombosis/embolism (not progressing to PE) 2,326 0.3%5.09 Unstable and other angina 930 0.1%5.10 Cardiogenic and Other Shock 1,109 0.1%5.11 Other Circulatory System Complications 2,060 0.2%6.01 ARDS, respiratory failure and pulmonary collapse (includes atelectasis) 11,379 1.3%6.02 Aspiration pneumonia 2,187 0.2%6.03 Acute lower respiratory infections (incl influenza & pneumonia) 12,043 1.4%6.04 Pulmonary oedema, pneumothorax & pleural effusion 5,553 0.6%6.05 Haemorrhage from respiratory passages 2,926 0.3%6.06 Asphyxia & respiratory arrest 1,898 0.2%6.07 Breathing difficulties 4,791 0.5%6.08 Other Hospital-acquired Respiratory Disorders 4,232 0.5%7.01 Gastro enteritis 10,863 1.2%7.02 Paralytic Ileus & Intestinal Obstruction (w/o hernia) 3,385 0.4%7.03 Enterocolitis dt Clostridium difficile 1,739 0.2%7.04 Constipation 18,219 2.1%7.05 Nausea and Vomiting 18,348 2.1%7.06 GI Bleeding not classified to a disease 4,173 0.5%7.07 Other Digestive System Disorders 6,810 0.8%8.01 Pressure Ulcers 7,962 0.9%8.02 Cellullitis 2,225 0.3%8.03 Dermatitis, Rash and Other skin effects 16,328 1.9%8.04 Other Skin Disorders 2,603 0.3%9.01 Acute & Unspecified Renal Failure 11,477 1.3%9.02 Urinary tract infection 13,233 1.5%
Health Policy Analysis Pty Ltd | Analysis of hospital-acquired diagnoses P a g e | 60

Project commissioned by the Australian Commission on Safety and Quality in Health Care
CHADx classesCHADx
codes after data
cleaning
% of all
CHADx
9.03 Urinary Retention 11,485 1.3%9.04 Other Complications and Symptoms of the Urinary System 11,873 1.4%9.05 Other complications of male & female genitals 1,800 0.2%10.01 Depressive episode & symptoms involving emotional state 5,702 0.7%10.02 Panic and other anxiety disorders 2,466 0.3%10.03 Adjustment & Other Psych Disorders 984 0.1%10.04 Alterations to mental state 16,867 1.9%10.05 Mental & behavioural disorders due to psychoactive substance use 1,850 0.2%10.06 Patient self-harm (includes intentional and undetermined intent overdose)
985 0.1%
11.01 Complication of Abortion, Ectopic and Molar pregnancies 887 0.1%12.01 Foetal heart rate abnomalies 20,225 2.3%12.02 Foetal meconium and other distress 8,514 1.0%12.03 Complications of umbilical cord 8,928 1.0%12.04 Unsuccessful Interventions During Labour 5,161 0.6%12.05 Complications of Maternal Anaesthetic during pregnancy and puerperium
1,114 0.1%
12.06 First degree and unspecified perineal laceration 14,186 1.6%12.07 Second degree perineal laceration 39,144 4.5%12.08 Third degree and Fourth degree perineal laceration 4,724 0.5%12.09 Maternal Haemorrhage 25,241 2.9%12.10 Other Obstetric Trauma 17,304 2.0%12.11 Other complications intrapartum & postpartum 15,198 1.7%12.12 Retained Placenta 841 0.1%12.13 Maternal Infection (excluding wound infection) 3,005 0.3%12.14 Breast Disorders associated with childbirth 16,950 1.9%12.15 Other Disorders Predominately related to pregnancy 2,215 0.3%13.01 Prenatal injuries 1,234 0.1%13.02 Intracranial Haemorrhage, Hypoxia and Other Brain Injuries 3,165 0.4%13.03 Other Birth Trauma 809 0.1%13.04 Respiratory Distress of Newborn 8,113 0.9%13.05 Aspiration & Other Respiratory Disorders of Newborn 6,032 0.7%13.06 Circulatory Disorders of Newborn 4,448 0.5%13.07 Perinatal infections (exc septicaemia) 3,225 0.4%13.08 Haemorrhage and Blood Disorders of Newborn 365 0.0%13.09 Jaundice 8,692 1.0%13.10 GI and Feeding Disorders of Newborn 10,684 1.2%13.11 Other Neonatal Complications 17,772 2.0%14.01 Post Haemorrhagic Anaemia 6,592 0.8%14.02 Other Hospital-acquired Anaemia 16,712 1.9%14.03 Coagulation defects 2,036 0.2%14.04 Agranulocytosis, Thrombocytopenia and other blood disorders 6,196 0.7%15.01 Dehydration / volume depletion 14,177 1.6%15.02 Electrolyte disorders w/o dehydration 42,096 4.8%
Health Policy Analysis Pty Ltd | Analysis of hospital-acquired diagnoses P a g e | 61

Project commissioned by the Australian Commission on Safety and Quality in Health Care
CHADx classesCHADx
codes after data
cleaning
% of all
CHADx
15.03 Hospital-acquired Nutrition Deficiencies (incl nutritional anaemia) 7,110 0.8%15.04 Hypoglycaemia and Hyperglycaemia 1,666 0.2%15.05 Disorders of mineral metabolism 13,303 1.5%15.06 SIADH, Hyperthyroidism & Other metabolic disorders 645 0.1%16.01 Hospital-acquired Paralysis 1,319 0.2%16.02 Dystonia, Tremors and Gait disorders 2,146 0.2%16.03 Other Nervous System Complications 3,740 0.4%17.01 Major Symptoms (includes instantaneous death) 3,574 0.4%17.02 Headache & Migraine 7,684 0.9%17.03 Oedema & Ascites 3,301 0.4%17.04 Chest Pain 11,957 1.4%17.05 Abdominal Pain 4,127 0.5%17.06 Fever (not classified to condition) 10,862 1.2%17.07 Convulsions 1,941 0.2%17.08 Dizziness, Fainting & Blackout 7,161 0.8%17.09 Complications of the Eye and Ear 3,571 0.4%17.10 Musculoskeletal Complications (not associated with falls) 7,945 0.9%17.11 Dysphagia 3,720 0.4%17.12 Other Symptoms 10,843 1.2%Total 876,438 100.0
%
Health Policy Analysis Pty Ltd | Analysis of hospital-acquired diagnoses P a g e | 62
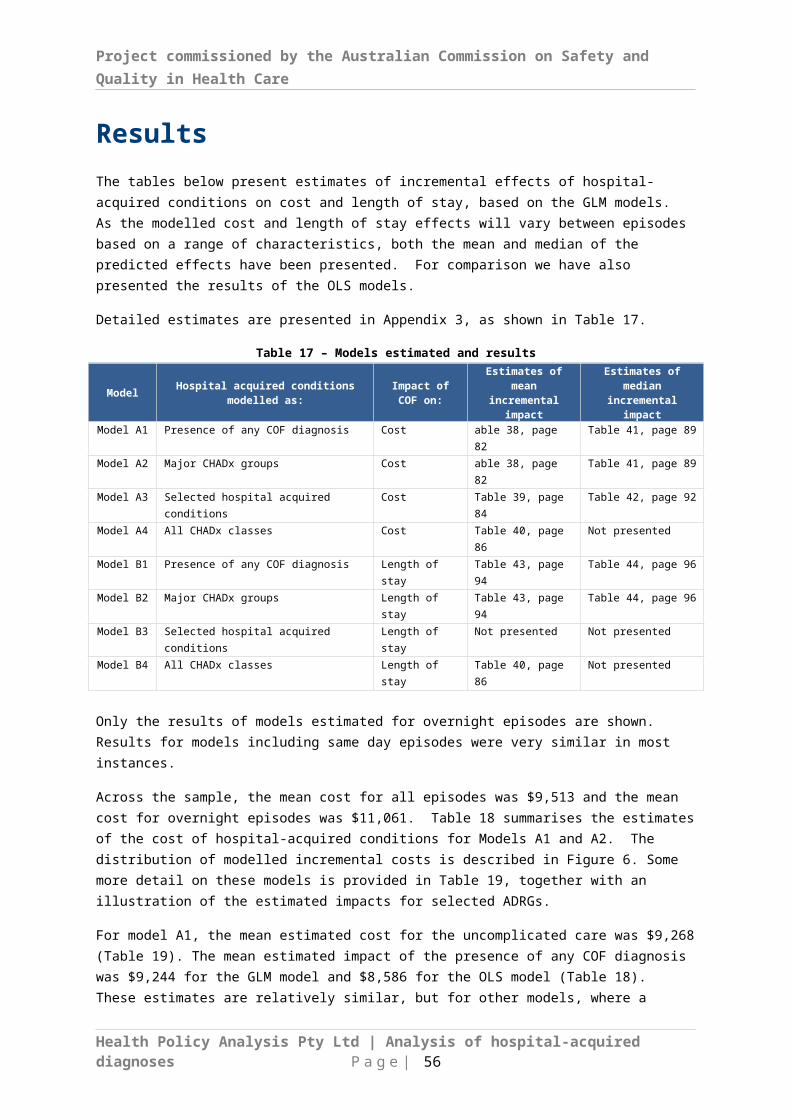
Appendix 2: NHCDC sample characteristics
Health Policy Analysis Pty Ltd | Analysis of hospital-acquired diagnoses P a g e | 63

Project commissioned by the Australian Commission on Safety and Quality in Health Care
Table 36 – Characteristics of NHCDC Sample - Part 1
Health Policy Analysis Pty Ltd | Analysis of hospital-acquired diagnoses P a g e | 64
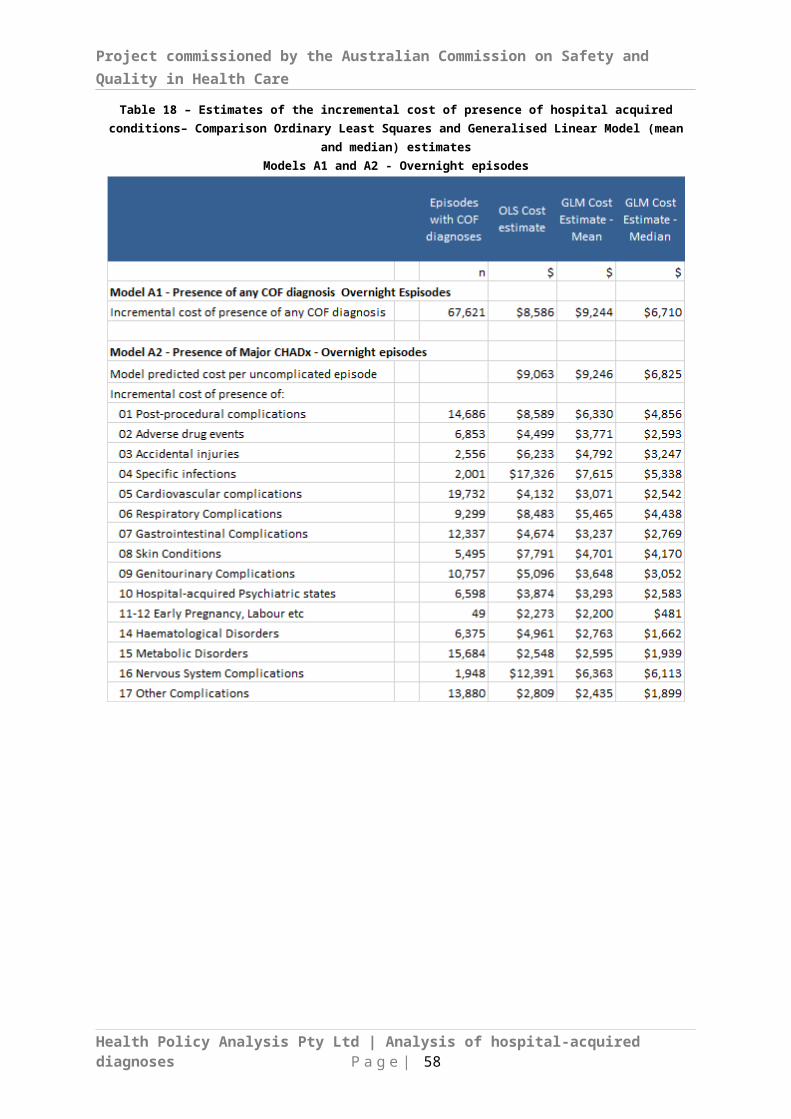
Project commissioned by the Australian Commission on Safety and Quality in Health Care
Table 36 Characteristics of NHCDC Sample - Part 2
Health Policy Analysis Pty Ltd | Analysis of hospital-acquired diagnoses P a g e | 65

Project commissioned by the Australian Commission on Safety and Quality in Health Care
Table 37 – NHCDC Sample – Episodes with Major CHADx Groups - Part 1
Health Policy Analysis Pty Ltd | Analysis of hospital-acquired diagnoses P a g e | 66

Project commissioned by the Australian Commission on Safety and Quality in Health Care
Table 37 – NHCDC Sample – Episodes with Major CHADx Groups - Part 2
Health Policy Analysis Pty Ltd | Analysis of hospital-acquired diagnoses P a g e | 67
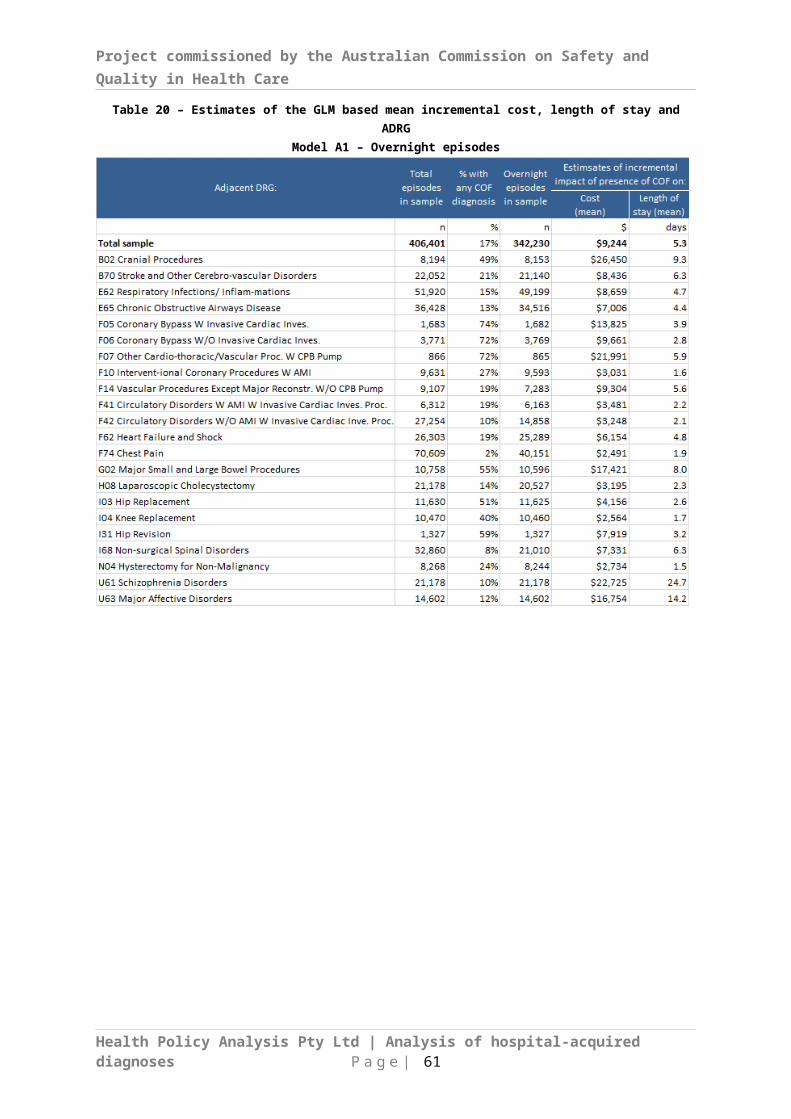
Project commissioned by the Australian Commission on Safety and Quality in Health Care
Table 37 – NHCDC Sample and a proportion of APC episodes by the original Adjacent DRG, 2011-12
Notes: APC sample includes all hospitals (public and private). Only episodes with a care type of acute were included.(1) A number of episodes with an original ADRG of A06, were allocated to other ADRGs within the selected set when regrouped.
Health Policy Analysis Pty Ltd | Analysis of hospital-acquired diagnoses P a g e | 68
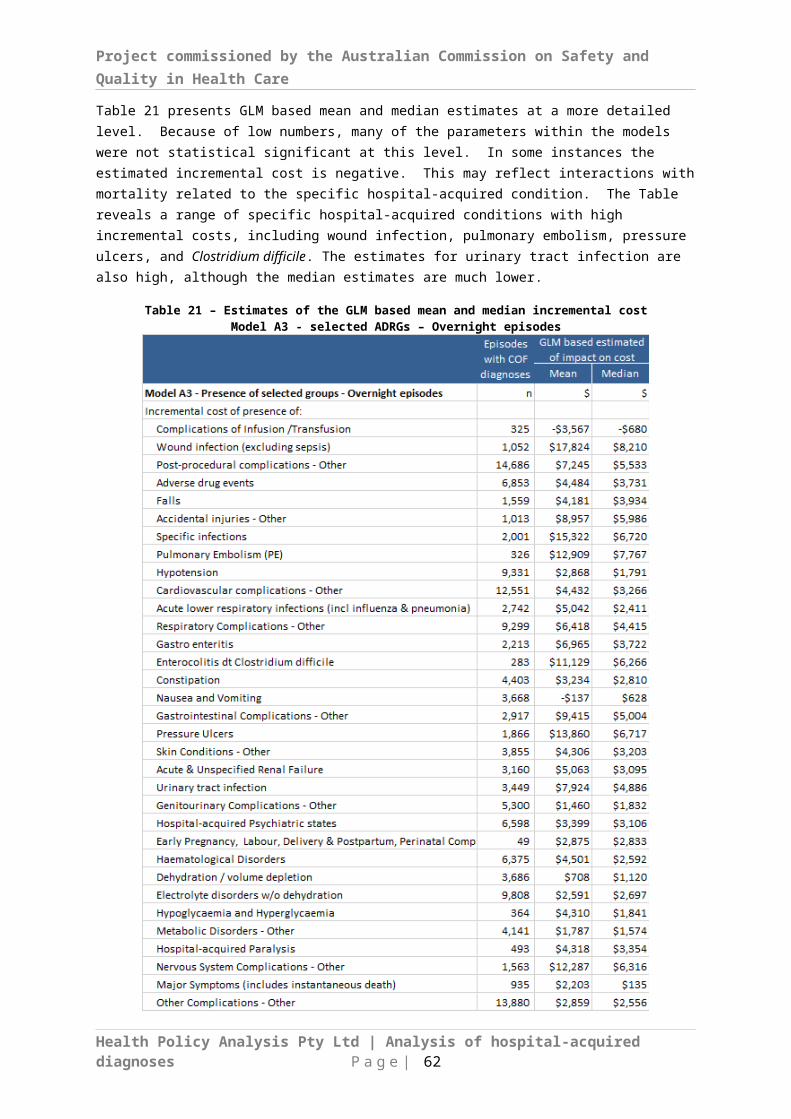
Appendix 3: Detailed results
Health Policy Analysis Pty Ltd | Analysis of hospital-acquired diagnoses P a g e | 69

Project commissioned by the Australian Commission on Safety and Quality in Health Care
Table 38 – Mean Estimates of the incremental cost Model A1 and A2 - Part 1Note: Shaded values represent estimates based on a parameter which was not statistically significant
Health Policy Analysis Pty Ltd | Analysis of hospital-acquired diagnoses P a g e | 70

Project commissioned by the Australian Commission on Safety and Quality in Health Care
able 38 – Mean Estimates of the incremental cost Model A1 and A2 - Part 2Note: Shaded values represent estimates based on a parameter which was not statistically significant
Health Policy Analysis Pty Ltd | Analysis of hospital-acquired diagnoses P a g e | 71
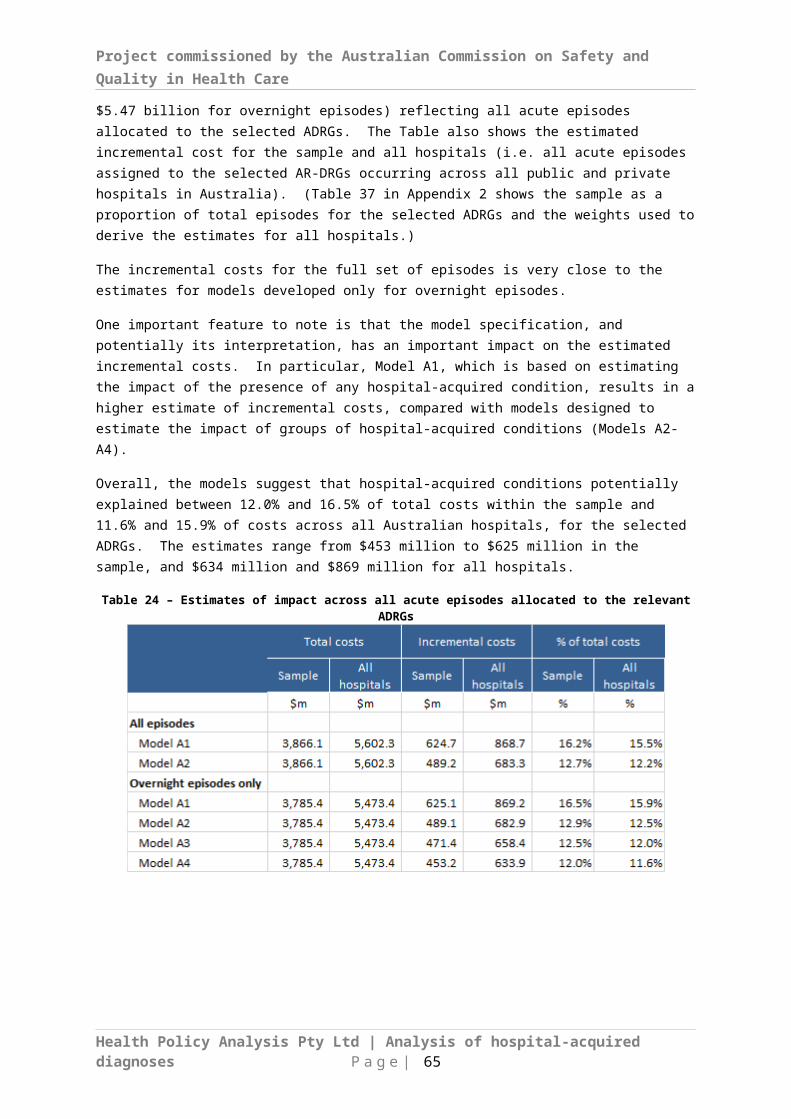
Project commissioned by the Australian Commission on Safety and Quality in Health Care
Table 39 – Mean Estimates of the incremental cost Model A3 - Part 1Note: Shaded values represent estimates based on a parameter which was not statistically significant
Health Policy Analysis Pty Ltd | Analysis of hospital-acquired diagnoses P a g e | 72

Project commissioned by the Australian Commission on Safety and Quality in Health Care
Table 39 – Mean Estimates of the incremental cost Model A3 - Part 2Note: Shaded values represent estimates based on a parameter which was not statistically significant
Health Policy Analysis Pty Ltd | Analysis of hospital-acquired diagnoses P a g e | 73

Project commissioned by the Australian Commission on Safety and Quality in Health Care
Table 40 –Estimates of the incremental cost and length of stay impacts of presence of hospital acquired conditions grouped to individual CHADx classes, and overall estimate of cost Model A4
Note: Shaded values represent estimates based on a parameter which was not statistically significant
Health Policy Analysis Pty Ltd | Analysis of hospital-acquired diagnoses P a g e | 74
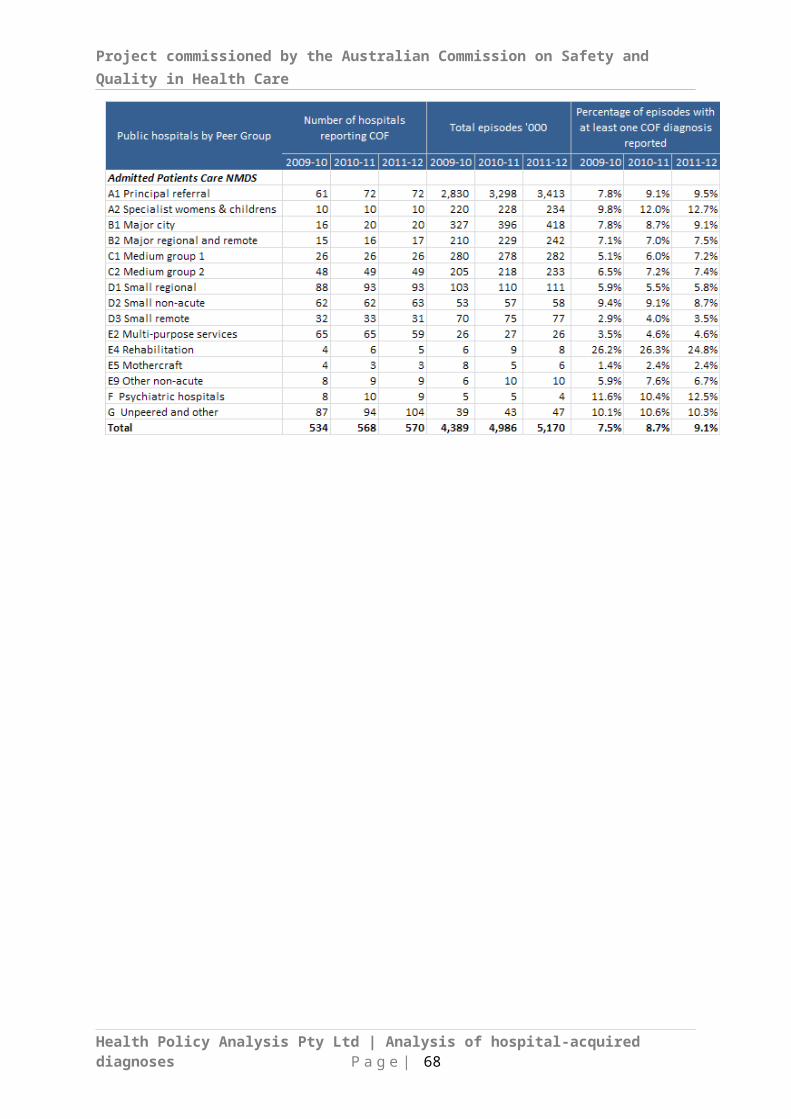
Project commissioned by the Australian Commission on Safety and Quality in Health Care
Health Policy Analysis Pty Ltd | Analysis of hospital-acquired diagnoses P a g e | 75
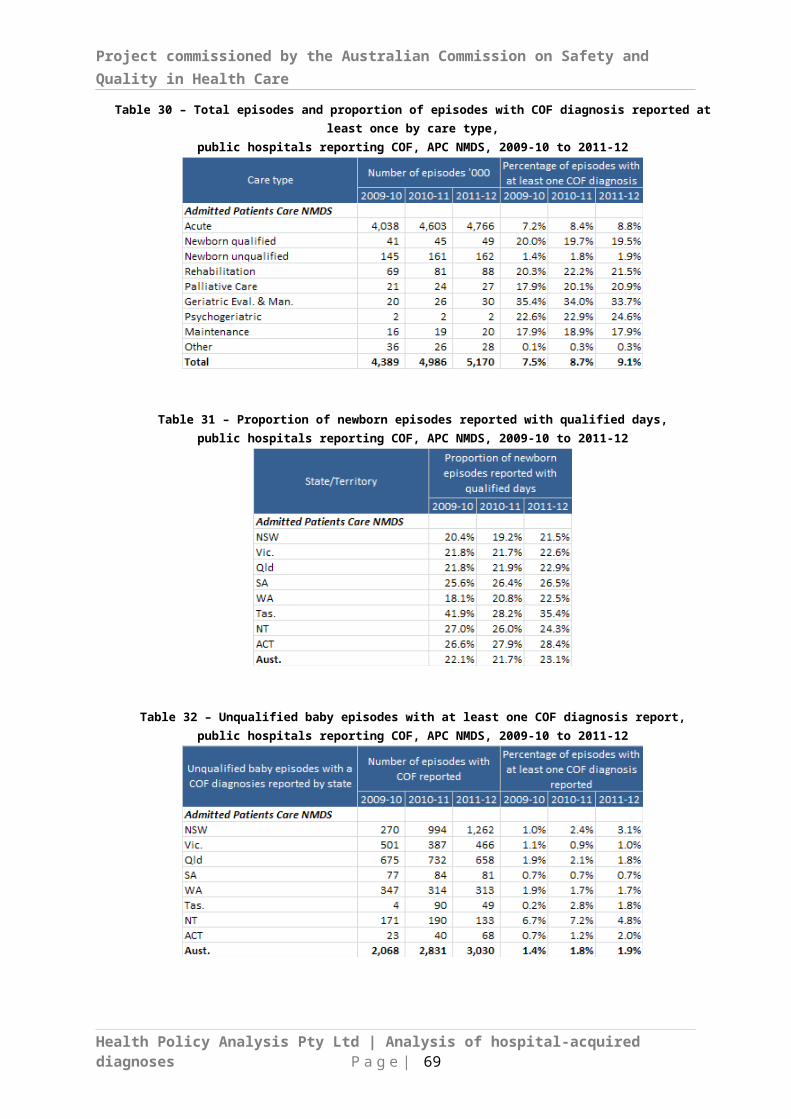
Project commissioned by the Australian Commission on Safety and Quality in Health Care
Health Policy Analysis Pty Ltd | Analysis of hospital-acquired diagnoses P a g e | 76
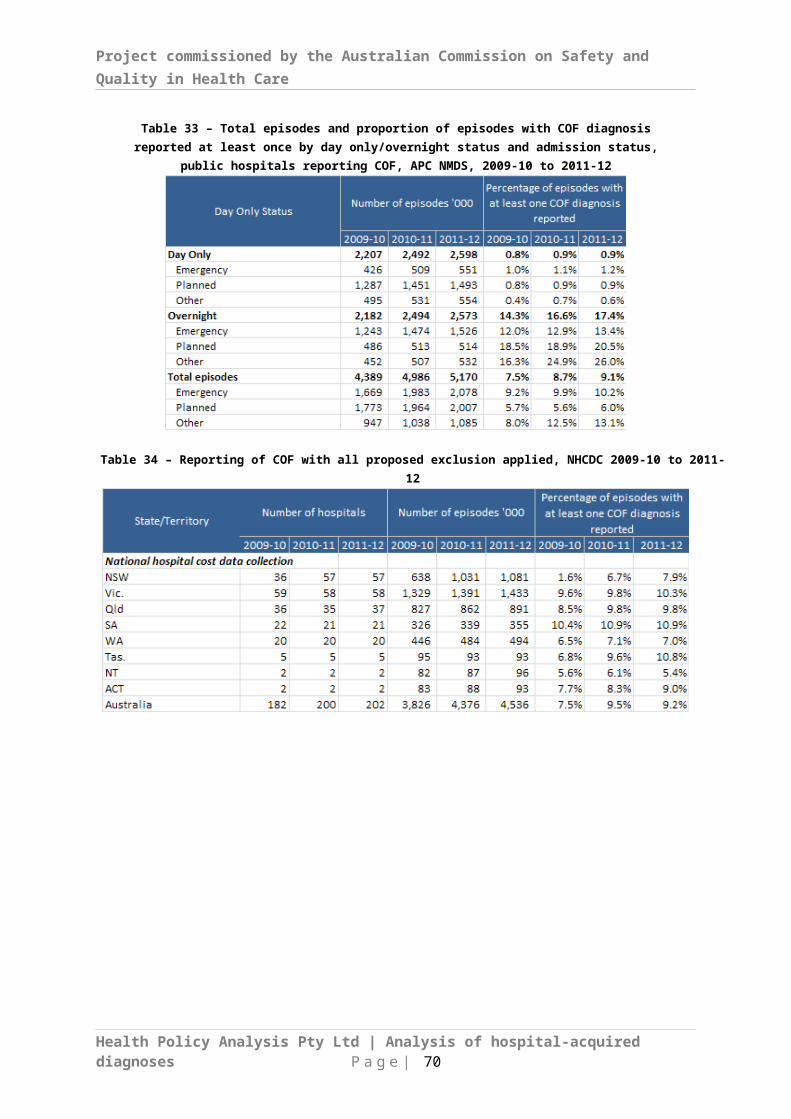
Project commissioned by the Australian Commission on Safety and Quality in Health Care
Table 41 – Median Estimates of the incremental cost Model A1 and A2 - Part 1Note: Shaded values represent estimates based on a parameter which was not statistically significant
Health Policy Analysis Pty Ltd | Analysis of hospital-acquired diagnoses P a g e | 77
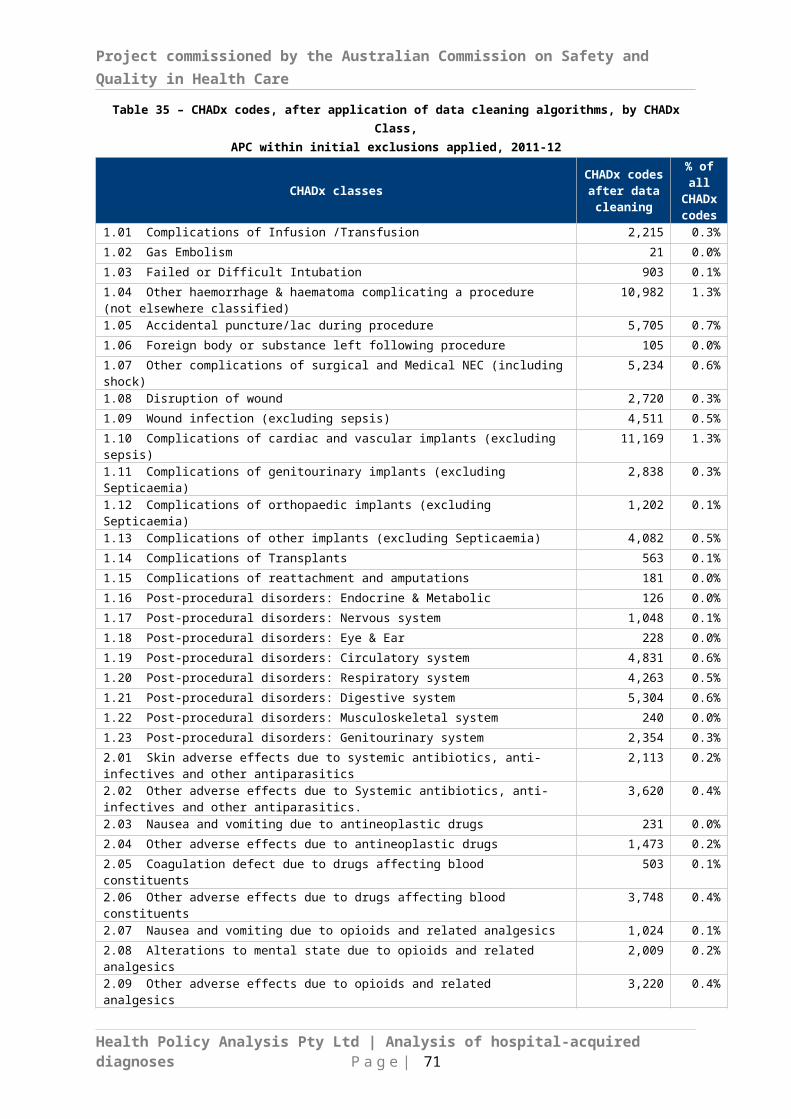
Project commissioned by the Australian Commission on Safety and Quality in Health Care
Health Policy Analysis Pty Ltd | Analysis of hospital-acquired diagnoses P a g e | 78
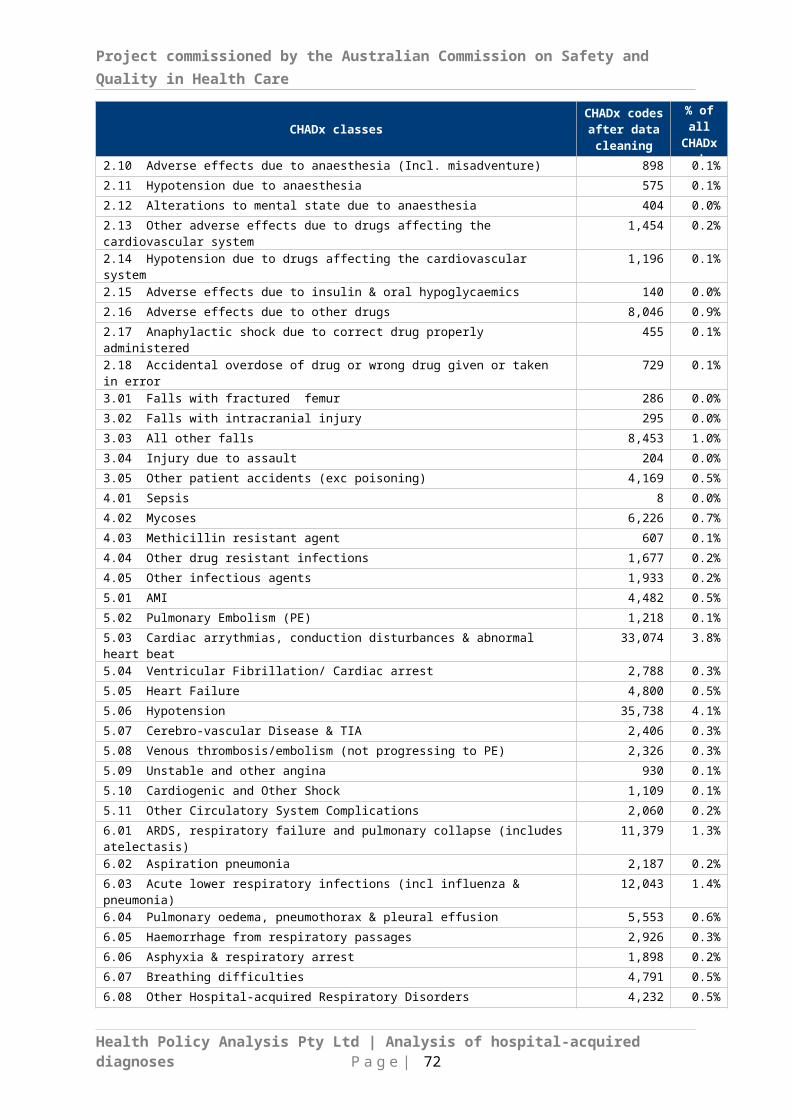
Project commissioned by the Australian Commission on Safety and Quality in Health Care
Table 41 – Median Estimates of the incremental cost Model A1 and A2 - Part 2Note: Shaded values represent estimates based on a parameter which was not statistically significant
Health Policy Analysis Pty Ltd | Analysis of hospital-acquired diagnoses P a g e | 79
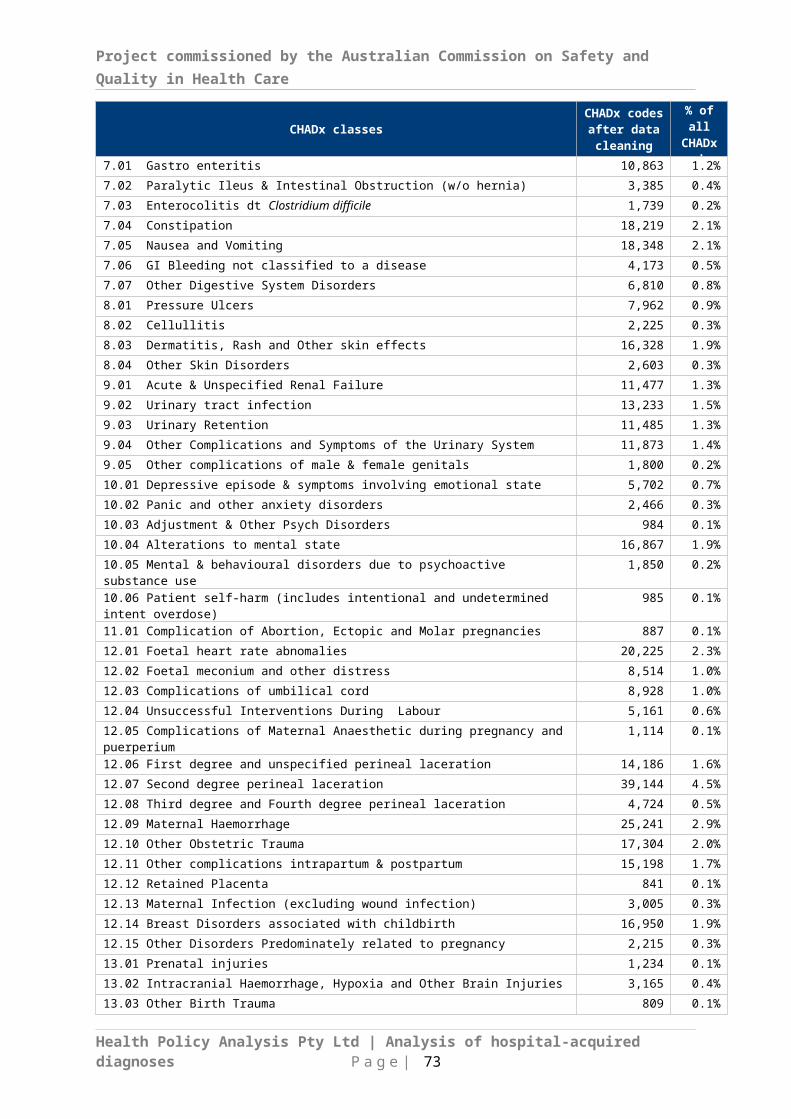
Project commissioned by the Australian Commission on Safety and Quality in Health Care
Table 42 – Median Estimates of the incremental cost Model A3 - Part 1Note: Shaded values represent estimates based on a parameter which was not statistically significant
Health Policy Analysis Pty Ltd | Analysis of hospital-acquired diagnoses P a g e | 80

Project commissioned by the Australian Commission on Safety and Quality in Health Care
Table 42 – Median Estimates of the incremental cost Model A3 - Part 2Note: Shaded values represent estimates based on a parameter which was not statistically significant
Health Policy Analysis Pty Ltd | Analysis of hospital-acquired diagnoses P a g e | 81
Project commissioned by the Australian Commission on Safety and Quality in Health Care
Table 43 – Estimates of the incremental length of stay – GLM Mean results - Model B1 and B2 - Part 1Note: Shaded values represent estimates based on a parameter which was not statistically significant
– Estimates of the incremental length of stay – GLM Mean results - Model B1 and B2 - Part 2Note: Shaded values represent estimates based on a parameter which was not statistically significant
Health Policy Analysis Pty Ltd | Analysis of hospital-acquired diagnoses P a g e | 82
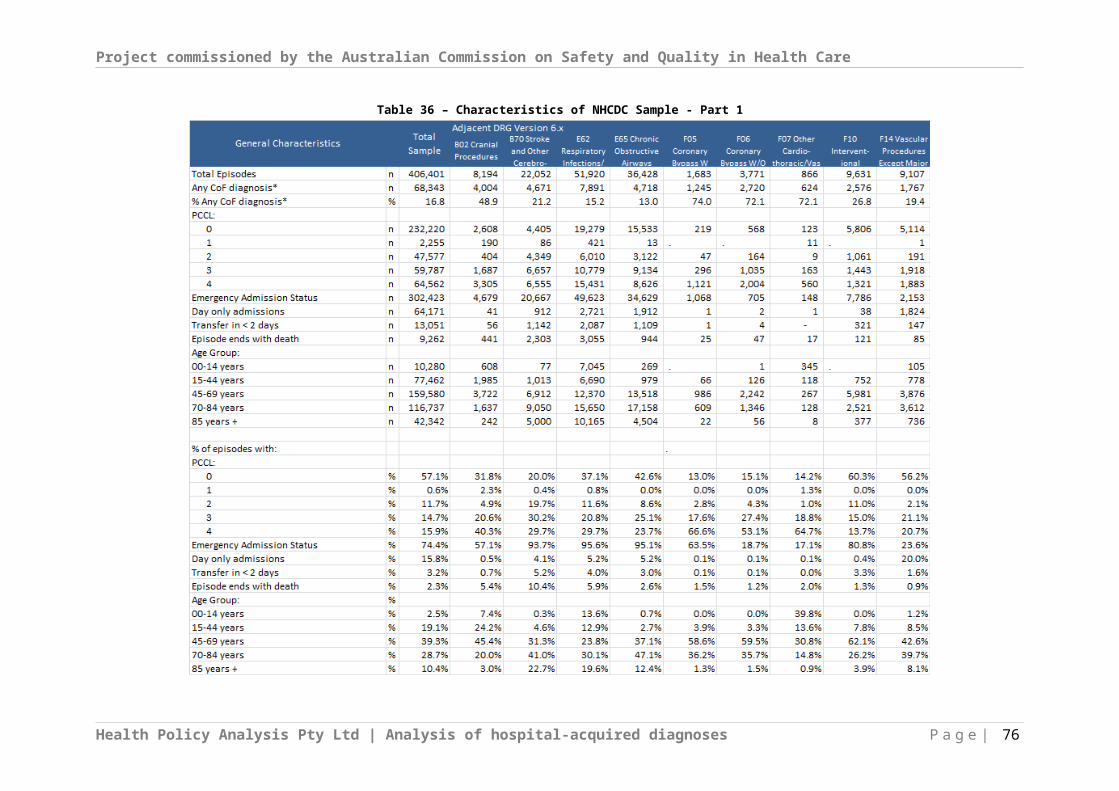
Project commissioned by the Australian Commission on Safety and Quality in Health Care
Health Policy Analysis Pty Ltd | Analysis of hospital-acquired diagnoses P a g e | 83
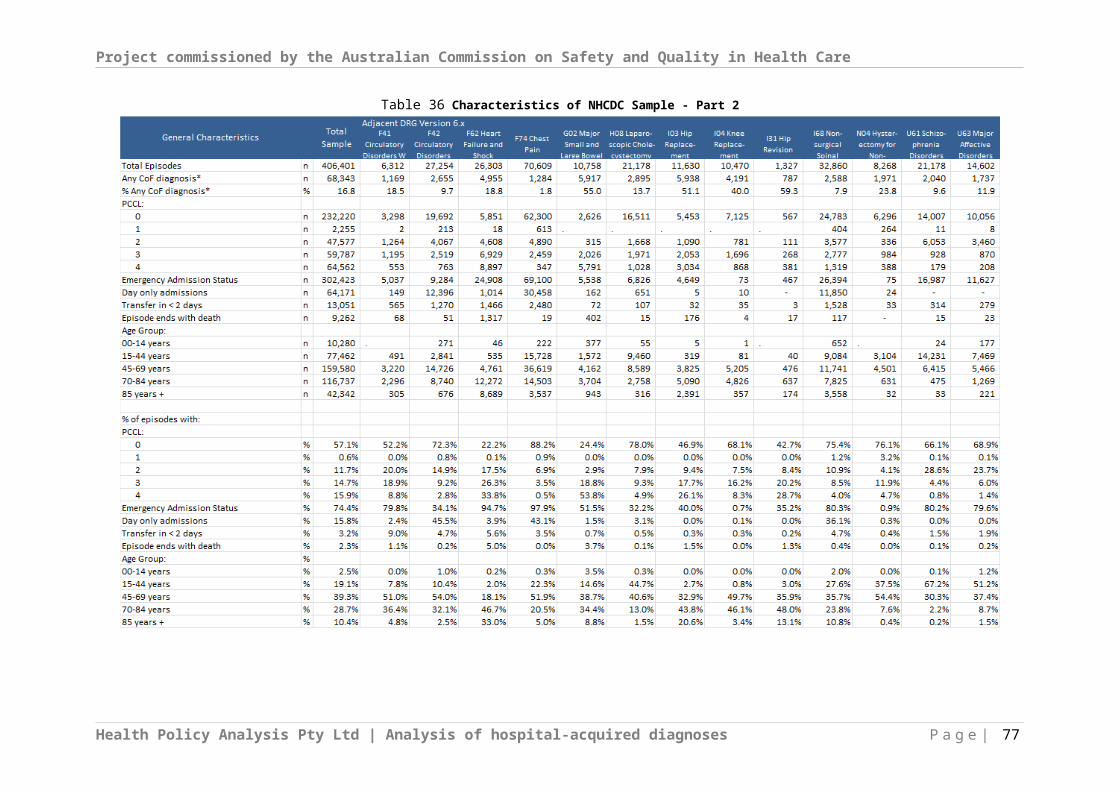
Project commissioned by the Australian Commission on Safety and Quality in Health Care
Table 44 – Estimates of the incremental length of stay – GLM Median results - Model B1 and B2 - Part 1Note: Shaded values represent estimates based on a parameter which was not statistically significant
Health Policy Analysis Pty Ltd | Analysis of hospital-acquired diagnoses P a g e | 84
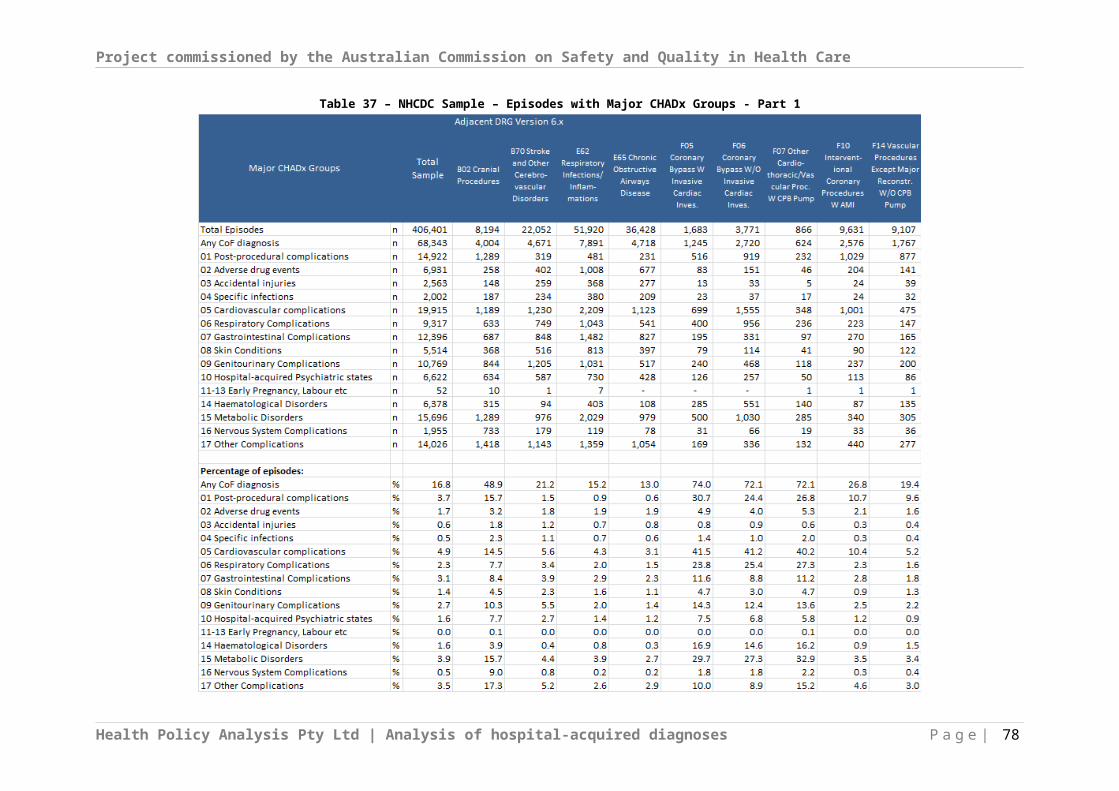
Project commissioned by the Australian Commission on Safety and Quality in Health Care
Table 44 – Estimates of the incremental length of stay – GLM Median results - Model B1 and B2 - Part 2Note: Shaded values represent estimates based on a parameter which was not statistically significant
Health Policy Analysis Pty Ltd | Analysis of hospital-acquired diagnoses P a g e | 85
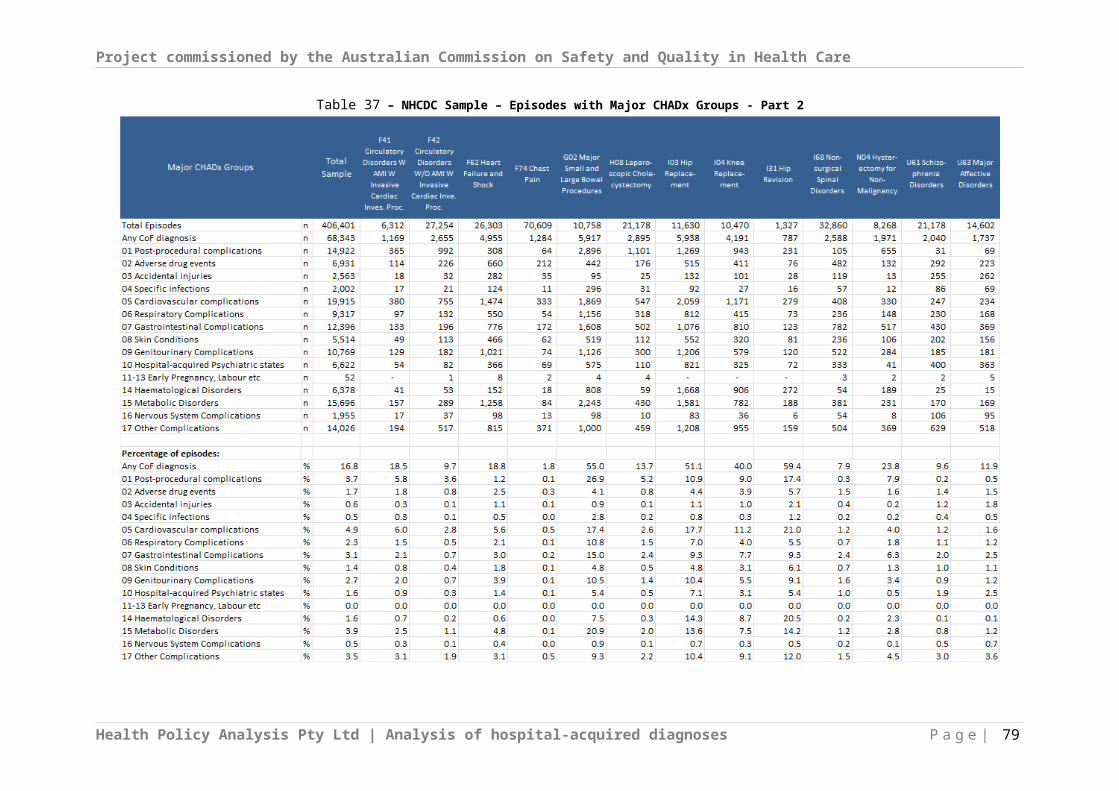
Appendix 4: Methodological issues in estimating the impact on cost and length of stay of hospital-acquired conditions.Literature on methodsMany studies have examined the additional length of stay and cost associated with hospital-acquired conditions, and in particular hospital-acquired infections (HAI). A recent systematic review (Fukuda, Lee, & Imanaka, 2011b) identified 89 studies published between 1980 and 2006 that presented estimates of the incremental costs of HAIs. The review analysed the methods adopted for producing these estimates, identifying three principal methods:
a. Case reviews (7 studies), where investigators undertake micro level data collection, informed by clinical judgement, to “accurately distinguish between resources used in the treatment of the primary diagnosis of patients, and the additional resources used for HAIs “(Fukuda et al., 2011b, p. 93).
b. Matched comparisons (53 studies, plus 3 studies using unmatched comparisons), where each case with HAI is compared with a case without HAI, using predetermined criteria for matching cases.
c. Regression analysis (23 studies), where cases (with and without HAIs) are included these analyses, and differences controlled for through including a range of additional variables in the model. More recent approaches using regression models have used two stage methods, including instrumental variables, to address the problem of endogeneity bias (see discussion below).
Studies are potentially subject to various biases that have not always been addressed or recognised by authors. Most, but not all, recent studies have included methods to address bias. The particular biases that impact these methods include:
Selection bias, for example, in matched comparison cases this may arise where cases cannot always be accurately matched with equivalent controls. In various studies “variations in patient attributes make it extremely difficult to find a corresponding uninfected patient for every infected case” (Fukuda et al., 2011b, p. 93). An additional manifestation of selection bias is that there may be a range of factors that impact the likelihood of a patient having a HAI that are not accounted for in the matching criteria or the relevant regression model.
Health Policy Analysis Pty Ltd | Analysis of hospital-acquired diagnoses P a g e | 86

Project commissioned by the Australian Commission on Safety and Quality in Health Care
Endogeneity bias (Graves et al., 2010; Howard et al., 2001; Schulgen, Kropec, Kappstein, Daschner, & Schumacher, 2000), which arises as “while there is good evidence that a primary channel through which HAI influences total costs is through increasing the length of hospital stay, increased length of stay is itself a primary cause of increased risk of HAI” (Graves, Weinhold, & Roberts, 2005, p. 754).
Time dependent bias, which is a related problem (van Walraven, Davis, Forster, & Wells, 2004; Barnett et al., 2011; Graves et al., 2010) which “occurs when the risk sets dependent on time are not correctly addressed in the statistical analysis” (Barnett et al., 2011, p. 382).
Fukuda et al. (2011b) found that “studies that had used measures to minimise biases and deal with confounding factors were in the minority, and there is a strong possibility that many of the published COHAI estimates are biased to varying extents” (Fukuda et al., 2011b, p. 95). Regression models (which are of most interest to the current study) are generally better suited to address problems of selection bias, provided sufficient information is incorporated into the model to control for relevant factors that result in differences between patients with and without the presence of hospital-acquired complications, such as severity of the primary condition (Howard et al., 2001). These models typically take the form of:
(1)
Where Cost i is the cost of the episode i, can be interpreted as the cost of episodes without the relevant HAI present, I 21 is the marginal cost for each episodes with the relevant HAI, HA IDummyi is a dummy variable that takes the value 1 when the HAI of
interest is present and 0 otherwise, and related to a set of control variables considered important, such as age, sex, primary diagnosis (not associated with the HAI itself). Models using length of stay, rather than cost, as the dependent variable are also common. Fukuda et al. (2011) identified around 20 studies using regression models of this nature related to HAI. In some studies the dependent variable is transformed using a logarithmic or gamma distribution, to address issues related to assumptions underpinning the regression model.
In many recent studies, the DRG assigned to the patient episode is used as a control. One factor that is not always recognised is that the DRG to which an episode is assigned may be impacted by the presence of additional diagnosis codes related to the hospital-acquired conditions of interest. DRG assignment may also be impacted by the presence of particular procedures that potentially ‘contaminate’ the comparability of episodes within a particular DRG. In this respect, the pre-MDC assignment algorithms which assign episodes to the tracheostomy and ventilation AR-DRGs could have a potentially large impact through shifting episodes into these DRGs. An approach to address this (taken in the current study) is to use the AR-DRG assigned ignoring hospital-acquired diagnoses and also the procedures that allocate the episodes to the tracheostomy and ventilation AR-DRGs.
Few studies have recognised or controlled for within-DRG heterogeneity at the principal diagnosis level. However, this could be a serious confounder, as discussed below.
Health Policy Analysis Pty Ltd | Analysis of hospital-acquired diagnoses P a g e | 87

Project commissioned by the Australian Commission on Safety and Quality in Health Care
In addition to DRG, various studies have controlled to the presence of particular comorbidities within patients. Other common factors included as control variables include age, flags for patients who die (or alternatively excluding these cases from analysis), flags for patients who are transferred at the end of the episode, flags for same day episodes (or alternatively excluding these episodes from analysis. Adjusting for ‘same day’ episodes is only relevant for countries where these are counted as admitted patient activity (such as Australia).
Regression models can also be impacted by endogeneity bias, unless specific steps are taken to address these issues. Only a limited number of studies identified by Fukuda et al. (2011b) incorporated these steps into the methods.
Hollenbeak et al. (2002) used a two stage method in a study investigating the cost of surgical site infections for patients receiving coronary artery by-pass surgery (CABG). In the first stage the risk of infection is estimated using a probit regression model. In the second stage the predicted risk is introduced as an explanatory variable in a regression model similar to equation 1 above. In this particular study, the authors found these methods resulted in a significantly reduced estimate of the cost of SSI in these cases (from $20,103 to $14,211).
Graves et al. (2005) used a similar approach, but also used an instrumental variables method. The study re-analysed data from a previous study of the impact of the cost of lower respiratory tract infections (LRTI) in non-surgical patients. They also adopted a two stage model. In the first stage the likelihood of a patient having a LRTI was estimated used a probit regression model, using variables that were predictive of an infection but not of length of stay or cost. (The restriction to these ‘instrumental variables’ is the main methodological difference compared with the Hollenbeak study.) The resulting predicted probability of infection was then introduced into a second stage model as a variable in a model similar to equation 1 above.
Endogeneity and the related time dependency biases represent serious challenges, which are not easily addressed.
Another set of methodological issues relate to the regression estimation methods adopted. Cost and length of stay data typically have very skewed distributions. While it has been argued that datasets with very large numbers of observations could use Ordinary Least Squares (OLS) models to generate unbiased estimates of effects (e.g. Fuller et al., 2009), in recent studies Generalised Linear Models (GLM) have been used combined with a transformation of the data and assumptions regarding the distribution of the data (e.g. Jackson et al., 2013, under review; Zhan & Miller, 2003).
In addition to these methodological issues a range of factors will potentially impact the empirical estimation of the impacts of hospital-acquired conditions. These include:
Depth of coding at the hospital level: This may be reflected in either the number of additional diagnoses coded or the specificity with which additional diagnoses are coded (e.g. reflected in the relative level of diagnosis codes ending with a ‘9’). Poorer levels of coding are likely to lead to under-identification of hospital-acquired conditions. However the impacts on estimates of the incremental cost of these conditions could be in any direction.
Coding standards and interpretation of these standards: Current Australian standards are that an additional diagnosis should only be coded in certain
Health Policy Analysis Pty Ltd | Analysis of hospital-acquired diagnoses P a g e | 88

Project commissioned by the Australian Commission on Safety and Quality in Health Care
circumstancesg. Similar standards exist elsewhere. Additional diagnoses which are present, but do not meet these standards may not be coded. At least one study (Goldman, Chu, Osmond, & Bindman, 2011), found that areas of disagreement between original coding and re-abstracted data, related to codes where there is ambiguity in where the condition meets this standard.
Accuracy of coding of COF: In many medical records, it may not be clear as to whether a diagnosis was present on admission. Coding of these indicators has been examined in a number of studies (e.g. Goldman et al., 2011). These studies highlight that there can be particular additional diagnosis codes where identifying whether the condition was present at admission is difficult, unless this is clearly indicated in the medical record. For other codes, the likelihood of a code being present on admission is either very high or very low (Jackson, Michel, Roberts, Shepheard, et al., 2009).
Table 45 summarises the major methodological challenges in estimating the impact of hospital-acquired conditions on cost and length of stay, together with an indication of the direction these factors may have on estimated effects.
Table 45 – Sources of potential bias in assessing the impact of hospital-acquired conditions
Issues potentially impacting estimates of
the cost of hospital-acquired conditions
Types of impact Impact on estimates
Depth of coding (number of additional diagnoses coded, or specificity of coding diagnoses )
Hospitals with deeper levels of coding are more likely to pick up additional diagnoses which were not present on admission. Poorer coding is likely to bias estimates downwards (where hospital-acquired conditions add to cost)
Coding standards may lead to some conditions not being coded
Current Australian standards are that a diagnosis should only be coded in certain circumstances. Additional diagnoses which are present, but do not meet these standards may not be coded. These may be ‘lower cost’ (hence not coded), which will result in an upward bias in estimates of effects
Accuracy of coding of COF Studies suggest coding is underestimated in some areas and overestimated in others. There are circumstances in which the interpretation of the medical chart is ambiguous.
Selection Bias – General Where there is selection bias present, episodes unaccounted for factors will influence both the presence of hospital-acquired conditions and the outcome of interest (cost or length of stay). Comparisons between episodes with and without hospital-acquired conditions will not be valid. In general (where hospital-acquired conditions add to costs), this is likely to result in estimates of effect that are upwardly biased. However it is also possible that the estimates of effect will be underestimated (see next row).
g For coding purposes, additional diagnoses should be interpreted as conditions that affect patient management in terms of requiring any of the following: commencement, alteration or adjustment of therapeutic treatment; diagnostic procedures; or increased clinical care and/or monitoring.
Health Policy Analysis Pty Ltd | Analysis of hospital-acquired diagnoses P a g e | 89
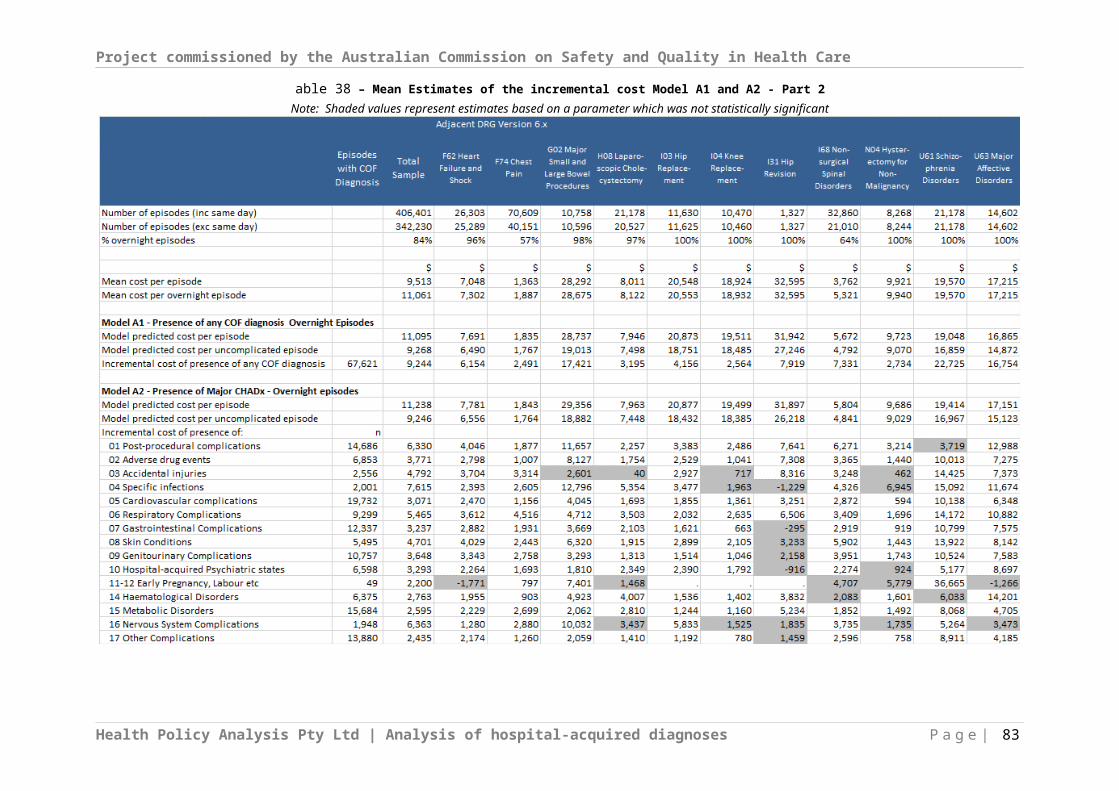
Project commissioned by the Australian Commission on Safety and Quality in Health Care
Issues potentially impacting estimates of
the cost of hospital-acquired conditions
Types of impact Impact on estimates
Selection Bias – Variables used to control for selection bias are also impacted by the presence of hospital-acquired conditions.
An example here is the use of DRG as a control variable, where DRG is determined by additional diagnoses both present on admission and those acquired in hospital. A similar issue applies to measures of comorbidity with include hospital-acquired diagnoses. In these instances, the estimates of effect will generally be biased downwards
Selection Bias – Within DRG heterogeneity related to principal diagnosis
DRGs typically group a range of principal diagnoses together. While these are similar, there can be high degree of heterogeneity (see discussion of cranial procedures and stroke DRGs below). If episodes with more complex principal diagnoses tend to also have higher levels of hospital-acquired conditions, the result will be that estimates of effect with be biased upwards.
Selection Bias – Failure to include other factors that independently impact the cost or length of stay within a DRG (e.g. comorbidities, age)
There is also a level of heterogeneity within DRGs related to a range of other factors such as the presence of comorbidities. Age is also often introduced, as a proxy for unmeasured ‘complexity’. Failure to control for these factors will typically result in upwardly biased estimates
Endogeneity/Time Dependent Bias – General
Unless endogeneity bias is addressed through methods, there a danger that effects will be over-estimated.
Studies of national/state level hospital morbidity dataMost of the studies identified in the Fukuda (2011a) review were focussed on studies of specific types of HAIs occurring with a specific hospital. Exceptions to this were Noskin et al. (2005) and Zhan and Miller (2003).
Zhan and Miller (2003) analysed the impact of medical injuries identified using the Agency for Healthcare Research and Quality (AHRQ) Patient Safety Indicators (PSIs) and analysing the US Nationwide Inpatient Sample database for 2002 maintained by AHRQ. The database represents a 20% sample of US hospitals which hospital discharges data available for from close to 1,000 hospitals representing approximately 7.45 million inpatient stays for this study. The model controlled for DRGs (using the 3M All Patient Refined Diagnosis Related Group - APR-DRG - classification), the presence of 30 comorbidity conditions (Elixhauser, Steiner, Harris, & Coffey, 1998), age, sex, race/ethnicity and insurance status. Modelling was undertaken using a two stage methodology. In the first stage the impact of the presence of comorbidities on the outcomes variables was estimated using a model that included fixed DRG effects, age, sex, race/ethnicity and insurance status. Significant positive coefficients were then used as relative weights to summarise comorbidities into indices applied to each episode.
These indices were then used in a multivariable matching methodology in which cases identified with selected hospital-acquired injuries were matched with up to four control cases without these injuries, taking into account DRG, severity, comorbidity and the patient sociodemographic factors. Cases and controls were then compared with respect to length of stay, charges and mortality.
Results were cross validated with a regression analysis undertaken using Generalised Linear Model (GLM) estimation to estimate excess length of stay, charges and excess
Health Policy Analysis Pty Ltd | Analysis of hospital-acquired diagnoses P a g e | 90
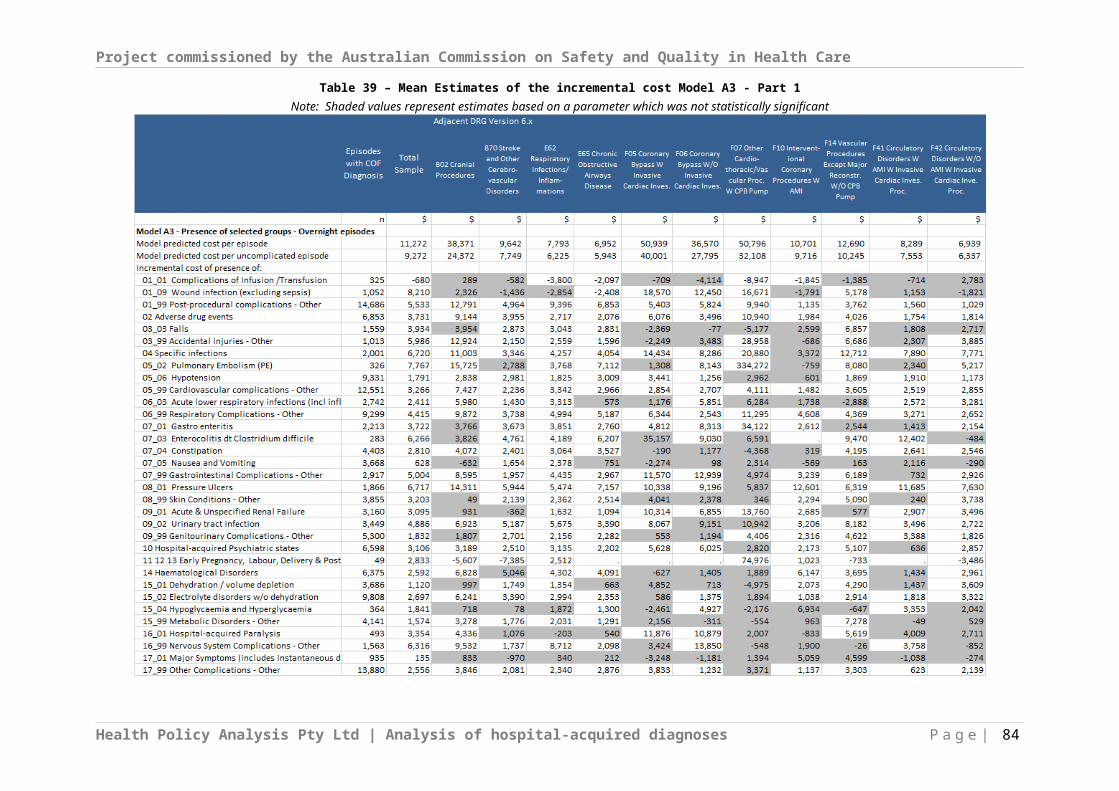
Project commissioned by the Australian Commission on Safety and Quality in Health Care
mortality, controlling for factors mentioned above. The model adjusted for, but did not calculate hospital fixed effects.
Noskin et al. (2005) analysed the impact of Staphylococcus aureus infections through a retrospective analysis of the US Nationwide Inpatient Sample database for 2001 and 2002 maintained by the Agency for Healthcare Research and Quality (AHRQ).The database represents a 20% sample of US hospitals which hospital discharges data available for from close to 1,000 hospitals representing approximately 14 million inpatient stays. The authors used a hierarchical regression model controlling for hospital, DRG age, sex, race, and payer, as well as selected comorbidities (diabetes, lung disease, and dialysis) identified by an expert panel (Zhan & Miller, 2003, p. 1757). The influence of hospital was introduced as a fixed effect. Outcome variables of interest included length of stay, total charges and mortality. The paper provides no discussion of or adjustment for endogeneity bias. The authors also performed a supplementary ‘confirmatory analysis’ using a matched comparison method. Through this method, each inpatient identified Staphylococcus aureus infection was “matched with 1 control from the same hospital and with the same age, sex, and race. Cases with a certain comorbidity (diabetes, lung disease, and dialysis) were matched with controls with 1 or more of these comorbidities” (Noskin et al., 2005, p. 1757).
Fuller et al. (2009) analysed the impact of 64 categories of hospital-acquired complications on costs of hospitalisation for a large sample of hospital discharges from 237 Californian hospitals and 45 Maryland hospitals. This study utilised the present on admission (POA) indicators available for these states, to identify the presence of each of 64 Potentially Preventable Complications (PPC) diagnoses (Hughes et al., 2006). In the analysis, episodes with a discharge status of transferred or expired (death) were excluded. The model estimated had a relatively simple specification as follows:
(1)
In this model, represents a vector of 64 dummy variables for each of the PPC and their coefficients. I 2 j can be interpreted as the marginal increase in cost associated
with the presence of complication PPC j. is a vector of dummy
variables, once each for every APRDRG (slightly over 1,000). The coefficient for these dummy variables, I 3k, can be interpreted as the marginal cost of each APRDRG. Dummy variables for some APRDRG were excluded from the final model where their coefficients were found not to be significant. The model was estimated through OLS linear regression
Through this specification, this model has a particular feature which is worth noting. This is that it assumes that the coefficient for each complication is the same across all APRDRGs. This is a significant ‘restriction’ on the parameters estimated for the model, and it is unlikely to a true reflection of effects of the complications on costs. However, the coefficients could be interpreted as an average of the effect across all episodes. Another feature of the specification is that it is assumes APRDRGs adequately capture all other confounders. The authors do not discuss methodological limitations, such as the potential for endogeneity bias.
Health Policy Analysis Pty Ltd | Analysis of hospital-acquired diagnoses P a g e | 91
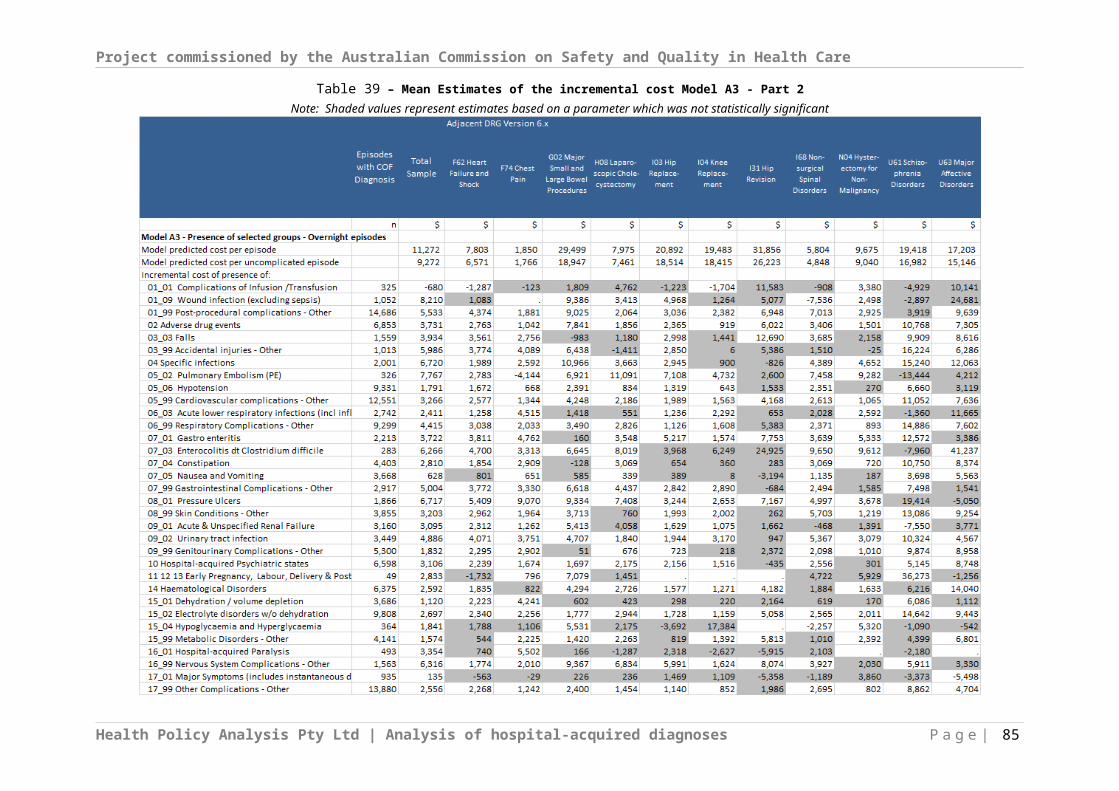
Project commissioned by the Australian Commission on Safety and Quality in Health Care
Jackson et al., 2011 modelled the impact of hospital-acquired conditions on costs for acute inpatients in 45 public hospitals in Victoria (2005-06) and 23 public hospitals in Queensland (2006-07), representing 1.7 million episodes. The CHADx data cleaning and grouping algorithms were applied to the data. The data sets were partitioned into two components: episodes with no CHADx diagnosis identified and those with CHADx diagnoses identified. Episodes with non CHADx diagnoses were summarised at the AR-DRG level to calculate average costs without hospital-acquired complications. This was then used to calculate a ‘mean corrected treatment cost’ for episodes with CHADx diagnoses. This corrected cost was the difference between total cost and the mean uncomplicated costs. Ordinary least squares (OLS) modelling was then undertaken on the dataset.
Jackson et al. (2013, under review) analysed the increment cost length of stay for episodes with hospital-acquired conditions in eight hospitals in Alberta, Canada and 206,011 acute care episodes from the 2008-09 period. Additional diagnoses with a ‘present on admission’ flag were grouped to CHADx classes. Within the sample 23.9% of episodes had a hospital-acquired diagnoses identified. Incremental costs were estimated using generalized linear model with a gamma distribution using a log link relationship. Estimates of costs were controlled for the uncomplicated cost within each Case Mix Group (the Canadian version of DRGs).
Health Policy Analysis Pty Ltd | Analysis of hospital-acquired diagnoses P a g e | 92

ReferencesAustralian Commissions for Safety and Quality in Health Care. (2013). CHADx codes for
ICD-10-AM Eight Edition. Sydney: ACSQHC.Australian Institute of Health and Welfare. (2013a). Australian Hospital Statistics 2011-12
Health services series no. 50. Cat. no. HSE 134. Canberra: AIHW.Australian Institute of Health and Welfare. (2013b). METeOR - Episode of admitted
patient care—condition onset flag Retrieved 26/8/2013, 2013, from http://meteor.aihw.gov.au/content/index.phtml/itemId/354816
Barnett, A.G., Beyersmann, J., Allignol, A., Rosenthal, V.D., Graves, N., & Wolkewitz, M. (2011). The time-dependent bias and its effect on extra length of stay due to nosocomial infection. Value Health, 14(2), 381-386.
Berenholtz, S.M., Pham, J.C., Thompson, D.A., Needham, D.M., Lubomski, L.H., Hyzy, R.C., . . . Pronovost, P.J. (2011). Collaborative cohort study of an intervention to reduce ventilator-associated pneumonia in the intensive care unit. Infect Control Hosp Epidemiol, 32(4), 305-314.
Ehsani, J.P., Jackson, T., & Duckett, S.J. (2006). The incidence and cost of adverse events in Victorian hospitals 2003-04. Medical Journal of Australia, 184(11), 551-555.
Elixhauser, A., Steiner, C., Harris, D.R., & Coffey, R.M. (1998). Comorbidity measures for use with administrative data. Med Care, 36(1), 8-27.
Fukuda, H., Lee, J., & Imanaka, Y. (2011a). Costs of hospital-acquired infection and transferability of the estimates: a systematic review. Infection, 39(3), 185-199.
Fukuda, H., Lee, J., & Imanaka, Y. (2011b). Variations in analytical methodology for estimating costs of hospital-acquired infections: a systematic review. J Hosp Infect, 77(2), 93-105.
Fuller, R.L., McCullough, E.C., Bao, M.Z., & Averill, R.F. (2009). Estimating the costs of potentially preventable hospital acquired complications. Health Care Financ Rev, 30(4), 17-32.
Goldman, L.E., Chu, P.W., Osmond, D., & Bindman, A. (2011). The accuracy of present-on-admission reporting in administrative data. Health Serv Res, 46(6pt1), 1946-1962.
Graves, N., Harbarth, S., Beyersmann, J., Barnett, A., Halton, K., & Cooper, B. (2010). Estimating the cost of health care-associated infections: mind your p's and q's. Clin Infect Dis, 50(7), 1017-1021.
Graves, N., Weinhold, D., & Roberts, J.A. (2005). Correcting for bias when estimating the cost of hospital-acquired infection: an analysis of lower respiratory tract infections in non-surgical patients. Health Econ, 14(7), 755-761.
Hollenbeak, C.S., Murphy, D., Dunagan, W.C., & Fraser, V.J. (2002). Nonrandom selection and the attributable cost of surgical-site infections. Infect Control Hosp Epidemiol, 23(4), 177-182.
Howard, D., Cordell, R., McGowan, J.E., Jr., Packard, R.M., Scott, R.D., 2nd, & Solomon, S.L. (2001). Measuring the economic costs of antimicrobial resistance in hospital settings: summary of the Centers for Disease Control and Prevention-Emory Workshop. Clin Infect Dis, 33(9), 1573-1578.
Hughes, J.S., Averill, R.F., Goldfield, N.I., Gay, J.C., Muldoon, J., McCullough, E., & Xiang, J. (2006). Identifying potentially preventable complications using a present on admission indicator. Health Care Financ Rev, 27(3), 63-82.
Institute of Medicine. (2013). Crossing the Quality Chasm: The IOM Health Care Quality Initiative. Retrieved 20 September 2013, from http://www.iom.edu/Global/News%20Announcements/Crossing-the-Quality-Chasm-The-IOM-Health-Care-Quality-Initiative.aspx
Jackson, T., Fong, A., Liu, M., Murray, K., QWalz, L., Houston, C., & Dean, S. (2013, under review). Incremental costs of hospital-acquired complications in Alberta, Canada.
Jackson, T., Michel, J.L., Roberts, R., Shepheard, J., Cheng, D., Rust, J., & Perry, C. (2009). Development of a validation algorithm for 'present on admission' flagging. BMC Med Inform Decis Mak, 9, 48.
Health Policy Analysis Pty Ltd | Analysis of hospital-acquired diagnoses P a g e | 93
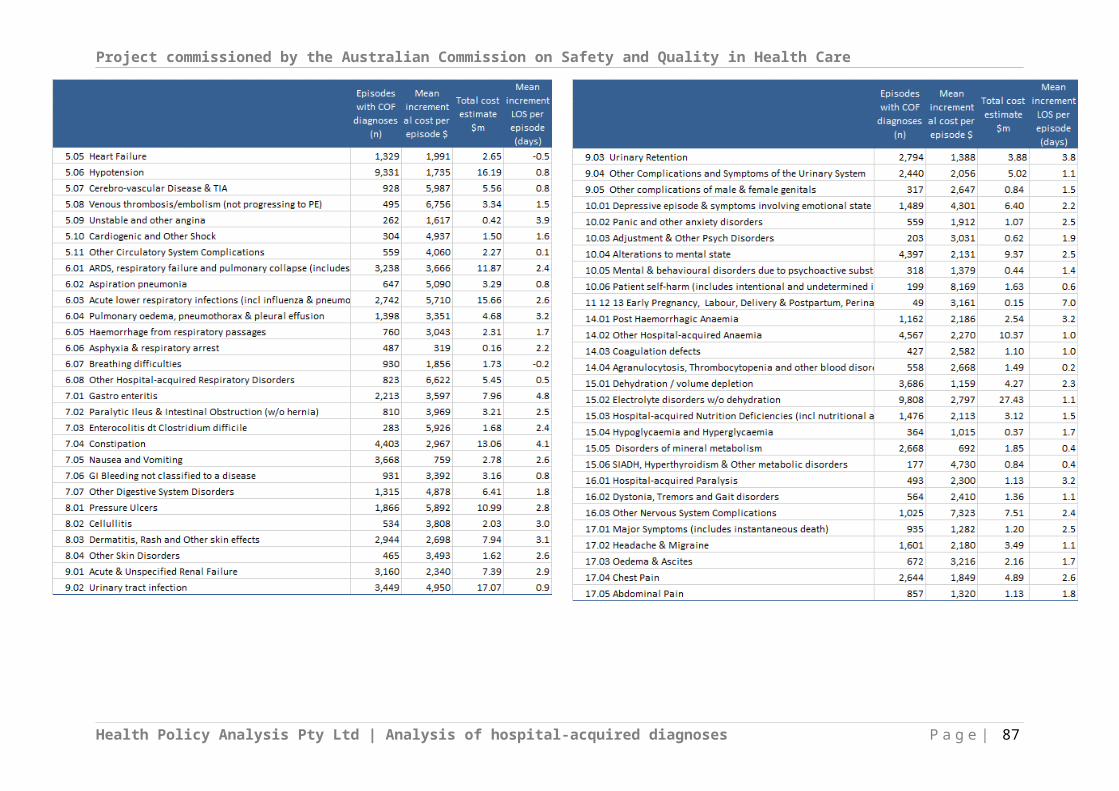
Project commissioned by the Australian Commission on Safety and Quality in Health Care
Jackson, T., Michel, J.L., Roberts, R.F., Jorm, C.M., & Wakefield, J.G. (2009). A classification of hospital-acquired diagnoses for use with routine hospital data. Med J Aust, 191(10), 544-548.
Jackson, T., Nghiem, H.S., Rowell, D., Jorm, C., & Wakefield, J. (2011). Marginal costs of hospital-acquired conditions: information for priority-setting for patient safety programmes and research. J Health Serv Res Policy, 16(3), 141-146.
McNair, P., Borovnicar, D., Jackson, T., & Gillett, S. (2009). Prospective payment to encourage system wide quality improvement. Med Care, 47(3), 272-278.
Michel, J., Nghiem, H.D., & Jackson, T.J. (2009). Using ICD-10-AM codes to characterise hospital-acquired complications. HIM J, 38(3), 18-25.
National Casemix and Classification Centre. (2012). Australian Coding Standards. Sydney: NCCC.
Noskin, G.A., Rubin, R.J., Schentag, J.J., Kluytmans, J., Hedblom, E.C., Smulders, M., . . . Gemmen, E. (2005). The burden of Staphylococcus aureus infections on hospitals in the United States: an analysis of the 2000 and 2001 Nationwide Inpatient Sample Database. Arch Intern Med, 165(15), 1756-1761.
Pronovost, P., Goeschel, C., & Wachter, R. (2008). The wisdom and justice of not paying for “preventable complications”. Journal of the American Medical Association, 299, 2197–2199.
Pronovost, P., Needham, D., Berenholtz, S., Sinopoli, D., Chu, H., Cosgrove, S., . . . Goeschel, C. (2006). An intervention to decrease catheter-related bloodstream infections in the ICU. N Engl J Med, 355(26), 2725-2732.
Schulgen, G., Kropec, A., Kappstein, I., Daschner, F., & Schumacher, M. (2000). Estimation of extra hospital stay attributable to nosocomial infections: heterogeneity and timing of events. J Clin Epidemiol, 53(4), 409-417.
Umscheid, C.A., Mitchell, M.D., Doshi, J.A., Agarwal, R., Williams, K., & Brennan, P.J. (2011). Estimating the proportion of healthcare-associated infections that are reasonably preventable and the related mortality and costs. Infect Control Hosp Epidemiol, 32(2), 101-114.
van Walraven, C., Davis, D., Forster, A.J., & Wells, G.A. (2004). Time-dependent bias was common in survival analyses published in leading clinical journals. J Clin Epidemiol, 57(7), 672-682.
Vincent, C., Aylin, P., Franklin, B.D., Holmes, A., Iskander, S., Jacklin, A., & Moorthy, K. (2008). Is health care getting safer? BMJ, 337, a2426.
Wilson, R., Runciman, W., Gibberd, R., Harrison, B., Newby, L., & Hamilton, J. (1995). The Quality in Australian Health Care Study. Medical Journal of Australia, 163, 458-471.
Zhan, C., & Miller, M.R. (2003). Excess length of stay, charges, and mortality attributable to medical injuries during hospitalization. JAMA, 290(14), 1868-1874.
Health Policy Analysis Pty Ltd | Analysis of hospital-acquired diagnoses P a g e | 94