overview of yavapai college comprehensive annual financial
TRANSCRIPT

YC Yavapai CollegeFebruary 2019
Overview of Yavapai CollegeComprehensive Annual Financial
Report & Audit Results
FY 2017-18

Financial Audit & Internal Controls Report over Financial Reportingo No audit findings
Unmodified Audit Opinion
The Certificate of Achievement for Excellence in Financial Reporting award from GFOA
Federal Single Audito No audit findings
YC
Positive Financial Results
Statement of Net Position (Balance Sheet)
Statement of Revenues, Expenses, and Changes in Net Position (Income Statement)
Statement of Cash flows
YC

YC
$86.5 $97.8
$107.9 $121.9
$133.8 $1.8
$1.9 $1.4
$1.3 $1.3
$(11.2) $(10.7) $(8.9) $(10.7) $(11.2)
$77.1
$89.0
$100.4 $112.5
$123.9
($20)
$0
$20
$40
$60
$80
$100
$120
$140
2013-14 2014-15 2015-16 2016-17 2017-18
Net Investment in Capital Assets Restricted Net Assets Unrestricted Net Assets
(in millions of dollars)

YC
$74.5
$62.7
$11.9
$-
$10.0
$20.0
$30.0
$40.0
$50.0
$60.0
$70.0
$80.0
Total Revenues
Total Expenses
Increase in Net Position
(in millions of dollars)
YC
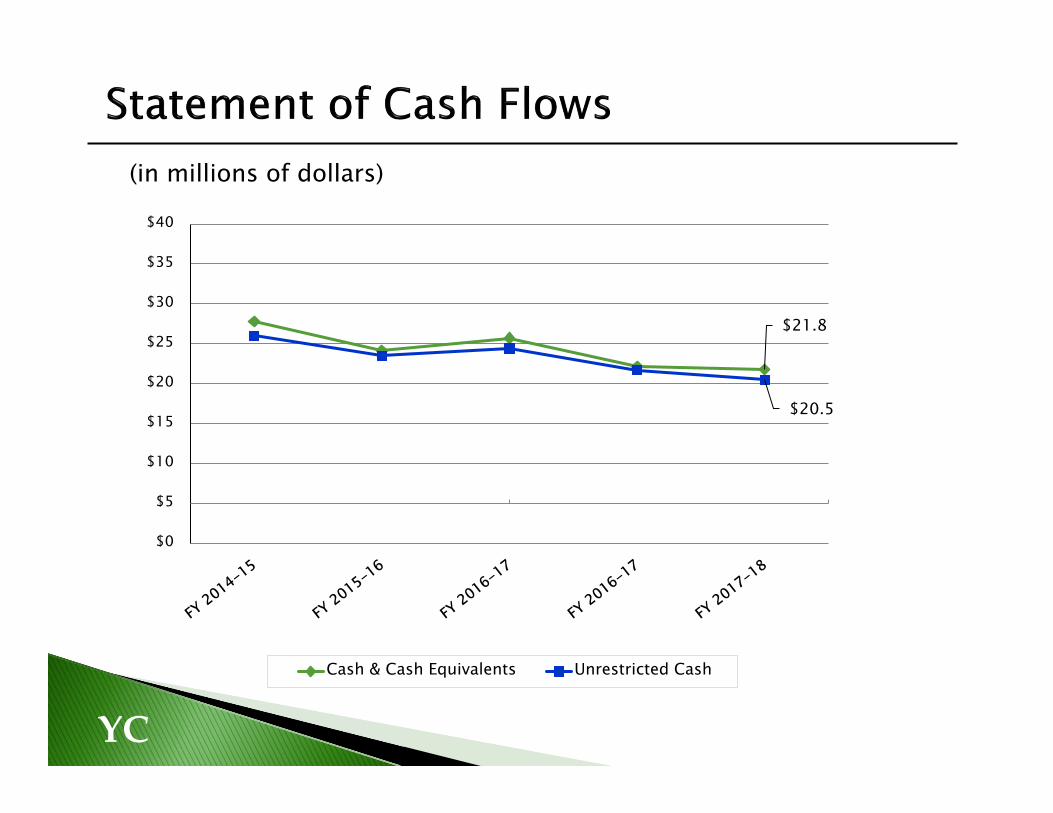
(in millions of dollars)
$21.8
$20.5
$0
$5
$10
$15
$20
$25
$30
$35
$40
Cash & Cash Equivalents Unrestricted Cash

YC
$49.5M
$16.1M
$235
$71
$-
$50
$100
$150
$200
$250
$-
$10,000,000
$20,000,000
$30,000,000
$40,000,000
$50,000,000
$60,000,000
GO Bond Debt Debt per Capita

YC
0.0%
2.0%
4.0%
6.0%
8.0%
10.0%
12.0%
14.0%
16.0%
18.0%
20.0%
$‐
$10.0
$20.0
$30.0
$40.0
$50.0
$60.0
Other
Tuition & Fees
Property Taxes
State Aid
State Aid %
Tuition & Fees %
(in millions of dollars)

Report to HLC annually• Both with and without the impact of GASB 68
pension liabilities. • NACUBO benchmarks have not been updated
to reflect the impact of GASB 68.• YC’s CFI score meets the HLC’s acceptable
range.
Provides insight on the financial health of the District
YC

Composite Financial Index
YC
Primary Reserve Ratio Viability Reserve Ratio
Return on Net Assets Ratio Net Operating Revenue Ratio

YC
The CFI is a combination of the four core ratios using a prescribed weighting thatis an indicator of the overall financial health of an institution. It’s important to note that the benchmarks used for the CFI have not been updated to reflect pension liabilities, and consequently, the benchmarks do not necessarily provide the financial guidance intended when developed. The HLC requires the CFI be reported with and without the pension liabilities.
(NACUBO)
-
0.5
1.0
1.5
2.0
2.5
3.0
3.5
4.0
4.5
Composite Score
Composite Score (w/Pension Liability)
Benchmark

YC