overview of the beijing 2008 olympics project. part i ... · overview of the beijing 2008 olympics...
TRANSCRIPT

A Report to the World Weather Research Programme
Overview of the Beijing 2008 Olympics Project.
Part I: Forecast Demonstration Project
Submitted, 20 July 2009

Contributors
This report was drafted by
Jianjie Wang (CMA/BMB), Tom Keenan (BoM), Paul Joe (EC), Jim Wilson (NCAR), Edwin
S.T. Lai (HKO), Feng Liang (CMA/BMB), Yubin Wang (CMA/BMB), Beth Ebert (BoM),
Qian Ye (CMA/CAMS), John Bally (BoM), Alan Seed (BoM), Mingxuan Chen (CMA/IUM),
Jishan Xue (CMA/CAMS), Bill Conway (WDT).
We acknowledge and express our gratitude to many scientists from the international science
community and the China Meteorological Administration for their contribution to the success
in B08FDP (in alphabetical order):
Linda Anderson-Berry (BoM), Tony Bannister (BoM), Barbara Brown (NCAR), Li Bo (CMA/BMB), Philip
K.Y. Chang (HKO), Min Chen (CMA/BMB), Yuxiao Duan (CMA/BMB), Yerong Feng (CMA/GMB),
Jaymie Gadal (EC), Jiarui Han (IAP), Sheng Hu (CMA/GMB), David Hudak (EC), Ronald Lee (EC), Kwok
Keung (EC), Rong Kong (CMA/BMB), Zhaochong Lei (CMA), Xun Li (CMA/BMB), Ke Liu (CMA/BMB),
Jinping Meng (CMA/BMB), Debin Su (CMA/BMB), David Scurrah (BoM), Chengyun Sun (CMA/BMB),
Jenny Sun (NCAR), Rita Roberts (NCAR), Pu Xie (CMA/BMB), Pierre Vaillancourt (MSC), Yingchun
Wang (CMA/BMB), Sarah Wong (EC), W.K. Wong (HKO), Xian Xiao (CMA/BMB), Man Chuen Young
(EC), Dongchang Yu (CMA/BMB), Haiyan Yu (CMA/BMB), Xiaoding Yu (CMA), Lili Yuan (CMA/BMB),
Linus H.Y. Yeung (HKO), Qin Zeng (CMA/GMB), Wenfang Zhao (CMA/BMB), Wei Zhuang
(CMA/CAMS), Chian Zhang (Metstar), Jianyun Zhang (Metstar)

CONTENTS
Executive Summary ..................................................................................................................... 1 1 Background, Rationale and Goals of the project................................................................... 4 2 Participating Systems and Executive Organization .............................................................. 5
2.1 Participating Systems ..................................................................................................... 5 2.2 Executive Organization .................................................................................................. 9
3 Implementation of B08FDP ................................................................................................ 10 3.1 Data Environment ...................................................................................................... 10 3.2 Advancement of Nowcasting Systems....................................................................... 12 3.3 System Trials .............................................................................................................. 18 3.4 Training ...................................................................................................................... 19 3.5 Final demonstration.................................................................................................... 21 3.6 Verification ................................................................................................................. 24 3.7 Social and Economic Impact Assessment .................................................................. 29
4. Discussion and Conclusions................................................................................................... 31 Appendix A. Major Staffs Participating in B08FDP Project................................................... 36 Appendix B. Product List of B08FDP .................................................................................... 37 Appendix C. Milestones of the WWRP B08FDP ................................................................... 38 Appendix D. Summary Reports of B08FDP Participants ....................................................... 39

1
Executive Summary
A WMO World Weather Research Program (WWRP) Forecast Demonstration Project (FDP) was conducted during the Beijing 2008 Olympics to demonstrate the benefits of state-of-the-art nowcasting systems for mitigating high impact weather. The Beijing 2008 Forecast Demonstration Project (B08FDP) was conducted from 2004-2008 with the objective of enhancing the technical weather support to the 2008 Olympic weather services of the China Meteorological Administration (CMA), and to provide an international focus for research and development leading to operational nowcasting. Eight participating international nowcasting systems from Australia, Canada, the United States, China and Hong Kong, China were deployed at the Beijing Meteorological Bureau (BMB) of the CMA to demonstrate and quantify the benefits of an end-to-end nowcasting weather service during the Beijing Olympics. Using the latest science and technology the B08FDP focused on the prediction of convective severe weather in the next six hours, with particular emphasis on the 0-2 h period. The B08FDP met its objectives and it was felt by all that it was a very successful implementation of a WWRP Forecast Demonstration Project from many perspectives. It brought together state of the art nowcasting systems and merged them into a seamless total nowcasting system that addressed a wide range of scales and a broad spectrum of forecast issues. The B08FDP demonstrated an enhanced use of observing systems. CMA made several improvements to its radar infrastructure including the synchronization of four radars within the Beijing region (one of which were newly installed), and implementation of inter-radar calibration. Many other types of observations were made available in real time to the project, including a dense network of AWS measurements, radiosondes, wind profilers, GPS, lightning sensors, and satellite observations. Efficient data frameworks were set up for exchanging observation and nowcast data, including the use of standard netCDF formats for AWS and gridded data, and the development of a new XML-based format (WXML) for thunderstorm and threat area nowcasts. The nowcasting systems demonstrated in B08FDP included both established and new systems. Some mature systems included echo extrapolation and tracking algorithms, as well as severe weather and precipitation nowcasting diagnostics. A recent development in nowcasting science is the blending of radar-based extrapolation forecasts with model output from numerical weather prediction (NWP). Several systems demonstrated this approach, primarily for rainfall nowcasting. It appears that NWP is not yet sufficiently accurate to add value in many cases. Another new approach is the use of ensemble and probability based nowcasts to provide uncertainty information in aid of decision making. Probabilistic precipitation and thunderstorm nowcasts showed a high degree of skill, signifying that the probabilistic approach is extremely promising. Three nowcasting systems include the human forecaster in the process, thus adding the capability to modify, improve, or override the automated guidance. For the first time, real time nowcast verification was available in the FDP, to allow forecasters and experts to get an up-to-the-minute picture of the performance of the various nowcasting systems. The verification gave important quantitative information on biases and random errors to assist users in interpreting the nowcasts. Several enhancements of the nowcasting process were demonstrated in B08FDP. This was particularly

2
relevant in BMB where nowcasting is a fairly new practice. To integrate the nowcasts of several automated systems, consensus products for probability of light, moderate, and heavy precipitation, as well as thunderstorm strike probability, were generated and made available to forecasters. As well as having access to the products from individual systems, forecasters could get an "integrated assessment" from the consensus products that enabled effective decision making without being unwieldy. The consensus products formed the basis for the official warnings prepared in BMB using the newly developed VIPS production system. In preparation for the FDP numerous surveys were conducted with a variety of end users of nowcast products to understand their particular needs for weather and warning information. A user-oriented service strategy was adopted whereby external users in government, the Olympic Organizing Committee, the business sector, and the public accessed the consensus precipitation and thunderstorm products on a special web page. Forecasters had access to the full range of nowcasting products and verification information. Survey results showed positive feedback from decision makers in all spheres, indicating that nowcast products provided useful and timely meteorological information and increased the economic and social benefits of meteorological services. From a program perspective, the Olympic forecasting effort provided a firm focus and hard deadline to accelerate developments that will have a long-lasting legacy. The keys to establishing a successful FDP include a shared and articulated vision, along with a common set of goals and objectives that are clearly defined. The importance of strong leadership cannot be underestimated, including careful project management, effective communication, and follow up of tasks. Finally, forecast demonstration projects are extremely large and complex, both in terms of the technology and the personnel, and cannot succeed without sufficient resources. In terms of technology transfer from Research to Operations, the project employed several strategies to enable project ownership. The timing of the project followed new infrastructure and service initiatives within BMB to advance the state of severe weather forecasting and nowcasting (e.g., CINRAD radar network modernization, supercomputing facility at BMB, development of a nowcasting service). BMB was actively and fully engaged in the collaborative integration and advanced system design, being eager to adapt and accept new technology. Moreover, FDP experts were actively committed to the support of B08 Forecasting Services. Training by experts made in-depth, first hand knowledge accessible to the forecasters and local champions to clearly articulate the strengths and weaknesses of the new systems. An interactive hands-on training methodology provided a controlled simulation environment to facilitate in-depth discussions and learning. At a more personal level, mentoring by experts at home institutes and in ad hoc situations overcame misconceptions and professional barriers and created mutually satisfying peer-level relationships. Many of the unique scientific achievements in B08 were made possible through the participation of several international nowcasting groups and experts in the forecast demonstration project. A complete end to end nowcasting system, starting with high resolution observations and ending with meteorological weather and warning services for external users, was designed and demonstrated. The FDP allowed the inter-comparison of first generation extrapolation-NWP blending systems, and the comparison with blended automated-human nowcast systems. Ensemble nowcasting was a concept developed for B08 and proved highly successful, as did the real-time nowcast verification. B08FDP demonstrated some gaps in scientific knowledge and technical capability that must be addressed in

3
order to improve the accuracy of nowcasting and very short range forecasting. For example, there are different approaches and philosophies that are used to track radar echoes, depending on the goal of the nowcast (accurate precipitation prediction, severe weather warning, etc.). There is no "one approach fits all" and understanding the differences is important for their appropriate use in the weather office. There is a need for more diagnostic functionality in automated nowcasting and verification systems, to assist the user in understanding the situation-dependent behavior of the weather. Nowcasting systems must be tuned for local conditions (e.g., appropriate Z-R relationships), which can be challenging in the face of limited data availability in advance of a FDP. For use in automated nowcasting systems the radar data must be of the highest quality, which means that effective quality control procedures are critical. Other types of high resolution data must be available as input to many of the nowcasting schemes, and as verification data for the nowcast products. The experience of B08 indicated that successful blending of extrapolation forecasts with NWP requires that the model forecasts be sufficiently accurate to add value at time scales beyond an hour or so. This means that radar wind and/or reflectivity data must be assimilated into the model in order to correctly specify convective elements and wind fields at the start of the model run. Even with radar assimilation, further model improvements are necessary to improve their accuracy in the 4-6 hour range. Finally, wind nowcasts remain a challenge.

4
1 Background, Rationale and Goals of the project The 29th Olympic Games were held from 8-24 August 2008 in Beijing, China, and the 13th Paralympics followed from 6-17 September. The geography of Beijing features mountains to the northeast, north and west, and a gently sloping plain extending southeast towards the Bohai Sea, creating a special U-shaped topography. Most of the sporting venues were located on the plains. The complexity of the topography can cause significant forecasting challenges over Beijing during summer with July and August being the major flood-prone period. Climatologically, Beijing can expect a 49.2% daily probability of precipitation and a 25.9% daily probability of thunderstorms during this time of year. High impact weather like strong wind and heavy fog are also likely. All these events could have negative impacts on the normal progress of sporting events, as well as on the athletes and the audience. At the sixth session of Scientific Steering Committee (SSC) of the World Weather Research Programme (WWRP) of the World Meteorological Organization (WMO) in September 2003 the China Meteorological Administration (CMA) proposed to run a Forecast Demonstration Project (FDP) targeted for the Beijing Olympic Games (hereafter referred to as the B08 project). The goal was to enhance technical support to the Beijing 2008 Olympic Games by providing high-impact weather forecasts. This proposal was based on the success and experience of the FDP project for the Sydney 2000 Olympic Games (S2KFDP; Keenan et al. 2003). An advisory group nominated by the SSC visited Beijing from 19-21 July 2004 to assess the B08FDP Scientific Plan and its implementation. The B08 project was officially approved at the 7th SSC session in October 2004. The B08 project included two sub-projects, a nowcasting forecast demonstration project (hereafter referred to as B08FDP) and the Mesoscale Research and Development Project. This report is an overview of the B08FDP, which was mainly focused on forecasts of convective storm tracks, precipitation amount and severe weather events within the 0-6 hour forecast period. The overall mission of the B08FDP was: “Through international collaboration build, demonstrate and quantify the benefits during the B08 Olympic period of an end-to-end nowcasting weather service focused on high impact weather and based on the latest science and technology.” The goals of B08FDP were as follows: (1) Implement advanced high impact weather and precipitation nowcast systems, processes and science for the B08 Olympics where the influence of topography on thunderstorms and precipitation is a significant challenge, thereby providing an enhanced weather service for B08. (2) Demonstrate the correct implementation, introduction, training and use (technology transfer) of advanced nowcast systems into forecast operations.

5
(3) Demonstrate the utility and feasibility of advanced data assimilation techniques and high resolution numerical weather prediction (NWP) for operational nowcasting. (4) Quantify the impact upon forecasters and end users of implementing into a National Meteorological Service (NMS) nowcast systems focused on high impact weather and precipitation. (5) Develop and implement new verification techniques for assessing the effectiveness of nowcasts of high impact weather including quantitative precipitation. (6) Promote the implementation of nowcasting techniques in China and other WMO countries. 2 Participating Systems and Executive Organization 2.1 Participating Systems In total, eight nowcasting systems from Australia, Canada, China, Hong Kong of China and United States participated in the B08FDP. Additionally, working groups on Verification and Social Economic Impact Assessment were established. These working groups were composed of experts from overseas as well as local scientists. (1) BJANC (Beijing Auto-NowCaster) and VDRAS The BJANC is a 0-1 h thunderstorm nowcasting system provided by the Beijing Meteorolog-ical Bureau (BMB). It grew out of a technology transfer activity from the U.S. National Center for Atmospheric Research (NCAR) and was based on the NCAR Auto-Nowcaster. The BJANC ingests multiple data sets including radar, satellite, surface stations, radiosondes and numerical model outputs. From these data sets, a variety of forecast parameters are derived and combined using fuzzy logic to generate the storm nowcasts. Some of the algorithms and forecast rules were modified from those used for the Sydney FDP. These modifications include: (a) algorithms for real-time Quantitative Precipitation Estimation (QPE)and Quantitative Precip-itation Forecasting (QPF) were developed; (b) an optimal Z-R relationship was identified and implemented for the Beijing region; (c) elliptic fitting was changed into irregular polygon fitting for the single-cell tracking algorithm; and (d) a lot of parameters of the system were tuned and some algorithms were optimized based on storm climatology research, case studies and forecast experiments. BJANC produced 30 and 60 minute forecasts of radar reflectivity and precipitation rate with an update rate of 6 minutes. The skill of the system was nowcasting of convective storm initiation, growth and dissipation. Also based on human entered convergence lines, it provided extrapolation forecasts of their future position. The NCAR Variational Radar Data Assimilation System (VDRAS) (Sun and Crook 2001) was another transfer of technology to BMB that was implemented for the B08FDP. VDRAS provided 3 dimensional high resolution analyses of boundary layer fields of wind and temperature perturbations. It was particularly useful for identifying thunderstorm outflows and

6
convergence regions. VDRAS utilizes a 4DVAR cloud model that assimilates radar, AWS and sounding data. Many parts of the VDRAS were improved by NCAR and BMB from those used for the Sydney FDP. The VDRAS had a 12 minute update rate with a 10 minute latency, and had a 3 km horizontal resolution and 375 m vertical resolution, while running at BMB during B08FDP. What was improved for the VDRAS mainly includes: (a) a moist warm-cloud microphysical parameterization scheme was added, and rainwater evaporation and precipitation were used for real-time running in Beijing; (b) soundings extracted from the rapid update cycling mesoscale model (BJ-RUC) were used in the background analysis for the Beijing implementation; (c) continuous cycles, with each cycle including a 12 min 4DVAR window and a 6 min forecast period, were executed in comparison to the cold start cycles at Sydney FDP by using a recursive filter; (d) pre-processing of radar data were improved for restraining effect of clutter and noise on 4DVAR; (e) gradient of temperature perturbations and increment of retrieved fields were added for indicating gust front and change of thermo-dynamical structure, respectively. Other than those improved parts, VDRAS were used under complicated terrain condition in real-time running mode for the first time that validated its efficiency used in mountainous area. (2) CARDS (CAnadian Radar Decision System) CARDS is the operational radar processing system in Environment Canada. It is designed to process volume scan data for a variety of purposes including general weather surveillance, severe weather detection and warning guidance, quantitative precipitation estimation and radar based precipitation nowcasting. The client provides interactive capabilities including product display, animations, pan-zoom, interactive cross-section and “drill down” capability from mosaics to thunderstorm cell level. Products include plan views and vertical slices through the data. For severe weather application, CARDS identifies cells, their properties (area, intensity, mesocyclone, downbursts) and tracks them into the future. A key diagnostic tool is the ability to shift from the synoptic-mesoscale mosaic products used for surveillance immediately down to the multitude of thunderstorm scale products needed for warning decision making. This development was a major legacy of the S2KFDP. For QPE, the system relies on quality controlled data and the appropriate Z-R relationship. For precipitation nowcasting, persistence and cross-correlation area tracking on the planar products are used to determine areal motion and nowcasting 90 minutes into the future. For the purposes of the B08FDP, nowcast plan products were produced. (These are not normally done in Canada, where the standard product is a point forecast presented as a meteogram.) (3) GRAPES-SWIFT (GRAPES-based Severe Weather Integrated Forecasting Tools) GRAPES-SWIFT was initially developed in 2005 by the Guangdong Provincial Meteorological Bureau (GMB) in collaboration with the Chinese Academy of Meteorological Sciences (CAMS). The system is designed to provide an operational platform for strong convective weather nowcasting, incorporating data from China’s new-generation Doppler radar, AWS, satellite and mesoscale NWP model outputs. The platform features convective weather monitoring, analyzing, forecasting and warning functions and GIS-based product displays.
GRAPES-SWIFT includes two components: (a) a non-hydrodynamic mesoscale model called GRAPES (Global/Regional Assimilation PrEdiction System) developed by CAMS, with

7
horizontal resolution of 3 km and 31 vertical layers, which provides 3-houly analysis and 6-hourly forecasts; (b) a nowcasting module, SWIFT, that produces nowcasts using radar data extrapolation techniques and statistical methods. The convective algorithm in GRAPES-SWIFT generates a 2-D radar reflectivity mosaic (2DMOSAIC); quantitative precipitation estimates (QPE), 0-3 hour QPF, convective weather potential (CWP) and single-cell storm identification, tracking and forecasts (SCITF). (4) MAPLE (McGill Algorithm for Precipitation Nowcasting by Lagrangian Extrapolation) The McGill Algorithm for Precipitation Nowcasting Using Lagrangian Extrapolation (MAPLE), developed at McGill University in Montreal, Canada, uses statistical techniques on past radar images to predict the future location and intensity of reflectivity and future quantitative precipitation. Prior to MAPLE processing, data from the four available radars covering the immediate Beijing region were quality controlled and combined into a 3-D mosaic using software developed at the National Severe Storms Laboratory (NSSL). Two output files from the NSSL mosaic software are the composite reflectivity and a “lowest-level” terrain following reflectivity field. Because it is more stable, the composite reflectivity field is used for the generation of MAPLE forecast vectors. However, the QPF is derived from the forecasts of the lowest-level field as the QPF derived from this reflectivity field should be most representative of the precipitation reaching the surface. (5) NIWOT Niwot is a nowcasting system that was developed by NCAR to perform 1 to 6 h forecasts of convective precipitation. The forecasts are based on the merging and blending of precipitation forecasts from the extrapolation of radar echoes with precipitation forecasts from Numerical Weather Prediction (NWP). In B08FDP Niwot used the outputs from the BMB operational model (BJ-RUC). The model is based on a 3DVAR version of a 3 km WRF system that was jointly developed by NCAR and BMB/CMA. The model assimilates upper air data, wind profiles, ground-based GPS water vapor and mesoscale surface data from around Beijing. Niwot then uses a limited set of heuristic rules to perform the blending. The primary assumption for blending is that the location of the precipitation is best forecast by radar echo extrapolation and the numerical model provides skill in forecasting changes in the extent of the precipitation. Therefore if radar echos >35 dBZ are present at the forecast issue time, then the forecast is based on the extrapolated radar echo and the area of the extrapolated echo is increased or decreased based on the fractional change in model forecast area. If no radar echo >35 dBZ is present at the forecast issue time and NWP predicts the initiation of convection, then the NWP forecast is used as the forecast. In addition, Niwot allows a manual modification of the automated blend forecast. The forecaster can select any location and modify the forecast as desired. Niwot products include hourly radar reflectivity forecasts for 1-6 hours with a horizontal resolution of 1 km. Forecasts were available hourly from: a) radar echo extrapolation, b) model precipitation converted to reflectivity, c) blended forecast described above and d) human modified forecast of the above blended forecast.
8
(6) STEPS (Short Term Ensemble Prediction System) STEPS is the improved quantitative radar precipitation estimating and forecasting system based on S-PROG that participated in the Sydney FDP, and was jointly developed by the Australian Bureau of Meteorology and UK Met Office. STEPS further improved the echo tracking algorithm run in S-PROG and an ensemble precipitation forecasting component was added. The radar quantitative precipitation estimation system includes algorithms that account for partial beam blocking by the topography, removal of clutter due to anomalous propagation, sea and ground returns, correction for the vertical profile of reflectivity, separate Z-R relations for widespread and convective rainfall, and real-time bias adjustment using rain gauges as ground truth. The STEPS system uses a statistical model to generate ensembles of spatial and temporal precipitation patterns in the forecast period. The ensemble forecasts are used to derive the probability of exceeding a number of rainfall thresholds in the next 60 minutes. Major STEPS products include hourly accumulated quantitative precipitation analysis (QPE), precipitation forecasts in next 30, 60 and 90 minutes, and the probability exceeding 1, 2, 5, 10, 20 and 50 mm precipitation in the next hour. (7) SWIRLS (Short-range Warning of Intense Rainstorms in Localized Systems) The Hong Kong Observatory nowcasting system, SWIRLS, has been in operation since 1999. Its second-generation version (referred to as SWIRLS-2) has been under development and real-time testing in Hong Kong since 2007. For B08FDP, a special version of SWIRLS-2 was deployed for Beijing. The original SWIRLS focused primarily on rainstorm and storm track predictions. The much enhanced SWIRLS-2 comprises a family of sub-systems for ingestion of conventional and remote-sensing observation data, execution of nowcasting algorithms, as well as generation, dissemination and visualization of products via different channels. It embraces new nowcasting techniques, namely: (a) blending and combined use of radar-based nowcast and high-resolution NWP model analysis and forecast; (b) detection and nowcasting of high-impact weather including lightning, severe squalls and hail based on conceptual models; (c) grid-based, multi-scale storm-tracking method; and (d) probabilistic representation of nowcast uncertainties arising from storm tracking, growth and decay. Further details can be found in Section 3.2, Summary Report on SWIRLS in Appendix D, Yeung et al. 2009 and Wong et al. 2009.
Major SWIRLS products in B08FDP standard formats include rainfall accumulation forecast out to 6 hours, probability forecast for precipitation and lightning, radar-echo motion vectors, storm-cell track analysis and forecast, weather threat forecast for rainstorm, cloud-to-ground lightning initiation, severe downburst and hail, as well as severe squalls forecast for the urban domain of Beijing. Additionally, SWIRLS also features various interactive graphical user interfaces (GUI), including a Tephigram viewer, a echo-motion field viewer, a thunderstorm and severe weather viewer, an integrated alerting panel, KML products displayable on Google Earth and web pages for the display of NWP charts and satellite imageries, all tailor-made for the local environment and warning criteria. These interactive tools turned out to be essential for weather discussions among local champions and nowcast experts during the IOP.

9
(8) TIFS (Thunderstorm Interactive Forecast System) TIFS is an interactive forecast and warning production system of the Australian Bureau of Meteorology. It was developed in 1999 as a means of visualizing the output from nowcasting systems deployed as part of the Sydney Olympics 2000 Forecast Demonstration Project. It has a graphical user interface (GUI) through which forecasters can view and edit the output of radar algorithms to produce text and graphical thunderstorm warnings. In the B08FDP project, TIFS is further developed to generate consensus products from a “poor man’s ensemble” of forecasts taken from participating FDP systems.
2.2 Executive Organization
The B08 project was jointly led by the Scientific Steering Committee of the WWRP and the Leading Group of the Olympic Weather Support of CMA.
Under WWRP an international scientific steering committee was established for B08FDP. The committees were composed of experts from the participating institutions and a number of invited experts. Their responsibilities included formulating the scientific and technological principles of the FDP. Ms. Wang Jianjie, senior research fellow from Beijing Meteorological Bureau, and Dr. Tom Keenan from the Australian Bureau of Meteorology co-chaired the B08FDP SSC (Appendix A). Accordingly, CMA set up a project management team to coordinate the project implementation. Mr. Xie Pu, the director general of BMB, was nominated as the project manager. In addition, various working groups were also established, such as data environment WG, forecasting support WG, products/web WG, training support WG and logistics support WG, to provide local technical support, resources, environmental support and logistic for the B08 participating systems.
WMOWWRP
B08 FDPProject Manager B08 FDP SSC
Management Group
Data Environment WG
CMA Leading Group of Olympic Weather Support
Forecast Support WGProducts/web WG
Nowcasting WGs Verification WG
SEIA WG
Logistic Support WGTraining Support WG
Operation Management
Science Guidance
Figure 1. Executive organization of the B08FDP project.

10
3 Implementation of B08FDP The B08FDP implementation was divided into four main phases:
Establishing the local operating environment (from 2005 to June 2006); the main tasks were to create a local data environment, and to achieve system R&D and localization.
Testing, optimization and training (from June 2006 to July 2008); during this time two real-time tests of the nowcasting systems were conducted, the systems were optimized, and forecasters were trained.
Final demonstration (from 15 July to 20 September 2008); during this time the systems formally provided users with forecasts and products; the system experts were onsite during the Olympic period.
Summary phase (from October 2008 to July 2009).
The remainder of this chapter provides further details on the various aspects of the B08FDP implementation: data environment, improvement and development of nowcasting techniques, system trials, training, final demonstration, verification, and impact assessment.
3.1 Data Environment
3.1.1 Observation Network
Figure 2. Layout of observation stations for B08FDP.
In order to provide a more effective Olympic weather service and to support the B08FDP operation, CMA improved its meteorological observation networks and related information systems in Beijing and surrounding areas. The observation stations used for B08FDP were within the range of 600 km × 600 km of Beijing (Figure 2), including four Doppler weather radars, 106 automatic weather stations (AWSs), a tropospheric wind profiler, a lightning positioning system and five radiosonde stations. FY-2C meteorological satellite data and its derived products were also provided.
11
3.1.2 Data Collection and Quality Control
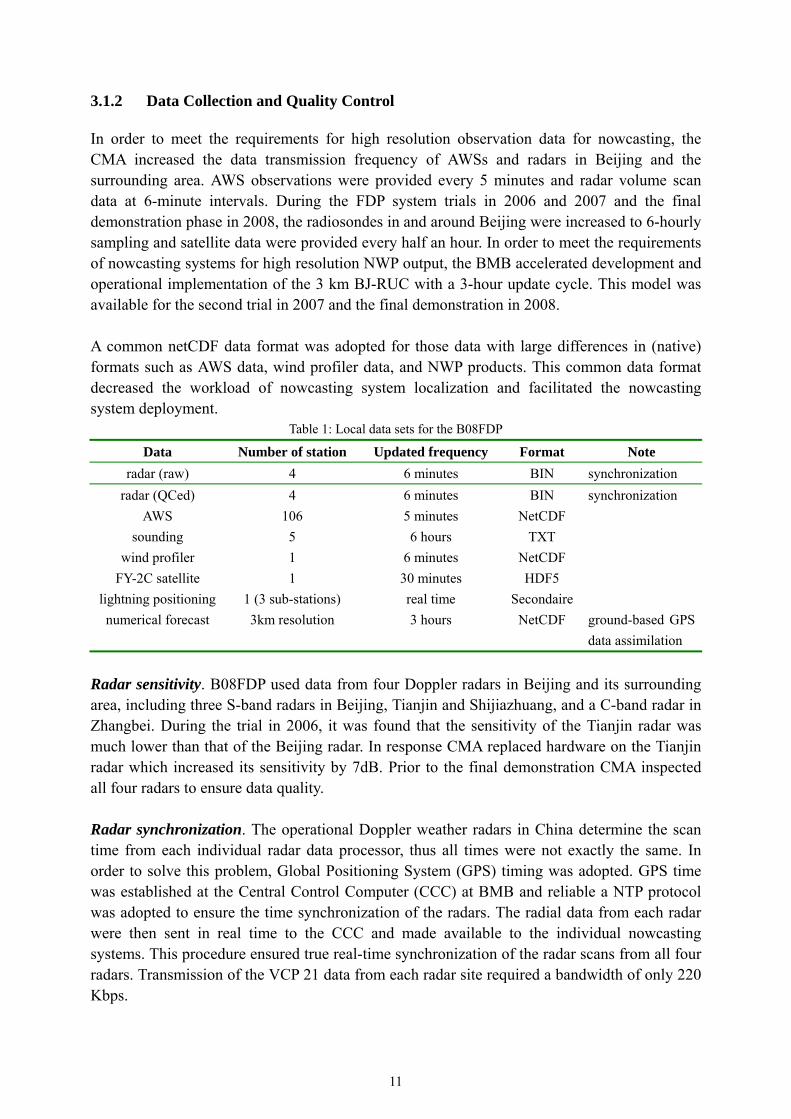
In order to meet the requirements for high resolution observation data for nowcasting, the CMA increased the data transmission frequency of AWSs and radars in Beijing and the surrounding area. AWS observations were provided every 5 minutes and radar volume scan data at 6-minute intervals. During the FDP system trials in 2006 and 2007 and the final demonstration phase in 2008, the radiosondes in and around Beijing were increased to 6-hourly sampling and satellite data were provided every half an hour. In order to meet the requirements of nowcasting systems for high resolution NWP output, the BMB accelerated development and operational implementation of the 3 km BJ-RUC with a 3-hour update cycle. This model was available for the second trial in 2007 and the final demonstration in 2008. A common netCDF data format was adopted for those data with large differences in (native) formats such as AWS data, wind profiler data, and NWP products. This common data format decreased the workload of nowcasting system localization and facilitated the nowcasting system deployment.
Table 1: Local data sets for the B08FDP
Data Number of station Updated frequency Format Note radar (raw) 4 6 minutes BIN synchronization
radar (QCed) 4 6 minutes BIN synchronization AWS 106 5 minutes NetCDF
sounding 5 6 hours TXT wind profiler 1 6 minutes NetCDF
FY-2C satellite 1 30 minutes HDF5 lightning positioning 1 (3 sub-stations) real time Secondaire numerical forecast 3km resolution 3 hours NetCDF ground-based GPS
data assimilation
Radar sensitivity. B08FDP used data from four Doppler radars in Beijing and its surrounding area, including three S-band radars in Beijing, Tianjin and Shijiazhuang, and a C-band radar in Zhangbei. During the trial in 2006, it was found that the sensitivity of the Tianjin radar was much lower than that of the Beijing radar. In response CMA replaced hardware on the Tianjin radar which increased its sensitivity by 7dB. Prior to the final demonstration CMA inspected all four radars to ensure data quality. Radar synchronization. The operational Doppler weather radars in China determine the scan time from each individual radar data processor, thus all times were not exactly the same. In order to solve this problem, Global Positioning System (GPS) timing was adopted. GPS time was established at the Central Control Computer (CCC) at BMB and reliable a NTP protocol was adopted to ensure the time synchronization of the radars. The radial data from each radar were then sent in real time to the CCC and made available to the individual nowcasting systems. This procedure ensured true real-time synchronization of the radar scans from all four radars. Transmission of the VCP 21 data from each radar site required a bandwidth of only 220 Kbps.

12
Radar AP clutter filtering. Most B08FDP nowcasting systems did not bring their own quality control algorithms. The Tianjin radar was particularly susceptible to extensive anomalous propagation which could significantly degrade the data quality over a large region. In addition, permanent ground clutter was a common problem with the Beijing radar. After comparative analyses, the B08FDP Data Working Group decided to adopt the radar data quality control method developed of Prof. Liu Liping of CAMS/CMA. The CARDS, MAPLE, STEPS and SWIRLS systems all used this quality control algorithm. The BJANC and Niwot systems used their own quality control algorithms which were very similar to that of Prof. Liu's technique. 3.1.3 Overall Operating Status During the final forecast demonstration in 2008 the data server and network equipment operated stably, resulting in a high data collection rate and timely product availability. Table 2 shows data availability rates between 96% and 100%.
Table 2: Data available statistics for local data during 2008
Data Type Period of the
Olympic Games[1] Period of the
Paralympic Games[2] Both periods [3]
AWS 98.82% 98.85% 97.88%
Beijing 99.73% 99.93% 99.18%
Tianjin 99.66% 99.90% 99.20% Shijiazhuang 99.90% 99.31% 97.69%
Zhangbei 98.77% 98.47% 96.41%
Doppler radar
All 99.52% 99.40% 98.12%
Wind profiler radar 100% 100% 97.40%
Intensive sounding[4] 100% 100% 100%
Geostationary Met satellite[5] 746 295 3,245
Lightning positioning[6] 181 67 781 Note: [1] The statistical time was from 00:00 August 8 to 23:59 August 24, 2008; [2] The statistical time was from 00:00 September 6 to 23:59 September 17, 2008; [3] The statistical time was from 00:00 June 25 to 23:59 September 20, 2008; missing time for equipment testing and repairing
was not corrected; [4] Intensive sounding started on July 1, 2008; [5] Intensive sounding stopped on August 24, 2008.8.24 (Beijing time); because the satellite entered into the autumn shadow of
the earth from September 5, there were no observational data in part of period of time, only with the number of files to be recorded;
[6] Files were generated only when lightning occurred, so only the number of files was recorded.
3.2 Advancement of Nowcasting Systems
3.2.1 Research on Thunderstorm Forecasting in Beijing The unique geographical and climatic characteristics of Beijing strongly influence the occurrence and evolution of severe convective weather. In order to ensure that the nowcasting systems could optimally represent these characteristics, FDP experts localized their systems.
13
BMB and NCAR jointly studied the occurrence and evolution of thunderstorms in Beijing. The climatic characteristics of convective thunderstorms and their evolution were investigated using radar data collected from 2003 to 2005. The studies examined thunderstorm tracks, thunderstorm behavior over mountains, occurrence rates, evolution and dissipation of thunderstorm, and the impact of large-scale weather patterns. Based on these findings, the fuzzy logic synthetic algorithm of the BJANC system was partially modified. In addition, based on thunderstorm evolution studies during the test phases in 2006 and 2007, forecast rules of thumb were suggested (see Summary Report on NIWOT in Appendix D for more details). During the final demonstration these rules were utilized by the FDP experts when modifying the automatic ensemble forecasts generated by TIFS. 3.2.2 Echo Extrapolation/Tracking Algorithm BJANC thunderstorm identification, track and extrapolation algorithm. The BJANC used two echo extrapolation techniques. The first is a cell identification and tracking algorithm based on the Thunderstorm Identification, Tracking, Analysis and Nowcasting (TITAN) technique of Dixon (1993). The second is an area echo extrapolation algorithm which is based on the Tracking Radar Echoes by Correlation (TREC) technique developed by Rinehart (1978) and Tuttle (1990). SWIRLS radar-echo tracking algorithms. SWIRLS has three tracking algorithms: (a) TREC, the traditional technique of tracking radar echoes by correlation; (b) GTrack (meaning group tracking), a cell tracker which identifies, analyzes and determines a storm cell’s motion by extrapolating the latest 6-min displacement vector of the cell centroids (similar to the TITAN approach in two dimensions); and (c) MOVA (Multi-scale Optical flow by Variational Analysis), a newly developed radar tracking technique which retrieves echo motion from successive reflectivity fields by solving the optical flow equation using variational minimization method. In MOVA, a multi-level cascade computation is adopted so that echo-motion fields at decreasing spatial scales can be obtained subject to prescribed smoothness constraint. To produce standard B08FDP products, TREC was used for QPF and MOVA for thunderstorm and severe weather track forecasts. GTrack was used mainly for cell identification and analysis. In the interactive GUI of SWIRLS, GTrack’s centroid displacement vector was also retained as an optional thunderstorm track forecast method. GRAPES-SWIFT extrapolation algorithm. The extrapolation technique is called COntinuity of TREC vectors (COTREC) (Li et al. 1995). This is a modified version of the above TREC technique that fills holes in the field of extrapolation vectors. For forecast periods beyond 1 hour the motion is estimated using model wind forecasts at an atmospheric level corresponding to the altitude of the COTREC extrapolation vectors for the first hour. STEPS extrapolation algorithm. STEPS uses the optical flow method to estimate the motion of rain areas. These vectors are smoothed to reduce the divergence in the field. MAPLE extrapolation algorithm. MAPLE uses a combination of statistical methods and

14
Lagrangian persistence to estimate reflectivity and intensity out to several hours in advance depending on the domain size. Filtering techniques are used to determine the period of predictability (and thus continuation) of differing scales. 3.2.3 Blending Echo Extrapolation with NWP The Sydney 2000 FDP showed that initiation, growth and dissipation of thunderstorm must be considered even for the 30-60 minute forecast periods. Nowcasting systems that use echo extrapolation alone will have a limited ability to predict thunderstorms even for one hour. Therefore, nowcasting systems are beginning to explore techniques that blend NWP with echo extrapolation. Among the eight nowcasting systems that participated in the B08FDP, three of them (NIWOT, SWIRLS and GRAPES-SWIFT) used blending techniques. NIWOT Blending Algorithm. This technique assumes that the location of the precipitation is best forecast by radar echo extrapolation and that NWP provides skill in forecasting changes in the extent of the precipitation. Thus if radar echo >35 dBZ is present at the forecast issue time, then the forecast is based on the extrapolated radar echo location and the area of the extrapolated echo is increased or decreased based on the fractional change in model forecast area∗. If no radar echo >35 dBZ is present at the forecast issue time and NWP forecast contains echo, then the NWP forecast is used as the forecast. In addition, NIWOT permits manual modification of the blended forecast. SWIRLS Blending Algorithm. The blending algorithm was implemented under a sub-system called RAPIDS (Rainstorm Analysis and Prediction Integrated Data Processing System) (Wong and Lai, 2006). In essence, RAPIDS renders the blending between radar-based and NWP model-based QPFs as a weighted average of the two fields. The weight for the model QPF increases hyperbolically with lead time and the “crossover point” set around T+3 hours. The radar-based QPF input came from the extrapolation of a QPE field (viz. 2-km reflectivity converted to rainfall rate using a raingauge-calibrated Marshall-Palmer relation) out to 6 hours by semi-Lagrangian advection. The model QPF came from the Non-Hydrostatic Model (NHM) of the Japan Meteorological Agency, adapted and specially configured for the Beijing domain. Before the blending, the NHM QPF was first corrected for phase (viz. timing or location) and intensity errors. GRAPES Blending Algorithm. An extrapolation vector field was obtained using fuzzy logic to blend the precipitation extrapolation vector from the COTREC algorithm with the horizontal wind field forecast from GRAPES (Feng et al., 2007a). 3.2.4 Probabilistic Nowcasting Forecasting of high impact weather such as heavy precipitation has significant error even for the 30 minute to 6 hour time period. In order to better describe the uncertainty probabilistic nowcasting was tested during B08FDP. STEPS and SWIRLS produced probabilistic ∗ Model reflectivity can be estimated from model precipitation through the Z-R relation.

15
precipitation forecasts using different approaches. SWIRLS also provided probabilistic lightning forecasts, and TIFS provides probabilistic precipitation and storm track forecasts using output from other FDP systems.
STEPS Probabilistic Precipitation Algorithm. STEPS generates probabilistic precipitation forecasts for the next 60 minutes using a stochastic model. First, the rate at which the rainfall pattern is changing is calculated by estimating the correlations between the three most recent radar maps for a number of spatial scales. This information is used to estimate the parameters of a statistical model that stochastically generates an ensemble of rain fields that move and change in time. The ensemble of rainfall forecasts is further modified by perturbing the extrapolation vectors. The ensemble is then used to calculate the probability of exceeding a range of rainfall thresholds in the next 60 minutes. SWIRLS Probabilistic Precipitation and Lightning Algorithm. To represent the uncertainties inherent in QPE and QPF, especially those with long lead times (3-6 hours), SWIRLS adopted a simple probabilistic approach which took advantage of the readily available rainfall forecasts generated by RAPIDS in the current and past update cycles in the preceding one hour period. Initialized at different base times, such forecasts were treated as time-lagged “perturbations” which presumably sampled the underlying uncertainties. When pooled together as an ensemble, such “perturbed” forecasts were used to calculate the probability of precipitation (PoP) as the fraction of member forecasts exceeding a given rainfall threshold. Exponentially decreasing weights were given to ensemble members with increasing time lag to account for their general loss of skills as a function of lead time (Wong et al. 2009). Isothermal radar reflectivity in the mixed-phase layer (0 to -20°C) were found to be useful precursor to lightning initiation (Yeung et al. 2007, 2009). Assuming the exceedance of such isothermal reflectivity over a certain threshold value would trigger the occurrence of lightning, the probability of lightning was calculated in a time-lagged ensemble of forecast isothermal reflectivity fields in a way similar to the PoP algorithm. TIFS Probabilistic Precipitation and Storm Track Algorithm. TIFS probabilistic precipitation products were based on a “poor man’s” ensemble. The ensemble was obtained by equally weighting the forecasts from each contributing FDP system (BJANC, CARDS, GRAPES-SWIFT, MAPLE, STEPS, and SWIRLS). TIFS also used the Thunderstorm Environment Strike Probability Algorithm (Dance et al. 2009) to calculate the strike probability from thunderstorms using the modeled error characteristics of predicted thunderstorm tracks. This method accounts for the uncertainty in future thunderstorm position by transforming thunderstorm nowcasts from cell-tracking algorithms such as TITAN, CARDS, and SWIRLS into a strike probability (i.e., the probability that a given location will be impacted by a thunderstorm in a given period), based upon a bivariate Gaussian distribution of speed and direction errors.
3.2.5 Severe Weather Nowcasting
16
Different approaches were adopted by CARDS, GRAPES-SWIFT and SWIRLS to detect and forecast severe weather events. While CARDS focused on radar analysis, GRAPES-SWIFT and SWIRLS also made use of other observation data and outputs from model analysis and forecast. GRAPES-SWIFT Convective Weather Potential (CWP). The CWP algorithm was applied to provide probabilistic forecast for severe weather (wind gust, hail and tornado) occurrences in 60 min valid time and within the radius of 60 km from storm centroid. Thunderstorm cells were automatically identified by radar echoes with intensity greater than or equal to 50 dB(Z) and of an area over 64 square kilometers. The algorithm digests predictor data from radar reflectivity, AWS and GRAPES-CHAF output. The predictand was the probability of a thunderstorm cell to generate severe convective weather events. The predictor-predictand relationship was established through a stepwise multiple linear regression approach based on a two-year dataset from Guangdong. In real time forecast, a storm cell having a value of CWP exceeding the threshold 0.195 would indicate potential occurrence of severe weather events, and thus would be highlighted with a shaded circle. CARDS Severe Weather Applications. Intense thunderstorm cells are identified using the interest field and pattern vector approach (Zrnic et al, 1985; Dixon and Weiner, 1995). In CARDS, the same core subroutines are used for the pattern vector search as for the other severe weather feature algorithms. The only difference is the interest field. Various products can be used as the input or interest field. For B08FDP and in Canada, the MAXR product is used. The threshold is configurable but for B08FDP, a fixed 45 dBZ threshold was used (see Summary Report on CARDS in Appendix D for more details). Azimuthal Shear Algorithm (Mesocyclone) — The interest field in this case is the azimuthal shear field. When computing the shear field, an inherent assumption is made about the maximum gate to gate velocity difference be less than the Nyquist velocity and this implicitly de-aliases the velocity data. The algorithm can therefore handle both S and C Band data. However, the limitations of the smaller C Band Nyquist velocities are not overcome. A significant note is that this algorithm is a misnomer. Low thresholds are used to attempt to have high Probability of Detection for these severe and rare events so the algorithms finds azimuthal. Positive Radial Shear Algorithm (Divergence or Downburst) — The interest field is the radial shear field and the algorithm searches for positive shear values. Negative Radial Shear Algorithm (Convergence or Gust Front) — The interest field is radial shear and the search algorithm searches for negative shear values. This is not a very robust algorithm since the gust fronts are often in very low reflectivity zones and the data is patchy and ill defined. Bounded Weak Echo Region — The algorithm searches for an inverted cup of reflectivity. An interest field is created by a three-dimensional search (count) of the number of positive reflectivity
17
gradients in horizontal and vertical directions. The height of the top of the BWER is reported as the severity indicator. SWIRLS Severe Weather Nowcasting Algorithms. For the detection of severe weather and subsequent nowcasts with useful lead times, SWIRLS-2 makes use of conceptual models to help select and extract the essential and most critical information. To keep the necessary computation to an affordable level, the conceptual models adopted are simplified as far as possible: Lightning — the sub-system for forecasting cloud-to-ground (CG) lightning initiation is called DELITE (Detection of cloud Electrification and Lightning based on Isothermal Thunderstorm Echoes). The chief precursors came from an underlying conceptual model of an electrifying cumulus cloud with its main source of lightning located in isothermal layers above the freezing level, i.e. the mixed-phase layer between 0 to -20°C, with typical charge carriers in the form of ice or graupel that can be detected as radar echoes when wet. To retrieve echoes at constant temperature level, the detailed thermal structure of the troposphere must be known in near real-time. Analyses of isothermal echoes were facilitated by the use of model temperature analysis data (Yeung et al. 2007, 2009). Severe squalls — the sub-system for downburst/squalls nowcasting is called BLAAST (Buoyancy contribution and Loading effect of rain water to Air parcel Acceleration in Squally Thunderstorms). The conceptual model adopted here refers to the descending forces that create a downburst, namely the combined effect of negative buoyancy as a result of evaporative cooling of falling rain drops and the water loading effect on an air parcel. The latter effect manifested itself under radar surveillance as the vertically integrated liquid water, a quantity readily available from typical radar processing software (Yeung et al. 2008, 2009). Hail — the hail nowcasting sub-system is called BRINGO (Buoyancy-supported Rimed Ice Nugget and Graupel Overhang). Its design was based on the automatic detection of overhanging intense radar echoes, typically found in hailstorms as a result of strong inflow and buoyancy in the riming process for ice or graupel (Yeung et al. 2009). 3.2.6 Man-Machine Interaction Although nowcasting systems are continually being improved experience has shown that the human forecaster can often improve upon the automated forecast. For example the forecaster can recognize abnormal automated extrapolations that result from misidentification of storms between two time periods. Most automated systems do not handle initiation, growth and dissipation well which the forecaster can sometimes correct. A good example for Beijing is that storms often dissipate when moving from the mountains to the plains. None of the nowcasting systems during B08FDP accounted for this phenomenon. The BJANC does have the capability to make such nowcasts based on storm characteristics, environmental stability and storm location; however a corresponding rule was not in place. The BJANC, Niwot and TIFS have incorporated man-machine interfaces that allow for human input or modification of the forecast.

18
BJANC Interactive function. The forecaster can manually enter convergence line locations which the computer then extrapolates. A number of forecast variables within the BJANC make use this extrapolated convergence line information to forecast storm initiation, growth and dissipation. NIWOT Interactive Function. The forecaster can select locations for modifying the automated blended reflectivity forecast by drawing polygons and then requesting within each polygon one of the following options: a) use only the model forecast, b) use only the extrapolation forecast, c) grow or dissipate the area and intensity of the forecast by a select amount and d) manually insert a radar reflectivity echo. TIFS Interactive Function. TIFS is a platform that automatically integrates thunderstorm tracking products from CARDS, SWIRLS and TITAN*. The result is an ellipse representing the forecast location, size, and intensity of individual thunderstorm cells. The forecaster can modify each cell in terms of the location, size, intensity and motion, and a cell may be deleted or added. The revised inputs automatically generate new probabilistic thunderstorm forecasts.
3.3 System Trials 3.3.1 First System Trial In July-August 2006, the first B08FDP system trial was held. This was the first deployment of B08FDP nowcasting systems in the Beijing Meteorological Bureau. The purpose was to test the ability of participating systems to perform in the local data environment of Beijing. The local forecasters were not involved in the process. Seven nowcasting systems (TIFS, STEPS, CARDS, SWIRLS, NIWOT, BJANC and GRAPES-SWIFT) and a real-time verification system (RTFV) participated in the trial. Among them, TIFS, STEPS, RTFV, CARDS, SWIRLS were installed in the BMB headquarters; NIWOT and BJANC were deployed at the Institute of Urban Meteorology, and GRAPES-SWIFT at the Chinese Academy of Meteorological Sciences. Data available for the trial included 50 automatic weather stations near Beijing, two radars in Beijing and Tianjin, FY-2C satellite data (updated every 15 minutes), and lightning detections. During a 30-day test, the nowcast systems successfully completed the processes of installation, commissioning, local data access, and forecast product generation. With the exception of GRAPES-SWIFT all the systems successfully ran in real time using the local data. GRAPES-SWIFT operated in a non-real time manner due to communication issues. Although it was decided before the trial that products from the forecasting systems should output their products in either NetCDF or XML, most systems did not strictly follow the specifications. The purpose for common formats was for direct input to the real-time verification system. Thus for the first trial only SWIRLS was successfully accessed by the RTFV system.
* The radar extrapolation system called TITAN was part of TIFS and not a stand alone system.

19
3.3.2 Second System Trial In July-August 2007, the second B08FDP system trial was held. Before the second trial, many of the problems identified in the first trial were resolved. The SSC determined the final set of forecast products and specified the verification regions. During the test period, the eight participating systems (including MAPLE, a system that requested to join in late 2006) were all installed and operated in the FDP Office adjacent to the BMB official forecasting headquarters. All of the local data required by the project were available for this trial. The 2007 trial showed that the FDP participating systems were able to run in real time within the BMB data environment. This included correctly reading the local data, operating stably, outputting products in a specified format, and making real-time transmission to the FDP product server. TIFS, an integrator of B08FDP products, managed to extract products from SWIRLS and STEPS. It also generated forecasts and warnings using TITAN and WDSS which were packaged within TIFS. During the test, the real-time verification system (RTFV) underwent its first functional systematic test in automatic mode. Most FDP products were converted into the format required for input to RTFV. The verification results were output and transmitted to the B08FDP web-page. The deficiency was that RTFV could not maintain a long stable operation. In order to provide forecasters with a convenient platform for access to FDP products, the BMB developed a web page to display the products. Also tested at the same time were web products for the public, special purposes and real-time verification. A Local Forecast Support Group was set up within the Olympic Meteorological Service Team of BMB. The purposes were to a) enhance the FDP’s interface with the actual operation of the BMB, b) improve the relevance and performance of the FDP systems, c) monitor system operations, d) assess systems performance, e) serve as a bridge between the FDP experts and forecasters for timely communication and feedbacks, and f) participate in the weather discussions hosted by the Weather Office and make comments on the FDP systems. By the end of the second trial, a real-time FDP operating process was in place including local data availability, product generation, and user delivery and feedback. 3.4 Training While implementing the B08FDP, the BMB also organized training of seven BMB staff on CARDS, TIFS, STEPS, RTFV and NIWOT. This training was done separately in the Meteorological Service of Canada, Australian Bureau of Meteorology Research Center, and US National Center for Atmospheric Research. These staff were then able to assist in developing, testing and improving the systems. In addition, one person received training at BOM on how to assess socio-economic benefits and impact. The trained staff were then sufficiently competent to maintain the local operation of the participating nowcasting systems even in the absence of international experts. They also conducted research tasks like identifying the appropriate Z-R relationship for Beijing.

20
3.4.1 First Training Workshop From 10-20 April 2007, the first B08FDP training workshop was organized, with the primary purpose of familiarizing the trainees with the core functions and operating interfaces of the B08FDP nowcasting systems. The training introduced six of the FDP nowcasting systems, including hands-on practice. Fourteen forecasters from local meteorological bureaus (Beijing, Tianjin, Hebei, Shanxi and Inner Mongolia including NMC/CMA) participated in the training event. 3.4.2 Second Training Workshop From 7 to 14 July 2008, the second B08FDP training workshop was held. The primary purpose was to allow trainees to understand and use FDP products, and to prepare for providing meteorological services in support for the Olympic Games. The training included an introduction to algorithms used by the FDP, interpretation of forecast verification results including those from the 2007 trial period, and simulation and analysis of precipitation cases from 2007.
The training was conducted in an interactive manner, focusing on forecast simulations for six major precipitation cases in Beijing during the 2007 trial. Selected cases included stratiform precipitation, squall lines and locally initiated convective systems. These represented typical precipitation events that might occur during the Olympic Games. Each FDP expert led the class on one of the 2007 cases to simulate forecasting for the event. The experts selected decision points where the class was to make 0-6 hour forecasts. The class was provided only that data available at the time of the decision point. Trainees were asked to give their own views and justification for their forecasts. The forecasts were then compared with what actually happened. A discussion followed on what meteorological factors the forecaster should consider and which nowcasting system products would be most relevant for the meteorological situation. The trainees included those forecasters who would use B08FDP products during the Olympic Games, four local champions, forecasters from the BMB Nowcasting Section, forecasters from the Specialized BMB Forecast Office, and forecasters from CAAC North China Air Control Bureau. Before the training, the chief forecaster of the BMB was invited to make analyses and explanatory notes of the synoptic weather background behind the training cases. Taking into account the language barrier, Prof Yu Xiaoding was invited to act as on-the-spot interpreter. It is worth noting that in the training process, the trainers did not confine themselves to only FDP products. Instead, all the available observations, NWP and nowcasting products were pooled with the trainers' own short-range/nowcasting experiences to provide realistic situational guidance. Each trainee was asked to make his/her own forecast and to explain the logic. Through this practical forecasting simulation, the trainees were fully and enthusiastically motivated. FDP systems’ products were being applied in the analysis of forecast cases. What mattered most was that the trainees had better and perceptual knowledge of short-range, very-short-range forecast and nowcasting, which they needed for their actual service for the 2008 Olympic Games.

21
3.5 Final demonstration 3.5.1 Overview The B08FDP project entered its final demonstration on 15 July 2008, which lasted for 68 days until 20 September 2008, covering both the Beijing Olympic Games and Paralympic Games. The Intensive Operation Period (IOP) was between 1 and 24 August 2008. All together, 16 experts∗ including representatives from eight nowcasting/verification systems and six forecasters from Meteorological Service of Canada (MSC) were on duty at BMB. The 16 experts worked with four local champions to ensure smooth system operation including product generation, nowcast advisories and consultation with BMB forecasters. The forecasting demonstration period coincided with the main rainy season in Beijing. Thirteen precipitation events occurred during the Olympic Games and Paralympic Games (Table 3), providing good opportunities for system demonstration. In addition, from 15 July to 20 September, county meteorological offices under BMB responsibility observed five hail events.
Table 3: List of rainfall events during the Olympic Games and Paralympic Games. Major rainfall events
(Beijing time, UTC+8 h) Nature and intensity of rainfall Average
rainfall in urban area
(mm)
Average citywide rainfall (mm)
8 Aug 20:00 - 9 Aug 08:00 Local thunderstorm 0.0 4
10 Aug 08:00 - 11 Aug 08:00 Citywide heavy-torrential rain, local rainstorm accompanied by thunder & lightning
67 60
11 Aug 14:00 - 12 Aug 06:00 Citywide light-moderate rain; local heavy rain 12 11
14 Aug 08:00 - 15 Aug 06:00 Citywide moderate-heavy rain; local rainstorm accompanied by thunder & lightning; hail reported by Haidian Station
25
17
17 Aug 08:00 - 18 Aug 08:00 Local light-moderate rain 0.3 2 20 Aug 20:00 - 21 Aug 08:00 Citywide light-moderate rain 10 9 23 Aug 20:00 - 24 Aug 06:00 Local light rain 0.5 0.7 24 Aug 14:00 - 25 Aug 06:00 Local thunderstorm 0.0 3
7 Sep 02:00 - 7 Sep 20:00 Citywide moderate-heavy rain; local torrential rain with thunder & lightning
26 17
9 Sep 00:00 - 10 Sep 08:00 Citywide moderate-heavy rain without thunder & lightning
22 23
14 Sep 18:00 - 15 Sep 00:00 Citywide thunder + rain; hail reported by Yanqing Station
3 5
16 Sep 02:00 - 09:00 Local thunder shower 0.8 0.5 16 Sep 16:00 - 20:00 Citywide thunder shower 7 8
∗ Experts on duty during the Intensive Operation Period include: Y. Feng, J. Xue, P. Joe, J. Wilson, J. Bally, J. Sun, M. Chen,
H. Yeung, E. Ebert, R. Roberts, S. Wong, J. Gadal, R. Lee, P. Vaillancourt, K. Chung, D. Hudak

22
3.5.2 WWRP forecasting products
(a)
(b) (c) (d)
(e) (f) (g)
Figure 3. Web page examples of B08FDP products: (a) FDP forecasting opinions and ensemble forecast products, (b) storm tracking products, (c) quantitative precipitation forecasts, (d) reflectivity forecasts, (e) CARDS venue forecasting products, (f) VDRAS-retrieved perturbation temperature field, (g) real-time verification showing quantile-quantile plots.
During the demonstration period, products from the nowcasting systems included quantitative precipitation estimation and forecasts, probability of precipitation forecasts, echo tracking,

23
reflectivity forecasts, severe convective weather forecasts, and analysis of physical variables in the lower troposphere (please see Appendix B for details). In addition to the individual system products, TIFS produced integrated probability forecasts for precipitation and thunderstorm location that were based on combining nowcasts from the individual systems. Based on BMB operational criteria for issuing early warnings, TIFS generated probability forecasts of rain exceeding thresholds of 2 mm in one hour, and 40 and 80 mm in three hours. Examples of nowcasts produced during B08FDP are shown in Fig 3. One of the goals of B08FDP was to establish a sufficiently large end-user group to effectively evaluate socio-economic benefits provided by advanced nowcasting systems. End users included forecasters at BMB headquarters, forecasters providing on-site advisory services at the Sports Command Center, Opening and Closing Ceremonies Operation Center of Beijing Organizing Committee for the Games of the 29th Olympiad (BOCOG), competition venues, Civil Aviation Meteorological Center, Beijing Water Authority, and boating operations at the Summer Palace. BMB developed a special website (www.B08FDP.org/product/) for these end-user groups to obtain easy access to the FDP products (Liang et al, 2009). The web products fell into five categories: analysis products, consensus products, common products, individual products and real-time verification. The web page also contained a special column, “FDP Forecast Comments”, where FDP experts could express their opinions and comments in real time (see Fig. 3a). Easily understood products (e.g., early-warning guidance products of heavy rain and lightning, quantitative precipitation forecasts, and storm tracking products) were posted to a specialized website of the Olympic meteorological service (www.weather2008.cn) for the general public. In addition, selected FDP guidance products for heavy rain, lightning and storm tracking were provided as input to BMB’s Very-short-range Interactive Prediction System (VIPS) early-warning platform for BMB forecasters. 3.5.3 Operating flow To facilitate exchanges between BMB forecasters and FDP experts, the FDP Office was established adjacent to the BMB Operational Weather Discussion Office. Forecasters could visit the FDP Office at any time to seek advice and check products, while FDP experts could enter the Operational Weather Discussion Office to attend weather briefings and express their views and ideas. Figure 4 shows the flow of meteorological data and forecast products during the demonstration period. The FDP emphasized not only the stable operation of individual systems, but also the transfer of advanced nowcasting techniques and experience to BMB forecasters. Based on the on-duty service of a local champion, specific tasks and work flow were undertaken to record and improve system performance. Specific activities of the local champion are given in Figure 5 and include monitoring system performance, recording daily weather events, recording summaries of FDP forecast discussions, and recording the perfor-mance of the previous day’s nowcasting systems. Local champions ensured that the nowcast systems functioned stably and reliably even when the FDP experts were absent. During the IOP, at least two FDP experts and two local champions were on duty together (Figure 5). The champions organized weather discussions, prepared and updated FDP forecasts on the webpage, attended BMB weather discussions twice a day and provided advice to BMB forecasters. In the case of important events or complex

24
weather situations, more frequent discussions were held between the FDP experts, local champions and local forecasters. Leading up to and during the opening and closing ceremonies of the Olympics, FDP staff worked with local forecasters in tracking weather system changes until the end of the events.
BMB Real-time Database
B08FDP Servers
VIPS
OMIS
WWRP Systems
RTFV
TIFS
B08FDP web server
BMB Olympic Weather
Web servers
FDP Champions(16 experts + 4 loal
champions)
BMB forecastersSevere Weather
End UsersBeijing Municipal
Government
End UsersCompetition Managers INFO2008
Public
End UsersCivil Aviation
BMB forecastersPublic weatherOlympic venueRemote forecasters
Olympic on-site services (BOCOG, Rowing)
data
Individual products
Verification
Consensus products
Nowcasting
CCC
BMB official forecast
data
Individual products
Direct interaction
Weather discussion
End UsersBeijing Water Authority
VIPS: The Very-short-range Interactive Prediction System OMIS: The Olympic Meteorological Information distribution System CCC: The Command, Control and Communication platform of Beijing Municipal Government INFO2008: The Olympic information system of IOC
FDP products
web
web
web
webimages
images
data
web
BMB official forecast
Manual correction
Figure 4. Flow of meteorological data and forecast products.
Figure 5. Daily on-duty activities for the champions.
3.6 Verification 3.6.1 Verification system and methods

25
Verification area: The B08FDP forecast domain was divided into two sub-domains. The 200 km x 250 km inner domain (blue box in Figure 6) was centered close to the Beijing radar. The outer domain (red box in the Fig. 5) was centered on the Beijing radar with a coverage of 500 by 500 km. Because of limited radar coverage to the northeast and south east only the irregular yellow zone in Fig. 6 could be verified. Verification content: For real-time verification, AWS were used to verify precipitation forecasts within the inner domain (blue box in Fig 6). Only radar reflectivity and thunderstorm cells were verified in the outer domain (the irregular yellow zone in Fig 6). The altitudes selected by various nowcasting systems for radar reflectivity forecasts were different; therefore, the analysis fields provided by each system were used to verify that system. Forecasts for strong winds, hail and lightning were not verified because of a lack of sufficient real-time observations. Verification of these products will be conducted based on the data availability at a later stage. Verification system: The Real Time Forecast Verification (RTFV) system developed by the Australian BOM was used in the B08FDP to provide forecasters and other users with rapid feedback on real-time forecasting effectiveness of FDP nowcasting systems. The RTFV could be operated in both automatic and manual modes. The RTFV initiated every six minutes in automatic mode, providing near real-time verification results based on the latest observations and forecasting products. RTFV was used in manual mode to make post-real-time verification. The verification products generated by RTFV were of three types: visual verification (map and time series displays of forecasts and observations, and correspondence plots), statistical verification (standard scores such as root mean square error, probability of detection, etc.), and diagnostic/scientific verification (e.g., feature-based verification, neighborhood verification, intensity/scale verification, etc.).
Figure 6. Verification areas of B08FDP.
3.6.2 Overall performance results for B08FDP forecasts The verification results shown in this section are aggregated statistics generated from the real time verification over the 51-day period 1 August - 20 September 2008. They were produced
26
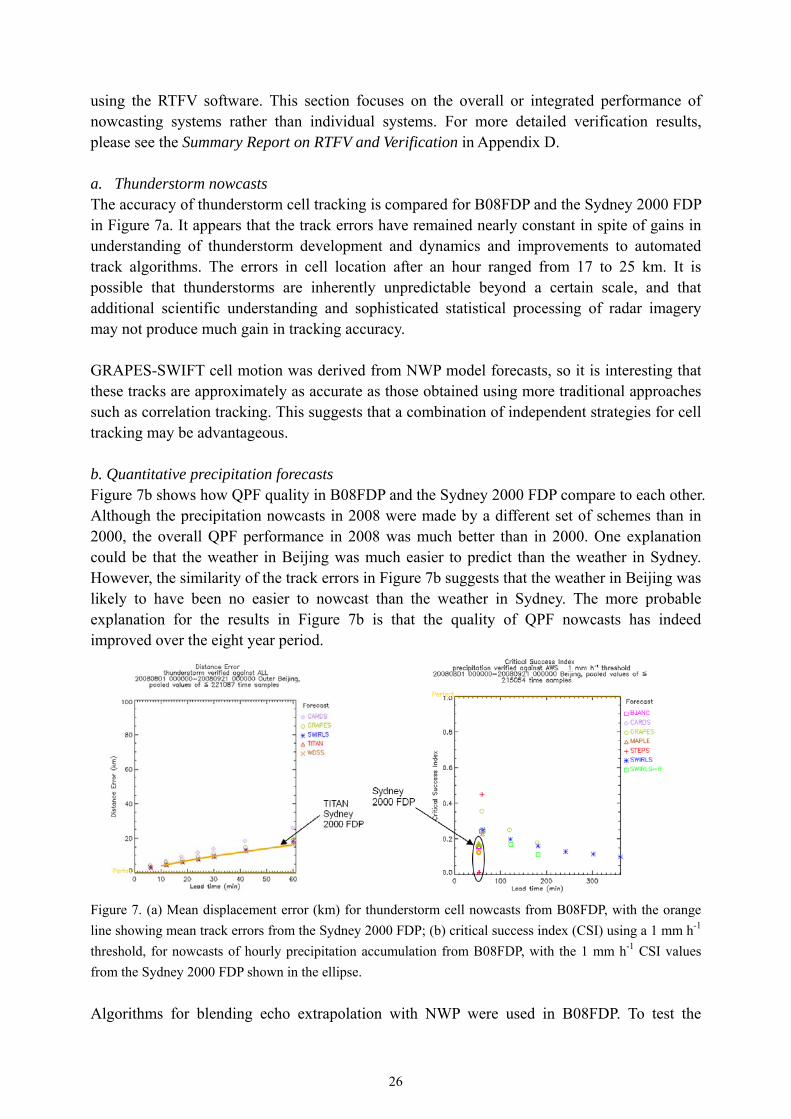
using the RTFV software. This section focuses on the overall or integrated performance of nowcasting systems rather than individual systems. For more detailed verification results, please see the Summary Report on RTFV and Verification in Appendix D. a. Thunderstorm nowcasts The accuracy of thunderstorm cell tracking is compared for B08FDP and the Sydney 2000 FDP in Figure 7a. It appears that the track errors have remained nearly constant in spite of gains in understanding of thunderstorm development and dynamics and improvements to automated track algorithms. The errors in cell location after an hour ranged from 17 to 25 km. It is possible that thunderstorms are inherently unpredictable beyond a certain scale, and that additional scientific understanding and sophisticated statistical processing of radar imagery may not produce much gain in tracking accuracy. GRAPES-SWIFT cell motion was derived from NWP model forecasts, so it is interesting that these tracks are approximately as accurate as those obtained using more traditional approaches such as correlation tracking. This suggests that a combination of independent strategies for cell tracking may be advantageous. b. Quantitative precipitation forecasts Figure 7b shows how QPF quality in B08FDP and the Sydney 2000 FDP compare to each other. Although the precipitation nowcasts in 2008 were made by a different set of schemes than in 2000, the overall QPF performance in 2008 was much better than in 2000. One explanation could be that the weather in Beijing was much easier to predict than the weather in Sydney. However, the similarity of the track errors in Figure 7b suggests that the weather in Beijing was likely to have been no easier to nowcast than the weather in Sydney. The more probable explanation for the results in Figure 7b is that the quality of QPF nowcasts has indeed improved over the eight year period.
Figure 7. (a) Mean displacement error (km) for thunderstorm cell nowcasts from B08FDP, with the orange line showing mean track errors from the Sydney 2000 FDP; (b) critical success index (CSI) using a 1 mm h-1 threshold, for nowcasts of hourly precipitation accumulation from B08FDP, with the 1 mm h-1 CSI values from the Sydney 2000 FDP shown in the ellipse. Algorithms for blending echo extrapolation with NWP were used in B08FDP. To test the

27
impact of the addition of NWP information, the SWIRLS system provided forecasts with and without blending. Verification of both products showed that the critical success index, which measures the accuracy of rain occurrence, was slightly higher for the blended SWIRLS product than for the extrapolation-only version, denoted SWIRLS-R in Fig. 7b, but the root mean square error (RMSE) was also greater for the blended product (not shown). The SWIRLS RMSE was greatest at hour two of the forecast, and then decreased for longer lead times, reflecting the model's contribution to a reduction in RMSE starting near hour 3 of the forecast. Categorical scores for higher intensity rain (≥ 10 mm h-1) (not shown) indicate that it is much more difficult to accurately predict heavy rain. The prediction skill for rain ≥ 10 mm h-1 was essentially gone by hour two of the nowcast (CSI~0.05). c. Reflectivity nowcasts For reflectivity nowcasts the pixel-scale performance was fairly discouraging, with CSI values ranging between 0.15 and 0.26 for 30 minute nowcasts of reflectivity ≥ 35 dBZ. NIWOT provided reflectivity nowcasts blended into NWP model forecasts, but the decrease in CSI to near zero for lead times of more than one hour suggested that the BJ-RUC model did not add any advantage. d. Probability of precipitation nowcasts (POPs) Three nowcast systems provided probability of precipitation nowcasts. SWIRLS POPs were generated using a lagged ensemble, while STEPS POPs were produced by a stochastic ensemble. TIFS used an multi-system ensemble approach to generate probabilities of "wetting" rain exceeding 2 mm h-1 and "flooding" rain exceeding 40 and 80 mm h-1, where the flooding rain products incorporated rainfall already observed as well as predicted rain. For rain exceeding 1 mm h-1, both SWIRLS and STEPS produced quite reliable POP nowcasts (Figure 8a), i.e., the observed frequency was approximately equal to the predicted probability over a large number of cases. The probabilistic skill for POP ≥ 10 mm h-1 was much less than for the lighter rain. The favorable ROC (not shown) suggests that there would be value in calibrating the POP nowcasts for rain ≥ 10 mm h-1 to improve their reliability.
Figure 8. Reliability for probability of precipitation nowcasts of hourly rain accumulation of at least (a) 1 mm h-1 and (b)10 mm h-1. (c) SWIRLS PoP exceeding 10 mm in three different accumulation periods, namely 0-1 h, 0-3 h and 0-6 h.

28
Besides calibration, another strategy for improving the overall POP performance is to lengthen the rainfall accumulation period. At long lead times or in a heavy rain regime where forecast uncertainties become most prominent, it is reasonable to allow for some tolerance in the timing of forecast rainfall. Figure 8c shows the reliability diagram for SWIRLS POP exceeding 10 mm for three different accumulation periods, namely 0-1 h, 0-3 h and 0-6 h. Despite a loss of temporal resolution, both reliability and ROC (not shown) were significantly improved for the POP forecasts with longer accumulation periods. The TIFS consensus POP nowcast was generated as an average of individual POPs estimated from QPF using logistic regression (e.g., Applequist et al., 2002). Each nowcast system's calibration was computed over a range of intensity thresholds from the 2007 trial case study data, which was biased toward wet cases. This led to the consensus POP being under-confident in 2008 for probabilities greater than about 0.2, as seen in Figure 9. However, the discrimination power suggested by the ROC curve is excellent, and further calibration of the POPs would in principle lead to a more accurate set of probabilistic nowcasts.
Figure 9. (a) Reliability and (b) ROC for probability of precipitation nowcasts of hourly rain accumulation of at least 2 mm h-1 produced by the TIFS system. The results shown above indicate that all three strategies used for generating POP nowcasts, namely lagged ensemble (SWIRLS), stochastic ensemble (STEPS), and multi-system ensemble (TIFS), are capable of providing skillful predictions, particularly for lighter precipitation. Without further testing on larger datasets it is not possible to conclude which of the three strategies is likely to be the most skillful. e. Thunderstorm strike probability nowcasts The strike probabilities were verified against the occurrence of reflectivity greater than or equal to 40 dBZ during the validity period of 1 h. The reliability of the lower probability values is quite good, although the higher probability nowcasts were clearly over-confident. The ROC plot shows excellent discrimination of events and non-events. Considering that the probability algorithm was calibrated and tested using data from Sydney, Australia, the good performance of the automated algorithm is quite encouraging. There were 60 cases for which both automated and manual strike probabilities were available.

29
These came mostly from nowcasts made on August 8, 10, 14, and 24. Although there is no official record of the nature of the manual adjustments, they consisted mainly of removing dubious cells from the consensus. The results in Figure 10 show that the manual adjustment improved both the reliability of the strike probability nowcasts and their ability to discriminate events (blue curve to the outside of the red curve).
Figure 10 Reliability (a) and ROC (b) for 60 cases in which both automatic (TIFS) and manual (TIFS-M) thunderstorm strike probability nowcasts were available. 3.7 Social and Economic Impact Assessment Assessment of B08FDP’s social and economic benefits was initiated at an early stage (i.e., June 2005), and ended after the 2008 Paralympic Games, a period of 4 years. The Social and Economic Impact Assessment (SEIA) focused on the Beijing Olympic Meteorological Service. Forecasters and end users were surveyed on the usefulness of the FDP products. Training were conducted for forecasters and some of the end users, such as the Flood Prevention Office, to improve their ability to effectively use FDP products in the process of decision making, and to promote the benefits of FDP products in Olympic meteorological service delivery (Ye et al., 2007; Duan, 2008) 3.7.1 Impact on local forecasters Results of the forecaster surveys showed that the pre-training greatly helped forecasters in preparing forecasts at high temporal and spatial resolution, and also helped them to provide early warnings. Forecasters have further improved their skills in providing very-short-range forecasts and nowcasts. This shows that training on the advanced forecasting systems and operational platforms played an important role in improving weather service delivery both during the Olympic Games and beyond. 3.7.2 Impact on decision-makers Surveys (questionnaires and interviews) were conducted with the Beijing Organizing Committee for the Olympic Games (BOCOG), the Beijing Municipal Government, the National stadium, Shunyi Olympic Rowing and Canoeing Park, and other venues during the

30
“Good-Luck Beijing” sport events in 2007 and the Beijing Olympic Games and Paralympic Games in 2008. The survey results showed that all of the members of the Olympic family were able to access the weather information quickly and easily. Moreover, the information significantly met the demands for very-short-range forecasts, nowcasts, early warning, and products with more refined time and space scale, as well as continuous follow-up service as compared with those before the Games. Customer satisfaction regarding services to support decision making has improved substantially with the overall satisfaction of 95%, nearly 20% higher than that before the Games. The satisfaction of users with the refined products was notable, in particular the 3-hourly venue forecast. This signifies that the products from advanced very-short-range forecast and nowcasting techniques were useful in increasing the economic benefits of meteorological services. The feedback from the Urban Flood Control Office was, "For the four rainfall events during the Olympic Games, short-time forecasts and nowcasts provided precipitation areas, thunderstorms tracks, and precipitation periods which played important guidance in flood prevention. It gave us lead time for earlier initiation of drainage contingency plans and deployment of rescue teams." 3.7.3 Impact on business users In 2007, the Tour Boat Fleet at the Summer Palace was chosen as a potential user of FDP products. A survey was conducted in two stages. The first stage was from June 1 to August 31, 2007, mainly focusing on users’ needs and determining to what extent existing forecast products met their needs. The second stage was from July 15 to September 20, 2008, focusing on economic benefits brought to the Fleet by using FDP products. Preliminary results indicate that advanced objective forecasting techniques could help provide the users with more accurate and timely meteorological information. However, to realize this benefit it would be necessary to strengthen the communication with the users, so that they can fully apply the meteorological information to each link of the decision-making process. 3.7.4 Impact on public From 2005 to 2008, public surveys of both Chinese and foreigners were conducted each summer. Over 8,000 questionnaires were collected. Results of the public survey indicated that during the period 2005 to 2008, public access to meteorological information substantially expanded, and the efforts of the meteorological service in increasing the coverage of weather information were recognized by the public. The public awareness of and public satisfaction with meteorological services improved year by year, and the degree of interest in meteorological information increased markedly. During the 2008 Olympic Games and Paralympic Games, the FDP SEIA group recruited, through mass media, an Olympic Weather Volunteers group comprising over a hundred volunteers from all walks of life. On July 31 BMB provided training to the Olympic Weather Volunteer group and taught them how to use the FDP products available on the internet. From August 1 until the end of the Paralympics these volunteers looked at FDP products on a daily basis and provided information related to whether FDP products were correct corresponding to
31
temporal and spatial forecast when there is weather or high impact weather. During the period of August 18-20, 2008, FDP SEIA group randomly recruited an additional 100 middle-aged and elderly volunteers living in downtown Beijing. These volunteers gave feedback to real weather information from 20 August to the end of the Paralympics, and their satisfaction of the Olympic weather services. The survey of the 120 Olympic meteorological volunteers who used very-short-range weather forecasting and nowcasting products via the Internet illustrated that the public could accept and better use the emerging weather information products after appropriate education and training. This signifies that there is potential demand for new products for the public, but wide publicity, education and training are required both to raise public awareness of the new products and provide information on how to use the meteorological information to maximum benefit. 3.7.5 Impact on mass media In July 2005, a high-level workshop was held to understand the requirements of the mass media in Beijing for meteorological services. The participants came from five major newspapers, Beijing TV Station, Beijing People's Radio Broadcasting Station, telephone, network and SMS operators. The survey showed that the relationship between the media and meteorological service was close, and that different types of media needed different meteorological information. Between 2005 and 2008 the project team collected more than 500 articles on media coverage of weather events reflecting impact of different weather events on society. 3.7.6 Impact on FDP experts Interviews of 13 FDP experts indicated that the B08FDP provided them with very good opportunities to evaluate the various FDP systems and test their own systems This was important in that it stimulated ideas amongst the group for how to improve their own systems and nowcasting systems in general. The FDP was also an effective way to conduct research by learning about each others' systems in neutral territory.
4. Discussion and Conclusions
Through the joint efforts of all participants the B08FDP achieved its goals and provided a successful forecast demonstration during the Beijing Olympics. The B08FDP provided a new opportunity, following the Sydney 2000 FDP, to bring together diverse nowcasting systems from around the world to create more sophisticated nowcasting capabilities than any single system could provide alone. It demonstrated that state-of-the-art nowcasting systems could successfully operate in the local data environment of a developing country. In addition to "standard" nowcast products such as reflectivity and precipitation fields and thunderstorm tracks, new products such as probabilistic precipitation, thunderstorm, and lightning nowcasts were demonstrated and shown to provide skillful objective guidance for forecasters. The B08FDP showed that the world wide joint efforts for improving local weather

32
forecasts and services could bring remarkable social and economic benefit. The Beijing weather provided a challenging test bed for the inter-comparison of nowcasting systems from around the world. The FDP stimulated both the scientific and technological development of nowcast systems in the participating organization, and it will hopefully also stimulate the development of nowcast systems in other countries. For instance, some B08FDP systems will take part in the Shanghai World EXPO 2010 Nowcasting Service Demonstration Project (WENS) and the Vancouver 2010 Winter Olympic Research Development Project of WMO. The multi-radar synchronization and quality control techniques that were used in the B08FDP project will likely transfer to the Shanghai Meteorological Bureau for use in WENS. In addition to the advancement of nowcast techniques, a significant achievement was the transfer of nowcasting technology and capability to BMB operations. The exchanges between the FDP experts and BMB forecasters were thought to be the most successful part of the B08FDP. It demonstrated how the gap between the research and operation groups could be bridged through an effective interactive mechanism involving system champions and an open door policy. It also showed how to include the decision makers into the design of service procedures to provide a more effective and valuable end-to-end weather service. All these proved that the role of the human (both forecasters and the end users/decision makers) must to be considered as a key component part of the future nowcast process. The implementation of real time verification in B08FDP linked the WWRP Verification group with the Nowcasting group. Through this project, not only forecasters but also system developers realized that verification could be used to better understand the nowcasting systems and find ways to improve their performance. Although the diagnostic verification methods were not run in real-time due to the limitation of computer resources the concept was accepted by all participants. Impact studies and forecaster training were considered essential components of a FDP. The SEIA group conducted extensive surveys of different end users, including public and commercial users, decision makers and forecasters. The results indicated a better understanding of user needs and contributed to the success of the B08FDP. The interactive case studies (forecast simulation) that were used in the second B08FDP training workshop were recognized as an effective training method that should be used in future nowcast training. A training workshop targeted to transfer the knowledge learned from B08FDP to other developing countries is being planed by the WWRP Nowcasting Working Group. The B08FDP project accelerated the establishment of operational nowcasting procedures in BMB. This included the data requirements for nowcasting systems, interactive product generation platforms and most importantly the scientific knowledge and procedures required for effective nowcasting. Some key algorithms/techniques from the GRAPES-SWIFT, BJANC and VIPS systems, will be used in the development of CMA’s SWAN system.

33
There were also noticeable capacity building opportunities within BMB and CMA with SEIA activities. These activities are now widely accepted within BMB and CMA, and a research team has been established. A user-oriented service strategy has been implemented in BMB service plans for the future. The B08FDP SEIA survey method is being adopted by BMB for gaining users’ information to improve its daily meteorological services. From a scientific point of view, the B08FDP highlighted the difficulty of making high resolution convective storm forecasts and the existing unfilled need for such forecasts. When trying to forecast on the scale of a sports stadium or even a metropolitan area extrapolation forecasts were often inadequate even for periods of 1 hour or less. This was partially due to extrapolation errors and errors in converting reflectivity to precipitation rate, but more often because of growth and decay; this was particularly true for storms moving from the mountains to the plains. In spite of the accuracy problems with the automated nowcasting systems the forecasts provided to the Olympic venues were generally accurate and useful. This was because forecasters examining high resolution observations and automated forecast products can use their physical reasoning and pattern recognition capabilities to assess data quality, evaluate automated forecast material and apply broad meteorological reasoning to formulate forecasts superior to the automated forecasts. Three rapid update high resolution numerical model nowcasts were available and were used to blend with radar echo extrapolations during the B08FDP. The availability of model forecasts on this short time scale was an exciting and significant advancement since Sydney 2000. The advantage of blended precipitation nowcast was seen in some cases by some system in the B08FDP. However, model skill was generally not yet sufficient for the blended nowcasts to improve over extrapolation. We suspect that greater model consistency will require improved model physics and assimilation of high resolution radar data. In parallel with the FDP, there was also a RDP (research and development project) component on high resolution NWP. With NWP models becoming an integral component of many nowcasting routines, collaboration between nowcasters and modelers is likely to become even more important for future international cooperative efforts on nowcasting. Acknowledgments: This project was conducted with the direct and indirect support of many agencies and individuals. The BMB/CMA, as host, provided great ongoing and infrastructure support for the FDP and many individuals contributed much to ensure the projects success. References Applequist, S., G.E. Gahrs, R.L. Pfeffer, and X.-F. Niu, 2002: Comparison of methodologies for probabilistic
quantitative precipitation forecasting. Weather and Forecasting, 17, 783-799. Chen M.X., J.Z. Sun, Y.C. Wang. A frequent-updating high-resolution analysis system based on radar data

34
for the 2008 Summer Olympics. 33rd Conf. Radar Meteorology, Amer. Met. Soc., Cairns, Australia, 6-10 August 2007.
Dance, S., E. Ebert and D. Scurrah, 2009: Thunderstorm strike probability nowcasting. Journal of Atmospheric and Oceanic Technology, accepted.
Duan, Y., 2008: Impact assessment on improved forecast system in Beijing 2008 Olympic Games weather service. 2nd THORPEX-Asia Science Workshop & 6th ARC WG Meeting, February 17-20, 2009.
Ebert, E. and B. Brown, 2007: RTFV: A real time forecast verification system. 33rd Conf. Radar Meteorology, Amer. Met. Soc., Cairns, Australia, 6-10 August 2007.
Feng Y., Q. Zeng, Q. Liang, et al, 2007a: Introduction to GRAPES-SWIFT nowcasting system. Proceedings of the 21st Guangdong-Hong Kong-Macau Scientific and Technological Seminar on Hazardous Weather, Hong Kong, Jan 24-26, 2007.
Feng, Y., Y. Wang, T. Peng, et al, 2007b: An algorithm on convective weather potential in the early rainy season over the Pearl River Delta in China. Advances in Atmospheric Sciences, 24, 101-110.
Keenan, T., P. Joe, J. Wilson, et al., 2003: The Sydney 2000 World Weather Research Programme Forecast Demonstration Project: Overview and current status. Bulletin of the American Meteorological Society, 84, 1041-1054.
Li, L, W. Schmid, and J. Joss, 1995: Nowcasting of motion and growth of precipitation with radar over a complex orography. Journal of Applied Meteorology, 34, 1286-1300.
Li, P.W., & E.S.T. Lai, 2004 : Short-range Quantitative Precipitation Forecasting in Hong Kong, J. Hydrol. 288, 189-209.
Liang, F, L.L. Yuan and W.F Zhao, 2009 : THE WEB DISPLAY ON NOWCASTING PRODUCTS OF WWRP BEIJING 2008 FORECAST DEMONSTRATION PROJECT, submitted to WMO Symposium on Nowcasting, 30 Aug-4 Sep 2009, Whistler, B.C., Canada.
Sun, J. and N.A. Crook, 2001: Real-time low-level wind and temperature analysis using single WSR-88D data. Weather and Forecasting, 16, 117-132.
Wang, J. and F. Liang, 2007: B08FDP in review 2006-2007. 3rd workshop of WWRP B08FDP/RDP, Qingdao, China, 20-22 September 2007.
Wilson, J., M.X. Chen, and Y.C. Wang, 2007: Nowcasting thunderstorms for the 2008 Summer Olympics. 33rd International Conference on Radar Meteorology, Cairns, 6-10 August 2007.
Wong, W.K. & E.S.T. Lai, 2006: RAPIDS – Operational Blending of Nowcast and NWP QPF. 2nd International Symposium on Quantitative Precipitation Forecasting and Hydrology, Boulder, USA, 4-8 June 2006.
Wong, W.K., L.H.Y. Yeung, Y.C. Wang & M.X. Chen, 2009 : Towards the Blending of NWP with Nowcast — Operation Experience in B08FDP, submitted to WMO Symposium on Nowcasting, 30 Aug-4 Sep 2009, Whistler, B.C., Canada.
Ye, Q., 2007: Progress report for the B08FDP Social and Economic Impact Assessment Project. 3rd workshop of WWRP B08FDP/RDP, Qingdao, China, 20-22 September 2007.
Yeung, L.H.Y., E.S.T. Lai and K.Y. Chan, 2008: Thunderstorm downburst and radar-based nowcasting of squalls. 5th European Conference on Radar in Meteorology and Hydrology, Helsinki, Finland, 30 June - 4 July 2008.
Yeung, L.H.Y., E.S.T. Lai and K.S. Chiu, 2007: Lightning initiation and intensity nowcasting based on isothermal radar reflectivity - a conceptual model. 33rd International Conference on Radar Meteorology, Cairns, Australia, 6-10 August 2007.
Yeung, L.H.Y., W.K. Wong, P.K.Y. Chan and E.S.T. Lai, 2009 : Applications of the Hong Kong Observatory Nowcasting System SWIRLS-2 in Support of the 2008 Beijing Olympic Games, submitted to WMO

35
Symposium on Nowcasting, 30 Aug-4 Sep 2009, Whistler, B.C., Canada.

36
Appendix A. Major Staffs Participating in B08FDP Project
1. FDP international Scientific Steering Committee
Co-chairs: WANG Jianjie (China), Tom KEENAN (Australia)
Executive Secretary: LIANG Feng (China)
Members (in alphabetical order):
Linda ANDERSON-BERRY (Australia), Barbara BROWN (US), Paul JOE (Canada), Edwin S.T. LAI
(Hong Kong, China), Alan SEED (Australia), WANG Yingchun (China), James WILSON (US), XUE
Jishan (China), YE Qian (China), YU Xiaoding (China)
2. Other experts and technical staff (in alphabetical order of institution)
Australian Bureau of Meteorology (BOM):
John Bally, Beth Ebert, Tony Bannister, Kevin Cheong, Phil Purdam, David Scurrah
China Meteorological Administration (CMA):
Xie Pu, Wang Yushan, Su Debing, Bo Li, Chen Mingxuan, Kong Rong, Xiao Xian, Yu Dongchang, Yuan
Lili, Zhao Wenfang, Duan Yuxiao, Li Xun, Liu Ke, Yu Haiyan, Meng Jinping, Xue Jishan, Feng Yerong,
Zeng Qin,Hu Sheng, Liu Liping, Wang Yan
Enviroment of Canada (EC):
Jaymie Gadal, David Hudak, Ronald Lee, Kwok Keung, Sarah Wong, Man Chuen Young
Hong Kong Observatory (HKO):
H.Y. Yeung, W.K. Wong, K.Y. Chan
The United States National Center for Atmospheric Research (NCAR):
Rita Roberts, Jenny Sun, Sue Dettling
Weather Decision Technologies, Inc. United States (WDT):
Bill Conway

37
Appendix B. Product List of B08FDP
System Output Products Forecast range Update Reflectivity≥35dBZ 30 and 60 min QPF 0-30min, 0-60min storm evolution 30 and 60 min Auto-Nowcaster
Boundaries 30 and 60 min
6 min B J A N C VDARS wind (u and v),vertical velocity, perturbation
temperature,relative humidity Analysis 18 min
QPF 0-60 min
Point forecast Every 6 min to 102 min CARDS
storm occurrence and properties Every 6 min to 1 h
6 min
QPF Every 6 min to 1 h QPF Every hour to 3 h Reflectivity Every 6 min to 1 h Storm track (35, 40, 45, 50, 55 dBZ) Every 6 min to 1 h
GRAPES- SWIFT
convective wx potential 0-1 h
6 min
QPF Every 10 min to 1 h MAPLE Reflectivity Every 10 min to 1 h 6 min
NIWOT Reflectivity≥35dBZ Every hour to 6 h 60 min
QPF (Mosaic domain ) 0-30min, 0-60min, 0-90min STEPS
POP(1,2,5,10,20,30,50 mm, Mosaic domain) 0-1h 6 min
QPE(Mosaic domain, 6min.,60min, 120min, and 180min) Analysis 6 min
QPE(60min., gauge blended, Mosaic) Analysis
S T E P S Rainfall fields
Gauge (60min, interpolated, Mosaic) Analysis 60 min (clock)
QPF (radar) 0-1h,0-2h,0-3h Probability of lightning threat 0-1h, 0-2h, 0-3h Storm occurrence and properties (reflectivity >=34 dBZ) Every 6 min to 1 h
Sever weather: lightning initiation (type & severity), Down burst (severity type), Hail (type), Rainstorm (intensity type)
0-30min
Severe wind gust (maximum possible) 0-30min POP (1,10,20mm for 60min; 1,10,20,50mm for 180min; 1,10, 20, 50mm for 360min) 0-1h, 0-3h,0-6h
6 min SWIRLS
QPF (blended) 0-1h, 0-2h, 0-3h, 0-4h, 0-5h, 0-6h 6 min
storm probability ensemble (VIPS Lightning warning guidance, automatic mode) 0-1h
storm probability ensemble (VIPS Lightning warning guidance, manual mode) 0-1h
rain probability ensemble (VIPS Rainstorm warning guidance) 0-1h
TIFS
Probability of wetting rain (2mm / hr) 0-1h
6 min
TITAN storm occurrence and properties (≥35dBZ) Every 6 min to 1 h 6 min
T I F S
WDSS storm occurrence and properties Every 6 min to 1 h 6 min

38
Appendix C. Milestones of the WWRP B08FDP
Oct 2004 B08 Project endorsed by WWRP/SSC 7th Session
Mar 2005 First SSC workshop: approval of the B08FDP scientific and implementation plan
Jul 2005 Surveys for residents, media and business sectors to understand end users' requirements
Apr 2006 Local information and data environment established in BMB
Jun-Aug 2006 First system trial
Jul 2006 Survey of foreigner visitor requirements and current status of forecasters in the BMB
Aug 2006 Second SSC workshop: review of the first system trial
Dec 2006 B08 project was identified and accepted by the GEO plenary-3 as one of the “GEO
Near-Term Successes”
Feb 2007 MAPLE system was accepted by B08FDP SSC as a new participating system
Mar 2007 New version of the Real Time Forecast Verification system was developed by the
WWRP/WGNE Working Group and installed in the BMB
Apr 2007 First training workshop of the B08FDP
Jul-Aug 2007 Second system trial
Sep 2007 Third SSC workshop: review of the second system trial
June 25, 2008 All local data provided in real time for final system tuning
July 7-11, 2008 Second B08FDP system training workshop
July 9, 2008 B08FDP working meeting: finalize the implementation plan and product suite for the
final Forecast Demonstration during the Olympics.
July 15, 2008 Systems were frozen and FDP started. Real-time forecasting products displayed on
B08FDP web site for specific users. Local champions were on duty.
July 25, 2008 Real-time B08FDP products were opened to the public through the Olympic Weather
Service web site of the BMB
Aug 1-24, 2008 B08FDP IOP. Experts worked with local champions in BMB.
Sep 20, 2008 FDP end date
Apr 6-11, 2009 Fourth SSC workshop: project summary

39
Appendix D. Summary Reports of B08FDP Participants
Summary Report on BJANC and VDRAS...................................................................................... 40 Summary Report on CARDS .......................................................................................................... 51 Summary Report on GRAPES-SWIFT ........................................................................................... 65 Summary Report on MAPLE .......................................................................................................... 72 Summary Report on NIWOT .......................................................................................................... 74 Summary Report on STEPS ............................................................................................................ 83 Summary Report on STEPS ............................................................................................................ 84 Summary Report on SWIRLS......................................................................................................... 86 Summary Report on TIFS ............................................................................................................... 97 Summary Report on B08FDP Data Environment.......................................................................... 104 Summary Report on RTFV and Verification ................................................................................. 112 Summary Report on Social and Economic Impact Assessment .................................................... 127

40
Summary Report on BJANC and VDRAS
Mingxuan Chen (Institute of Urban Meteorology, China Meteorological Administration, Beijing, China)
1.Introduction
Beijing Meteorological Bureau (BMB) introduced the convective storm nowcasting techniques from the U.S. National Center for Atmospheric Research (NCAR), on the basis of which BMB spent nearly five years in improving and developing a number of key algorithms of storm analysis and nowcasting, studying and analyzing the characteristics of observational data, boundary layer and storm climatology in the region of Beijing-Tianjin-Hebei, analyzing the raindrop spectral data, and testing algorithms and system batch volumes. On this basis, a lot of parameters were integrated and various forecast factors were optimized with the improved fuzzy logic approach. As a result, for the first time in Beijing, an automatic convective storm nowcasting system based on local data analysis, integration and radar echo extrapolation was developed, and named as BJANC. At the same time, through a lot of improvements, the radar data retrieval module of the system was also developed into a stand-alone assimilation and retrieval system (VDRAS) based on rapid update cycling 4DVar assimilation of Doppler radar data. In the previous two years (2006 and 2007) of the system R&D, a lot of training on system principles and application was offered to BMB’s forecasters. The system participated in the thunderstorm automatic nowcasting services during the flood-prone period and the real-time B08FDP trials. Technical problems were corrected in a timely manner to ensure that the system could be put into real-time operation by the time of the 2008 Olympic Games and fully met the requirement for the formal B08FDP demonstration.
Using multiple algorithms and modules (including VDRAS), the BJANC makes a general analysis, assimilation and integration from the local observational data and rapid update
Data ingesting CINRAD(4), Satellite(2), AWS(106), Radiosonde(5), Meso-NWP(BJ-RUC)
Data QCRemoval of radar clutter echo (AP, NP and
brightband)
3-D radar mosaic
Algorithms
Integration
+ Local Z-RQPE
VIL
Storm tracking and fx
Probability of hail (POH)
ProductsReflectivity fx
Forecasts of storm evolution
QPF+ Local Z-R
Verification and validation
Human entry
Low-level thermo-dynamical and micro-physical fields
Fig 2. Operation running flow of BJANC.

41
cycling numerical prediction system (BJ-RUC) to automatically identify, track and extrapolate radar echoes, and in combination with manually entered boundary layer convergence lines and finally through the fuzzy logic to integrate a number of forecast factors produced by various algorithms and modules to result in quite a few products. Figure 2 shows operation running flow of the system. Based on the radar data 4DVar assimilation technique and the cloud-scale numerical model, the VDRAS system rapidly assimilates data from radars and the surface automatic weather stations, and uses outputs from the BJ-RUC system, then retrieves and produces a series of products like the 3-D distributions and temporal increment of thermo-dynamical and micro-physical fields at lower layer that are closely related to initiation and development of convective storm, of which update frequency is 12 minutes, and horizontal resolution is 3km and vertical 375m. VDRAS could also be seen as part of the BJANC system since some of its products are provided to the BJANC system as forecast factors.
2.Main Tasks and Expected Goal
As one of the systems participating in the formal B08FDP demonstration, BJANC was to provide objective nowcasting of the initiation, development and evolution of severe convective weather in the region of Beijing-Tianjin-Hebei during 2008 Olympics and Paralympics. Main products included such forecasts as severe storm cell tracking, storm echoes, trend of storm evolution, quantitative precipitation, and position and extrapolation of manually entered boundary layer convergence lines. First, the "common" products (consistent with those from other systems) provided by BJANC were integrated into the Thunderstorm Interactive Forecast System (TIFS). The integrated products were provided to forecasters and B08FDP experts for their information. Second, operational products from BJANC were integrated into the interactive severe weather warning production and release platform (VIPS) for forecasters’ information. Third, main products from BJANC, including "common" and "special" ones, were displayed in real-time on the B08FDP webpage (http://www.b08fdp.org/) bilingually in Chinese and English for the information by a greater number of users. Fourth, all BJANC real-time operational products were provided to forecasters and B08FDP experts through the system’s interactive display platform for their further information. VDRAS participated in the formal B08FDP demonstration in the form of a “module” of BJANC. Its main task was to provide the thermo-dynamical retrieval (radar non-measurement) at lower layer that are closely related to the formation-development of storms in Beijing-Tianjin region, which were used to guide forecasters and B08FDP experts in their objective judgment of the structural characteristics of thermal-dynamics at lower layer in order to further enhance the nowcasting skill on convective storm. First, the main retrieved products were provided to forecasters and B08FDP experts by BJANC’s interactive display platform for their information. Second, the basic retrieval products were displayed in real-time in the form of “special” BJANC products on the B08FDP webpage and bilingually in Chinese and English for the information of a greater number of users.
3.Performance Evaluation
3.1.Fulfillment of Tasks and Targets

42
The BJANC system (including VDRAS) managed to operate in real time during the Beijing Olympics and Paralympics. It joined other seven international systems in the formal B08FDP demonstration, during which (1 August - 20 September 2008) the two systems made real-time tracking, nowcasting and analyses of over 20 severe convective weather events that occurred in the Beijing-Tianjin-Hebei region (a range of 500km by 500km). In the meantime, the two systems were running stably, with the failure rate registering almost zero, and with the rate of real-time generation and timely transmission of various products registering more than 99%, successfully meeting the expected targets of the B08FDP. 3.2.Achieved Technological Advances and Management Experience BMB introduced the advanced storm analysis and nowcasting technique in the world from NCAR, on the basis of which the BMB spent nearly five years on local improvements and development so that the storm automatic nowcasting system (BJANC), which was suitable for the Beijing-Tianjin-Hebei area, as well as VDRAS, were commissioned. The two systems, which enabled the storm tracking, analysis and nowcasting in the region to be automatic, objective and precise, greatly enriched the objective information referred to by forecasters when preparing a severe weather nowcasting, and improved the severe weather warning skill during the Beijing 2008 Olympics and Paralympics. The two systems participated, on behalf of Beijing and by international standards, in the World Meteorological Organization (WMO) sponsored B08FDP during the great games. Major technological advances achieved are set out as follows. (1) The first time integrated application of a variety of real-time and high-frequency observations and precise numerical prediction products of the Beijing-Tianjin-Hebei region to the severe convective weather automatic nowcasting, which involved the new generation weather Doppler radars, automatic weather stations, geostationary meteorological satellites, intensive radiosondes, and rapid update cycling numerical prediction system (BJ-RUC). (2) The real-time operational application of the new techniques of China's new generation Doppler radar data quality control. The fuzzy logic methodology was used to identify the characteristic differences of the radar reflectivity factor, radial velocity and velocity spectrum width data in the ultra-refraction ground echo (also known as abnormal propagation, AP) and the actual storm, automating the identification and removal of the AP from the 3 S-band radars in the Beijing-Tianjin-Hebei region. Figure 3 shows an example of automatic identification and removal of AP echo from Tianjin S-band radar. The clutter map identification and filtering technique was used to automate the identification and removal of a radar stationary ground echo (NP). The identification technique of radar bright-band echo based on reflectivity factor vertical profile template was used to automate removal of a radar bright-band echo. (3) On the basis of TITAN algorithm, improvements were made to severe storm cell identification and tracking based on 4-radar 3-D mosaic in Beijing-Tianjin-Hebei region. It was not only possible to automatically identify and track the form, motion speed and direction, development trend (stronger or weaker), echo top height of a severe storm cell, but also possible to make a nowcasting of its motion and development. Figure 6 gives an example of a storm cell automatic identification and tracking forecast, showing the development and motion

43
of the storm cell in Beijing at the moment of the opening ceremony of the Olympics on 8 August 2008. It could be seen that the storm cell located in the south-western Beijing posed a potential threat to the National Stadium “Bird Nest”, where the opening ceremony of the Olympics was taking place. It was the storm cell that was targeted in the weather modification operation that day. (4) On the basis of TREC algorithm, improvements were made to reflectivity tracking (TREC wind vector) based on the 4-radar 3-D mosaic, underlying the echo extrapolated forecast in the BJANC system. The TREC wind vector, which takes into account the storm motion path of echo deformation in different regions, can determine the direction of movement of echoes in different regions, hence a good indicator of the future development of the echo. Figure 7 gives the TREC wind vector of the radar echo 1 hour prior to the beginning of the closing ceremony of the Olympics on 24 August 2008. The sign told the forecasters that the storm located in the northeastern Beijing might affect the "Bird Nest", hence the need to focus on its development and motion, while storms over the north-western and south-western parts would affect Beijing much less possibly.
Fig 7. TREC wind vectors derived from radar echoes at 1059 UTC, 24 Aug. 2008.
Fig 6. A thunderstorm cell automatic identification and tracking forecast at 1159UTC, 8 August 2008. Tracking features include: the storm cell form (green polygon), motion speed, development trend and echo top height. Cell motion and development forecasting includes: 0.5 hour (purple polygon), 1 hour (blue polygon), 2 hours (white polygon). Five-Ring is the location of National Stadium “Bird Nest”.
a b
dc
a b
dc
Fig 8. QPE (a) and QPF (b) of 0.5 hour period (0930-1000 UTC) and QPE (c) and QPF (d) of 1 hour period (0930-1030 UTC) on 10 August 2008.
a b
c d
a b
c d
Fig 3. AP clutter automatic identification and removal of 0.5° elevation angle of SA radar in Tianjin at 0959 UTC, 9 July 2007 (a. Reflectivity before AP is removed; b. Reflectivity after AP is removed; c. Radial velocity before AP is removed; d. Radial velocity after AP is removed).

44
(5) The data of raindrop spectrum collected in Nanjiao station in southern suburbs of Beijing were analyzed, radar and automatic weather station observations of precipitation were fittingly calculated, and the methods were tested and compared to determine the Z-R relationship (Z=386R1.43) that was suitable for Beijing, representing a solid groundwork for the conversion of a reflectivity into the most credible grid precipitation. Based on the Z-R relationship, the algorithms of quantitative precipitation estimation (QPE) and quantitative precipitation forecast (QPF) were developed, bridging the two gaps of the BJANC system. QPF was becoming one of the “commonest” products available to B08FDP. Figure 8 gives a comparison between QPE and QPF of the same period during the heavy precipitation event on 10 August 2008. It can be seen that the system’s QPF could objectively indicate the actual ongoing precipitation, which was close to QPE at least in terms of form and magnitude. (6) Through several years of cooperation in scientific research and efforts in tackling key problems, substantial improvements were made in a variety of key algorithms and modules introduced. Through studies of climatology features of convective storm in Beijing and its vicinity area, batch testing and comparative analysis, the parameters of integrated fuzzy logic algorithm of the BJANC system were modified. As a result, the final integration and localization of various algorithms and modules of the system was achieved; and the system’s operational flow and framework were optimized, laying a solid foundation for nowcasting support to the Olympics, Paralympics and the system’s operation during its formal demonstration of the B08FDP project. Table 2 shows major technological advances in R&D of the system localization.
Table 2. Major technological advances in R&D of the BJANC system development.
No. Original techniques/ algorithms
Major Advances in R&D of the system development
1 Data format, data interpolation, compression and storage algorithms
Real-time access and data format conversion for local observation data
2 Basic framework (research platform)
Design and implementation of framework and flow for operational running
3 Basic algorithm of radar data quality control
With parameter adjustment, automatic identification and removal of clutter (AP, NP and the bright-band) of the 3 S-band radars (Beijing, Tianjin and Shijiazhuang) were achieved
4 Radar mosaic technique With parameter adjustment, the 4 radars were achieved real-time operation of 3-D mosaic
5 Algorithm of storm cell and regional tracking forecasting based on TITAN and TREC
The TITAN-based storm cell tracking algorithm was modified to the fitting of actual irregular polygon from the ellipse fitting. Through the correlation coefficient definition, temporal and spatial consistency check, relevant regional optimization, least squares fitting and other techniques, the TREC-based tracking algorithm were improved significantly
6 Algorithm for satellite data analysis and application
Achieving real-time application of encrypted data for FY2C satellite
7 Human-computer interaction module
Achieving localized operation of the module; and parameters were adjusted for inputting convergence line of boundary layer
8 Fuzzy logic algorithm Selecting key predictors in various algorithms; definition of dimensionless membership function of predictors; establishment of integrated weight coefficient; effective integration of all the algorithms
9 English display platform Development and operation of the Chinese display platform in both MS Windows and Linux environment; real-time webpage display for main operational products

45
10 Thermo-dynamical retrieval technique at lower layer based on VDRAS
Analyzing noise suppression; direct assimilation of data from several radars; using BJ-RUC results to improve the quality of background; achieving highly effective operation of the algorithm under 64-bit Linux; adding new retrieval variables (perturbation temperature gradient, time increment of main retrieval) to improve abilities to diagnose emerging storm and its evolution as well as to analyze the intensity of gust front
11
Climatology statistical study of storm: the initiation, development and motion features of storm in the Beijing-Tianjin-Hebei region including temporal and spatial distribution pattern, main weather systems, daily change features, etc.; preliminary study of the relationship between boundary layer convergence line and initiation/evolution of storm in Beijing-Tianjin-Hebei region
12 QPE and QPF algorithms: applicable to establish local optimal Z-R relationship in Beijing; having developed the algorithms of Quantitative Precipitation Estimates (QPE) and Quantitative Precipitation Forecasting (QPF), which could be operated in real-time manner
13 Increasing refined GIS for display; development of the real-time operation and monitoring platform for the system
14 Related technological development and real-time operation for the B08FDP project and the VIPS platform data access
(7) VDRAS system has been improved in many aspects. The utilization of MM5 model results with 12-hour cold start were changed to direct use of 3-hour NWP outputs with rapid update cycling (BJ-RUC), improving the background field and initial field analysis of VDRAS, and the reliability of results. Improvements were made in clutter filtering, interpolation analysis and other pre-processing functions of data quality, and analysis noise was further suppressed. The VDRAS was successfully transplanted to the 64-bit Linux with multi-CPUs from the 32-bit, which was enhanced the OpenMP parallelization performance of the system, and was increased the system’s computation speed, by over about 50%. Therefore, a cycle calculation could be completed within about 12 minutes, having met the requirement of severe weather nowcasting for real-time availability of products. New retrieved products (including perturbation temperature spatial gradient that was able to well indicate gust front) and a variety of time increment of retrieved fields were added to the system, so as to show the changing trend of various retrieved fields within two adjacent cycles (within 12 minutes). 3.3.Problems and solutions By reference to international standard data format, the B08FDP project had defined its standard format regarding data access and product output. The BJANC system, VDRAS system and other systems participated in the real-time testing and formal demonstration of B08FDP in the same dataset standard (data type and format). During the test period in 2006 and 2007, the procedures for data access were modified for many times, and the read-in of various kinds of data was achieved in correct and real-time manners, ensuring correct operation of the system. It was also found during the test that there were many problems in the conversion program from the system product to the B08FDP standard format (NetCDF, XML), to which several

46
amendments were made. Eventually, all products provided to B08FDP were able to be integrated correctly into the Thunderstorm Interactive Forecast System (TIFS), also could be read correctly by the Real-Time Forecast Verification system (RTFV). To ensure the main products provided to B08FDP by the two system (including “public” products and “specialized” products) could be displayed at the B08FDP webpage in real-time manner in both Chinese and English for reference to more users, the RTFG software could be used correctly after a series of amendments. The system products could be uploaded and displayed in real time manner in standard form of B08FDP webpage, and be kept consistent with product display format of other systems. In this regard, it was convenient for both forecasters and B08FDP experts to make contrast and analysis between different systems and products. 3.4.Contribution to the B08FDP project The BJANC system (including VDRAS system) provided abundant objective analysis and nowcasting products for severe storm early-warning for the great games and the B08FDP project. The “public” products provided by the system were integrated into TIFS, forming integrated products that were made available to forecasters and B08FDP experts for reference. The “public” products and “specialized” products provided by the system were displayed on the B08FDP webpage in real-time manner in both Chinese and English for reference to more users. The main operational products of the system were integrated into VIPS, to which forecasters could refer in development and issuing of severe weather early-warning information. All the real-time operational products of the system were made available to forecasters and B08FDP experts for further reference through the system’s interactive display platform. Based on research results at both home and abroad, the boundary layer convergence line has an important impact on the initiation, dissipation and development of storm because the boundary layer convergence line indicates unstable features at ground or lower layer. Similarly, it is also found through preliminary studies that whether the boundary layer convergence lines (sea breeze front, gust front, ground wind shear, etc.) exist is equally important to the initiation, dissipation, and development of storm over Beijing-Tianjin-Hebei region. If convergence lines interact (collide) with each other, or storm interact (collide) with convergence line, the storm will be enhanced or trigger new storms. With the arrival of convergence line at the hillside, it is easy to generate storms or storms may go down the hill and will be strengthened. With the arrival of convergence lines in mountainous area at the hillside, the storm may keep going down the hill, or trigger new storms. If convergence lines move with storms, storms will maintain for a longer period of time. If convergence lines keep away from storms (the moving direction is opposite to that of storms, or convergence lines move faster than storms), storms will dissipate. Through manual input of boundary layer convergence line, the BJANC system gave a better performance in nowcasting initiation, dissipation and development of storm, and BJANC was the only one B08FDP system that captured a process of storm initiation. During the official

47
demonstration of the B08FDP, the boundary layer convergence line was entered by human in real time. The BJANC successfully forecasted several strong convective events during the Olympics and Paralympics. Figure 10 gives the system’s forecasting result of the localized strong convective storm event taking place in Beijing urban area on 14 Aug. 2008. As can be seen, the system succeeded in forecasting the initiation of a localized strong storm in northeast of Beijing urban area, due to the interaction (collision) between boundary layer convergence lines (gust fronts). B08FDP experts and forecasters were very much concerned about the boundary layer convergence lines, their extrapolated positions and the forecast of storm initiation. Therefore, as a "specialized" product, it was made availably to forecasters and B08FDP experts for reference.
The VDRAS system was used during the B08FDP demonstration as a module of BJANC system. VDRAS is the only radar non-measurements retrieval system under B08FDP by employing rapid update cycling 4DVar assimilation technique to radar data, which captures real-time multiple thermo-dynamical 3-D structures that were closely related to lower layer and evolution of storms including the convergence uplift, temperature gradient, gust front, outflow, cold-pool structure, relative humidity, etc. (see Table 3). During the period of B08FDP demonstration, VDRAS was functioning stable with credible results. It was widely recognized by forecasters and experts involving B08FDP. With reference to the retrieval results from VDRAS, the capability for making objective analysis and nowcasting of storm was enhanced to a certain extent during the great games. Figure 11 shows retrieved thermo-dynamical fields at lower layer from VDRAS on 0429 UTC on 14 August 2008. As can be seen, what closely accompanied two relatively moving storms was a visible cold pool structure and there was
Fig 10. Radar observations of localized strong storm in Beijing urban area on 14 Aug. 2008 and forecasts from the BJANC system. (a) reflectivity mosaic at 0423 UTC; (b) 1-hour forecast of future storm evolution at 0423 UTC (red for growing, green for stable, blue for dissipation, yellow for initiation); (c) 1-hour forecast of storm echo at 0423 UTC; (d) Radar mosaic at 0523 UTC. Light lines represent entered boundary layer convergence line by human and the extrapolation results from their locations.
a b
dc
a b
dc c
a
d
b
c
a
d
b
Fig 11. VDRAS-based thermo-dynamical retrieval at lower layer at 0429 UTC, 14 Aug. 2008. (a) 187.5m-level perturbation temperature and wind vectors; (b) 562.5m-level vertical velocity and wind vectors; (c) 187.5m-level convergence and wind vectors; (d) 187.5m-level perturbation temperature gradient and wind vectors. Solid black lines denote observed reflectivity above 35dBZ.

48
obvious convergence uplift between the two storms. The perturbation temperature gradient also showed that the lower layer area between two storms was significantly unstable. Therefore, it could be inferred that as the two storms came together gradually, convergence at lower layer would be uplifted more remarkably with greater instability. Consequently, it was likely that localized storms would initiate in the area between two storms. This proved by the radar observations one hour later (see Figure 10d). In VDRAS system, the increments of retrieval fields over time could be used to indicate the change trend of the fields in two adjacent cycle (12 min.), which could serve as very good indication for the motion and the development of storms.
4.Future Development of the Systems
Based on the Real-time operational applications for the Olympics and participation of B08FDP demonstration, many problems to be addressed in BJANC system and VDRAS system have been identified. B08FDP has provided an excellent opportunity to learn from advanced international techniques and practices on severe convective storm nowcasting through evaluation and testing with other systems together, which will played a guiding role in the future research and development of the system.
(1) The B08FDP real-time verification shows that QPF forecast area from BJANC system was small. The main reason was due to the fact that BJANC only forecasts strong reflectivity echo with over 35dBZ through extrapolation, except storm initiation, and QPF forecast was based on the calculation of forecasted echo without considering the contribution of reflectivity below 35dBZ to precipitation. Therefore, the system will reduce the threshold of echo forecast and further consider the use of average weight of multi- threshold reflectivity forecast to calculate QPF in order to improve the effectiveness of QPF.
(2) BJANC system has still no specific and visual early warning products for severe weather (hail, short-time strong wind, lightning, etc.). Diagnostic and identification indicators and early warning algorithms for hail, short-time wind, lightning and others are being planned to be developed under BJANC.
(3) The BJANC system fails to use the function of real-time validation of Z-R relationship for precipitation observed from Automatic Weather Stations (AWSs), which affected the accuracy of QPE and QPF to a certain extent. The real-time validation of Z-R relationship will be developed to improve the quantitative estimates and quantitative forecasting of heavy precipitation for the BJANC.
(4) Extrapolation prediction algorithms of the BJANC system need further improvement. At present, the BJANC is based on the linear and parabolic TREC vector extrapolation method. Research and application of other systems under B08FDP has shown that the semi-Lagrangian extrapolation and optical flow extrapolation method has higher accuracy. The extrapolation forecasting algorithms of the BJANC will be further improved and optimized based on the advanced techniques of other systems of B08FDP.
(5) The time validity of forecasts for BJANC was found too short, and most products’ validity only spanned 1 hour and that of the storm track forecasts lasted for as long as only 2 hours. This could not completely meet the operational needs for severe convective weather warning and very short range forecast. A blending technique that integrates the results of

49
BJ-RUC numerical prediction system (BJ-RUC) into the BJANC to extend the time validity of the storm forecasts will be developed in the near future.
(6) The BJANC system lacked a visualized severe convective weather “warning-panel”. The SWIRLS system of the Hong Kong Observatory and CARDS of the Canadian Meteorological Service provided a good example for a severe convective weather warning board. Grids, sites and regional warning view panel based on the forecasting outcomes of the BJANC system will be developed, which will facilitate its use by forecasters.
(7) VDRAS-based retrieval and analysis of 3-D thermo-dynamical fields with convective-scale is one of the best solutions to continuous assimilation of the radar data and its operational application. The VDRAS will be further improved, including assimilation and retrieval of radar data from much more radars (during the 2008 Olympics and B08FDP demonstration, VDRAS only used radar data from Beijing and Tianjin S-band radars), development of indicators of the severe convective weather warning that is based on VDRAS retrieval fields, achievement of two-way coupling of the VDRAS and BJ-RUC system (BJ-RUC results provide to VDRAS as a background, and VDRAS retrieval results and forecasts provide to the BJ-RUC for further assimilation) in order to enhance forecast results of both VDRAS and BJ-RUC. In short, BMB objective is to develop a system that is user-friendly with higher forecasting accuracy.
5. The Overall Assessment of International Cooperation on Nowcasting
BJANC refers to a severe convective weather nowcasting system jointly developed by BMB and NCAR for over 5 years. It has realized the localization and further development of NCAR’s nowcasting techniques and algorithms. NCAR and BMB have accumulated rich experience and achieved substantial success in nowcasting research through co-operation project. The outcomes have laid a good foundation for BMB in the application of new generation weather radar data, severe convective weather nowcasting, and direct assimilation of radar data for high resolution numerical prediction. That has made BMB in the forefront of development and application of severe convective weather nowcasting techniques in China, and also served as an example for cooperation between the developed and developing countries in research, development, and application of emerging technologies in the field of meteorological science. Through technical cooperation with BMB on nowcasting, NCAR has enhanced its scientific knowledge of formation mechanism of severe convective storm under complex terrains, different weather and climatic conditions and different data environment, and improves its research capability for severe storm analysis and nowcasting. The successful implementation of B08FDP has not only helped enhance BMB/IUM’s capacity of severe storm warning service delivery for the Olympics and Paralympics, but also helped BMB upgrade its capacity and infrastructure to a new level in severe weather monitoring and early warning. The project has played an exemplary role in the efforts to building weather monitoring and early warning service in China and in relevant international cooperation. In addition, BMB has accumulated a wealth of experience for large-scale international cooperation projects. Through B08FDP, all participating organizations can also take advantage of the Beijing Olympic Games as a good opportunity to not only show their own severe

50
weather nowcasting systems, but also, more importantly, to use as a good "litmus test" as the Beijing-Tianjin-Hebei region under complex terrain, weather and climatic conditions and different in data environment. Through comparison, demonstration, mutual learning and information exchange during B08FDP, R&D level of all participants in their severe weather nowcasting has been further improved.
6. Recommendations on the International Cooperative Projects for Short-term Forecasting and Nowcasting in Future
The success of joint research cooperation between BMB and NCAR on nowcasting and successful implementation of the project B08FDP have showed that for the future international cooperation in short-range forecasting and nowcasting, the most critical to the success is a detailed and viable project implementation and management plan as well as substantive engagement of developers in specific R&D. In addition, for future international cooperation projects characterized by operational application, priority should be given to training on new technologies and methods in order that advanced techniques and systems can be fully applied into applications. In addition, it requires enthusiasm of operational staff involved in the international cooperation projects, which will be very conducive to the rapid integration of new technologies and new methods into operational applications. It is recommended that the China Meteorological Administration (CMA) actively give continued support to such substantive international cooperation. Through in-depth international cooperation, China’s local meteorological service can greatly enhance the capacity of technical innovation and integration in order to continuously improve the accuracy of weather forecasting, and bridge the gaps between developed and developing countries. It is recommended that the World Meteorological Organization (WMO) provide more opportunities for developing countries to host international cooperation projects with developed countries. International cooperation can assist developing countries in introducing internationally advanced techniques and experience of the weather forecast, accelerating the improvement of weather forecasts skills, and narrowing the gaps with the developed countries in the refined forecasting and service. Through cooperation with developing countries, developed countries can make use of geographical and climatic environment, observational data and the platform in developing countries as a testing ground for its advanced techniques, which will help them further improve their technologies and systems and enhance their R&D capability. The ultimate goal for successful international cooperation is to realize "win-win" situation between the developed and developing countries.
51
Summary Report on CARDS
Paul Joe (Cloud Physics and Severe Research Section, Environment Canada, Ontario,Canada)
1. Introduction of the system
CARDS is the operational radar processing system in Environment Canada. It is designed to process volume scan data for a variety of purposes – from general weather surveillance, severe weather detection and warning guidance, quantitative precipitation estimation and radar based precipitation nowcasting. The client provides interactive capabilities including product display, animations, pan-zoom, interactive cross-section and “drill down” capability from mosaics to thunderstorm cell level. Products include plan views and vertical slices through the data. For severe weather application, it identifies cells, their properties (area, intensity, mesocyclone, downbursts) and tracks them into the future. A key diagnostic tool is the ability to shift from the synoptic-mesoscale mosaic products used for surveillance immediately down to the multitude of thunderstorm scale products needed for warning decision making This development was a major legacy of the S2KFDP. For QPE, the system relies on quality controlled data and the appropriate Z-R relationship. For precipitation nowcasting, persistence and cross-correlation area tracking on the planar products is used to determine areal motion and nowcasting 90 min into the future. For the purposes of the B08FDP, nowcast plan products were produced though not normally done in Canada due to the experience with a point forecast product (See annex for more details).
2. Major tasks and the expected outcomes
There were several major tasks: input, output, radar data quality, algorithm modification. Input and output are always the significant issue because of implicit and inherent assumptions about the system and data, how to access, etc. Radar data quality issues were solved external to CARDS by CMA and Metstar though considerable assessment of the impacts was needed. A major task was to output the nowcast products in a common format (WxML). Adjusting all the CARDS algorithms and products, software to adapt to a different scan strategy (fewer elevation angles, different cycle time) proved to be a significant challenge and demonstrated the trade-off impact of different philosophies. For example, CAPPI and accurate echo top products are difficult to generate with the limited number elevations and are used extensively in Canada.
3. Estimation of the implementation
1) The estimation of your goals and tasks The goal was to demonstrate and inter-compare algorithms, systems in a prototype weather office of the future and to develop requirements for the office of the future for Environment Canada. Part of this involves processing radar data from the U.S., China is a surrogate since the data is the largely the same. 2) The advancements of nowcasting technology and/or management experiences

52
CARDS advancements and experiences include: (a) adaptation to a less dense scanning strategy and identification of detailed requirements and specification. (b) inter-comparison of the current operational nowcast product with new research products (MAPLE, SWIFT, STEPS, SWIRLS, NIWOT, BJANC) that include decay and growth, (c) inclusion into the TIFS ensemble warning guidance generator, (d) participation in real-time verification and detailed product verification and understanding strength and weaknesses, (e) identification of requirements with respect to use of high resolution models, (f) identification of the important role of diagnostic capabilities (VDRAS, CARDS drill down) in the forecast office and its role, (g) the separation of science and service in the operational forecast office of the future – dual roles for meteorologists. 3) Problems that found during the implementation and the solutions The system was largely implemented successfully and performed well. (a) Due to the sparsity of the number of elevation angles, certain products were not generated or were generated but not used extensively. This included CAPPI’s, echo Tops, etc. CAPPI’s were replaced by PPI’s. Echo Top had a greater variance and led sometimes to underestimation of storm severity. VIL was also affected. (b) The predominant nature of the storms were pulse type and the lack of rotating storms did not exercise the Doppler algorithms significantly. (c) Also many of the storms were orographically generated and stationary and posed a challenge for all the cell tracking algorithms. (d) Radar data quality was largely solved externally to CARDS. 4) The contribution to WWRP B08FDP (a) Severe weather warning system with diagnostics and ability to provide a broad area of coverage demonstrated, (b) Provided base line nowcasting product, (c) System setup configuration differences and assumptions challenged (not just algorithms) – precipitation threshold, (d) Assessment of radar data quality
4. Future development plan
(a) Radar data quality control and infrastructure (b) VDRAS diagnostic type system for convective initiation and nowcasting (c) Advanced QPE processing (can improve here at long ranges) (d) Advanced precipitation nowcasting (not really exercised in summer convective weather) (e) Hi-resolution NWP with radar data assimilation (f) Blending/Extended nowcasting (4-6 hour gap) (g) Better/more robust severe weather algorithms (h) Automated and interactive product generation (i) Forecast process development
5. Comments and Suggestions
Forecasting and nowcasting is a very complex activity and prototyping is required to identify all the issues and the generation of requirements, concepts and ideas based on experience and not just on paper and statistics that may or may not be relevant. In hindsight and I think during the Olympics, there was a realization that B08FDP was extremely successful and invaluable as this prototype. A significant part of the integration and the interaction of the

53
FDP into the BMB weather forecast process and particularly in the exchange of views and the openness and strong desire to learn and accept new ideas and systems. Then, we really saw the strengths and weaknesses of the systems and I really believe that we have a realistic “next steps”. I think I learned in B08FDP and elsewhere, that the depth of integration required for end-uses to use nowcast information – it is specific in time and space, weather element and user requirements. The user decision-making will change in time. The scientific community has focused on precipitation since it is the biggest impact variable but focus on other weather elements is required also – wind, temperature, etc. Our interpretations, results and conclusions will be challenged because of the limited statistics and duration of the project but that is for a “test bed” or “open lab” and “advanced nowcasting offices” to solve and address and refine but that doesn’t mean that we are wrong or can not move forward.
Annex B08FDP CARDS System Description
The CAnadian Radar Decision Support System (CARDS) used for the Beijing 2008 Forecast Demonstration Project (B08FDP) was substantially different than that used in the Sydney 2000 FDP (S2K). The first version of the software used in S2K was based on the research-operational processing system developed at the King City radar research group and was deployed within Canada as an interim system as Doppler capability was added to the network. It had many algorithms – cell, mesocyclone, microburst and hail detection. Point nowcast was available as a meteogram. One of the design elements of this system was the network access from a web-based client to the radar server. This allowed forecasters who are remotely located from the weather office (such as at Olympic headquarters) to access and interact with the radar data. Access to data has always been positively received. The second version of the software was essentially designed based on a cognitive task analysis of the severe weather workflow. The analysis showed that the severe weather forecaster uses a forecast funnel approach from large to small scales for decision-making. Large “battle board” scale is required to maintain situational awareness and small detailed scale is required to diagnose patterns and severe weather features for warning. It also focused on efficient use of computer screen real-estate, rapid access to a variety of severe weather products required to make warning decisions and it was implemented right across the country. In addition to the algorithms from the first version, cell tracking, storm classification identification and tracking, storm ranking and cell views were implemented. The latter provided rapid one-touch access to a plethora of products required to diagnose the severity of a storm. Interactive functionality allowed the user to jump from the large scale to the small scale in one step. This version of the software, called the Canadian Radar Decision Support (CARDS) system, was adapted to the B08FDP radar data environment. Highlights of the system as well as modifications required to adapt to the CMA radars will be described here.
Forecast Office Requirements
In Canada, the requirements of the software and computing processing are demanding. A single forecaster is responsible for providing severe weather warnings typically encompassing an area of up to eight radars - a region of 3 x 10⁶ km2 - an area comparable to the size of Europe. The forecaster must be able to maintain a broad view of the weather while at the same time be able to focus on individual

54
thunderstorms. Adding boundary radars, the CARDS server routinely processes 10 to 20 radars using multiple processors on several computers. With the four radars available in B08FDP (Beijing/BJ, Tianjin/TJ, Zhangbei/ZB and Shijiazhuang/SZJ), there are less demanding requirements for computer processing and only a dual-CPU processor is required.
Radar Data
In Canada, the scan strategy of the Doppler radars consists of a 5 minute 24 elevation conventional scan and a 5 minute 4 elevation Doppler scan. The radars are C Band, except for one S Band radar at McGill University. The 24 elevation angles are set in a geometric progression in order to produce constant altitude PPI products. At the low angles, the elevation angles overlap. The data is in IRIS format. In B08FDP, the scan strategy (VCP 21) consisted of 9 unique elevation angles and there is no overlap. This scan strategy posed to be a problem in creating nice CAPPI’s and Echotops due to non-uniform beam filling effects. Various techniques to interpolate between elevation angles were trialed but in the end, both the CAPPI and ECHOTOP products were abandoned. The latter is used by forecasters within Canada to estimate the strength of the updraft and storm severity. The data format is Level 2. This format was originally never meant to be a file format nor archived – it was used between dedicated Radar Data Acquisition and dedicated Radar Product Generation computers - and hence there are several deficiencies in the format – like no information about the source (radar site) of the data. In addition, the scan cycle can start anytime and be of variable length. In B08FDP, after the 2007 pilot, synchronization of the radar was implemented by BMB and this was a significant improvement for producing the composite and merging the algorithm outputs. The CARDS mesocyclone algorithm has a built-in shear de-aliasing algorithm and could handle the S Band (BJ, TJ, SJZ) and C Band (ZB) data seamlessly.
CARDS Design
In order to maintain surveillance over the entire forecast domain and to make warning decisions at the thunderstorm scale, a multi-radar composite is used in which the forecaster could "drill down" to products at a thunderstorm scale. Philosophically, this was a major paradigm shift in the radar processing from single radar to a network concept and fit well with the B08FDP as it was a multi-radar single office environment. In addition, the plethora of radar products must be presented in a succinct fashion to allow rapid and decisive assessment of individual radar views of thunderstorms. Algorithmic products are used to identify severe thunderstorm features in the radar data. Thunderstorm scale "cell views" were developed to merge the various products. Another important aspect was to rank and classify all the storms across all the radars and present the information in a SCIT table (Johnson et al, 1998). In any product-display system, it is always a balance between effective products versus data visualization and functionality. The client portion of CARDS, called the Interactive Viewer (IV) is a computer platform independent Java based viewer and was developed to access and to interact with the radar products across a network. To effectively use the limited screen space, the radar processing-viewer software was designed to use two high-resolution monitors (1600x1200 minimum).
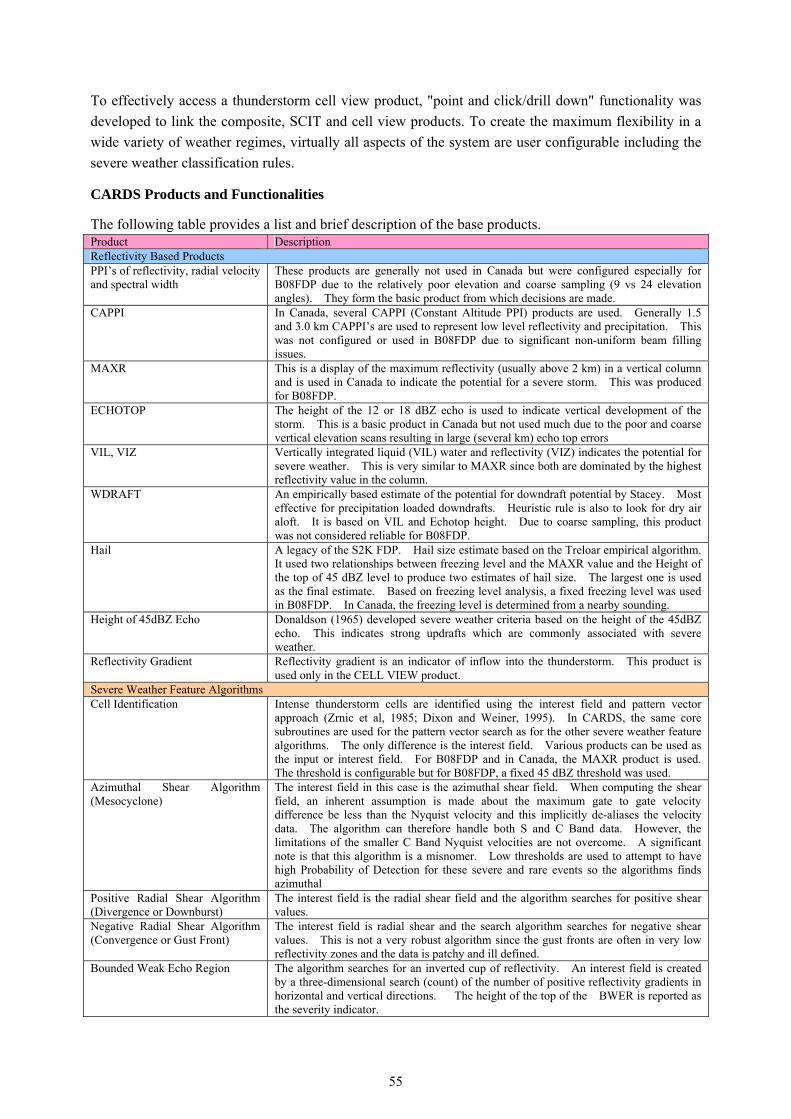
55
To effectively access a thunderstorm cell view product, "point and click/drill down" functionality was developed to link the composite, SCIT and cell view products. To create the maximum flexibility in a wide variety of weather regimes, virtually all aspects of the system are user configurable including the severe weather classification rules.
CARDS Products and Functionalities
The following table provides a list and brief description of the base products. Product Description Reflectivity Based Products PPI’s of reflectivity, radial velocity and spectral width
These products are generally not used in Canada but were configured especially for B08FDP due to the relatively poor elevation and coarse sampling (9 vs 24 elevation angles). They form the basic product from which decisions are made.
CAPPI In Canada, several CAPPI (Constant Altitude PPI) products are used. Generally 1.5 and 3.0 km CAPPI’s are used to represent low level reflectivity and precipitation. This was not configured or used in B08FDP due to significant non-uniform beam filling issues.
MAXR This is a display of the maximum reflectivity (usually above 2 km) in a vertical column and is used in Canada to indicate the potential for a severe storm. This was produced for B08FDP.
ECHOTOP The height of the 12 or 18 dBZ echo is used to indicate vertical development of the storm. This is a basic product in Canada but not used much due to the poor and coarse vertical elevation scans resulting in large (several km) echo top errors
VIL, VIZ Vertically integrated liquid (VIL) water and reflectivity (VIZ) indicates the potential for severe weather. This is very similar to MAXR since both are dominated by the highest reflectivity value in the column.
WDRAFT An empirically based estimate of the potential for downdraft potential by Stacey. Most effective for precipitation loaded downdrafts. Heuristic rule is also to look for dry air aloft. It is based on VIL and Echotop height. Due to coarse sampling, this product was not considered reliable for B08FDP.
Hail A legacy of the S2K FDP. Hail size estimate based on the Treloar empirical algorithm. It used two relationships between freezing level and the MAXR value and the Height of the top of 45 dBZ level to produce two estimates of hail size. The largest one is used as the final estimate. Based on freezing level analysis, a fixed freezing level was used in B08FDP. In Canada, the freezing level is determined from a nearby sounding.
Height of 45dBZ Echo Donaldson (1965) developed severe weather criteria based on the height of the 45dBZ echo. This indicates strong updrafts which are commonly associated with severe weather.
Reflectivity Gradient Reflectivity gradient is an indicator of inflow into the thunderstorm. This product is used only in the CELL VIEW product.
Severe Weather Feature Algorithms Cell Identification Intense thunderstorm cells are identified using the interest field and pattern vector
approach (Zrnic et al, 1985; Dixon and Weiner, 1995). In CARDS, the same core subroutines are used for the pattern vector search as for the other severe weather feature algorithms. The only difference is the interest field. Various products can be used as the input or interest field. For B08FDP and in Canada, the MAXR product is used. The threshold is configurable but for B08FDP, a fixed 45 dBZ threshold was used.
Azimuthal Shear Algorithm (Mesocyclone)
The interest field in this case is the azimuthal shear field. When computing the shear field, an inherent assumption is made about the maximum gate to gate velocity difference be less than the Nyquist velocity and this implicitly de-aliases the velocity data. The algorithm can therefore handle both S and C Band data. However, the limitations of the smaller C Band Nyquist velocities are not overcome. A significant note is that this algorithm is a misnomer. Low thresholds are used to attempt to have high Probability of Detection for these severe and rare events so the algorithms finds azimuthal
Positive Radial Shear Algorithm (Divergence or Downburst)
The interest field is the radial shear field and the algorithm searches for positive shear values.
Negative Radial Shear Algorithm (Convergence or Gust Front)
The interest field is radial shear and the search algorithm searches for negative shear values. This is not a very robust algorithm since the gust fronts are often in very low reflectivity zones and the data is patchy and ill defined.
Bounded Weak Echo Region The algorithm searches for an inverted cup of reflectivity. An interest field is created by a three-dimensional search (count) of the number of positive reflectivity gradients in horizontal and vertical directions. The height of the top of the BWER is reported as the severity indicator.

56
Severe Weather Algorithm Processing
For the B08FDP, a synchronization central computer (SCC) at the BMB was implemented to control and acquire data from the radars. Commands were initiated from the SCC to each radar to start a scan cycle. VCP21 (9 unique elevations form 0.5 o to 1.47o elevation known as the precipitation mode) is chosen by the CMA as their national scan mode. VCP11 with 14 elevation angles (the storm mode) was available but not chosen due to a variety of technical reasons including life cycle considerations. As the ray data is available in the Radar Data Acquisition (RDA) computer, groups of rays are packaged and the transferred as a group to the SCC where it is collated and a volume scan file is produced. This process replaces the proprietary ray by ray processing of the original CINRAD/NEXRAD RDA-RPG design with a more universal and flexible file based and fast network design. In addition, due to antenna rotation variations, the number of samples per ray was reduced on the higher elevation scans to keep the scan time under 6 minutes. A modification was made to the Level 2 format. The radar site identification number was included in a blank unused area in the file in order to provide information about the source of the radar data in the potentiality of the file being renamed inadvertently and incorrectly by downstream software. The CMA/Metstar also changed the number of bins collected for the C Band radar. So the records lengths were no longer fixed but were different for the different message records and the data record was different for the C and S Band radars. The C Band radars collected radar data at 125 km range bin separation and doubled the total number of range bins. The software had to read the record lengths within each message record to determine the length of the record and the message record lengths could not be assumed to be fixed as per the original convention. The radars in the B08FDP project are located on very tall towers in an urban and mountainous environment and also suffer considerable anomalous propagation (AP). The radar data is therefore further processed by a specially developed AP removal algorithm by the CAMS (Chinese Academy of Meteorological Science). Both the raw original and the quality controlled data were sent to the B08FDP Data Server. The FDP systems were free to choose which data to use. CARDS could use either data set but used the quality controlled data because it removed many of the artifacts and biases in the radial velocity data (see DQ report). The radar data was comprehensively assessed during the pilot phase and while there were significant artifacts that were eventually mitigated, the power calibration of the radar data was generally very consistent. The minimum detectable signal varied during the pilot phase but for the FDP phase, all the S Band radars reached -5.5dBZ at 50 km range and the C Band radar reached 0 dBZ at 50 km range. Fig. 2 shows the CARDS server-client distributed processing design. Multiple radar volume scans are ingested by a single invocation of the CARDS software. Two key elements of the software are that it is file based and that the science and product/graphics processing modules are split up. This allows the science processing and the image product processing to be distributed across offices. Each science module creates a "metafile" product. For example, these may include fields of CAPPI's or EchoTops

57
formatted in radar coordinate space and maintained at the volume scan data quantization resolution. These may also include outputs of the cell identification and mesocyclone algorithms, among others.
Figure 1: Data topology of the B08FDP.
Figure 2: Schematic of the radar processing. See text for details.
Each module is initiated based on the arrival of products on the CARDS internal server. The netCDF and XML files were reformatted metafiles and the CARDS designed allowed them to be created by separate modules that were triggered by the arrival of the appropriate metafile. Existing code did not have to be modified. Fig. 3 shows the "cell processing" processing specific to the severe weather aspects of the system. The steps are the following:
Determine and create product for cell identification Compute cell properties using the foot print and other radar products Merge the cells Track the cells Classify and Rank the cells Compute cell views

58
A MAXR metafile product from a single radar is created. The Cell Identification Module analyses the MAXR product for thunderstorm cells. This is thresholded, nominally at 45 dBZ, and a pattern vector feature identification technique (Zrnic et al, 1985) is used. This thresholding technique is used throughout the processing. Note that any product could be used to identify the location of the cell (e.g., VIL, Echotop, PPI’s, CAPPI’s). However, MAXR is used because it captures the strongest reflectivities on a plan view and maximized the footprint of the thunderstorms cell. 45dBZ is used to identify individual cells that may have their own mesocyclones or downbursts. Lower thresholds would detect bigger precipitation areas but could include several thunderstorms. The average and maximum MAXR reflectivities and their locations (in latitude-longitude co-ordinates) are computed and stored in the CELLID metafile as well as the pattern vectors. These pattern vectors are used as a footprint and applied to other radar fields such as the echotop, VIL, etc and the properties of the cell are computed and built up. At the end of the CELL PROPERTIES module, the storm cell will be described by a plethora of radar derived storm properties. This entire process (which properties are computed) is user-configurable including the outputs. Implicit in this concept and mimicking the decision-making process of a severe weather forecaster is that not one product is sufficient to determine severity of a storm and that the combination of features, the intensities and the pattern are required for the decision. The next step is to merge the cells in the overlapping radar regions. If the same cell is identified on two radars, we select the cell that has the largest reflectivity value. Other algorithms could be invoked but this accounts for attenuation, beam filling and beam resolution effects and the detection on the closest radar is usually used. At the end of the CELL MERGE step, we have a data set of all the cells from a single time step for all the radars in the composite region. At this point we pass the data on to the TRACKER module which is based on the work of Dixon and Weiner (1993) to track the storms within and across radars.
Figure 3: Thunderstorm cell to SCIT and Cell View processing. See text for details.
Following the TRACKER, we assess the storm for severity. This is done in two ways - by rank and by classification. To compute the rank, we categorize the following parameters - the maximum reflectivity, the VIL density, max Hail size, max 45 dBZ echo top, the downdraft potential,

59
mesocyclonic shear and BWER confidence - as detected, weak, moderate or severe by thresholds. Then these categories are assigned a numeric value from 1 to 4 and then summed to get an overall rank for the storm. To compute the classification (such as supercell), user configurable rules are implemented to combine radar detected features (such as existence of BWER, mesocyclone and alignment of the echo top over the low-level gradient). Note that in practice, the rank is more useful since it sorts all the storms in the entire Regional domain and across all the radars. Again, the rank and the threshold values are totally configurable and for B08FDP, the ones from Canada were used. The ASSESSMENT CELL VIEW module then takes the output from the TRACKER and STORM ASSESSMENT and CLASSIFICATION (SAC) module and creates the metafile for the SCIT table (Fig. 7) and the metafiles of individual thunderstorm cells (Fig. 8). The CELL VIEW module is totally configurable. Different number of image windows, different products can be displayed in the windows. It is totally user-configurable on the server.
Storm Ranking
The forecaster does not use a single algorithm or product to make a severe weather decision. Threshold numerical values, the presence of severe weather features, the relative location of the features are all used in the diagnosis of a severe storm. A Storm Ranking parameter is created to summarize the numerical output of the algorithms to provide an overall assessment of the storm but most importantly to reduce the high false alarms associated with the low thresholded but high probability of detection algorithms. The greater the number of severe weather features, the more likely that the storm is actually severe. This is the key concept in the effective use of the automated algorithms. The features of parameters included for 'ranking' are listed in the table below. In addition, the following was included to provide additional information (some of these were included by the URP Team):
the 'storm or track number' is included to provide a 'link' between the SCIT table and the cell view product.
the echo top height is included since it is a traditional parameter to indicate storm development, however this was not used in B08FDP
the storm speed is included to help interpret the track information (back building thunderstorms have little motion and deviations appear 'random'); storm speed is also useful to look for stationary thunderstorms that may cause flooding
a storm category is provided to help synthesize, interpret and summarize the various parameters. It is an attempt at better capturing the heuristic rules of severe thunderstorm identification. It is not used in the ranking and is experiment.
The following table shows the parameters and the categories of severity for each.
Each of the ranking parameters (show in green in the SCIT table) are first categorized into four general categories in a fuzzy logic membership function manner: minimum, weak, moderate and severe using thresholds. The result is a 0-4 categorization for each of the ranking parameters (Rp.).
Then the overall rank is determined by summing the individual ranking parameter values, this is called the Rank Weight: R = Σ Rp

60
To normalize the Overall Rank or just simply the Rank the value of R is first divided by the total number of parameters used to provide a Rank Weight values in the numeric range from to 4.
As a forecaster request, the value R is multiplied by 2 to provide a ranking that ranges from 0 to 8 - to provide 8 categories of storm ranking.
One of the inherent assumptions and subtleties is that the most severe of thunderstorms will have high values of Rp across the board and that the overall ranking will thus be high.
The table was implemented by a piece-wise linear approach to the membership functions. Simple polynomials of the form Rp = c1 P + c2 P2, where the P are the parameter values and c1,2 are coefficients determine through curve fitting between the parameter rank value (t=0-4) and the corresponding thresholds for each parameter (Pt). The polynomial approach (instead of linear) is needed to account for non-linear threshold sequences.
Thresholds Rank
(0-8) BWER Meso Hail Wdraft Vil density Max Z 45 dBZ
ETop count M/s/km Cm m/s Kg m^2 / km dBZ Km t Pt Pt Pt Pt Pt 0 0 0 0 0 0 0 0 Minimum 1 0-2 5-11 4 0.5 10 2.2 30 5.5 Weak 2 3-4 12-17 6 1.3 15 3.0 45 8.5 Moderate 3 5-6 18-21 8 2.3 20 3.5 50 10.5 Severe 4 7+ 22-26 10 5.0 25 4.0 60 12.5
X coeff1 0.134 0.0209 1.5425 0.0874 -0.0489 -0.0761 0.0685 X2 coeff2 0.0021 0.1973 -0.1471 0.0029 0.2529 0.0023 0.0202 Notes: Rank: 5-6 means a value of 5 or more but less than 7. WER: Use the count. Meso: Average PV Shear Hail: Average Hail Size WDRAFT: Gust potential in m/s, add average gust+speed Vil Density: Similar to WDRAFT in pattern (not used in B08FDP) VIL if we use VIL for classification then 10 20 30 40 c1=0.1 and c2=0 Max Z: Max of the Max Z 45 dBZ Echotop Ht: Reliable echo top parameter
The rank order of storm severity is then determined by simply sorting on the overall rank weight R. In the SCIT table product, the cells are color coded according to the thresholds (left column) to provide a visual indicator of severity – see Fig. 7.
Precipitation Nowcasting
The precipitation nowcasting is a modified version (by Norman Donaldson, personal communication) of the original extrapolation nowcast (Bellon and Austin, 1978). It subdivides the domain into arbitrary size sectors (generally 40 x 40 km) and cross-correlation tracking is done on consecutive reflectivity products. A deterministic nowcast is performed using backtracking and assuming no decay or growth. Analysis indicated that velocity errors are most likely in direction rather than in speed and so an estimate is made of the maximum potential intensity value by searching in a cross-track direction. The range of the search is determined assuming a 16o error in the track direction. Experience in Canada indicated that a meteogram approach for point forecast was easier to interpret for a point or venue than animated plan imagery. Fig. 4 show an example of the Point Nowcast Product that provides a user-friendly display of the start, end times, intensity and uncertainty information for each venue. Animated imagery would require the forecaster to estimate the location of the point of interest as well as all the previously required information from a sequence of images. However, for B08FDP, netCDF files of plan views of the precipitation nowcasts were created for the

61
verification program. In light of the significant differences in the nowcasts, a display of the plan precipitation nowcasts were created by the BMB B08FDP web display software from the netCDF files. They were not available on the CARDS server.
CARDS Client/Interactive Viewer
The user interface to the products is critical. The functionality and performance of the user interface must match the products and interaction concept. To reduce the use of screen real estate and to increase the usability, all products can be created as multi-radar composites and these products are layered in the viewer so that the user can toggle instantly from one product to another. A platform independent JAVA application called the Interactive Viewer (IV) was created. This uses interactive web technology to serve and interact with the image products in the CARDS database. The usual animation, pan and zoom features are available. A change was required to accommodate the ten versus six minutes data cycles used in Canada and China, respectively. Other functionality of the IV include the ability to draw lines (Grease Pencil Utilities or GPU), do manual extrapolations, do cross-sections, add text, drill down to access single radar products, drill down to access cell views and toggle between products and backgrounds. The GPU are diagnostic tools to manually validate the two automatic tracking procedures – see Fig. 5
Fig. 4 Point Forecast meteogram example (left) and
the corresponding plan image is shown in the
following figure for the Beijing area. Various
venues (see next figure) are listed across the image
and time is down the image. The colors correspond
to rain intensity (same in both figures).
Fig. 5: Manual tracking can be done by selecting two points representing the motion on two images taken at different times which set the velocity and then various points (leading edge, centroid, back edge) on the image are tagged and forward trajectories are generated. Some manually drawn lines aid in determining the leading edge of an area of light precipitation. The length of the forward trajectory and the markers are configurable. This provides an extended planar analog to the point forecast meteogram (previous figure).
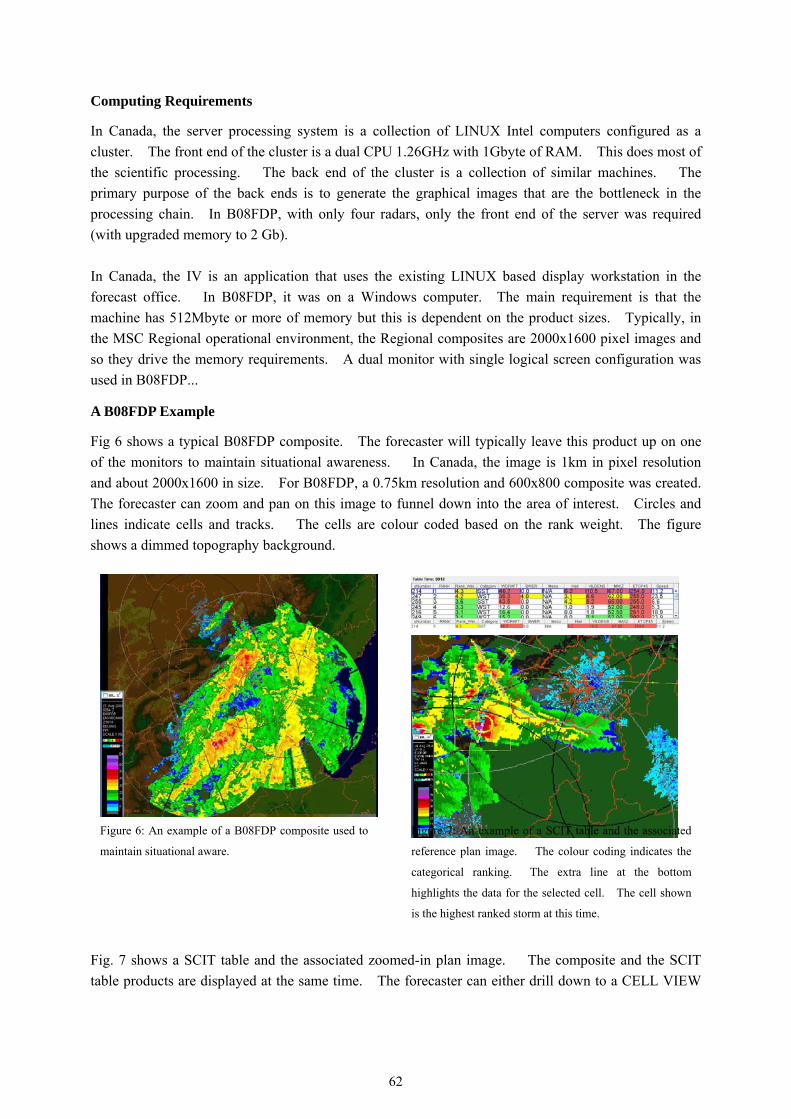
62
Computing Requirements
In Canada, the server processing system is a collection of LINUX Intel computers configured as a cluster. The front end of the cluster is a dual CPU 1.26GHz with 1Gbyte of RAM. This does most of the scientific processing. The back end of the cluster is a collection of similar machines. The primary purpose of the back ends is to generate the graphical images that are the bottleneck in the processing chain. In B08FDP, with only four radars, only the front end of the server was required (with upgraded memory to 2 Gb). In Canada, the IV is an application that uses the existing LINUX based display workstation in the forecast office. In B08FDP, it was on a Windows computer. The main requirement is that the machine has 512Mbyte or more of memory but this is dependent on the product sizes. Typically, in the MSC Regional operational environment, the Regional composites are 2000x1600 pixel images and so they drive the memory requirements. A dual monitor with single logical screen configuration was used in B08FDP...
A B08FDP Example
Fig 6 shows a typical B08FDP composite. The forecaster will typically leave this product up on one of the monitors to maintain situational awareness. In Canada, the image is 1km in pixel resolution and about 2000x1600 in size. For B08FDP, a 0.75km resolution and 600x800 composite was created. The forecaster can zoom and pan on this image to funnel down into the area of interest. Circles and lines indicate cells and tracks. The cells are colour coded based on the rank weight. The figure shows a dimmed topography background. Fig. 7 shows a SCIT table and the associated zoomed-in plan image. The composite and the SCIT table products are displayed at the same time. The forecaster can either drill down to a CELL VIEW
Figure 6: An example of a B08FDP composite used to
maintain situational aware.
Figure 7: An example of a SCIT table and the associated
reference plan image. The colour coding indicates the
categorical ranking. The extra line at the bottom
highlights the data for the selected cell. The cell shown
is the highest ranked storm at this time.

63
(Fig. 8) into a storm via the composite or via the SCIT table. The forecaster can also rapidly do survey the cells from the SCIT table without invoking the CELL VIEW products.
Figure 8: An example of a CELL VIEW.
Fig. 8 shows a CELL VIEW product. This shows a variety of images that allows the forecaster to quickly make a decision as to the severity of the storm. There are two CELL VIEW images created for each storm - one based on reflectivity and one based on Doppler data (not shown). The product shows an ensemble product of the algorithms (upper left hand corner, not described), automatically generated cross-sections, four PPIs, reflectivity gradient, MAXR, echo top, VIL density, Hail, BWER and 45 dBZ echo top and time graphs. In Canada, CAPPI’s are used instead of the PPI’s. There are two automatically generated cross-sections are determined by the location of various cell features (configurable). In this case, the location of the cell centroid and the location of the echotop is used for one of the cross-sections (blue) and the location of the cell centroid and the location of the bounded weak echo region (if it exists) are used for the other (orange).
Summary
The CARDS system as it was modified and configured for B08FDP was described. This document also summarizes the severe weather products used in B08FDP. The data ingest was modified to handle CINRAD S Band and C Band data. The mesocyclone algorithm was modified to process 9 elevation scans instead of 4 scans. Echotops and products derived from that product (WDRAFT, Height of 45dBZ Severe Weather product, Hail, Echotop and Rank Weight products) were affected. CAPPI products were also affected by non-uniform beam-filling effects and PPI products were used instead. XML output for the storm tracks (and some cell properties) and a precipitation nowcast product in netCDF was created especially for the B08FDP verification sub-project.
References
Bellon, A. and g. Austin, 1978: The evaluation of two years of a real-time operational short-term Precipitation forecasting procedure, JAM, 17, 1778-1787.
Dixon, M. and G. Weiner, 1993: TITAN, Thunderstorm Identification, Tracking, Analysis and Nowcasting - A Radar-based Methodology, JAOT, 10, 785-797.
Donaldson, R.J., 1961: Radar reflectivity profiles in thunderstorms, J. Met., 18, 292-305.

64
Joe, P., Marie Falla, Paul Van Rijn, Lambros Stamadianos, Trevor Falla, Mike Leduc, Steve Knott and James Dobson, 2002: Radar Data Processing for Severe Weather in the National Radar Project of Canada, SELS, San Antonio, AMS
Johnson, J.T., P.L. MacKeen, A. Witt, E. D. Mitchell, G. J. Stumpf, M. D. Eilts, and K. W. Thomas, 1998: The Storm Cell Identification and Tracking Algorithm: An Enhanced WSR-88D Algorithm. Wea. and Forecasting, 13(2) 263-276.
Lapczak, S., E. Aldcroft, M. Stanley-Jones, J. Scott, P. Joe, P. Van Rijn, M. Falla, A. Gagne, P. Ford, K. Reynolds and D. Hudak, 1999: The Canadian National Radar Project, 29th Conf. Radar Met., Montreal, AMS, 327-330.
Marshall, J.S. and E.H. Ballantyne, 1975: Weather Surveillance Radar, J.A.M., 14, 1317-1338. Zrnic, D.S., D. Burgess and L. Hennington, 1985: Automatic Detection of Mesocyclonic Shear with Doppler
Radar, JAOT, 2, 425-438.

65
Summary Report on GRAPES-SWIFT
Xue Jishan1 Feng Yerong2 Zeng Qin2 Hu Sheng2 Liang Qiaoqian2 Wang Ying2 Huang Yanyan2 (1 Chinese Academy of Meteorological Sciences, CMA, Beijing, China)
(2 Guangdong Meteorological Bureau, CMA, Guangzhou, China)
1 System Description
GRAPES-SWIFT was developed jointly by CMA’s Guangdong Meteorological Bureau (GMB/CMA) and Chinese Academy of Meteorological Sciences (CAMS/CMA). Aiming at providing an integrated severe weather nowcast system for operational application, GRAPES-SWIFT is able to ingest data from China’s new generation Doppler radar, automatic weather station (AWS), satellite, and mesoscale numerical weather prediction model GRAPES (Global/Regional Assimilation and Prediction System). It offers a platform for severe weather monitoring, analysis, warning and prediction.
The current GRAPES-SWIFT software package includes a series of nowcast algorithms and functionalities. It comprises two components: the model component GRAPES-CHAF (Cycle of Hourly Assimilation and Forecast) and the nowcasting component SWIFT (Severe Weather Integrated Forecasting Tools).
During B08FDP, model data came from mesoscale rapid assimilation system CHAF (Cycle of Hourly Assimilation and Forecast) which was configured in the non-hydrostatic GRAPES model. This hourly assimilation system provided atmospheric parameters for a series of nowcast algorithms. Using a three dimension variational assimilation (3DVAR) scheme, the system could assimilate conventional observations on ground and in the air, as well as unconventional data, such as automatic weather stations, aircraft reports, satellite cloud-derived wind, radar VAD (Velocity Azimuth Display) data, etc. GRAPES-CHAF model was set up in a triple nested domain with spatial resolutions 36, 12 and 3 kilometers for the coarse, medium, and fine grid mesh respectively. The model was divided vertically into 31 levels in terrain-following coordinate. Started up every 3 hours, it provided real time analyses and 6-h forecast in 1-h temporal resolution.
The nowcast component SWIFT generated nowcast products by extrapolation technique and statistical approaches. Nowcast algorithms include 2D radar reflectivity mosaic (2DMOSAIC), Quantitative Precipitation Estimate (QPE), 0-3h Quantitative Precipitation Forecast (QPF), Convective Weather Potential (CWP), and Storm Cell Identification, Tracking and Nowcasting (SCITN).
3-km CAPPI (Constant Altitude Plan Position Indicator) reflectivity mosaic was generated using raw data from Beijing, Shi Jiazhuang and Tianjin Doppler radars with its own built-in quality control procedure to remove noises such as ground clutter, shielding, anomalous propagation (AP), etc., In order to emphasize convective signatures, maximum reflectivity was chosen for radar-overlapping areas instead of interpolation of reflectivity from the nearest radar beam. Yet this could bring overestimate for echo intensity and hence the QPF.

66
QPE algorithm was developed using historical data from radar and AWS observations. Radar reflectivity was subdivided into 12 categories through which Z-R relations were built individually. This algorithm initially took into account the different effects of convective and stratiform clouds. In real time application, Optimal Interpolation (OI) was applied to calibrate the estimated rainfall through rain gauge observations at each grid point on hourly base.
The displacement vectors of radar echoes are derived from two consecutive 3-km CAPPI reflectivity mosaics via the COTREC (Continuity Tracking Radar Echoes by Correlation) algorithm. The radar-derived vectors are adjusted by forcing them to follow the rule of horizontal non-divergence using variational analysis.
A new extrapolation technique was developed to make forecast of radar reflectivity with lead time up to 3 hours. The technique generated composite extrapolative vectors by blending echo motion vectors derived by COTREC approach with horizontal winds predicted by GRAPES-CHAF model. A similarity index was designed to determine the level on which model winds were applied to the extrapolation process by measuring the likeness between model winds and radar vectors. Fuzzy logic was applied to combine model winds with COTREC vectors so that a synthesized extrapolative vector field was produced.
Based on extrapolative forecast of radar reflectivity, 0-3h QPF was made over the entire Beijing area. Like QPE, 12 categorical Z-R relationships were applied to provide first guess for rainfall prediction. Then OI was applied to calibrate the Z-R estimated rainfall forecast through observation from a network of some 50 rain gauges in Beijing area for each grid point of reflectivity forecast.
The CWP algorithm was applied to provide probabilistic forecast for severe weather (wind gust, hail and tornado) occurrences in 60 min valid time and within the radius of 60 km from storm centroid. Thunderstorm cells were automatically identified by radar echoes with intensity greater than or equal to 50 dB(Z) and of an area over 64 square kilometers. The algorithm digests predictor data from radar reflectivity, AWS and GRAPES-CHAF output. The predictand was the probability of a thunderstorm cell to generate severe convective weather events. The predictor-predictand relationship was established through a stepwise multiple linear regression approach based on a two-year dataset from Guangdong. In real time forecast, a storm cell having a value of CWP exceeding the threshold 0.195 would indicate potential occurrence of severe weather events, and thus would be highlighted with a shaded circle (Fig. 1).
The GRAPES-SWIFT’s SCITN algorithm used multiple reflectivity thresholds to extract 3-D cores from intense and continuous area of echoes so that storm cells could be identified objectively. Convection Index (CI) was developed using fuzzy logic to measure the convective characteristics of a storm cell by weighting several storm properties such as size, intensity, standard deviation of reflectivity, etc. Once storm cell identifications were completed, the cells in two consecutive radar volume scans were cross-correlated. A distance-correlation approach was used to track the storms that were matched in time so that the historical paths of storm cells were indicated. 1-h forecast for storm cells locations were computed by COTREC vectors and indicated in solid arrows (Fig. 2).
To meet the non-delay demand of nowcast, data flow of the system is controlled by an event
67
triggering mechanism rather than a timer. All the product-generating procedures were asynchronously triggered upon data arrival or renewal. Hence, GRAPES-SWIFT system can rapidly respond to the latest incoming data, present the user the latest updated nowcasting products..
The operational GRAPES-SWIFT system was built on a GIS platform. It can provide detailed geographic information such as terrain, administrative districts, high ways, or even detailed street information in a city. This GIS-based system facilitates geographic display of the products, storm positioning, and the indication of warning area.
GIS functionalities built in GRAPES-SWIFT help forecaster precisely position the storm location and precipitation area geographically and easily add and overlap standard GIS information (terrain, administrative districts, high ways, or even detailed street information). Six-level pyramided high resolution shaded relief topography generated by 90 meter SRTM Digital Elevation Model (DEM) data illustrates the Beijing surrounding terrain in detail (Fig. 3).
2 Objectives
As one of the participant systems, GRAPES-SWIFT participated in B08FDP during the official period for the Olympics and Paralympics from August 1 to September 21, 2008.
One of the objectives for GRAPES-SWIFT in B08FDP was to verify its series algorithms. Since most of the algorithms in the system, such as, Z-R relation, CWP and radar mosaic scheme etc, were developed based on historical data from southern China (Guangdong province), where synoptic situations for thunderstorm initiation and movement seem rather different than in Bejing, it is necessary to investigate the system’s applicability in middle latitude. B08FDP provide a chance to evaluate GRAPES-SWIFT’s performance and to meet the challenge in severe weather nowcast.
Another purpose for GRAPES-SWIFT’s participation in B08FDP was to provide nowcasting service to the thrilling Beijing Olympics. As we are aware, Beijing Olympics was held in the thunderstorm season. Any weather related to rainfall or thunderstorm would have significant impact on many of the Olympic events. One of the goals for B08FDP was to serve the games in terms of weather nowcast.
The third objective was to participate in international activity in the field of severe weather nowcast. B08FDP has provided such opportunity. Through B08FDP, FDP participants were able to make comparisons between different systems and exchange knowledge on nowcasting issue. The developers of GRAPES-SWIFT had leant a lot from other participant systems.
3 Achievements
The system yielded rather robust products during Olympic events and provided useful forecasts for the games. Verification of the system’s performance was carried out on the dataset for the entire B08FDP period. Validation results show that the system provided relatively skillful forecasts on rainfall and storm movement.
Precipitation forecast of each participant system were displayed on B08FDP webpage (Fig. 5). QPF products were verified against rain gauge observations. GRAPES-SWIFT produced 0-3 h

68
QPF while only 1-h QPF being verified. For 1-h QPF, GRAPES-SWIFT achieved comparable CSI scores according to RTFV statistics by Dr. Beth Ebert.
In QQ plot, GRAPES-SWIFT seemed to produce QPF quite different from the rainfall observation: overestimate for rainfall less than 30 mm/h and underestimate for rainfall above that (Fig. 6). For most of the cases, GRAPES-SWIFT produced overestimated QPF (see Fig. 5). Overestimates generally resulted from overestimation of reflectivity in rather wide coverage. Although at times the overestimates of QPF enabled GRAPES-SWIFT to predicted rainfall amount rather close to the observed rainfall maxima, it did cause a higher false alarm ratio (FAR) than other systems.
Maximum value chosen for radar overlapping grid point in reflectivity mosaic could explain part of the causes for the overestimation of QPF. Another cause could be the use of initial Z-R relationship of Guangdong where precipitation seems much stronger than that in Beijing for the same reflectivity intensity. There might exist other reasons such as no effective filtering for weak stratiform echoes or poor QC procedures for removing the non-meteorological radar echoes.
More than 1500 storm cells were objectively identified and tracking during B08FDP. The mean distance error for GRAPES-SWIFT’s 0-1 h thunderstorm path prediction was within 2 kilometers. Interestingly, zonal (X) distance error was nearly zero, but the meridional (Y) distance error was higher (Fig. 7).
Through B08FDP, We had obtained further understanding about GRAPES-SWIFT’s strengths and weaknesses as well as knowledge for future research and development.
Fig.1 Severe thunderstorm cells identified at 0300z Aug 14, 2008

69
Fig.2 Thunderstorm identification, tracking and nowcast at 0542z Aug 10, 2008
Fig. 3 Radar reflectivity overlaid on the Shuttle Radar Topography Mission Digital Elevation Model

70
Fig. 4 CSI scores for QPF during the entire B08FDP period.
Fig. 5 60-min QPF were displayed on B08FDP webpage.

71
Fig. 6 The Quantile-Quantile plot for 1-h QPF
Fig. 7 Error on storm cell movement nowcast.

72
Summary Report on MAPLE
Bill Conway (Weather Decision Technologies Inc., USA)
1. Introduction of the system
The McGill Algorithm for Precipitation Nowcasting Using Lagrangian Extrapolation (MAPLE) developed at McGill University in Montreal, Canada uses statistical techniques on past radar images to predict the future location and intensity of reflectivity and future quantitative precipitation. Prior to MAPLE processing, data from the four available radars covering the immediate Beijing region were quality controlled and combined into a 3-D mosaic using software developed at the National Severe Storms Laboratory (NSSL). Two output files from the NSSL mosaic software are the composite reflectivity and a “lowest-level” terrain following reflectivity field. Because it is more stable, the composite reflectivity field is used for the generation of MAPLE forecast vectors, however the QPF is derived from the forecasts of the lowest-level field as the QPF derived from this reflectivity field should be most representative of the precipitation reaching the surface. Products available to the B08FDP forecasters were composite, lowest-level reflectivity, and precipitation forecasts out to 60 minutes in advance. These forecasts were updated every 6 minutes.
2. Major tasks and the expected outcomes
Major task was decoding the byte swapped file based radar data and creating the netCDF output in WxML format.
3. Estimation of the implementation
1) goals and tasks Goal of participation was (a) to participate in aa inter-comparison of the various QPE nowcasting systems and (b) to have the nowcast products verified against each other and against the mesonet gauges. 2) The advancements of nowcasting technology and/or management experiences Independent scientific integrity and validation of the MAPLE algorithm. 3) Problems that found during the implementation and the solutions Limited time in determining the appropriate Z-R relationship. Went with Hong Kong relationship. This may have contributed to the qualitative impression during the Olympics that MAPLE got the patterns right but under-forecast the intensities. Limited radar coverage limited the length of the nowcast period to less than 2 hours. More

73
radars upstream would increase the nowcast period (typically skill has been shown out to 6 hours with continental scale mosaics). 4) The contribution to WWRP B08FDP Participation by a commercially available and operational QPE nowcating system
4. Future development plan
A new version of MAPLE is available and replay of B08FDP data will provide an additional inter-comparison on its improvement
5. Comments and Suggestions
From the statistical results it is difficult to see that MAPLE really did any better or any worse than the other systems that were performing forecasts out to 60 minutes. With time permitting, replaying key cases (for future training workshops) may provide insights into the strengths and weaknesses of individual and the ensemble of nowcast systems.

74
Summary Report on NIWOT
Jim Wilson (National Center for Atmosphere Research, Boulder, CO, USA)
1 Introduction
In 2000 a demonstration of convective storm nowcasting techniques form around the world were tested in conjunction with the summer Olympic Games in Sydney Australia. This effort was conducted under the approval of the World Meteorological Organization (WMO) World Weather Research Program (WWRP). Following this very successful demonstration the newly formed Nowcasting Working Group of the WWRP adopted the following objectives
• To advance the science of nowcasting, including meteorology processes and predictability.
• To promote, and aid the implementation of nowcasting in the WWRP framework and within National Meteorological Services and their end users.
The Nowcasting Working Group adopted the definition advanced by Conway (1992) which states nowcasting is forecasting with local detail, by any method, over a period from the present to a few hours ahead. Soon after the Sydney Games a number of forecasting establishments around the world began to focus on nowcasting convective storms for the 0-6 hour forecast period. The Beijing 2008 summer Olympic Games then became a focus of the Nowcasting Working Group to conduct another Forecast Demonstration Project (FDP). NCAR participated in this demonstration with a nowcasting system called Niwot. Following the Sydney 2000 Forecast Demonstration it was clear that even for forecasts as short as 30-60 minutes that real progress would require forecasting initiation, growth and decay. While the Auto-nowcaster has some skill in forecasting initiation, growth and decay for this short time period it would require input from numerical model forecasts for periods beyond 2-3 hours depending on the situation. Thus NCAR developed a simplified system called Niwot for 1-6 hour convective precipitation nowcasting for testing in the B08FDP. Niwot is a system based on the merging and blending of precipitation forecasts from the extrapolation of radar echoes and from Numerical Weather Prediction model output. While Niwot could be an acronym for a variety of applicable names it is instead named after an American Indian Chief who is said to have had some forecasting skills who settled in the area later to be known as Boulder Colorado. Section 2.0 describes background on Niwot , forecast rules that were proposed for the B08FDP based on studies from the trials and expectations for the B08FDP. Section 3 describes specifics of the Beijing implementation. Section 4 provides some of the Niwot nowcasting results .Section 5 is a summary with thoughts about future directions for convective storm nowcasting.

75
2. Niwot background, forecast rules and expectations
In 2006-2007 NCAR experimented with several methods for blending numerical model and radar refleclectivity forecasts for the 1-6 hour time period. The tests were carried out for a 600 km by 800 km area centered over Illinois, Indiana and Ohio in the central U.S. The model was the Real-Time Four Dimensional Data Assimilation (RT-FDDA) version of MM5 developed at NCAR. The model had a three tier nest where the inner 5 km grid was centered on the forecast area.. This model had a 3 hour cycle that continuously assimilated high resolution radar and surface station data. . The extrapolation of radar data was based on a mosaic of 5 NEXRAD’s. Based on this study there was promise that a numerical model could improve extrapolation forecasts by using the model forecast trends of growth/decay to correspondingly grow or decay the extrapolated radar echoes. The numerical model used for the B08FDP trial in 2007 was initially a 9 km version of a 3DVAR WRF that was developed under a collaborative effort between Bill Kuo and H. Huang of NCAR and the Institute of Urban Meteorology (IUM) in Beijing. This model was referred to as the “China WRF Rapid Update Cycle Model (WRF/RUC)”. Near the end of the Trial which was conducted in July 2007 a 3 km version of the above model became available and this was then used by Niwot during the formal FDP during 2008. The 3 km version was much preferred since it produced an accumulated rainfall and rain water field from an explicit microphysics precipitation scheme. For use in Niwot the rain water field was converted into radar reflectivity. The WRF model was not able to assimilate radar data thus it was a major uncertainty how useful the model would be for blending purposes during the B08FDP. Steps in obtaining the 1, 2, 3, 4, 5, and 6 hr radar echo extrapolation fields included a) removing the non-precipitation radar echoes from the four radars (TJRS, BJRS, SJZRS and ZBRC), b) mosaicing the radar reflectivity from the four radars and c) running the NCAR area extrapolation program which was a modified version of TITAN. During the trial period (summer of 2007) significant problems occurred with the radar mosaic process because of latency by one or more of the radars. This problem was nicely remedied by BMB after the Trial period when they implemented software to synchronize the beginning and ending of the volume scans from all four radars. A study was conducted of convective storm initiation and storm evolution for the summers of 2006 and 2007 in the Beijing vicinity. Data used in the study were radar, surface station, sounding and synoptic charts. The transition within the forecast area from the coastal plain to the mountains frequently generated significant forecast challenges. In addition the city of Beijing on a few occasions seemed to initiate storms. Storms moving from the mountains to the plains were observed to either intensify or dissipate. Storm initiation by the higher mountain peaks and along the foothills was common. The study suggested it was particularly important to monitor in detail the stability of the costal plain air when south and easterly winds were impinging on the foothills. A collaborative paper between NCAR and BMB on this study was prepared and presented at the 33rd Radar Conference in Cairns Australia. Based on these studies the following forecast rules were suggested for the B08FDP

76
Cells moving from the mountains to the plains. A frequent problem is deciding whether echoes that are extrapolated to move from the mountains to the plains will dissipate, stay the same or intensify. - forecast dissipation of isolated or poorly unorganized cell clusters. The training case 0f 12 August 2007 is an interesting exception in this regard. The cell that gives heavy rain to Beijing on this day was the only one to survive the movement from mountains to plains and it dissipated rapidly over Beijing. - forecast dissipation of an echo line if there is no obvious gust front. An exception would be if the air over the plains is unstable and growing cumulus clouds are prevalent over the plains. - forecast intensification or at least no change if a gust front is observed to move off the mountains or a strong gust front is observed with the echoes. To forecast intensification there should be evidence of instability over the plains such as existing storms or growing cumulus. Storm initiation over the foothills or Beijing with warm, humid low-level S-SE winds. Storm initiation along the foothills near Beijing or over Beijing is very challenging in that there is almost no warning before rain begins in Beijing. These cases occur primarily with warm, humid low-level S-SE winds. - forecast initiation if the mountains are not blocking the low-level S-SE flow and rapidly growing cumulus are observed. By monitoring the Doppler velocity and the surface stations evidence of mountain blocking of the flow can be inferred. The blocking is evidence of stability. Dissipation of small echo clusters. Most cells or small clusters of cells dissipate in 30-60 min - forecast dissipation within 60 min if the cell diameter is less than about 10 km and the cells are not associated with a convergence line. - forecast dissipation if the boundary and storm are moving in opposite directions. - forecast dissipation if the gust front is moving away from the cells. Cell initiation and growth associated with convergence lines - forecast initiation along a surface convergence line if satellite or radar indicates rapidly growing cumulus - forecast initiation if a convergence line is going to move through a field of cumulus clouds in an environment that does not have a strong cap. - forecast intensification if a convergence line is going to intersect an existing cell. - forecast initiation if two boundaries are forecast to collide and a strong cap is absent The preferred method to implement these rules would have been by integrating them into the BJANC which could then have been integrated into Niwot for at least the first hour forecast. However, as the B08FDP approached it was apparent that there would not be sufficient human power and time to automate the above rules into BJANC and Niwot. Also there was insufficient resources and time to implement the rules into TIFS. Thus it was left that the human would need to play an aggressive role in the real-time forecasting process, possibly

77
entering human changes into TIFS. Also entering the B08FDP there was considerable uncertainty in how well Niwot would perform because the WRF model did not have the ability to assimilate radar data. However, it was felt that the experience to be gained by working closely with other FDP teams and Beijing forecasters would be worth the uncertainty in the quality of the model products for blending purposes. We were also greatly interested in learning the extent that TIFS would be able to automatically integrate the various system nowcasts and how effective the human would be in modifying the TIFS forecast in order to produce a satisfactory product. Two primary questions we wanted to answer were 1) the quality of nowcasts from automated nowcasting systems, and what is the future role of the forecaster for nowcasting?
3 Implementation
Niwot was implemented for the B08FDP with the following capabilities. Products – Niwot produced 1, 2, 3, 4, 5, and 6 hour radar reflectivity forecasts on a 1 km grid over a 500 km x 500 km domain centered on Beijing which will be called the forecast area. Four types of reflectivity forecasts were produced each hour one by the numerical model, the second by radar echo extrapolation, the third by blending and the fourth human modified. Numerical model – A 3DVAR version of a 3 km WRF was implemented for the B08FDP. The numerical model ingest radiosondes, profiler winds, GPS water vapor and mesonetwork surface station data from around Beijing. Echo Extrapolation – A radar reflectivity mosaic was prepared from the four radars surrounding Beijing (BJRS, TJRS, SJZRS, and ZBRC). Ground clutter was removed from the radars using an NCAR system called the Radar Echo Classifier (REC). A height of 2.5 km was selected for echo extrapolation and verification. Spotty ground clutter was frequently present around the C-band radar (ZBRC) which degraded the forecasts†. Using a modified version of TITAN an area extrapolation technique was used for extrapolating the radar echoes. Echo motion was based on cross correlating time adjacent ( 6 min separation) radar mosaics. Typically this meant that large systems like squall lines would be extrapolated too slowly and in a direction to far left. A correction algorithm was in place to identify line features and extrapolate them further to the right then indicated by the cross correlation vectors. However this only partially corrected for the problem. An extrapolation version of MAPLE was tested during the Trial period but it tended to give unrealistic long skinny echo patterns for the 5 and 6 hour forecast periods.
† Verification statistics that do not remove these clutter echoes will be significantly biased because of their frequency of occurrence rather than their area of coverage. The clutter from ZBRC is much worse than any other radar when CAPPIS are prepared relative to sea level rather than above ground level. ZBRC is at 1500 m where the other radars are close to sea level. The CAPPIS used by Niwot were above sea level thus leaving spotty clutter particularly in far northwest portion of the B08FDP forecast area
78
Blending procedure – The primary assumption used in the Beijing version of Niwot was that the location of the precipitation was best forecast by radar echo extrapolation and the numerical model provided skill in forecasting changes in the extent of the precipitation. Therefore if radar echo >35 dBZ appears at the forecast issue time, then the forecast is based on the extrapolated radar echo location and the area of the extrapolated echo is increased or decreased based on the fractional change in model forecast area. For example if the model forecast the area of echo over the forecast domain was to increase by 20% then the area of the extrapolated echo was increased uniformly in all directions by 20%. If no radar echo >35 dBZ appears at the forecast issue time and NWP forecasts echo, then the NWP forecast is used as the forecast. In addition, Niwot allows a manual modification of the automated blended forecast. The forecaster could select locations for modifying by drawing polygons and then requesting within each polygon one of the following options a) model only, b) extrapolation only, c) grow or dissipate the echo a select amount and d) manually insert a radar echo.
4. Some B08FDP results
Niwot began producing nowcasts on a routine basis on August 1. From August 1-24 an NCAR person was available from roughly 01-10 UTC to make modifications to the automatically generated nowcasts. However, a variety of interruptions meant there were many hours within this period where the human was not available to modify the forecasts. From August 8 through August 14 it was discovered that Niwot was not ingesting the correct model forecasts. This occurred when the model forecast length was unknowing increased from 24 to 48 hours. This resulted in the 24-48 hour forecasts being used instead of the 0-24. Unfortunately this period was when the majority of rain fell in the forecast area, thus limiting the overall evaluation of the model. However it is felt there was sufficient good data to obtain a general evaluation of the model. As will be discussed below the numerical model forecasts during the B08FDP were found to have very little skill thus significantly reducing their use in Niwot for forecasting the trend in the size of the extrapolated echoes or forecasting storm initiation. The reason for the low skill is unknown but may at least be partially because the WRF was not yet capable of assimilating high resolution radar data. The earlier more positive experiment with Niwot in the U.S. suggested radar data assimilation was critical to obtaining useful numerical model forecasts. Figure 1 is a time plot for the periods Aug 1 thru 7 and Aug 15-24 showing the amount of area covered by echo >35 dBZ for the 500 x 500 km forecast area‡. The brown curve is the numerical model forecast for 6 hours into the future. Because of the 2 hour latency in receiving the model forecasts and the fact the model recycles every 3 hours, the actual model forecast that was used for a forecast 6 hours in the future varied between 9 and 11 hours from the initiation time of the model. From Fig 1 it is apparent that during the first week of the FDP the model often under forecast the amount of area >35 dBZ. While it over forecast the precipitation during the later part of the period (Fig 1b). Figure 2 is a time plot for the same time periods (Aug 1-7 and Aug 15-24) as Fig 1 showing the
‡ The period Aug 8-14 was excluded because of the error in the model forecast times discussed above.
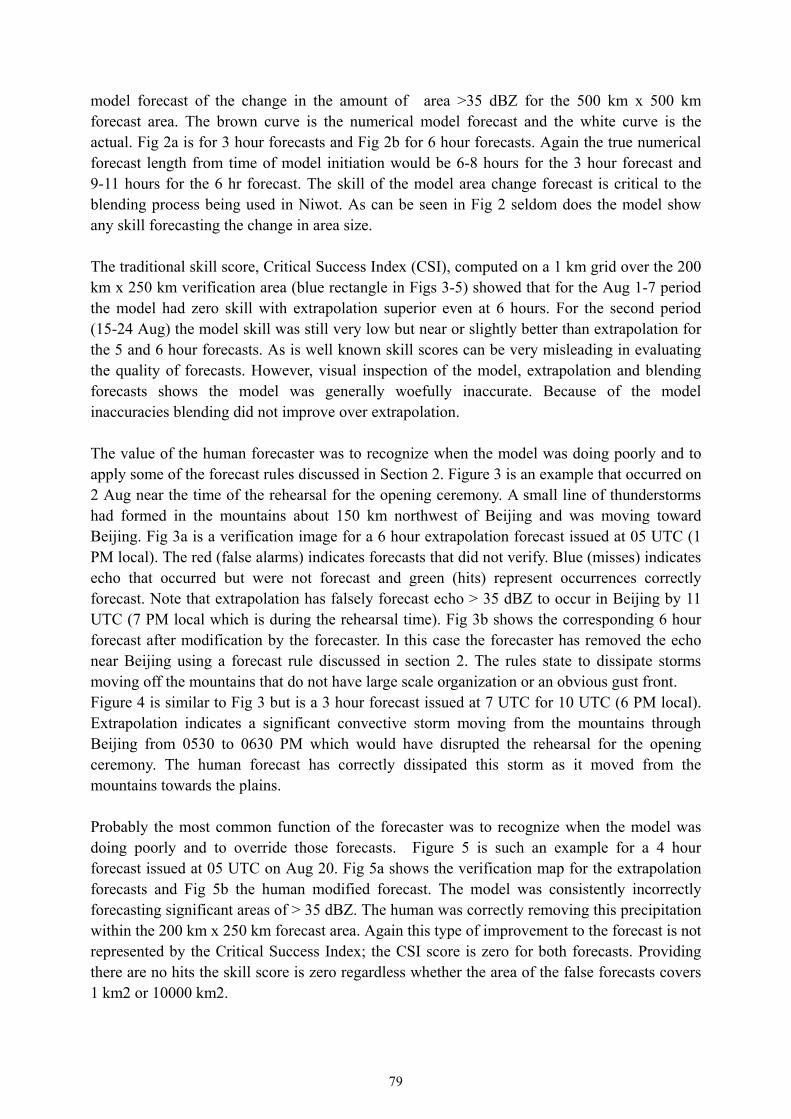
79
model forecast of the change in the amount of area >35 dBZ for the 500 km x 500 km forecast area. The brown curve is the numerical model forecast and the white curve is the actual. Fig 2a is for 3 hour forecasts and Fig 2b for 6 hour forecasts. Again the true numerical forecast length from time of model initiation would be 6-8 hours for the 3 hour forecast and 9-11 hours for the 6 hr forecast. The skill of the model area change forecast is critical to the blending process being used in Niwot. As can be seen in Fig 2 seldom does the model show any skill forecasting the change in area size. The traditional skill score, Critical Success Index (CSI), computed on a 1 km grid over the 200 km x 250 km verification area (blue rectangle in Figs 3-5) showed that for the Aug 1-7 period the model had zero skill with extrapolation superior even at 6 hours. For the second period (15-24 Aug) the model skill was still very low but near or slightly better than extrapolation for the 5 and 6 hour forecasts. As is well known skill scores can be very misleading in evaluating the quality of forecasts. However, visual inspection of the model, extrapolation and blending forecasts shows the model was generally woefully inaccurate. Because of the model inaccuracies blending did not improve over extrapolation. The value of the human forecaster was to recognize when the model was doing poorly and to apply some of the forecast rules discussed in Section 2. Figure 3 is an example that occurred on 2 Aug near the time of the rehearsal for the opening ceremony. A small line of thunderstorms had formed in the mountains about 150 km northwest of Beijing and was moving toward Beijing. Fig 3a is a verification image for a 6 hour extrapolation forecast issued at 05 UTC (1 PM local). The red (false alarms) indicates forecasts that did not verify. Blue (misses) indicates echo that occurred but were not forecast and green (hits) represent occurrences correctly forecast. Note that extrapolation has falsely forecast echo > 35 dBZ to occur in Beijing by 11 UTC (7 PM local which is during the rehearsal time). Fig 3b shows the corresponding 6 hour forecast after modification by the forecaster. In this case the forecaster has removed the echo near Beijing using a forecast rule discussed in section 2. The rules state to dissipate storms moving off the mountains that do not have large scale organization or an obvious gust front. Figure 4 is similar to Fig 3 but is a 3 hour forecast issued at 7 UTC for 10 UTC (6 PM local). Extrapolation indicates a significant convective storm moving from the mountains through Beijing from 0530 to 0630 PM which would have disrupted the rehearsal for the opening ceremony. The human forecast has correctly dissipated this storm as it moved from the mountains towards the plains. Probably the most common function of the forecaster was to recognize when the model was doing poorly and to override those forecasts. Figure 5 is such an example for a 4 hour forecast issued at 05 UTC on Aug 20. Fig 5a shows the verification map for the extrapolation forecasts and Fig 5b the human modified forecast. The model was consistently incorrectly forecasting significant areas of > 35 dBZ. The human was correctly removing this precipitation within the 200 km x 250 km forecast area. Again this type of improvement to the forecast is not represented by the Critical Success Index; the CSI score is zero for both forecasts. Providing there are no hits the skill score is zero regardless whether the area of the false forecasts covers 1 km2 or 10000 km2.

80
5.Concluding remarks
The B08FDP was very successful in that it brought together once again an international team dedicated to improving very short period forecasts of convective precipitation. It highlighted the difficulty of making high resolution convective storm forecasts and the existing unfilled need for such forecasts. It helped point out that nowcasting is still in its infancy and that high resolution observations are essential. There was some sentiment at the nowcasting conference in Toulouse France in 2005 that numerical modeling alone would be able to provide the required accuracy for the nowcasting time period within a few years of the conference. The B08FDP demonstrated this is a very optimistic prediction that will probably not be realized for many more years in the future. The following are the authors impressions from the B08FDP and are not based on careful verification which in its self can be very misleading. Extrapolation forecasts were not suffice even for 1 hour forecasts because of the significant amount of initiation, growth and decay that occurs in very short time periods particularly when trying to forecast on the scale of a metropolitan area. Beijing’s location near the foot of a mountain range no doubt adds to the difficulty of extrapolation forecasts. Frequently the various FDP nowcasting systems produced very different extrapolation forecasts which complicated how to handle in TIFS. The differences in the extrapolations were a surprise in that radar extrapolation techniques have been under development for more than 50 years. This difference between systems is worthy of additional studies. Numerical modeling forecasts from all the systems were poor and provide only marginal useful guidance even for the six hour forecast period. It would seem that we are still many years from numerical models being sufficiently accurate for forecasting convective precipitation on short time scales and small spatial scales. Because of low model accuracy the blending techniques were not better than extapolation. However, in spite of the accuracy problems with the individual nowcasting systems the forecasts provided to the Olympic venues were generally accurate and useful. This was because forecasters examining high resolution observations and automated forecast products can use their physical reasoning and pattern recognition capabilities to assess data quality, evaluate automated forecast material and apply broad meteorological reasoning to formulate forecasts superior to the automated forecasts. For future FDP’s it would be desirable that following the Trial period a careful examination be conducted of the strengths and weaknesses of individual nowcasting systems for specific weather phenomena and weather situations. Using this information optimum automated procedures could then be developed for integrating the nowcasting systems to produce a consensus superior forecast. This was the plan for the B08FDP using TIFS as the integrating system. However, there was insufficient time and human power to accomplish. For the foreseeable future it is apparent that the best way to improve the zero to three hour forecasts would be via an expert system; the BJANC is such a system. However it requires a development period to tune the forecast rules to the available observation network, local

81
climatology and available numerical models. The human, for some time, will be an integral part of a nowcasting system. Their activities should include identifying and entering convergence lines into the system and adjusting the overall sensitivities for convective storm initiation. Improvement for the forecast period beyond 3 hours will be very dependent on improved high resolution numerical models that assimilate high resolution data.
Fig 1b. Same as Fig 1a except for the period Aug 15 through Aug 24.
Fig 1a. Time line of the area (km2) with reflectivity’s great than 35 dBZ from 1 Aug through 7 Aug 2008 for the B08FDP 500 km x 500 km forecast area. The white curve is the actual and brown curve is the 6 hour numerical model forecast (see text for precise meaning of 6 hour forecast.).
Fig 2a. Time line of the change in area (km2) greater 35 dBZ for a 3 hour forecast from Aug 1 through Aug 7, 2009 for the B08FDP 500 km x 500 km forecast area. The white curve is the actual area size change in 3 hours and brown curve is the 3 hour numerical model forecast (see text for precise meaning of 3 hour numerical model forecast.).

82
Fig 2b. Sane as Fig 2a except for 6 hour forecast.
Fig 2c. Same as Fig 2a except for the time period Aug 15 through Aug 24.
Fig 2d. Same as Fig 2c except for 6 hour forecast.

83
Fig 3. Verification map of 6 hour forecasts (issued at 05 UTC) of radar reflectivity > 35 dBZ verifying at 11 UTC on 2 Aug 2008. Red are forecast areas of >35 dBZ that did not occur and blue are areas where 35 dBZ did occur but were not forecast. Green would represent correct forecasts of >35 dBZ if they had occurred. The blue rectangle is the 200 km x 250 km B08FDP forecast area. The blue rings in the center represent the Beijing ring roads. a) extrapolation forecast and b) human modified forecast. Note both forecasts have a CSI score of zero. No precipitation occurred within Beijing as all storms dissipated before moving off the mountains to the north and west.
a) extrapolation b) human
Fig 4. Verification map similar to Fig 3 for 3 hour forecasts (issued at 07 UTC) verifying at 10 UTC. a) extrapolation forecast and b) human modified forecast. Again the human forecaster has correctly removed the extrapolation forecast for echo > 35 dBZ in the vicinity of Beijing. CSI score for both forecasts is still zero.
a) extrapolation b) human
Fig 5. Verification map similar to Figs 3 and 4 for 4 hour forecasts of radar echo >35 dBZ. Forecast was issued Aug 20 at 05 UTC. a) model forecast and b) human forecast. The human has correctly removed the model forecast of precipitation within the forecast area.
a) model b) human

84
Summary Report on STEPS
Alan Seed (Centre for Australian Weather and Climate Research, Melbourne, Australia)
1. Introduction of the system STEPS is a system for quantitative radar rainfall estimation and forecasting and is designed to provide quantitative rainfall fields to hydrological applications like flash flood warning systems. The radar rainfall estimation algorithms include accounting for topography partially blocking the radar beam, correcting for the vertical profile of reflectivity, identifying and removing non-raining echoes, accounting for the difference between stratiform and convective rain and adjusting the radar estimates towards rain gauge observations in real-time. STEPS uses statistical models for the distribution of rainfall in space and time and the error of the radar rainfall estimation process to generate ensembles of rainfall nowcasts out to a lead time of 90 minutes. These ensembles are used to calculate the probability that the rainfall accumulation will exceed a number of thresholds in the next 60 minutes. STEPS is a development of S-PROG which was one of the participating systems in S2K FDP. Improvements were made to the tracking algorithm used and the system was extended to generate the ensembles and therefore probability products. STEPS was developed in collaboration with the Met Office and this collaboration was a direct result of Met Office and Bureau involvement in S2K FDP STEPS generated hourly accumulations of observed rainfall, forecasts of rainfall accumulation in the next 30,60,90 minutes, and the probability that the rainfall accumulation would exceed 1,2,5,10.20,50 mm in the next 60 minutes. 2. Major tasks and the expected outcomes The first major task was to configure a server at the Bureau to serve as a test for the operational server in Beijing. Samples of the data that would be supplied in real-time were used to test the conversion of the BMB data format to the Bureau format so that the Bureau systems could run un-modified in Beijing. Once the server in Melbourne was running properly the software was transferred to Beijing and the Beijing server was configured. The first trial period was used to test the use of CMA data in real-time and to verify that all the output products were being generated with the correct format. Data from the first trial period were used to customize the radar rainfall estimation algorithms to the conditions in Beijing. Much of this work was performed by Miss YU Hiayan while she visited the Bureau. The second trial period was used to test STEPS using all the radars in the Beijing area, to provide real-time products to the team that was developing the integrated product web page, and to train the forecasters in the use of STEPS products.

85
STEPS ran successfully through the FDP once some timing issues regarding the arrival of the quality controlled radar data had been sorted out. 3. Future development plan Future developments of STEPS include changes to the way rain gauge data are used to calibrate the radar rainfall estimations in real-time. At present a single bias adjustment factor is calculated for the entire rainfall map but this is not suitable when there are large areas in the map with no rain gauge observations so a technique to generate a map of adjustment factors will be developed. The statistical model of the radar rainfall estimation errors will be improved to take into account the effect of increasing error with increasing distance from the radar. The ensembles are generated every 6 minutes and these forecasts are used to calculate the rainfall probabilities. In future the lead time of the ensembles will be increased so that ensembles generated 6 and 12 minutes before the current time can also be used to calculate the rainfall probability.

86
Summary Report on SWIRLS
Linus H.Y. Yeung, W.K. Wong, Philip K.Y. Chan and Edwin S.T. Lai
(Hong Kong Observatory, Hong Kong, China) 1. System Overview Background The nowcasting system of the Hong Kong Observatory (HKO), SWIRLS (Short-range Warning of Intense Rainstorms in Localized Systems), has been in operation since 1999. Its second-generation version (referred to as SWIRLS-2) has been under development and real-time testing in Hong Kong since 2007. To support the Beijing Olympic Games, a special version of SWIRLS-2 was implemented for Beijing and operated during the Beijing 2008 Forecast Demonstration Project (B08FDP) under the World Weather Research Programme of the World Meteorological Organization. It was the first time for HKO to run her nowcasting system in a mid-latitude environment and the B08FDP opportunity provided a new and challenging testing ground for SWIRLS-2. System Design To meet the ever-increasing operational demand in Hong Kong, as well as the additional B08FDP requirements, significant enhancement has been achieved when comparing to the original nowcasting system, which focused primarily on rainstorm and storm track predictions. In essence, SWIRLS-2 now comprises a family of nowcasting sub-systems, responsible for the ingestion of various types of conventional and remote-sensing observation data, execution of a rich bundle of nowcasting algorithms, as well as product generation, dissemination and visualization via different channels. Apart from some differences in end-user requirements (e.g. no landslide and flood warning in Beijing), the two systems implemented in Hong Kong and Beijing are essentially the same. Table I summarizes the computational requirements for running the various sub-systems of SWIRLS-2. Functionality During the B08FDP intensive operation period (IOP), viz. 1-25 August 2008, the major functions of SWIRLS-2 included: (i) quantitative precipitation estimation (QPE); (ii) radar-echo tracking; (iii) quantitative precipitation forecast (QPF); (iv) atmospheric stability analysis; (v) severe weather detection and nowcasting; (vi) storm-cell identification and tracking; (vii) rapidly updating atmospheric analysis; (viii) very-short range non-hydrostatic modeling of the atmosphere; (ix) probabilistic representation of nowcast uncertainties; (x) extraction and condensation of severe weather alerts; and (xi) interactive visualization of nowcast input/output data. Products Major SWIRLS-2 products can be classified into four types according to the nature of weather information they convey, namely QPE/QPF, radar tracking, severe weather, NWP, as well as observations. The last category is produced mainly to facilitate forecasters or developers in monitoring the current weather situation and for eyeball verification of the nowcasts from SWIRLS. Table II summarizes the product suite of SWIRLS-2 for B08FDP. To meet the B08FDP requirements, a selected set of products were output in B08FDP netCDF and XML formats, in full compliance with the specifications laid down by the forecast verification

87
working group. All nowcast products are updated every 6 minutes, in synchronization with the radar scanning schedule. Typical time latency is about 12 minutes with respect to the start times of radar scans. 2. Goals and Expectations The original design objective of SWIRLS focused on QPE/QPF and its applications to rainstorms and other related hazards, such as flooding and landslide, in Hong Kong. Based on radar extrapolation technique alone, the maximum forecast range was 3 hours. As rainstorm-related warnings affect many social and economic activities, there has been an increasing demand from decision makers on lengthening the lead time of such warnings. Moreover, other high-impact weather phenomena associated with intense thunderstorms, such as hail and severe wind gusts, have also emerged as hazards of significant concerns. These phenomena are notoriously difficult to predict owing to their transient and localized characteristics. Through advanced radar analysis techniques and the use of latest data assimilation and numerical modeling systems, an enhancement project for SWIRLS was initiated. The primary goal was to ingest and analyze new observation types in a rapid-update cycle (RUC) fashion to assist forecasters in identifying and predicting severe weather events within a time frame of about one hour. The secondary goal was to lengthen the QPF range up to 6 hours by merging information from NWP models. Participation in B08FDP, in particular with on-site tests and operation in Beijing, was expected to bring additional benefits to the SWIRLS enhancement project because: (i) the results would also serve to benchmark the enhanced capability and functionality of SWIRLS against other state-of-the-art nowcasting systems in the world; and (ii) the activities would facilitate exchange of nowcasting technology and experiences, especially on the operation of severe weather warnings with other participating systems. 3. Implementation Assessment (A) Overall Assessment An enhanced SWIRLS was developed according to the design targets and most of the expectations mentioned in Section 2 were realized. In particular, the QPF and storm track forecasts from SWIRLS were benchmarked. However, the 6-hour QPF, lightning and severe squalls nowcasts turned out to be products unique of SWIRLS, and hence results could not be compared to other participating systems through the real-time forecast verification (RTFV) system of B08FDP. On top of the planned targets, the followings were some “surprise” side-benefits: (i) the turn-around time for the original 1-hour update cycle of the nowcast-NWP blending sub-system was enhanced to 6 minutes; (ii) as a result of (i), probabilistic nowcast products using a time-lagged ensemble approach, became feasible; (iii) a new multi-scale echo-tracking method was found to be a versatile approach and proved to be applicable to storm-cell track forecasts; (iv) implementation of a permanent storm-cell ID assignment scheme to meet the requirement of the RTFV system; and (v) development of geographical information system (GIS) based nowcast products, one of which was already transferred back and launched in Hong Kong as the first public nowcast product in Hong Kong. HKO also participated in the two FDP training workshops held in April 2007 and July 2008. As an integral part of the training, a special case simulator was set up as an interface for trainees to gain hands-on experience. Such training workshops were also important from a

88
research and development point of view. Through direct interactions among the system developers, product designers and end users, HKO could learn more about the actual needs and requirements from the major user group, i.e. the local forecasters responsible for the prediction of local severe weather events. By translating the user feedbacks into system/product enhancement priorities and having included this “re-engineering” step in the implementation process, we ensured that customer-centric nowcast products would be tailor-made, e.g. the design of probability thresholds and alerting criteria in SPIDASS (SWIRLS Panel for Integrated Display of Alerts on Severe Storms), a popular and proven interface used effectively by forecasters during the actual operation period. Developer-forecaster interaction also fostered deeper understanding on the merits and limitations inherent to different nowcast algorithms. (B) Scientific & Technological Advancements SWIRLS-2 embraces new nowcasting techniques such as: (a) blending and combined use of radar-based nowcast and high-resolution NWP model analysis and forecast; (b) conceptual model-based detection and nowcasting of high-impact weathers including lightning, severe squalls and hail; (c) a grid-based, multi-scale and robust storm-tracking method; and (d) probabilistic representation of nowcast uncertainties arising from storm tracking, growth and decay. To support the operations of the above nowcasting sub-systems, a wide variety of forecasting tools and algorithms were employed. In particular, a NWP model based on the operational non-hydrostatic model (NHM) of the Japan Meteorological Agency (JMA), configured at 5 km resolution covering about 750×750 km2 around Beijing area, was used to simulate the growth and decay of precipitation in the 6-hour nowcast period. NHM was initialized through a two-stage data assimilation procedure, namely the retrieval of hydrometeor information using LAPS § and the subsequent 3-dimensional variational data assimilation system called JNoVA-3DVAR. All available observation data, including radar, satellite and AWS, etc, were ingested by the data analysis systems to capture the latest atmospheric state in an hourly RUC. JMA’s generous offer of its full resolution (20-km) global model data provided the lateral boundary conditions for running NHM. A new technique called “phase correction” was implemented to rectify the timing or location errors of model predicted rainbands before such information is blended with radar-based rainfall nowcast. The blending technique itself is non-trivial, requiring careful treatment of the uncertainties involved and a smart weighting between the two pieces of rainfall information at different forecast ranges. The sub-system to handle this hot issue was created under RAPIDS (Rainstorm Analysis and Prediction Integrated Data Processing System). Fig. 1 shows an example of RAPIDS forecast for 14 August 2008, demonstrating the usefulness of blending NWP rainfall information to supplement the radar-based nowcast over a relatively long period of 3 hours. Even with the blending algorithm to combine the best of the two QPFs, there remain large errors, especially in the long lead time (3-6 hours) or heavy rain regime. To properly represent the inherent uncertainties, a probabilistic approach was adopted for long lead time QPF. In contrast to a physically or stochastically perturbed ensemble of possible rainfall forecasts, which could be computationally expensive to operate, RAPIDS takes advantage of
§ LAPS stands for the Local Analysis and Prediction System developed by the former Forecast Systems Laboratory of the National Oceanic and Atmospheric Administration, USA.

89
the readily available “perturbations” among rainfall forecasts generated in previous update cycles and estimates the probability of precipitation (PoP) based on a time-lagged ensemble approach with exponential weighting factors. To aid the detection of severe weather and their subsequent nowcasts with useful lead times, SWIRLS-2 uses various conceptual models to help select and extract the minimal and yet most critical information. To reduce the necessary computation to an affordable level, the conceptual models adopted are all kept as simple as possible. For example, the sub-system for forecasting cloud-to-ground (CG) lightning initiation DELITE (Detection of cloud Electrification and Lightning based on Isothermal Thunderstorm Echoes) makes use of the chief precursors associated with an underlying conceptual model of an electrifying cumulus cloud with its main source of lightning located in isothermal layers above the freezing level, with typical charge carriers in the form of ice or graupel which can be detected as radar echoes when wet. To be able to retrieve echoes at constant temperature level, the detailed thermal structure of the troposphere must be known in near real-time and such atmosphere analysis, hence isothermal echoes, was made possible by using the LAPS analysis data. For the assessment of lightning threat at a longer lead time, a sub-zero isothermal reflectivity field is advected forward in time up to 3 hours. Assuming that exceedance of isothermal reflectivity over some threshold signals likely occurrence of lightning, the probability of lightning (PoL) is estimated from a time-lagged ensemble of forecast isothermal reflectivity fields in a way similar to the PoP algorithm. A similar sub-system BLAAST (Buoyancy contribution and Loading effect of rain water to Air parcel Acceleration in Squally Thunderstorms) for downburst/squalls nowcasting was also developed. The conceptual model adopted here refers to the descending forces which create a downburst, namely the combined effect of negative buoyancy as a result of evaporative cooling of falling rain drops and the water loading effect on an air parcel. The latter effect manifested itself under radar surveillance as the vertically integrated liquid water, a quantity readily available from typical radar processing software. The conceptual model behind the hail nowcasting sub-system BRINGO (Buoyancy-supported Rimed Ice Nugget and Graupel Overhang) is also kept simple. Essentially, the algorithm refers to the automatic detection of overhanging radar echoes, typically found in a hailstorm as a result of strong inflow and buoyancy which sustains the riming process for ice or graupel to aggregate. Fig. 2 shows a severe weather map generated in real-time at 12:18 pm on the stormy day of 14 August 2008, in which all four types of high-impact weather threats, namely rainstorm, lightning, downburst/squalls and hail, were forecast and represented as ellipses of different colours. For severe weather hazards identified, the next crucial step is to predict their future movements so as to determine the threat areas. In contrast to other cell-oriented approaches, SWIRLS-2 obtains the forecast movement (next 30 or 60 min) of storm cells from the MOVA (Multi-scale Optical flow by Variational Analysis) echo-motion vector field at the cell centroid location. In short, a gridded echo-motion field is retrieved from successive reflectivity fields by solving the optical flow equation using variational minimization technique. A multi-level cascade computation is adopted so that echo-motion field at different spatial scales can be obtained subject to prescribed constraint like smoothness of motion vectors. In this connection, the motion fields at different scales or cascade levels can be applied to track storm cells or individual reflectivity pixels. Compared to the original algorithm used in GTrack (the storm-cell tracker of SWIRLS), which determines a cell’s future motion by extrapolating the latest 6-min displacement vector of the cell centroid (similar to the TITAN approach in two dimensions), the new method of MOVA has proven to be superior insofar as robustness and location errors are concerned.

90
With a turn-around time of six minutes, it is almost impossible for the users to digest all the available nowcast data and extract the most important messages in support of weather warnings or other related decision makings. To help forecasters or decision makers to absorb and appreciate the vast amount of information processed, SPIDASS (the user interface of SWIRLS-2) extracts and presents the most critical alerting messages according to local warning needs and triggering criteria. To ensure that such alerts could catch the eyes of the users, all alerting signals are symbolized, vividly colour-coded, rendered compactly as rolling time series and displayed on a dedicated web page. At the service front, visual impact and user-friendly products are of paramount importance where the general public is concerned. During the development phase of B08FDP, the Keyhole Markup Language (KML) standard for encoding GIS (Geographic Information System) data and powerful 4D visualization engines such as the Google Earth have emerged. The usefulness and popularity of KML can be inferred from its quick adoption by the Open Geospatial Consortium as an open standard in April 2008. The timely embracement of KML by SWIRLS-2 enabled the successfully development of two pilot nowcast products, namely GIS-enabled forecast rainfall map and 3D lightning location display. One of these fruitful outcomes was applied in Hong Kong to render the new “Rainfall Nowcast for the Pearl River Delta Region” product, the first of its kind launched in October 2008 (URL at http://www.weather.gov.hk/nowcast/prd/). With this product, users can easily zoom-in, zoom-out, configure panoramic view and animate the forecast maps of rainfall distribution. Such value-added operations enable users to concentrate on their own needs (e.g. an estimate on the rainfall amount that can be expected in any neighbourhood of interest) while keeping the big picture in mind (e.g. upstream spatial coverage and the movement trends of rain areas) at the same time. (C) Lessons Learnt The implementation process and algorithm adaptation of the Beijing data turned out to be more difficult than expected. Listed below were the major challenges in the full operation of SWIRLS-2 during the trials and the Olympic operation: (i) the initially asynchronous nature of the radars in and around Beijing; (ii) the data quality of the raw radar reflectivity data; (iii) the unavailability of 5-minute rainfall accumulation; and (iv) the relative “scarcity” of the raingauge network in and around Beijing. As the first two problems affected all nowcasting systems, they were discussed in depth during various FDP meetings and were efficiently solved by colleagues from the China Meteorological Administration (CMA) and the Beijing Meteorological Bureau (BMB) before the start of the Olympic Games. Apart from some system malfunctioning and erroneous products during the trials in 2006 and 2007, these two issues did not constitute any obstacles during the Olympic operation in 2008. Issues in (iii) and (iv) were perhaps unique of SWIRLS because of the dynamic approach taken by SWIRLS in calibrating the Marshall-Palmer Z-R conversion formula. In its original implementation for Hong Kong, the parameters a and b in bRaZ ⋅= were treated as adjustable calibration parameters, the fitted values of which were determined every 5 minutes using the latest available 5-min rainfall accumulations (taken to reflect the rainfall rates at the surface) registered by raingauges and the radar reflectivity data retrieved at 2-km altitude. In each calibration, a linear regression analysis between the logarithms of rainfall rate (denoted as dBG) and reflectivity (expressed in dBZ) was carried out to determine the fitting parameters a

91
and b. For the above algorithm to work effectively, two pre-requisites are: (a) 5-min rainfall accumulation data is routinely available, and (b) sufficiently large number of (dBG, dBZ) data pairs are present to ensure a statistically reliable linear regression analysis. For (a), since only a running 60-min rainfall accumulation was provided in the official data server, the required 5-min rainfall issue was ultimately settled by modifying the data ingestion routine of SWIRLS to calculate the difference between two consecutive 60-min rainfall accumulations (updated times separated by 5 min). The modified scheme worked quite smoothly during the Olympic operation in 2008. However, it turned out that pre-requisite (b) was not easy to meet. From the 2007 trial cases, it was found that the spatial extent of most rainbands affecting Beijing were not widespread enough to cover a significant number of raingauges in the given network, especially when the rainbands were still lying beyond the Fifth Ring Road where raingauges were relatively sparse. The consequence was that at each update time, only a handful of (dBG, dBZ) data pairs were available. In most cases, even the cumulative number of data points for an entire rain event was well below requirement, nullifying any reliable least-square fit. The final resolution to the problem was: (i) lower the minimum number of data pairs required for linear regression analysis to 100; and (ii) resort to a “climatological” set of (a, b) parameters prepared by pooling all the rainfall information obtained in the 2007 trial. Despite such rectifications, real-time experience during the Olympic operation indicated that the dynamic calibration was not activated in most cases and “climatological” values were used instead. Judging from the forecast verification results (the quantile-quantile plots from RTFV refer), the radar-based QPF of SWIRLS was generally under-predicting, and the “climatological” values adopted (a=864, b=1.13) could well be sub-optimal. (D) Contributions From the perspective of SWIRLS, the following achievements and demonstrations may be considered as contributions to B08FDP and the nowcasting community at large:
(i) feasibility and usefulness of incorporating an hourly-updating NWP model in the nowcasting routines;
(ii) effectiveness of using LAPS as a radar data pre-processing step prior to the initialization and data assimilation of non-hydrostatic model;
(iii) usefulness of the nowcast-NWP blending approach for QPF; (iv) conceptual model-based CG lightning initiation and severe squalls nowcasts could
be made with sufficient lead times for forecasters to issue relevant warnings; (v) apart from the traditional cell-based storm tracking technique (e.g. TITAN),
multi-scale grid-based approach of MOVA could be equally accurate with added robustness;
(vi) apart from dynamical or poor man ensemble approaches, the time-lagged ensemble technique was a viable and economical approach in producing probabilistic nowcasts;
(vii) vast amount of nowcast/observation information produced every 6 minutes could be productively summarized into a single web page of SPIDASS for ease of reference by forecasters; and
(viii) feasibility and effectiveness of KML-based nowcast products for value-added and user-friendly visualization using freely available GIS software.

92
4. Future Plans In the near future, the full functionality of SWIRLS-2 will be implemented at HKO. SWIRLS-2 will also participate in the WENS (World EXPO Nowcasting Services) demonstration project in support of the Shanghai 2010 EXPO. In terms of science and technology development, nowcast-NWP merging and probabilistic QPF will be the main thrusts in the future development of SWIRLS. Several research areas were considered worthy of exploration, including: (a) alternative approaches to address nowcast uncertainties; (b) storm-scale model analysis for the underlying triggers of severe weather events; (c) NWP-based severe weather nowcasting and merging techniques; (d) applications of other remote-sensing data, e.g. dual-polarization radar and GPS/PWV; (e) QPE/QPF applications in tropical cyclone cases; and (f) GIS technology to deliver nowcast products effectively in operational nowcast service. 5. Concluding Remarks The enthusiasm of all participants and the synergy of all participating systems ensured that the mission of B08FDP, viz. demonstrating to the world the capabilities and usefulness of the state-of-the-art nowcasting systems in weather-sensitive events such as the Beijing Olympic, was fulfilled. Tribute should also go to the local organizers, namely CMA and BMB. Without their outstanding effort, thoughtful arrangement, attention to details, and perhaps most important of all, their dedication to a forecast service delivery for the Beijing Olympic, the whole demonstration project could not have been accomplished so successfully. Any future international collaborative nowcasting effort on a similar scale should make reference to B08FDP, in particular on aspects such as radar synchronization, standardization of observation data and nowcast products, as well as expert consensus and forecaster interaction on the nowcasting strategy of the day. For decision makers’ risk assessment, probabilistic products will continue to play an indispensible role in conveying forecast uncertainty. Again, B08FDP can provide invaluable reference on the practical ways to generate probabilistic nowcasts. In parallel with the FDP, there was also a RDP (research and development project) component on NWP. With NWP model becoming an integral part in the nowcasting routines, collaboration between nowcasters and modelers is likely to become even more important for future international cooperative effort on nowcasting. Beijing Olympic’s slogan was “One World, One Dream”. Apart from the exciting events and spectacular successes achieved by the athletes on the tracks and fields, the ambitious vision was fully realized and put into action in one small room with glass walls on the 10th floor of the BMB main building. We all came from different parts of the world, but within that B08FDP operation centre, it felt “one world” and we definitely shared “one dream”! Reference Yeung, Linus H.Y., Edwin S.T. Lai & Philip K.Y. Chan, 2008 : Thunderstorm Downburst and Radar-based
Nowcasting of Squalls, The Fifth European Conference on Radar in Meteorology and Hydrology, Helsinki, Finland 30 June - 4 July 2008.
Saito K., J. Ishida, K. Aranami, T. Hara, T. Segawa, M. Narita and Y. Honda, 2007 : Nonhydrostatic atmospheric models and operational development at JMA. J. Meteor. Soc. Japan, 85B, 271-304.
Yeung, Linus H.Y., Edwin S.T. Lai & Samson K.S. Chiu, 2007 : Lightning Initiation and Intensity Nowcasting Based on Isothermal Radar Reflectivity - A Conceptual Model, The 33rd International Conference on Radar Meteorology, Cairns, Australia, 6-10 August 2007.
Cheung, P.Y., M.C. Wong & H.Y. Yeung, 2006 : Application of Rainstorm Nowcast to Real-time Warning of Landslide Hazards in Hong Kong, WMO PWS Workshop on Warnings of Real-Time Hazards by Using Nowcasting Technology, Sydney, Australia, 9-13 October 2006.

93
Wong, M.C., S.T. Lai & P.W. Li, 2006 : Applications of Nowcasting Products to Real-time Warning of Hazardous Weather in Hong Kong, WMO PWS Workshop on Warnings of Real-time Hazards by Using Nowcasting Technology, Sydney, Australia, 9-13 October 2006.
Wong, M.C., W.K. Wong, & S.T. Lai , 2006 : From SWIRLS to RAPIDS : Nowcast Applications Development in Hong Kong, WMO PWS Workshop on Warnings of Real-Time Hazards by Using Nowcasting Technology, Sydney, Australia, 9-13 October 2006.
Li, P.W., & E.S.T. Lai, 2004 : Applications of Radar-based Nowcasting Techniques for Mesoscale Weather Forecasting in Hong Kong, Meteorological Applications Vol. 11, pp 253-264, 2004.
Li, P.W., W.K. Wong, K.Y. Chan & Edwin S.T. Lai, 2000 : SWIRLS - An Evolving Nowcasting System, Hong Kong Observatory Technical Note, No.100.
Albers S., J. McGinley, D. Birkenheuer, and J. Smart 1996 : The Local Analysis and Prediction System (LAPS): Analyses of clouds, precipitation, and temperature. Wea. Forecasting, 11, 273-287.
(a)
(b)

94
(c)
Fig. 1 Example of RAPIDS forecast for 14 August 2008: (a) actual 3-hour rainfall accumulation ending at 3:10
p.m., estimated based on raingauge data; (b) SWIRLS radar-based 3-hour rainfall nowcast for nearly the same period (ending at 3:12 p.m.) with an underestimation trend generally seen; (c) the corresponding rainfall forecast from RAPIDS, demonstrating an improvement over heavy rain regions (e.g. near the Olympic Park) made possible by blending in NWP information.

95
Fig. 2 Severe weather map generated in real-time at 12:18 pm on 14 August 2008. Four types of high-impact weather were shown as ellipses in different colours, namely rainstorm in blue, CG lightning in grey, downburst/squalls in red and hail in orange. Solid and dashed lines represent respectively their analyzed and predicted 30-min locations. The swath defined by a solid-dashed ellipse pair is taken as the threat area of the corresponding weather hazard. When threat areas intersect the warning zone (the red rectangle, which encloses all the Olympic venues in Beijing), textual alerting messages are printed near the bottom of the map. According to the information available later in that afternoon in the FDP operation room, all the predicted hazards were actually reported in the next one hour or so.
Table I - Computer Equipment Deployed for B08FDP
Scope Radar-based Nowcast Visualization Hourly RUC
(NHM+3DVAR+LAPS) RAPIDS All
Number of nodes 2 2 13 1
CPU cores per node (3.6 GHz Intel Xeon) 2 2 2 2
36 cores
RAM per node 8 GB 4 GB 54 GB 4 GB 70 GB
Local hard disk 160 GB 1.5 TB 1.5 TB 80 GB 3.2 TB
RAID-5 (Shared storage) 2 TB 2 TB 4.0 TB
Commercial software / development tools
Intel Fortran and C compilers; Sigmet IRIS V8.11.3.2
- Intel Fortran and C compilers Intel Fortran and C compilers; -
Table II — Product Suite of HKO SWIRLS-2 Nowcasting System for B08FDP
Product type Forecast/Analysis element Output
format Spatial
type Spatial resoln
Forecast range
QPF
radar-based rainfall forecast for 3 accumulation periods: 0-1 h 0-2 h 0-3 h
NetCDF (B08FDP) grid 2 km
0-1 h 0-2 h 0-3 h

96
Product type Forecast/Analysis element Output
format Spatial
type Spatial resoln
Forecast range
radar-NWP blended rainfall forecast for 6 accum. periods: 0-1 h 0-2 h
0-6 h
NetCDF (B08FDP) grid 2 km
0-1 h 0-2 h
0-6 h
ibid (visualized on Google Earth)
KML, image ibid ibid ibid
Probability of precipitation (from blended QPF): PoP(≥ 1mm/1h), PoP(≥ 10mm/1h), PoP(≥ 20mm/1h), PoP(≥ 1 mm/3h), PoP(≥ 10 mm/3h), PoP(≥ 20 mm/3h), PoP(≥ 50 mm/3h), PoP(≥ 1 mm/6h), PoP(≥ 10 mm/6h), PoP(≥ 20 mm/6h), PoP(≥ 50 mm/6h)
NetCDF (B08FDP) grid 2 km
0-1 h 0-3 h 0-6 h
radar tracking
storm-cell with reflectivity ≥ 34 dBZ: - permanent cell ID number - analyzed centroid location (lat, lon) - forecast motion vector (bearing, speed) - semi-major axis, semi-minor axis, orientation (bearing) - mean and max reflectivity
XML (B08FDP) cell -- 0-60 min
TREC echo-motion vector field: - accessible via interactive GUI or SWIRLS-2 home page image grid 1 km -
MOVA echo-motion vector field - accessible via SWIRLS-2 home page image grid 0.5 km -
severe weather
4 types of severe weather cells - - rainstorm (category, mean & max rain rate) - lightning (initiation type and severity) - downburst (severity type) - hail (size type) - cell tracks and geo-properties similar to the 34-dBZ storm cells
XML (B08FDP) cell -- 0-30 min
Severe squalls: - maximum possible wind gust from downbursts - anywhere in the “urban” area - covering all sports venues in Beijing
XML (B08FDP) area -- 0-30 min
Probability of lightning threat (CC or CG): PoL(occurrence within 1 h) PoL(occurrence within 2 h) PoL(occurrence within 3 h)
NetCDF (B08FDP) grid 2 km
0-1 h 0-2 h 0-3 h
combined
interactive GUI: - actual and forecast rainfall maps - severe weather map with textual alerts - echo-motion vector map - storm-cell track map - Tephigram and stability indices
image
grid
point
- up to 6 h
SPIDASS: - integrated display of severe weather alerts - customizable warning criteria - presented as time series of colour symbols - includes all severe weather types
HTML, image area -
up to 6 h and past records
NWP
weather maps from NHM: - hourly rainfall accumulations - surface temp, RH, winds, isobars - RH and winds at standard pressure levels - accessible via SWIRLS-2 home page
HTML, image grid 5 km up to
9 h
observation
3D lightning display: - actual lightning locations and altitudes - diff. symbols for lightning types (CC, +CG, –CG) & colours for altitudes - visualized on Google Earth
KML, image 3D 2 km -
FY2C satellite pictures: - IR, VIS, WV channels - accessible via SWIRLS-2 home page
HTML, image grid 1 km -

97
Summary Report on TIFS
John Bally, David Scurrah, Beth Ebert (Centre for Australian Weather and Climate Research, Melbourne, Australia)
1. Introduction and Background The official goals of the FDP include using advanced nowcast systems to support meteorological service delivery to the Beijing ’08 Olympics. The implementation plan for the FDP identified strategies to achieve these goals which included the generation of FDP consensus products in TIFS. These consensus products were available, alongside the individual outputs from all FDP systems to guide the generation of operational forecast and warning products by the BMB. As some of the BMB forecast products were generated using the VIPS system, TIFS was configured to deliver consensus guidance directly to VIPS, as well as generating graphical products displayed on the FDP web site. Consensus products were generated by treating selected products from the component FDP systems as a nowcast “poor man’s” ensemble. Polygons representing areas of high threat from selected types of severe weather were generated by TIFS from the FDP consensus products and passed to VIPS in the nowcast XML format used for the FDP. The thresholds and meaning of these polygons were selected to match the criteria for certain established BMB warning products. These polygons were available in VIPS as editable “threat areas” for BMB forecasters to use as the basis for defining the area covered by some warnings. BMB forecasters could modify these polygons as required before issuing warnings. 2. TIFS consensus chance of wetting rain (2mm / 1hr) products generated during the
FDP The chance of wetting rain product was formed from a “poor man’s ensemble” of forecasts taken from participating FDP systems. The probability of wetting rain was defined as the chance of observing 2mm of accumulated rainfall in 1hr (PoP2). As the FDP systems generally did not produce a native PoP2 forecast, this was estimated by regressing the frequency of observations of at least 2mm / 1hr against the Quantitative Precipitation Forecast (QPF) from each system in a data set generally from the 2007 FDP trial. A logistic regression (see section 3) was used because it provided a reasonably good fit to the data and could be modelled using just a few parameters for calculation on-the-fly within TIFS. The ensemble consensus probability was then just the simple average of the calculated probabilities from each system. The results were good, and possibly better than the individual component systems as is often the case for ensembles. Note that no calibration of the probabilities was attempted. Inspection of the reliability diagram shows systematic under-prediction of most forecast probabilities, which indicates that calibration would most likely have improved the forecasts. The ROC curve shows that the TIFS PoP2 product had excellent discrimination capability, and the results are certainly good enough to provide some validation of the concept. The technique used can readily be adapted to other rainfall rates without any additional data being ingested, by using regression relationships calculated for other thresholds. The product was robust in operations, and by design is tolerant of missing inputs. If used in forecast operations, it would need to be recalibrated of the characteristics of the inputs changed.

98
Example PoP2 product produced by TIFS during the FDP. In this case the ensemble included STEPS, GRAPES, MAPLE, SWIRLS and the BJANC
Reliability of the TIFS PoP2 ensemble forecasts ROC curve for the TIFS PoP2 ensemble forecasts 3. TIFS consensus Rainstorm warning products generated during the FDP The TIFS rainstorm warning products were again based on a poor man’s ensemble of forecasts from PDF systems. In this case the aim was to produce a probability of exceeding the thresholds for the BMB “red” and “orange” rainstorm warnings. In order build in some room for error and increase the Probability of Detection (PoD), it was decided to use 40 and 80 mm in 3 hours respectively as thresholds for these warnings. These are a little lower than the official thresholds for the warnings (50 and 100 mm). BMB rainstorm warnings are based on 3 hour or longer accumulation times. Verification of the 2007 trial indicated that the skill of FDP nowcast systems diminishes rapidly with increasing lead time with little skill remaining in FDP predictions beyond 60 minutes, so although many FDP systems produced 2 and 3 hr leadtime QPF’s these were not used for rainstorm warning products. An alternative approach, which built on the much higher skill of the 60 minute QPF was used, taking the 2 hr observed accumulation as the antecedent rainfall conditioning the

99
catchments. This approach (of course) only provides one hour leadtime, but it was judged that focusing on 1 hour leadtime with significant skill was much more productive that attempting 3 hr leadtime with very little skill. The ensemble rainstorm products produced by TIFS were based on the 2 hour observed rainfall (from STEPS) combined with 60 minute forecasts from a set of FDP systems. The rainfall (R) required to exceed the (3 hr) warning threshold is given by:
R = threshold – 2hr accumulation
Then the probability (P) of achieving this rainfall is estimated by regressing the frequency of observations of at least R mm in 1hr against the QPF from each system in a data set from the 2007 FDP trial. A logistic regression of the form
P(exceeding R) = 1 / (1 + (ec1 * QPFc2)) was used because it provided a reasonably good fit to the data and could be modelled using just a few parameters for calculation on-the-fly within TIFS. This is essentially the same technique used for the calculation of the probability of wetting rain, but with a generally higher threshold calculated on the fly given the amount of rain that had already fallen. The ensemble probability was again just the simple average of the probabilities from each system. Although we originally planned to adjust the system weightings as the FDP progress, it did not prove practical to recalibrate the system during the FDP so the system weightings remained equal throughout.
Of course, the “red” and “orange” rainstorm warnings can also be triggered by rain that has already fallen, so the product included consideration of the 3 hour accumulations (again from STEPS) if they were already sufficient to exceed the warning thresholds. The probability of exceeding the warning thresholds were contoured by TIFS at the 20% and 50% probability levels and passed to VIPS as XMLfiles for direct use by forecasters to guide their warning decisions. The forecasters also had access to the graphic ensemble warning products on the FDP web page.
Example “orange” rainstorm product produced by Contours of 20 and 50% chance of exceeding the

100
TIFS during the FDP. In this case the ensemble included STEPS, GRAPES, MAPLE, SWIRLS, BJANC and CARDS.
threshold for an “orange” rainstorm warning corresponding to the graphic at left.
4. TIFS consensus Thunderstorm Strike probability products generated during the FDP TIFS uses the Thunderstorm Environment Strike Probability Algorithm (THESPA) (Dance et al 2008) to calculate the strike probability from thunderstorms using the modelled error characteristics of forecast thunderstorm tracks. This method accounts for the prediction error by transforming thunderstorm nowcasts into a strike probability, or the probability that a given location will be impacted by a thunderstorm in a given period, based upon a bivariate Gaussian distribution of speed and direction errors. Each FDP tracking system generally detects multiple thunderstorm cells each of which may strike a point of interest. If the probability that a given cell (n) will strike the point is Pn, then the probability of a miss will be 1 - Pn. Cells detected by a given tracker are treated as statistically independent, so the probability that all cells in a given tracker will miss the point is :
Πn (1- Pn)
The total strike probability from all cells in a given tracker is then Total Strike Prob = 1 - Πn (1- Pn)
An ensemble of tracking systems observing a thunderstorm outbreak will contain tracks that are highly correlated, and are treated as alternative observations of the same phenomena. The strike probabilities from all trackers are combined as a simple average to give the ensemble strike probability. Tracks were generally available from TITAN (35, 40 and 45dB) SWIRLS (34dB) and CARDS (45dB), with the reflectivity thresholds for detecting cells being somewhat different in each system. The automated product used the TITAN 35db tracks, SWIRLS and CARDS to generate products every 6 minutes with each radar scan. The FDP expert generating the manual product had a choice between the 3 TITAN thresholds, could optionally include SWIRLS and CARDS and could also manually generate tracks based on NIWOT and VDRAS advice.

101
An example of the automated strike probability forecast, in this case generated from the Titan and Swirls tracks.
All of the strike probability products were uncalibrated, and so it is not surprising to see systematic over-forecasting for forecast probabilities over 0.4 shown in the reliability diagram. Despite this lack of calibration, the automated strke prob forecasts show considerable skill over all events on the ROC curve, again validating the approach taken. One would expect that calibration may improve the skill further.
Reliability of the automated strike probability forecast
ROC of the automated strike probability forecast
When FDP experts were available, manually edited TIFS strike probability products were sometimes created. These incorporated information from real time discussions of the developing situation among FDP experts. They were verified for comparison with the automated product to measure the impact of expert manual input. The manual products often included new storm developments or forecast cell decay, based on guidance input manually from NIWOT and VDRAS. Jim Wilson’s forecast rules were generally applied in the real time forecast process.
An example of the manually edited strike probability forecast, in this case generated from the Swirls and Cards tracks.

102
The manual product was only generated when significant convection was expected, and FDP experts felt that they could add some value to the automated algorithms. There were 60 manual strike probability forecasts generated during the FDP. These were generally the more difficult forecasts, and it is not surprising to see that both the manual and automated strike probability forecasts were less skilful on these events than the automated product when averaged over the whole dataset. The verification also shows that the manual products were better, with FDP experts able to add some value to the algorithms. Again, despite the lack of calibration, both manual and auto forecasts showed quite a lot of skill for the more significant storms.
Reliability of the automated and manual strike probability forecast for events where manual forecasts were done.
ROC of the automated and manual strike probability forecast for events where manual forecasts were done.
TIFS ensemble product summary The table below summarises the FDP generated guidance in support of VIPS based BMB warning products Warning FPD source Product level Threshold Probability of wetting rain
STEPS 60 min QPF
GRAPES 60 min QPF MAPLE 60 min QPF SWIRLS 60 min QPF BJAnc 60 min QPF CARDS 60 min QPF
Polygon calculated on the 50% probability 16, 828 products generated during the FDP
RAINSTORM Rainfields/CARDS 180 min QPE Prob = 0% or 100% Rainfields/STEPS 120 min QPE + 60 min QPF Rainfields/GRAPES 120 min QPE + 60 min QPF Rainfields/MAPLE 120 min QPE + 60 min QPF Rainfields/SWIRLS 120 min QPE + 60 min QPF Rainfields/BJAnc 120 min QPE + 60 min QPF Rainfields/CARDS 120 min QPE + 60 min QPF
weighted average polygons calculated on : possible is >= 20% prob probable is >= 50 % prob 16, 830 products generated during the FDP
LIGHTNING Auto Strike probability
TITAN 35 dBZ tracks to 60 min 60 min strike probability calculated from tracks and

103
SWIRLS tracks Tracks to 60 min CARDS tracks Tracks to 60 min
weighted average formed. Polygon calculated on the 5% probability
THESPA reference : Sandy Dance and Beth Ebert and David Scurrah 2008, “Thunderstorm Strike Probability Nowcasting, a New Algorithm”, Proceedings of the iEMSs Fourth Biennial Meeting: International Congress on Environmental Modelling and Software, Barcelona, Catalonia, pages 1586--1593, uri={http://www.iemss.org/iemss2008/uploads/Main/S17-25-Dance_et_al-IEMSS2008.pdf

104
Summary Report on B08FDP Data Environment
Dongchang Yu, Yubin Wang, Debin Su (Beijing Meteorological Bureau, China Meteorological Administration, Beijing, China)
1. Main Tasks and Expected Targets
The 29th Olympic Games was held in 2008 in Beijing, China. The Olympic weather service was an important basic work. In order to better apply the most advanced forecasting theories and techniques to meteorological operations, and to improve the skills of nowcasting, the Beijing Meteorological Bureau implemented the Beijing 2008 Olympic Games Forecast Demonstration Project under the World Weather Research Program (WWRPB08FDP). Totally 8 short-time nowcasting systems from China, Australia, Canada, Hong Kong China and the United States participated in the project, among which quality and efficient data environment was to ensure successful implementation of the FDP project. Data requirements varied largely from one FDP nowcasting system to another. The FDP project needed very strict criteria for the data acquisition and processing, especially in data specifications, standard formats and relevant contents. The original data environment could not meet the requirements of the FDP system. Therefore, it was required to integrate all specific data requirements for nowcasting and for the FDP participating systems by establishing a new real-time data acquisition and processing system as the dedicated FDP data environment. The key technical issues included: (1) defining the required spatial distribution density of observation stations and the temporal resolution of weather elements to develop an observing network that could satisfy the needs of the FDP project; (2) analyzing the data demands of the FDP project, and establishing a real-time data acquisition and processing system for FDP project to improve the data processing efficiency; (3) unified data management to facilitate the data storage and retrieval; (4) integrating FDP data criteria for all nowcasting systems, and establishing a unified and standardized data platform. Since all systems would be installed in Beijing for local runs, it was needed to build a corresponding network support environment, including local network and remote data access network. Also, assistance was required for localization of all participating systems, i.e. installation, operation, maintenance, etc.
2. Performance Evaluation
In 3 years, the Working Group creatively completed the B08FDP data environment, mainly including a high-speed and easy-to-use FDP network environment, high-resolution and rapid mesoscale data pre-processing system (Hi-MAPS), and B08FDP product collection and dissemination, which provided high-quality local supports for the participating systems and for establishing B08FDP data sets.
2.1 Tasks and targets The B08FDP data environment mainly included B08FDP servers, network system, data processing and collection system, which successfully provided B08FDP data for two system tests and for the Olympic weather services. The servers and network functioned stably, with higher data and product availability (Table 1), standardized data format and quality data sets, for which was recognized by operators of the B08FDP systems.
Table 2-1: Data availability in 2008

105
Data Type Period of the
Olympic Games[1]
Period of the Paralympic
Games[2]
All period of time [3]
AWS 98.82% 98.85% 97.88% Beijing 99.73% 99.93% 99.18% Tianjin 99.66% 99.90% 99.20%
Shijiazhuang 99.90% 99.31% 97.69% Zhangbei 98.77% 98.47% 96.41%
Doppler radar
All 99.52% 99.40% 98.12% Wind profiler 100% 100% 97.40%
Intensified observation[4] 100% 100% 100% Geostationary Met
satellite[5] 746 295 3,245
Lightning positioning[6] 181 67 781 Note: [1] The statistical time was from 00:00 August 8 to 23:59 August 24, 2008; [2] The statistical time was from 00:00 September 6 to 23:59 September 17, 2008; [3] The statistical time was from 00:00 June 25 to 23:59 September 20, 2008; data missing due to equipment tests
and maintenance was not rectified; [4] Intensified observations started on July 1, 2008; [5] Intensified observations stopped on 24 August 2008 (Beijing time); because the satellite entered into the
autumn eclipse from September 5, satellite data in this period were not available, only with the number of recorded files;
[6] Files were generated only when lightning was detected, only the number of files was available.
During the two system tests in the summers of 2006 and 2007 and in the final demonstration stage in the summer of 2008, the Working Group provided well-established local supports for the participating systems, including system installation, operation, maintenance and remote support. On 5 April 2006, the B08FDP data servers and remote access network were opened, and they provided various data samples from 17 April. On 26 June, the real-time raw data from the radar located at the southern suburb of Beijing was provided, and Hong Kong Swirls system was successfully installed and made a trial operation. Subsequently, other data were also gradually made available. In 2007, data from two radars at Zhangbei and Shijiazhuang and from AWSs around Beijing were increased while upper air data in new-format was provided for data applications by the participating systems. In addition, quality-controlled radar data and mosaic data were provided for the research and trial use by the participating systems. During the operational demonstration in 2008, both original and quality-controlled radar raw data were provided simultaneously. In January 2009, the B08FDP remote access was closed.
2.2 Main technical routes and methods 2.2.1 B08FDP server and network system The B08FDP server and network system consists of local data server, product servers, storage system, radar synchronous transmission & data processing server, WEB server, DNS server, time server, network printers, participating system computers, as well as network equipments. As an independent sub-network (172.18.9.0/24), it was linked to the BMB main network and its remote access was achieved through the BMB Internet system, with the bandwidth of each server was 1G bps and that of desktop workstation was 100Mbps. The network structure is showed in Figure 1.

106
Figure 2-1: The Schematic diagram of the B08FDP network and storage connection
The B08FDP had four physical servers and a storage system for related data processing and supportive tasks. Local data server and product & data server were mutually cold backup to each other.
Table 2-2: The configuration of the B08FDP main server and storage system
Type Detailed configuration Use IBM P55A 4*1.9GHz Power 5+, 8G RAM,
2*73GB SCSI Disk, 2*FC HBA, AIX5L V5.3
local data server
IBM P510 2*1.65GHz Power 5+, 4G RAM, 2*73GB SCSI Disk, 2*FC HBA, AIX5L V5.3
product & test data server
HP DL380G5
2*Intel 5130, 4GB RAM, 4*146 SAS Disk, Windows Server 2003
radar synchronization transmission and data processing server
Dawning A620R
2*AMD Opteron 275, 4GB RAM, 1*146GB SCSI Disk, SLES 10
Function server(WEB/DNS/Times)
IBM DS4300
Dual-controller, 14*146GB FC Disk, RAID5, including two logical volumes of 1TB and 750GB for the storage of local data and product & verification data respectively
The range of IP address used by the B08FDP network was from 172.18.9.150 to 172.18.9.210, and its specific distribution is shown as Table 2-3 and 2-4. In order to ensure the stability and security of internet access, the BMB Internet system provided two hot backup lines. Each system could achieve remote access to its own system through pre-registered IP address.
Table 2-3: The IP Address of the Servers Server LAN Address Internet Address
local data server 172.18.9.200 210.75.207.45

107
product & test data server 172.18.9.201 210.75.207.45 radar synchronization server 10.224.97.212 N/A function server 172.18.9.202 N/A
Table 2-4: The IP Address of the Participating Systems System Participant Range of available LAN address Internet address
BJ-ANC BMB 172.18.9.150 - 172.18.9.153 N/A(*) CARDS AES Canada 172.18.9.160 - 172.18.9.161 210.75.207.46 GRAPES CAMS 172.18.9.157 - 172.18.9.159 N/A(*) MAPLE Canada 172.18.9.162 210.75.207.46(*) NIWOT NCAR 172.18.9.154 - 172.18.9.156 N/A(*) RTFV BMRC 172.18.9.183 N/A(*) STEPS BMRC 172.18.9.180 - 172.18.9.182 210.75.207.48 SWIRLS HKO 172.18.9.190 - 172.18.9.199 210.75.207.47 Note (*): [1] GRAPES is run at the CAMS only with a local display terminal. [2] MAPLE and CARDS share the same external network address with the ports of ssh/22, ftp/21 for CARDS and ssh/2222, ftp/2121 for MAPLE. [3] 172.18.9.163-168 are distributed by the DHCP server.
2.2.2 B08FDP data flow
The B08FDP data processing and organization keep the local data server and product server as the core. All data processing and exchange are carried out through these two servers to ensure data consistency and integrity.
Figure 2-3: The flow chart of the B08FDP data processing
Through ftp or scp, local detection data and BJ-RUC products were obtained by the participating systems as well as testing systems, and generated products were sent back to the product server through the ftp or scp; RTFG was accessing data files from the product server; the processed data together with corresponding graphic products were sent back to the product server for dissemination to the forecasting systems and WEB servers. Forecasters could directly view these products through the website, or for product analysis through the VIPS system. Also, experts on the spot could access to the products from the server for further

108
analysis and interactions.
2.2.3 Data collection and processing Data collection and processing system could collect and process, in real time, a wide range of local data needed by all participating systems, and it could receive public and specialized products from the participating systems. At the same time, the system developed a unified and standardized data format. The B08FDP data scope and update frequency are shown in Table 2-5.
Table 2-5: The list of local data sets for the B08FDP participating systems Data type Scope Updated
frequency Format
Doppler radar 4 radars at Beijing, Tianjin, Shijiazhuang and Zhangbei
6 minutes Level II
AWS 106 stations in Beijing and its surroundings
5 minutes NetCDF
Lightning positioning
1 set of SAFIR 3000 (3 stations) real time Text
Wind profiler one set 6 minutes NetCDFIntensified observations
5 stations including Beijing, Zhangjiakou, Xingtai, Taiyuan and Chifeng
6 hours Text
Geostationary satellite
FY2C 30~60 minutes HDF 5
Meso-scale forecast
BJ-RUC system 3 hours NetCDF
Figure 2-4: The distribution map of the observation stations for the
B08FDP
To meet the demands of real-time Nowcasting for high-frequency and timely data and the data requirement of the B08FDP systems, the Working Group expanded and improved the functions of data pre-processing system, developed high-resolution and rapid meso-scale data pre-processing system (Hi-MAPS), and it solved the technical bottlenecks in real-time application of more frequent intensified observations in short-time nowcasting. Hi-MAPS is rapid data collection and processing system based on directory-monitoring and message-driven

109
mechanism, including real-time data collection, transmission, processing, quality control and dissemination from Beijing and its surrounding areas. The system developed a unified data format for local data in compliance with the common international format, and provided the Olympic-oriented nowcasting system in real time with a wide range of local data including quality controlled observations from AWSs, wind profilers, lightning positioning system, Doppler weather radars and geostationary meteorological satellites, and NWP products.
In order to optimize data management and to improve data retrieval efficiency, the standard directory tree was used to manage data files. A number of daily data files under the subdirectories were established to store a variety of data, containing the time information (i.e. year, month, date, hour, minute, second) in the file name to facilitate data discovery. To improve the efficiency of computing resources, B08FDP used Pyinotify technique and information-driven approach to achieve real-time data monitoring, collection, processing and dissemination. It was used to monitor the user-defined data directory, when new data arrives, a “file system change notification message” would be automatically generated, thus the system would find the corresponding data for processing and dissemination. The System did not need to regularly scan the disk, effectively reducing the server load and improving the efficiency of data processing.
2.3 The achievements and benefits 1)Creatively set up the B08FDP data environment, providing high-quality local supports for various participating systems and creating the B08FDP data sets.
2) Established a prototype of real-time data processing system for nowcasting, providing some useful thoughts for R&D of the Chinese nowcasting system.
2.4 The problems and solutions The B08FDP used the data from 4 Doppler radars in Beijing and its surrounding areas, including SA radar in Beijing, Tianjin and Shijiazhuang, and CB radar at Zhangbei. To address radar data quality problems, a special Working Group on data quality was set up under the project. During the system test in 2006, it was found that the sensitivity of Tianjin radar was much lower than that of Beijing radar. Therefore, Beijing Metstar Radar Co., Ltd replaced its hardware, which increased its sensitivity by 7 dBz. Moreover, during the next test and before the final demonstration, field inspections were made on rest 4 radars to ensure the quality of data.
The next problem was synchronized radar observation. Doppler weather radars are currently used RDA computer clock for timing, when 7 radars were networked to carry out unified observations, each radar based on its own RDA clock produced inconsistent scans times, it was difficult to ensure the time consistency when multi-radar 3-D scans. With support of the Metstar Radar, the BMB technicians decided to use GPS time service and relevant radar scan transmission techniques, which solved the synchronization problem. As for time consistency between multiple radars, GPS timing system was set up at the central station. The sophisticated and reliable NTP protocol was adopted to ensure the time synchronization with several radars. In addition, the real-time synchronous technique for Doppler weather radar raw data transmission was used, i.e. after the radial data collection was completed, radar would transmit them to the central station, which would write such information in the radar raw data files at the central station. After each radar scan, radar timing transmission will be completed immediately. By using this approach, in the synchronous network transmission system of 4 radars in Beijing and its neighboring areas, the VCP 21 volume scan data from each radar only required a bandwidth of 220Kbps, instead of much wider bandwidth, to achieve the truly real-time synchronous transmission of radar data. Due to massive calculations for radar data processing were needed in nowcasting, this technique also gave a longer lead-time for

110
nowcasting.
Radar clutter filtering. Most nowcasting systems participated in the B08FDP without their own quality control algorithms. Because the radar in Tianjin was located by sea at a lower altitude thus witnessing more clutters and AP. This would affect the nowcasting quality without quality control. After making comparative analyses, the project team finally chose the quality control method for radar data developed by Prof. Liu Liping from CAMS. During the demonstration phase in 2008, original and quality-controlled radar data were provided simultaneously. Except BJANC and NIWOT systems with their own quality control algorithm, other systems such as CARDS, MAPLE, STEPS, SWIRLS and TIFS adopted quality-controlled radar data.
The delay in AWS data transmission. The traditional AWS transmission mode is the following: firstly AWS data were collected level by level; secondly they would be uploaded to the National Center, and then the data were disseminated through ground links or satellite. Apparently this modality could not satisfy the requirements of the nowcasting system for local AWS data. In order to solve this problem, B08FDP adopted the following approach: the local AWS data were directly transmitted from observational sites to the local data-sharing platform, which immediately distributed them to individual operational systems. The new process was based on Beijing Regional Center Broadband Network and the Beijing Regional Data-sharing platform, which directly transmitted the local AWS data to regional data-sharing platform for immediate access by the operating systems. Compared with the traditional modality, the new approach reduced the number relays, and improved the efficiency for AWS data transmission. For example, the time from data observation to final use required at least about 312 seconds by traditional method, which exceeded the interval of AWS observations. During the Beijing Olympic weather services delivered from 1 July to 20 September 2008, the new approach provided over 90% of data within 180 seconds, with AWS data availability of 97.81% in 5 minutes.
The issue of network security. Since the B08FDP project required massive local data with higher temporal and spatial resolution, and remote access should allow overseas experts to carry out remote debugging and monitoring, it was necessary to separate the B08FDP sub-networks from operational networks for sake of security. At the same time, only the network portal was open to the participating systems with allocated addresses, which effectively prevented the unauthorized access to the system.
2.5 Contributions to B08FDP project 1) The detailed analyses were made on real-time data collection for FDP projects, radar network time synchronization, data update frequency, data formats, file structure, etc. On this basis, a rapid data collection and processing system was established, which met the real-time data requirements of FDP systems on the one hand, and effectively improved both network and data utility; the data management was optimized to meet the needs of FDP systems; all 8 nowcasting systems that participated in FDP project used the data provided by the system. 2) When several radars were networked for coordinated observations, GPS technology was first used to achieve time synchronization between radars. In the domestic operational system, the radial data transmission scheme was first adopted for real-time transmission of reference Doppler radar data of higher temporal resolution, all satisfying real-time demands of nowcasting systems for radar data. 3) It was first time for an operational system to achieve real-time data collection, processing and dissemination in Pyinotify-based information-driven approach, having a balanced transmission load between network and server, with real-time B08FDP data processing

111
efficiency being improved. 4) The local data format was unified following the international data format specifications, and a data environment was offered in line with international practice, thus making it easier to achieve seamless integration of the 8 FDP system and the BMB operational system, which paved the way for promoting applications elsewhere. 5) The nowcasting data sets were created during Beijing 2008 Olympic Games. A comprehensive study was made on the data collected for nowcasting, including integration, quality control methods, data analysis techniques, data delivery platform for AWS, radar, lightning detection/positioning, wind profilers, upper air data, satellite data as well as data format standards and specifications, etc. On this basis, standardized data sets and products were developed, which played an important role in B08FDP project.
3.Experiences
Since the data requirements of nowcasting were largely different from the conventional weather forecasting, it was necessary to fully understand practical requirements of the participating systems at the beginning, and the developments in data environments both in China and abroad during the project implementation process, and all the requirements should be addressed in a comprehensive manner, appropriately combining the demands with realistic operations. During the B08FDP implementation, it left some rooms to be desired, due to time unavailability, a large data variety and huge amount of data. For example, the data/information delivery is limited to an internal processing environment. In the near future, investigations will be made to further extend the information delivery directly to the operational systems to increase data processing rate and efficiency.

112
Summary Report on RTFV and Verification
Elizabeth Ebert (Centre for Australian Weather and Climate Research, Melbourne, Australia)
1. Introduction
Verification is a critical component of the Forecast Demonstration Project, providing important quality information at all stages of the FDP. The verification was performed using the Real Time Forecast Verification (RTFV) system. RTFV verifies a wide range of single-level meteorological forecasts against a variety of observational data. The emphasis is on forecast quantities produced by nowcast systems (e.g., precipitation amount and probability, thunderstorm occurrence and motion, radar reflectivity, threat areas, severe weather, lightning, wind) and NWP models (precipitation, wind, temperature, humidity). The observations may come from a variety of sources including surface networks and radar detections of precipitation and severe weather. Verification products are generated at the highest spatial and temporal resolution supportable by the forecasts and observations. To help evaluate the relative advantages and disadvantages of competing forecast systems RTFV generates verification products that compare two or more forecast systems.
2. Major tasks and expected outcomes
RTFV was a new system developed specifically for use in B08FDP, with the important aim of also using it to verify nowcasts in the Bureau of Meteorology. Participation in B08FDP has accelerated the development of real-time and post-real-time nowcast verification capability in the Bureau. It has also provided an excellent opportunity to assess the usefulness to forecasters and researchers of having up-to-the-minute feedback on product accuracy, as well as explore the most effective ways to present that information. Several major tasks were involved in preparing RTFV for use in B08FDP. Since the system had to be built from scratch, the design of the system was started early in 2005. IDL was chosen as the programming language to take advantage of existing verification routines written in that language, because of its excellent graphical capabilities, and because GUI development is straightforward in IDL. Several factors were considered in the design of RTFV, including the flexibility to add new data easily, conversion routines to spatially remap data provided as grids, points, cells, areas, and lines to allow forecasts of one type to be verified against observations of another type (e.g., gridded precipitation forecasts versus rain gauge observations), and the ability to inter-compare forecasts from competing systems. While the primary scope of RTFV in B08FDP was to provide real-time nowcast verification using standard methods and metrics, it was also developed as a platform for testing many of the newer diagnostic spatial (grid-to-grid and grid-to-point) verification methods. RTFV offers verification methods that draw on a variety of strategies including multi-scale, object-oriented, and field distortion. New methods can be easily added. To make data handling from a variety of nowcast systems tractable, standards were established for the file names and formats of nowcast products. For gridded nowcasts, netCDF was chosen as the standard format. For other types of nowcasts (points, cells, areas, and lines) a self-describing text format called Weather XML (WxML) was developed (Ebert et al. 2007). The full documentation for file naming conventions and netCDF and WxML formats is available online at http://www.bom.gov.au/bmrc/wefor/projects/b08fdp/WxML/. WxML has

113
been adopted as a format for exchanging nowcast data in other applications such as Ninjo (M. Dixon, personal communication), and will continue to be used in the Bureau of Meteorology. In preparation for the FDP, verification results from the 2007 trials gave information on the nowcast quality for most of the participating systems. This assisted forecasters, experts, and champions to interpret the automated nowcasts in an appropriate way in 2008. A set of case studies from the 2007 B08FDP Trial was selected to show the variety of high impact weather that could occur in Beijing during summer, and to demonstrate and evaluate the performance of the various nowcast systems. These cases were used extensively in training during July 2008, in the lead-up to the FDP in August 2008. The aim of the verification component of the training was twofold: to familiarize the forecasters, experts, and champions with the variety of verification products that would be available in real time, and to discuss the error characteristics of the many nowcast systems. The error characteristics included biases with respect to the observations, degradation of forecast accuracy with increasing lead time, and relative behaviors of different nowcast systems predicting the same quantity (e.g., over- vs. under-prediction, spatial structure vs. smoothness, etc.). The overall performance of the nowcasts on the 2007 trial data can be viewed on the nowcast verification training web site, http://www.bom.gov.au/bmrc/wefor/projects/b08fdp/verif/training/VerifyingNowcasts.html.
During the FDP, real time verification results were automatically generated as soon as verifying observations became available (every 5 minutes for rainfall, every 6 minutes for radar-derived products), and immediately posted online to the B08FDP Product Viewer web site. The results focused on the latest data, showing mapped nowcasts and observations, as well as performance diagrams and statistics corresponding to the most recent 6 h period. Several types of verification information were available, including scatter plots and quantile-quantile plots, 6 h time series of instantaneous verification statistics computed over the verification domain, and aggregated statistics plotted together for systems predicting the same quantity. Examples of these real time products are shown in Section 4.
Following the FDP, more extensive verification of the nowcasts is being conducted. The first step is to generate overall verification results for the full FDP period. This report presents and compares the performance of all nowcast systems for the period 1 August – 20 September 2008, using the same verification methodologies as were used in real time. Further spatial verification of QPFs using advanced diagnostic methods will be conducted to evaluate the structure of the nowcast precipitation fields. More detailed evaluation of nowcasts for interesting cases will also be done in collaboration with individual system experts.
3. Data and methods
Table 1 lists the B08FDP nowcast products that were verified during the FDP or in the months following the experiment, and the observational data that were used to verify them. Most of these nowcasts were verified in real time during the FDP, with the results available online immediately to be viewed by forecasters, experts, champions, as well as scientists at participating institutions who were not present in Beijing. The probabilistic verification results were not available online, but could be viewed by FDP experts in Beijing. Table 1. Nowcast products and verifying observations. The ** indicates verifications that were conducted post real time.
System Nowcast Products Spatial form Forecast range Verifying observations Reflectivity ≥ 35dBZ 1 km grid 30 and 60 min BJANC reflectivity analyses
BJANC QPF 1 km grid 0-30 min, 0-60 min Rain gauges
QPF 2 km grid every 15 min to 1.5 h Rain gauges CARDS Storm occurrence and properties cell every 6 min to 1 h CARDS storm detections

114
System Nowcast Products Spatial form Forecast range Verifying observations
QPF 2 km grid every 6 min to 1 h, every hr from 1-3 h Rain gauges
Reflectivity 2 km grid every 6 min to 1 h, every hr from 1-3 h
GRAPES-SWIFT reflectivity analyses
GRAPES- SWIFT
Storm track cell every 6 min to 1 h GRAPES-SWIFT storm detections
QPF 1 km grid every 10 min to 1 h Rain gauges MAPLE Reflectivity 1 km grid every 10 min to 3 h MAPLE reflectivity analysesNIWOT Reflectivity ≥ 35dBZ 5 km grid every hour to 6 h NIWOT reflectivity analyses
QPF 1 km grid 0-30 min, 0-60 min, 0-90 min Rain gauges STEPS POP(≥ 1, 2, 5, 10, 20, 50 mm) 1 km grid 0-1 h Rain gauges QPF (blended radar+NWP) 2 km grid hourly to 6 h Rain gauges
QPF (radar) (SWIRLS-R) 2 km grid hourly to 3 h Rain gauges POP (≥ 1, 10, 20, 50 mm) 2 km grid 0-1h, 0-3h, 0-6h Rain gauges SWIRLS Storm occurrence and prop-erties (reflectivity ≥ 34 dBZ) cell every 6 min to 1 h SWIRLS storm detections
Storm probability ensemble (VIPS lightning warning guidance) ** 1 km grid 0-1 h BJANC reflectivity analyses
Rain probability ensemble (VIPS rainstorm warning guidance) ** 1 km grid 0-1 h Rain gauges
TIFS
Probability of wetting rain (≥2 mm) 1 km grid 0-1 h Rain gauges
TITAN Storm occurrence and properties (reflectivity ≥ 40 dBZ) cell every 6 min to 1 h TITAN storm detections
T I F S
WDSS Storm occurrence and properties cell every 6 min to 1 h WDSS storm detections
Some nowcasts have not yet been verified. GRAPES convective weather potential, SWIRLS lightning probability nowcasts, and TIFS ensemble probability of rainstorms exceeding 40 and 80 mm h-1, may be compared to lightning observations. It may be possible to verify SWIRLS severe wind gusts in Urban Beijing if appropriate gust observations are available. QPFs from all systems predicting rain amount will be spatially verified against Rainfields merged radar+gauge analyses using advanced diagnostic methods to assess the quality of the rain structures.
The verification domain for all precipitation products was a 200x250 km box ("Beijing" domain) centered on Beijing province, while reflectivity and storm occurrence were verified over a larger domain, 500x500 km with the northwest corner omitted ("Outer Beijing" domain), as shown in Fig. 1. Precipitation was not verified in real time over the Outer Beijing domain because the density of the rain gauge network outside the 200x250 km Beijing domain was poor.
Rain gauge data were used as the primary verification data for all quantitative precipitation forecasts (QPFs) and probability of precipitation (POP) forecasts. 5 minute updates of rainfall accumulation were available in real time from about 50 gauges; the results in this report are based on verification using these data. The total number of gauges in the 500x500 km domain is more than double this number (106). Post-FDP verification of the QPFs against 106 gauges showed little difference in performance from the verification using the smaller gauge sample. Use of accumulation periods of 60 minutes or longer ensured that the rainfall observations were fairly robust.

115
Figure 1. Verification domains used in B08FDP. Radar data from four radars (Beijing, Tianjin, Ziangbei, and Shijiazhuang) are included in the Outer Beijing domain. The circular range rings are centered on the location of the Beijing radar.
Reflectivity nowcasts were verified against their own reflectivity analyses at t=0. It had initially been hoped that a single "best" reflectivity analysis could be used as the reference data for all reflectivity verification, using agreed-upon quality control procedures, CAPPI height, etc. However, the reflectivity products from the various nowcast systems used different vertical levels and different filtering strategies to highlight or suppress different features of the signal. This meant that it was impossible to produce a single reflectivity analysis that would be appropriate for verifying all reflectivity nowcasts.
Thunderstorm cell nowcasts were verified in two different ways. The nowcasts of cell tracks and cell properties from each nowcast system were verified against its detections of those same quantities, where the unique cell ID was used to follow each cell through time. No special processing was done to account for cell splits (where the larger cell of the split would keep the ID and the smaller would get a new ID), and cell merges (where the larger cell's ID would be kept and the other lost). The cell nowcasts were also projected to a 1 km grid and verified against gridded detections using categorical statistics (critical success index, false alarm ratio, etc.).
A new nowcast product, the thunderstorm strike probability, was generated by applying a probabilistic track forecasting scheme (Dance et al., J. Atmos. Ocean. Tech., accepted) separately to TITAN, SWIRLS, and CARDS thunderstorm nowcasts, then averaging them to obtain a consensus product. Automatic nowcasts were constructed from a combination of TITAN and SWIRLS tracks, while manually edited nowcasts could be generated by selecting any or all of the three inputs, and modifying or deleting individual thunderstorm cell properties using the TIFS system. The strike probability nowcasts were produced on a 1 km grid over the Outer Beijing domain and were valid for 1 h beyond the observation time. The verification data was an occurrence (yes-no) map of BJANC pixel-scale reflectivity ≥ 40 dBZ during the 1 h validity time; these pixels were considered to have been "affected" by thunderstorms.
Outer Beijing
Beijing
Urban Beijing
Reflectivity, cell tracks, Tstorm strike probability
Precipitation, probability of precipitation
Wind gusts
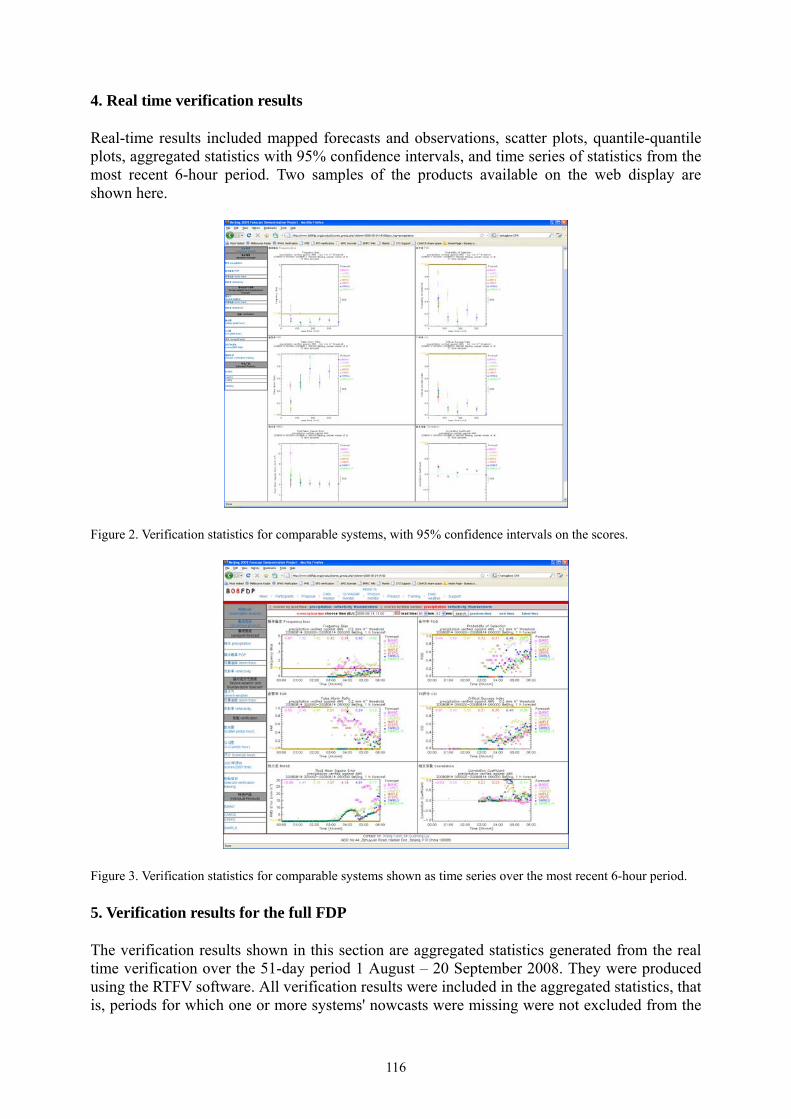
116
4. Real time verification results
Real-time results included mapped forecasts and observations, scatter plots, quantile-quantile plots, aggregated statistics with 95% confidence intervals, and time series of statistics from the most recent 6-hour period. Two samples of the products available on the web display are shown here.
Figure 2. Verification statistics for comparable systems, with 95% confidence intervals on the scores.
Figure 3. Verification statistics for comparable systems shown as time series over the most recent 6-hour period.
5. Verification results for the full FDP
The verification results shown in this section are aggregated statistics generated from the real time verification over the 51-day period 1 August – 20 September 2008. They were produced using the RTFV software. All verification results were included in the aggregated statistics, that is, periods for which one or more systems' nowcasts were missing were not excluded from the

117
overall comparison. It is therefore not a strictly fair comparison. However, since none of the nowcast systems failed during periods of significant weather, it is expected that the verification results shown here represent a valid comparison.
The aggregated statistics represent those statistics that would be obtained by pooling all samples in space and time. They were produced from the instantaneous spatial verification statistics following the guidelines for aggregation of statistics at http://www.bom.gov.au/bmrc/wefor/staff/eee/verif/aggregation/guidelines.html. Note that these statistics are not generally the same as would be produced by time-averaging the instantaneous spatial verification statistics, or by spatially averaging the statistics of time series at points. 95% confidence intervals were included with the real time verification (spanning a 6 h period), but they have not been produced for the 51-day aggregated results due to the computational expense.
a. Quantitative precipitation forecasts (QPFs)
Seven nowcasts systems provided gridded QPFs. Although the grid resolutions were not identical (1 km for BJANC, MAPLE, STEPS, 2 km for CARDS, GRAPES-SWIFT, SWIRLS and SWIRLS-R), they were similar enough that their verification statistics can be compared fairly.
Quantile-quantile (Q-Q) plots are a useful diagnostic for comparing forecast and observed distributions of values. These plots show whether the forecast rain amounts have conditional biases (bias that changes with the predicted value itself), where calibration could improve their accuracy.
Figure 4. Quantile-quantile plots for nowcasts of hourly precipitation accumulation.
Figure 4 shows Q-Q plots for 1 h nowcasts of rainfall amount. Three of the QPFs, namely
SWIRLS (blue) and SWIRLS-R

118
BJANC, CARDS, and SWIRLS, had forecast precipitation distributions that were quite similar to the observed (points lying along the diagonal). STEPS, MAPLE, and SWIRLS-R QPFs gave rain accumulations that were too low for most of the range, although their highest rain accumulations were close to the observed. GRAPES-SWIFT QPFs were too high for values up to 30 mm h-1, but became too low for the very highest accumulations.
The Q-Q plot does not show how well the nowcast rain matches the observed rain, only whether their overall distributions are similar. The ability of the nowcasts to match the observed rain can be evaluated using continuous scores such as the root mean square error (RMSE) and correlation coefficient, and categorical scores such as the frequency bias, probability of detection (POD), false alarm ratio (FAR) and critical success index (CSI).
Figure 5. Root mean square error (RMSE) and correlation coefficient with observations for nowcasts of hourly precipitation accumulation.
Figure 5 shows that STEPS and MAPLE had the lowest RMSEs and the highest correlation coefficients of all 1 h nowcasts. The STEPS and MAPLE nowcasts tended to be smoother than the other QPFs, with the result that high rainfall amounts were rarely predicted. This lack of incorrect heavy rain forecasts improved the RMSE and correlation by reducing the double penalty (rain predicted where it was not observed, and observed where it was not predicted). The high bias in GRAPES-SWIFT nowcasts was largely responsible for its large RMSEs.
Interestingly, SWIRLS values of RMSE were highest at hour two of the forecast, then decreased for longer lead times. The shape of this curve may be a reflection of the model QPFs contributing to a reduction in RMSE starting near hour 3 of the forecast. This conjecture is supported by the monotonic increase in the RMSE with lead time for the SWIRLS-R radar-based QPF.
Categorical statistics are often used for QPF verification because they are robust to outliers, and familiar to many people. They are generated by converting the forecast and observed values to "yes" and "no" events, where "yes" indicates a value greater than or equal to a specified threshold. Categorical statistics are computed from the numbers of hits, misses, false alarms, and correct negatives. This report will focus on four categorical statistics, namely, the frequency bias (FBI; ratio of the number of forecast "yes" events to the number of observed "yes" events), the probability of detection (POD; fraction of observed "yes" events correctly predicted), the false alarm ratio (FAR; fraction of forecast "yes" events that were observed "no"), and critical success index (CSI; fraction of forecast and/or observed "yes" events that

119
were hits). The CSI penalizes both false alarms and misses, and can be thought of as the accuracy for "forecasts that count". Because it is so easily understood, it is often the main summary score used to inter-compare nowcast quality between different nowcasting systems. However, the CSI has been shown to favor forecasts that over-predict (since more hits are made through random chance); this must be considered when interpreting the verification results.
Figure 6. Frequency bias (FBI), critical success index (CSI), probability of detection (POD), and false alarm ratio (FAR) using a 1 mm h-1 threshold, for nowcasts of hourly precipitation accumulation.
Figure 6 shows categorical statistics for QPFs when a 1 mm h-1 threshold was used. Since light rain occurred much more often than heavy rain, these statistics mainly reflect the performance for light rainfall. The frequency bias shows CARDS having little bias, GRAPES-SWIFT over-predicting rain occurrence, and the remaining nowcast systems underestimating rain occurrence. According to the CSI the best nowcasts of light rain were made by STEPS and CARDS. STEPS had a good POD (0.5) and a very low (good) FAR. The POD for CARDS was even better, but its FAR was higher (worse). GRAPES-SWIFT missed very little of the observed rain (POD=0.85 for 1 h nowcasts), but many of its rain predictions were false alarms. All nowcasts showed a reduction in performance with increasing lead time.

120
Figure 7. Frequency bias (FBI), critical success index (CSI), probability of detection (POD), and false alarm ratio (FAR) using a 10 mm h-1 threshold, for nowcasts of hourly precipitation accumulation.
Categorical scores for higher intensity rain (≥ 10 mm h-1) (Figure 7) indicate that it is much more difficult to accurately predict heavy rain. The frequency biases for most nowcast systems were exaggerated (high biases got higher, low biases got lower), and the CSIs were much lower. The prediction skill for rain ≥ 10 mm h-1 was essentially gone by hour two of the nowcast (CSI~0.05). A small fraction of observed events were correctly predicted (POD<0.5), and all systems except STEPS predicted more false alarms than hits.
b. Probability of precipitation nowcasts (POPs)
Three nowcast systems provided probability of precipitation nowcasts. SWIRLS POPs were generated using a lagged ensemble, while STEPS POPs were produced by a stochastic ensemble. TIFS used an ensemble approach to generate probabilities of "wetting" rain exceeding 2 mm h-1 and "flooding" rain exceeding 40 and 80 mm h-1, where the flooding rain products incorporated rainfall already observed as well as predicted rain. Figure 8 shows that SWIRLS and STEPS produced quite reliable POP nowcasts for rain exceeding 1 mm h-1, i.e., the observed frequency was approximately equal to the predicted probability over a large number of cases. The points falling in the shaded region on the reliability plot contribute positively to the skill of the nowcasts when compared to a climatological nowcast using the Brier skill score. The proximity of the ROC curves to the "perfect" line that follows the left and

121
top borders of the plot indicates that the STEPS and SWIRLS nowcasts were well able to distinguish raining cases from non-raining cases. STEPS appears to be the better performer according to this metric.
Figure 8. Reliability (left) and ROC (right) for probability of precipitation nowcasts of hourly rain accumulation of at least 1 mm h-1.
Figure 9. Reliability (left) and ROC (right) for probability of precipitation nowcasts of hourly rain accumulation of at least 10 mm h-1.
The probabilistic skill for POP ≥ 10 mm h-1 was much less than for the lighter rain, which is not surprising (Fig. 9). Although the ROC shows there is considerable potential skill in identifying heavy rain cases (note the ROC is insensitive to bias), the reliability diagram shows that the predicted probabilities were much too high. The favorable ROC suggests that there would be value in calibrating the POP nowcasts for rain ≥ 10 mm h-1 to improve their reliability. STEPS and SWIRLS nowcasts of rain for higher thresholds indicated poor skill for rain exceeding 20 mm h-1 and virtually no skill for the 50 mm h-1 threshold.
c. Reflectivity nowcasts
The nowcast systems that made reflectivity nowcasts all treated the reflectivity in a slightly different way, making it difficult to directly inter-compare their performance. For example, the

122
GRAPES-SWIFT strategy was to analyze and predict the largest reflectivity in the vertical column as a sort of "worst case" warning product, which meant that its reflectivities were much greater and more widespread than those of the other nowcast systems. BJANC and NIWOT reflectivities corresponded to a constant 1.5 km altitude and did not analyze or predict values lower than 35 dBZ. NIWOT nowcasts blended into NWP model forecasts, with the option of human intervention to adjust the nowcast-model mix. MAPLE products used a "hybrid" scan which is a mosaic of the lowest level reflectivity available above the terrain, and predicted reflectivity values across the full range.
Figure 10. Critical success index (CSI) for nowcasts of reflectivity ≥ 35 dBZ (left) and 50 dBZ (right). Figure 10 shows the CSI for 35 dBZ and 50 dBZ thresholds. The pixel-scale performance was fairly discouraging, with CSI values ranging between 0.15 and 0.26 for 30 minute nowcasts of reflectivity ≥ 35 dBZ. The CSI for NIWOT nowcasts decreased to near zero (i.e., very few hits were achieved) for lead times of more than one hour. The poorer CSI values for reflectivity exceeding the 50 dBZ threshold indicate that stronger storms were more difficult to predict well, which is not surprising since they are typically small in scale.
d. Thunderstorm nowcasts
The mean displacement and area errors for all tracked thunderstorm cells are shown in Figure 11. The errors in cell location after an hour ranged from 17 to 25 km. The TITAN, SWIRLS, and WDSS cell trackers performed equally well, with GRAPES-SWIFT nearly as skillful and CARDS having somewhat larger track errors. Some small or young thunderstorm cells were assigned erratic tracks by the CARDS algorithm. In many cases these cells were not analyzed at all by TITAN or SWIRLS, presumably because certain size and/or intensity criteria were not met. GRAPES-SWIFT cell motion was derived from NWP model forecasts, so it is interesting that these tracks are approximately as accurate as those obtained using more traditional approaches such as correlation tracking. This suggests that a combination of independent strategies for cell tracking may be advantageous.

123
Figure 11. Mean displacement error (km, left) and mean area error (km2, right) for thunderstorm cell nowcasts. The mean errors in cell area errors increased with time, and showed that predicted cell areas were too small when compared to their observed sizes. (To put the mean area errors in context, the typical cell size was a few hundred km2.) Since the nowcasts did not "grow" the cells, it appears that more cells were detected and verified in their growing phase than in their decaying phase. The verification of thunderstorm cells projected onto a 1 km grid is shown in Figure 12. As might be expected from Fig. 10, the SWIRLS and TITAN nowcasts had higher values of CSI than CARDS did since their displacement errors tended to be smaller. The CSI values will depend somewhat on the threshold used to define the cells (40 dBZ for TITAN, 34 dBZ for SWIRLS, 45 dBZ CARDS), with lower thresholds producing larger cells that have an innate advantage when computing CSI.
Figure 12. Critical success index (CSI) for thunderstorm nowcasts from CARDS, SWIRLS, and TITAN.
e. TIFS probability of wetting rain and thunderstorm strike probability nowcasts
The TIFS consensus POP nowcast was generated as an average of individual POPs estimated from QPF using logistic regression (e.g., Applequist et al., WAF, 2002). Each nowcast system's calibration was computed over a range of intensity thresholds from the 2007 trial case study data, which was biased toward wet cases. This led to the consensus POP being under-confident in 2008 for probabilities greater than about 0.2 (for TIFS verification diagrams please refer to

124
the TIFS system report). However, the discrimination power suggested by the ROC curve is excellent, and further calibration of the POPs would in principle lead to a more accurate set of probabilistic nowcasts. (Note: the intent was to weight the contributing POP estimates based on verification results, and update the calibration and weights on a regular basis during the FDP; however, this did not occur.) The strike probabilities were verified against the occurrence of reflectivity greater than or equal to 40 dBZ during the validity period of 1 h. Referring to the results described in the TIFS system report, the reliability of the lower probability values was quite good, although the higher probability nowcasts were clearly over-confident. The ROC plot shows excellent discrimination of events and non-events. Considering that the probability algorithm was calibrated and tested using data from Sydney, Australia, the good performance of the automated algorithm is quite encouraging.
f. Discussion
Eight years separated the nowcasts in B08FDP from the earlier FDP in Sydney in 2000. Some of the nowcast schemes demonstrated in Sydney underwent further improvement before being implemented in Beijing.
The accuracy of thunderstorm cell tracking is compared for B08FDP and the Sydney 2000 FDP in Figure 13b. It appears that the track errors have remained nearly constant in spite of gains in understanding of thunderstorm development and dynamics and improvements to automated track algorithms. It is possible that thunderstorms are inherently unpredictable beyond a certain scale, and that additional scientific understanding and sophisticated statistical processing of radar imagery may not produce much gain in tracking accuracy. Another possibility is that the improvement in cell tracking methodology was offset by the occurrence of more difficult weather in Beijing, leading to no net improvement. A different picture emerges for quantitative precipitation forecasts. Figure 13a shows how QPF quality in B08FDP and the Sydney 2000 FDP compare to each other. Although the precipitation nowcasts were made by a different set of schemes in 2008 and 2000, the overall QPF performance in 2008 was much better than in 2000. One explanation could be that the weather in Beijing was much easier to predict than the weather in Sydney. However, the similarity of the track errors in Fig. 10 suggests that the weather in Beijing was likely to have been no easier to nowcast than the weather in Sydney. The more probable explanation for the results in Fig. 13 is that the quality of QPF nowcasts has indeed improved over the eight year period.
TITAN Sydney 2000 FDP
Sydney 2000 FDP
(a) (b)
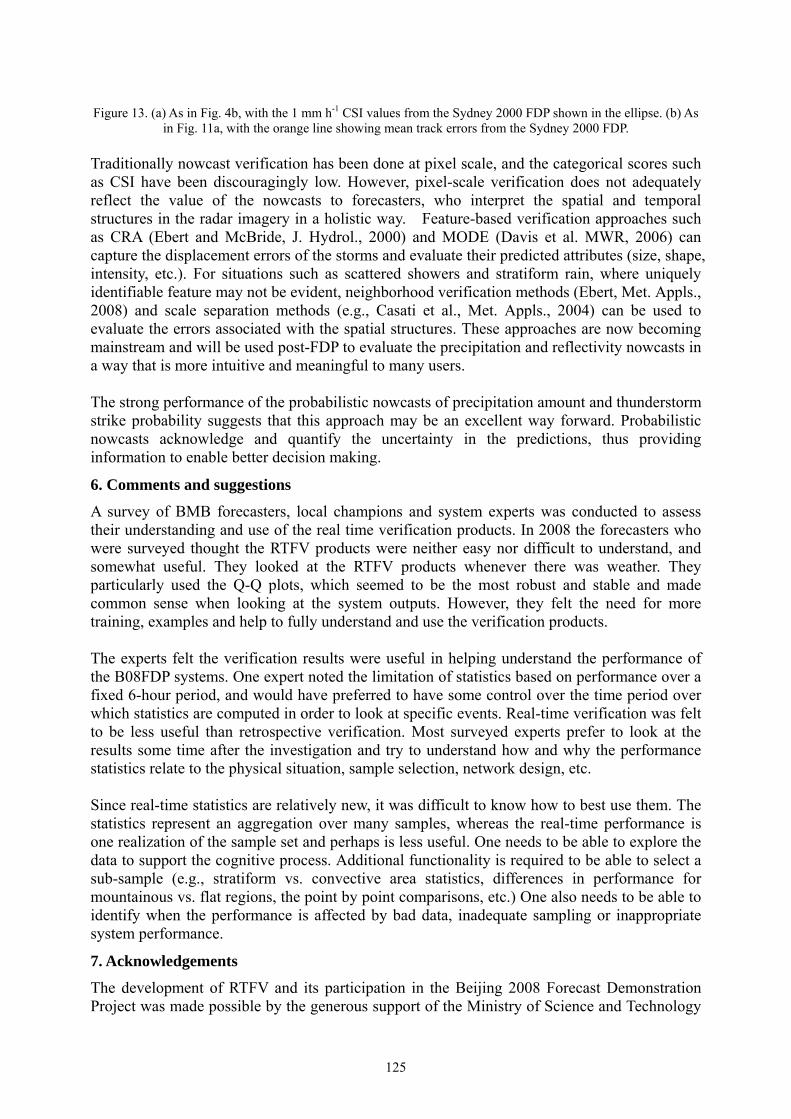
125
Figure 13. (a) As in Fig. 4b, with the 1 mm h-1 CSI values from the Sydney 2000 FDP shown in the ellipse. (b) As
in Fig. 11a, with the orange line showing mean track errors from the Sydney 2000 FDP. Traditionally nowcast verification has been done at pixel scale, and the categorical scores such as CSI have been discouragingly low. However, pixel-scale verification does not adequately reflect the value of the nowcasts to forecasters, who interpret the spatial and temporal structures in the radar imagery in a holistic way. Feature-based verification approaches such as CRA (Ebert and McBride, J. Hydrol., 2000) and MODE (Davis et al. MWR, 2006) can capture the displacement errors of the storms and evaluate their predicted attributes (size, shape, intensity, etc.). For situations such as scattered showers and stratiform rain, where uniquely identifiable feature may not be evident, neighborhood verification methods (Ebert, Met. Appls., 2008) and scale separation methods (e.g., Casati et al., Met. Appls., 2004) can be used to evaluate the errors associated with the spatial structures. These approaches are now becoming mainstream and will be used post-FDP to evaluate the precipitation and reflectivity nowcasts in a way that is more intuitive and meaningful to many users. The strong performance of the probabilistic nowcasts of precipitation amount and thunderstorm strike probability suggests that this approach may be an excellent way forward. Probabilistic nowcasts acknowledge and quantify the uncertainty in the predictions, thus providing information to enable better decision making.
6. Comments and suggestions
A survey of BMB forecasters, local champions and system experts was conducted to assess their understanding and use of the real time verification products. In 2008 the forecasters who were surveyed thought the RTFV products were neither easy nor difficult to understand, and somewhat useful. They looked at the RTFV products whenever there was weather. They particularly used the Q-Q plots, which seemed to be the most robust and stable and made common sense when looking at the system outputs. However, they felt the need for more training, examples and help to fully understand and use the verification products. The experts felt the verification results were useful in helping understand the performance of the B08FDP systems. One expert noted the limitation of statistics based on performance over a fixed 6-hour period, and would have preferred to have some control over the time period over which statistics are computed in order to look at specific events. Real-time verification was felt to be less useful than retrospective verification. Most surveyed experts prefer to look at the results some time after the investigation and try to understand how and why the performance statistics relate to the physical situation, sample selection, network design, etc. Since real-time statistics are relatively new, it was difficult to know how to best use them. The statistics represent an aggregation over many samples, whereas the real-time performance is one realization of the sample set and perhaps is less useful. One needs to be able to explore the data to support the cognitive process. Additional functionality is required to be able to select a sub-sample (e.g., stratiform vs. convective area statistics, differences in performance for mountainous vs. flat regions, the point by point comparisons, etc.) One also needs to be able to identify when the performance is affected by bad data, inadequate sampling or inappropriate system performance.
7. Acknowledgements
The development of RTFV and its participation in the Beijing 2008 Forecast Demonstration Project was made possible by the generous support of the Ministry of Science and Technology

126
of the People’s Republic of China (CMST) under an international cooperation project entitled Executing Environment Research for WWRP B08FDP. A special thanks goes to Ms DUAN Yuxiao for conducting the survey on the usefulness of the real time verification.

127
Summary Report on Social and Economic Impact Assessment
Qian Ye1, Yuxiao Duan2, Xun Li2, Qingchun Li2, Haibo Hu2, Jiarui Han3, Haiyan Ding2
and Linda Anderson-Berry4, Michael H. Glantz1 1 Consortium for Capacity Building, University of Colorado, USA
2 Beijing Meteorological Bureau, CMA, Beijing, China 3 Institute of Atmospheric Physics, Chinese Academy of Sciences, Beijing, china
4 Bureau of Meteorology, Melbourne, Australia
With great enthusiasm of Chinese people both at home and abroad, and effectively organizing and coordinating government departments at all levels, despite of a variety of man-made incidents and natural disasters, the Beijing 2008 Olympic Games was recognized by the world as one of tremendous successful events in the Olympic history. Not only the success of Chinese and foreign Olympic athletes for their achievements write a beautiful new page in Olympic history book, but also the great efforts and contribution made by the Chinese Government and the broad masses of the Chinese people in the organization and servicing of this large-scale international event moved peace-loving people all over the world. As one of important parts of promising to International Olympics Committee delivered by the Beijing Olympic Games Bid Committee, China Meteorological Administration promised to provide improved weather forecasting products to meet various needs from the participants of the Olympics, the city managers, the general public as well as other special business users during the Beijing 2008 Olympics. Normally, weather services in China only provide weather information to general public including the possibility of rainfall, rough estimates of wind scale and temperature. For the Olympics, the accuracy of forecasts such as the exact time of rainfall with accuracy to within minutes is needed. According to the experience and lessons learned from previous international sport events, including the Olympics, accurate weather forecasting plays a key role for a successful Olympic Games. Since .the Beijing Olympics ran from August 8 to 24 during which the city usually has about 40 to 50 percent of its annual precipitation and the weather changes frequently in July and August, it poses a big challenge for Chinese meteorologists to provide accurate forecasts during the Olympics. Moreover, making weather forecasts over the Olympics is very labor intensive and requires considerable expertise by local forecasters. A shortage of trained weathermen is also a major hindrance for Beijing Meteorological Bureau. To meet these challenges, organized and coordinated by China Meteorological Administration beginning in 2002, meteorological bureaus around the country put a lot of manpower and material resources not only to improve observation, monitoring and forecasting system into international advanced levels, but also to develop more advanced perception of providing service to meet continuously changes of needs from BOCOG, the Beijing Municipal Government and government departments at all levels, enterprises and the public. To fully understand how the improved weather forecast products affect the service skill of the meteorological services at all, it is very important to conduct a thoroughly scientific research in areas including understanding customer needs, exploring the new ideas and conceptual framework of new meteorological services from a point of view of social and economic impacts. Servicing for a success of the Olympic Games provides us an outstanding opportunity

128
to conduct such researches. Starting in 2005, supported by the China Meteorological Administration (CMA) and the Beijing Meteorological Bureau (BMB) with funding provided by Beijing Science and Technology Commission, a team consisted of international researchers, university professors, experienced forecasters as well as managers from Beijing Meteorological Bureau has worked hard to conduct researches to the targeted groups including the Beijing Olympics Organizing Committee and Olympic-related personnel, the Beijing municipal government departments, enterprises, media and the public both Chinese and foreigners. The socio-economic impacts of improved forecasting products of the Beijing Olympic Meteorological Service to the Beijing Olympic Games opening and closing ceremonies, the Olympic Games main event, the Beijing Water Authority, various kinds of media, the Summer Palace, and the public were carried out with four-year continuous survey and comparative analysis. Based on analysis of the information collected, the following major conclusions are obtained: 1. The Beijing 2008 Olympics in the international arena is recognized as the largest-ever Olympic Games. Olympic weather service provided by China Meteorological Administration is faced with the long time span of the service including lighting of the Olympics torch in Greece, the torch relay around the globe and sending the torch to the Mount Everest, complex clients with a wide range of characteristics, who require meteorological information not only high degree of spatial and temporal precision and accuracy but also improved meteorological services which can cover the diversity of needs. Supported and coordinated by World Meteorological Organization, the China Meteorological Administration organized an international team which was formed by a number of top level meteorological science and technology institutes and organizations to provide by far the most extensive, largest, and most sophisticated temporal and spatial scales of meteorological information services. To meet all these challenges, the China Meteorological Administration and the Beijing Municipal Meteorological Bureau helped by the World Meteorological Organization developed a new service system build on an international forecasting demonstration projects (FDP). The new service has the following characters a) Providing more forecast products: By successfully implementing the most advanced forecasting techniques and management practices provided by FDP, special forecasting products were developed for all kinds of activities of the Olympic Games, including providing a scientific basis from the perspective of climatology to determine the dates of the Olympic Games, the Olympic Games and Paralympic Games torch lighting and global relay. For various Olympic venues, BMB provided 3 times a day rolling forecasts with a range of 0 ~ 72 hours, "seamless" weather forecasting services for the Olympic opening ceremony. The forecasting information was disseminated in Chinese, English and French. Many of these tasks are not only the first time in the history of the Olympic Games, but also will serve as the legacy of the Olympic meteorological services in the future Olympic Games. b) Adapting user oriented service style The China Meteorological Administration, the first time in the international community adopted the "Merge-style" service, that is, by sending forecasters with extensive experience of forecasting to work with the clients (in this case, the BOCOG) to establish a good relationship of trust through in-depth understanding of user decision-making process. Through the daily communication, clients learned how to incorporating in their decision-making process to the proper use of weather information with uncertainty with a goal of getting the greatest social

129
and economic benefits; c) Improving public understanding: Both CMA and BMB paid great attention on public education and promotion by applying various ways including developing special website, participating in BOCOG organized press conferences, taking part in all kinds of public promoting campaigns, training volunteers to participate in the collection of meteorological information and feedback. All these efforts were well recognized by the governments, BOCOG and general public and a significant social impact of improved the weather service was observed. Based on the survey on the high-level decision making personnel from BOCOG and various countries, it showed that the degree of satisfaction of Olympic decision-makers at all levels on FDP products is 4.5 (5-point scale). After given training to the public on the use of FDP products, it was found that the demand of FDP products is increased with a substantial degree from 62 percent in 2005 to 100 percent in 2008. The survey on business users (in our case, the Summer Palace Boat Renting Team was selected) showed that by using the FDP products, short-term forecasts were significantly improved in accuracy, especially for strong winds nowcasting. The overall accuracy improvement is above 60%. At the same time, the use of new products also stimulates the user to improve their decision-making process in order to achieve the maximum economic benefits. The study has also made the following theoretical findings: 1. Based on analysis of survey data for various types of users, it is interesting, though not surprising, that the needs of users of meteorological information satisfy the famous Maslow hierarchy of needs. This finding could help weather services to better understand how to fit in users’ needs when they develop new products and new services. 2. By analyzing the relationship between makers of meteorological products, i.e., meteorological services and various media, it shows that realizing social and economic benefits of meteorological information products fully depends on the weather information (including quality of observations, quality of forecasts and understanding of weather phenomena, as well as the quality of forecasters), the efficiency and effectiveness of dissemination of right weather information, and correct use of weather information. 3. The future weather service should be developed in such framework named as “The 3s” theory, that is the future of weather information service system should consist of a) three basic components, i.e., “manufacturers” of meteorological information products, disseminators of meteorological information, and users of meteorological information; b) users in three categories, i.e., government decision makers, enterprises decision makers, and the public; and c) three basic information products, i.e., forecasting, early warning and simulation for preparedness and planning. 4. The ultimate goal of weather services is to help users to continuously improve the ability of use of meteorological information with uncertainty in their decision-making process effectively and efficiently in order to maximize their social and economic benefits. 5. The essential purpose of conducing social and economic impact assessment study inside weather service is to help realize the ultimate goal of the weather services by looking for the correct ways and means.

130
This study suggests: 1. It is very important to develop and keep a small size team with a long-term support inside weather services to conduct independent studies on socio-economic impact assessment for the purpose of improving services and the efficiency; 2. It is necessary to make full use of all types of media, with their cooperation in ensuring the accuracy of weather information, science and authority, under the premise of meteorological information to strengthen publicity and education work in fun, intuitive and accessible ways to disseminate meteorological information. It is important to take the advantage of seasonality to educate public for better using weather and climate information to manage their lives. 3. It is very important to set up efficient and effective mechanisms for getting user feedback so that the new products can be developed to meet user needs. Public training and education are also needed urgently so the new products can be understood and applied by users.