overview of research project 0-5930
TRANSCRIPT

1
OVERVIEW OF RESEARCH PROJECT 0-5930
TTI recently completed TxDOT Research Project 0-5930 Potential for Development of a
Intercity Passenger Transit System in Texas which examined 18 intercity corridors within the
state to determine current capacity for intercity travel by road, air, and rail. Project 0-5930
examined only long-distance, intercity corridors connecting regions of the state and provided
data on estimated travel times for each corridor at a variety of potential high speed rail speeds up
to (HrSR) standards (and have subsequently been updated to include high speed rail (HSR)
speeds). The study evaluated current employment and population as well as projected population
growth for the state to 2040 based on figures developed by the Texas State Demographer.
Researchers used the 2035 FHWA Freight Analysis Framework projected traffic levels to
estimate segment-by-segment volume-to-capacity (V/C) ratios along existing roadways in each
of the corridors. The existing bus and rail transit systems connecting to each potential corridor
were documented as were a variety of demographic data along each route. The corridors were
then ranked as to their need for future expansion in intercity passenger transportation capacity.
These corridor rankings have formed the basis for the advancement of four study corridors being
submitted by TxDOT or others in this round of HSIPR applications.
INTRODUCTION
Texas has undergone a quiet transformation over the past several decades, passing New
York in population to become the second most populous state in the U.S. behind only California.
While much larger than the other two states, the population of Texas is concentrated largely
within in the eastern half of the state—along and east of the I-35 corridor. Texas contains three
of the U.S.’s top 10 urban areas by population—Dallas-Fort Worth, Houston, and San Antonio—
all located within 200-300 miles of one another. The city of Austin, also over a million in
population, is located on the I-35 corridor and serves as the state’s capital attracting both
business and government travelers. Texas and Oklahoma sit at the crossroads, in the middle of
the continent, astride trade and travel corridors connecting both north and south NAFTA traffic
and the east and west flow of goods from Asia to the eastern U.S.

2
The Interstate 35 (I35) corridor is one of the state’s most heavily trafficked corridors,
connecting three of the state’s four largest cities and serving as the state’s primary international
corridor, which provides a critical trade link between Mexico and the U.S. interior. At its
southern end, I-35 connects Texas to one of the busiest land ports with Mexico, and at its
northern end it connects Texas to distribution centers throughout the United States.
Consequently, Texas is a worldwide logistics and distribution hub located within the middle of
the North American trade route. Highway demand from international truck traffic competes with
highway demand for intercity truck movements between some of the country’s largest cities,
both of which displace the availability of highway capacity needed for efficient passenger travel.
The State of Texas has long been a leader in the provision of quality transportation
infrastructure for its citizens. Along with its federal funding partners, the state has built the most
expansive highway system of any state with over 79,000 lane-miles. Texas has also benefitted
from an excellent air transportation system that has steadily grown in use as urban airports in
Dallas-Fort Worth and Houston have become national and international hubs. Airports in other
Texas urban areas have grown to meet the intercity and regional travel demand that is not met by
the highway system and as feeders to the hub airports for interstate travel. Over time, Texan’s
urban and suburban work and travel patterns have shifted, becoming longer and more frequent.
Interconnectivity between urban areas throughout the state has grown in importance as centers of
both housing and commercial activity have spread along existing transportation routes.
The state’s burgeoning population and its rapid transition from a rural state to an urban
one have strained elements of the existing transportation system. To meet the need for new
intercity transportation capacity will require new financing and operational methods to provide
the required infrastructure for continued economic growth and quality of life. High-performance
intercity passenger rail systems must be considered as a part of the solution to meeting this
challenge. A well-designed intercity rail system with coordinated transit connections in urban
areas served by it could improve performance of the existing highway and air transportation
systems allowing each mode—highway, air, and rail—to operate more effectively.
Figure 1 demonstrates the relative size of the population centers and the relative distance
between these centers. The extensive growth in the major urban centers shows in the Texas
Urban Triangle area including Dallas-Fort Worth, Houston, San Antonio, and Austin. The

Dallas-Fort Worth to San Antonio corridor connects two of the nation’s largest urban areas,
along a corridor experiencing tremendous growth. Additionally, the urban areas along the
Texas-Mexico border between Laredo and Brownsville are experiencing tremendous growth. In
addition to examining the main corridor between Dallas-Fort Worth and San Antonio along I-35,
this study would examine options for linking San Antonio to the urban centers in South Texas
along the international border.
Figure 1. Relative Size and Distance of Texas Population Centers along Study Corridors.
3

4
DALLAS TO SAN ANTONIO AND SAN ANTONIO TO BROWNSVILLE VIA LAREDO CORRIDOR OVERVIEW
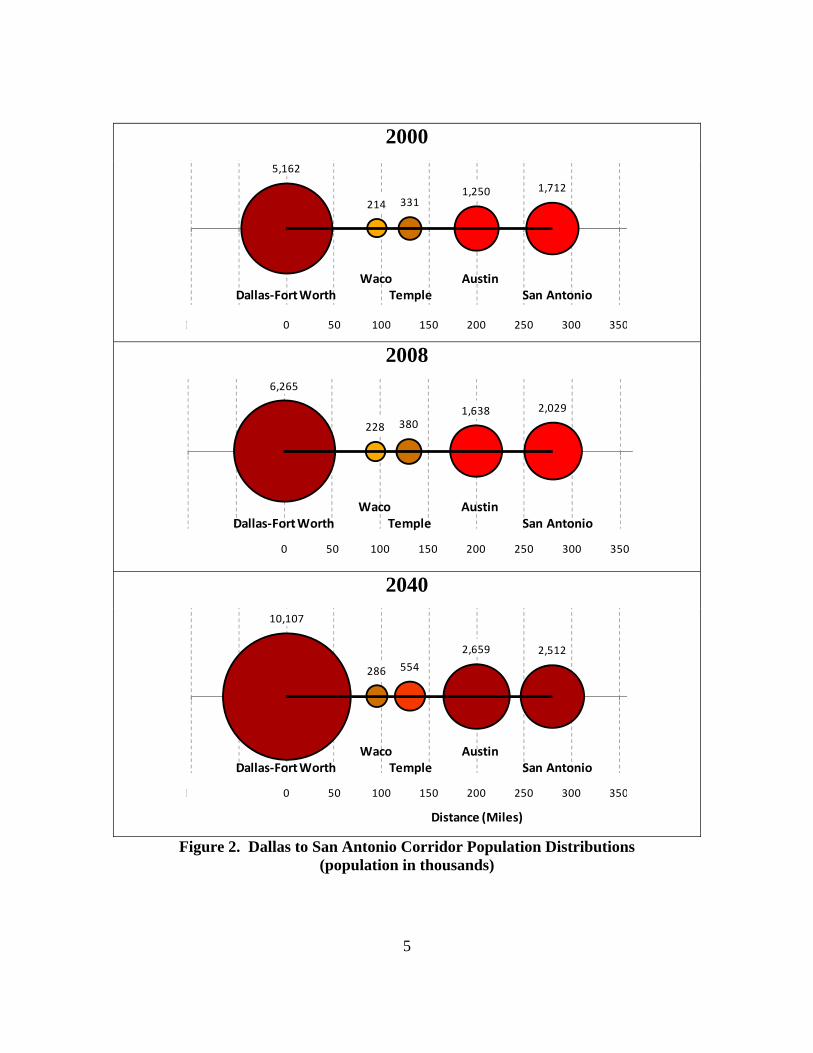
Figure 2 shows of the CBSA populations along the Dallas-Fort Worth to San Antonio
corridor, along with a demonstration of the distance between these urban centers. The corridor is
approximately 280 miles in length with a total of five CBSAs, all of which are categorized as
Metropolitan. According to the 2000 federal census, over 5.1 million people resided in the
Dallas-Fort Worth-Arlington CBSA, while the populations of both the Austin-Round Rock and
San Antonio CBSAs exceed 1.2 and 1.7 million, respectively. The Waco and Killeen-Temple-
Fort Hood CBSAs added over 500,000 combined population to the along the corridor.
In addition to the 2000 population figures, Figure 2 contains the 2008 population
estimates and the expected 2040 population for all five CBSAs along the corridor as forecast by
the Texas State Demographer. The major urban centers along the corridor are expected to
experience significant population growth by 2040, with the Dallas-Fort Worth-Arlington CBSA
expecting to almost double to over 10 million people in 2040. The Austin-Round Rock CBSA is
expected to surpass the San Antonio CBSA to over 2.6 million people in 2040. The San Antonio
CBSA is expected to grow to 2.5 million, while the Waco and Killeen-Temple-Fort Hood
CBSAs are expected to grow to over 286,000 and 554,000, respectively. The Corsicana and
Huntsville CBSAs are expected to reach 70,900 and 77,800, respectively, by 2040.
2000 5,162
214 3311,250 1,712
100 ‐50 0 50 100 150 200 250 300 350
Waco AustinDallas‐FortWorth Temple San Antonio
2008 6,265
228 3801,638 2,029
100 ‐50 0 50 100 150 200 250 300 350
Waco AustinDallas‐FortWorth Temple San Antonio
2040
10,107
286 554
2,659 2,512
100 ‐50 0 50 100 150 200 250 300 350
Distance (Miles)
Waco AustinDallas‐FortWorth Temple San Antonio
Figure 2. Dallas to San Antonio Corridor Population Distributions
(population in thousands)
5

6
Table 1 shows the distance between the urban areas along the corridor and estimated travel time
at a variety of average passenger rail speeds along the entire corridor.
Table 1. Dallas-Fort Worth to San Antonio CBSA Population, Distances, and Estimated Travel Times
Population Distance Travel Time (hours:minutes)
CBSA 2000 2008 2040 Segment Cumulative 60
mph 80
mph 110 mph
150 mph
200 mph
DFW 5,161,500 6,265,000 10,106,800 0 0 0:00 0:00 0:00 0:00 0:00 Waco 213,500 228,500 285,500 95 95 1:35 1:11 0:51 0:38 0:28 Temple 330,700 379,800 553,700 35 130 2:10 1:37 1:10 0:52 0:39 Austin 1,249,800 1,637900 2,658,500 70 200 3:20 2:30 1:49 1:20 1:00 San Antonio 1,711,700 2,028,800 2,512,000 80 280 4:40 3:30 2:32 1:52 1:24
MARKET POTENTIAL
The market potential of a high-speed intercity passenger rail corridor can be measured by
the proposed corridor’s population, density, economic activity, and travel patterns. This section
reports several demographics and travel activity statistics for the Dallas-Fort Worth to San
Antonio corridor. Projected population numbers are presented by the Texas State Demographer,
while the roadway information comes from the TxDOT Road–Highway Inventory Network
(RHiNo) database and FHWA Freight Analysis Framework database.
Population, Economic Activity, and Special Generators
Population and Employment in the I-35 Corridor
The U.S. Census estimated that over 11 million people lived in the 35 counties of the I-35
corridor in 2008, representing over 45 percent of all Texas residents. At that time there were 14
cities with populations greater than 100,000 in the corridor, including two cities (San Antonio
and Dallas) with over 1 million residents each and two more cities (Austin and Fort Worth) with
over 500,000 residents each. Over 5 million I-35 Corridor residents were employed in 2008,
equal to an increase in the 2000 Census of more than 20 percent.
The Dallas-Fort Worth to San Antonio corridor is the most densely-populated and fastest-
growing corridor in Texas. The combined corridor population was approximately 8.6 million
people in 2000 and is projected to reach over 16 million by 2040, as shown in Table 2. The
population numbers translate to a 2000 population per mile value of 32,461 but are expected to
7
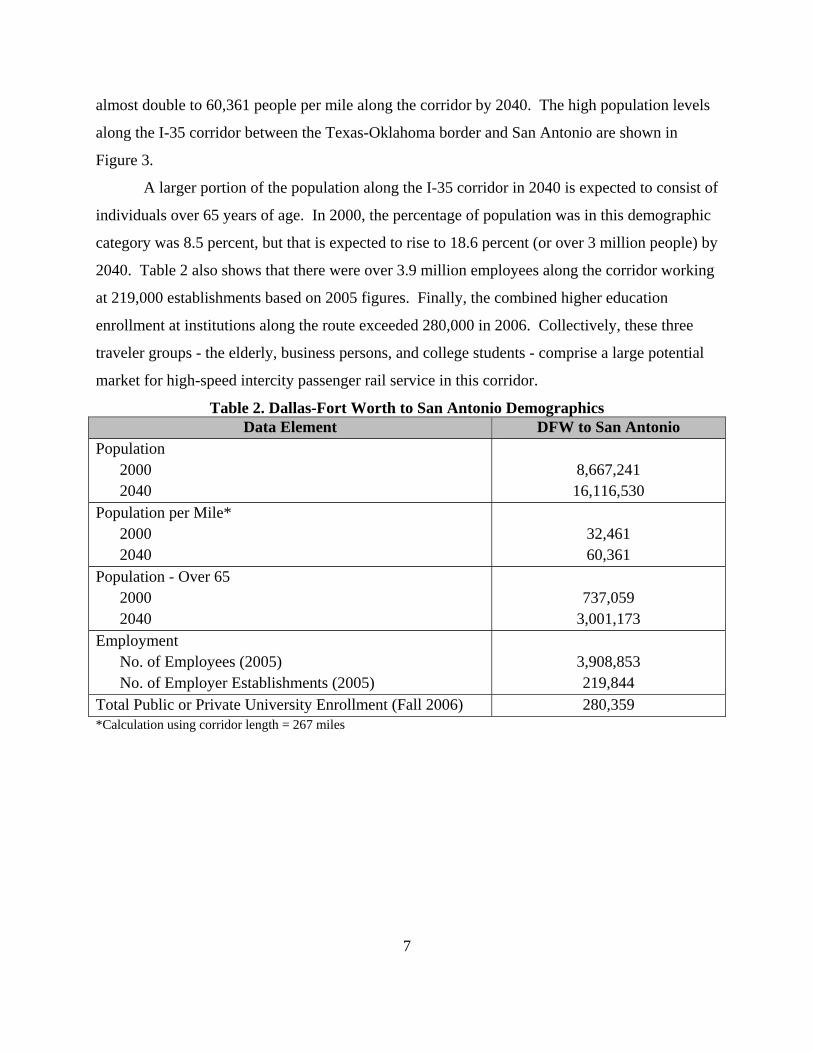
almost double to 60,361 people per mile along the corridor by 2040. The high population levels
along the I-35 corridor between the Texas-Oklahoma border and San Antonio are shown in
Figure 3.
A larger portion of the population along the I-35 corridor in 2040 is expected to consist of
individuals over 65 years of age. In 2000, the percentage of population was in this demographic
category was 8.5 percent, but that is expected to rise to 18.6 percent (or over 3 million people) by
2040. Table 2 also shows that there were over 3.9 million employees along the corridor working
at 219,000 establishments based on 2005 figures. Finally, the combined higher education
enrollment at institutions along the route exceeded 280,000 in 2006. Collectively, these three
traveler groups - the elderly, business persons, and college students - comprise a large potential
market for high-speed intercity passenger rail service in this corridor.
Table 2. Dallas-Fort Worth to San Antonio Demographics Data Element DFW to San Antonio
Population 2000 2040
8,667,241 16,116,530
Population per Mile* 2000 2040
32,461 60,361
Population - Over 65 2000 2040
737,059
3,001,173 Employment
No. of Employees (2005) No. of Employer Establishments (2005)
3,908,853 219,844
Total Public or Private University Enrollment (Fall 2006) 280,359 *Calculation using corridor length = 267 miles

Figure 3. Texas Population by County, 2040
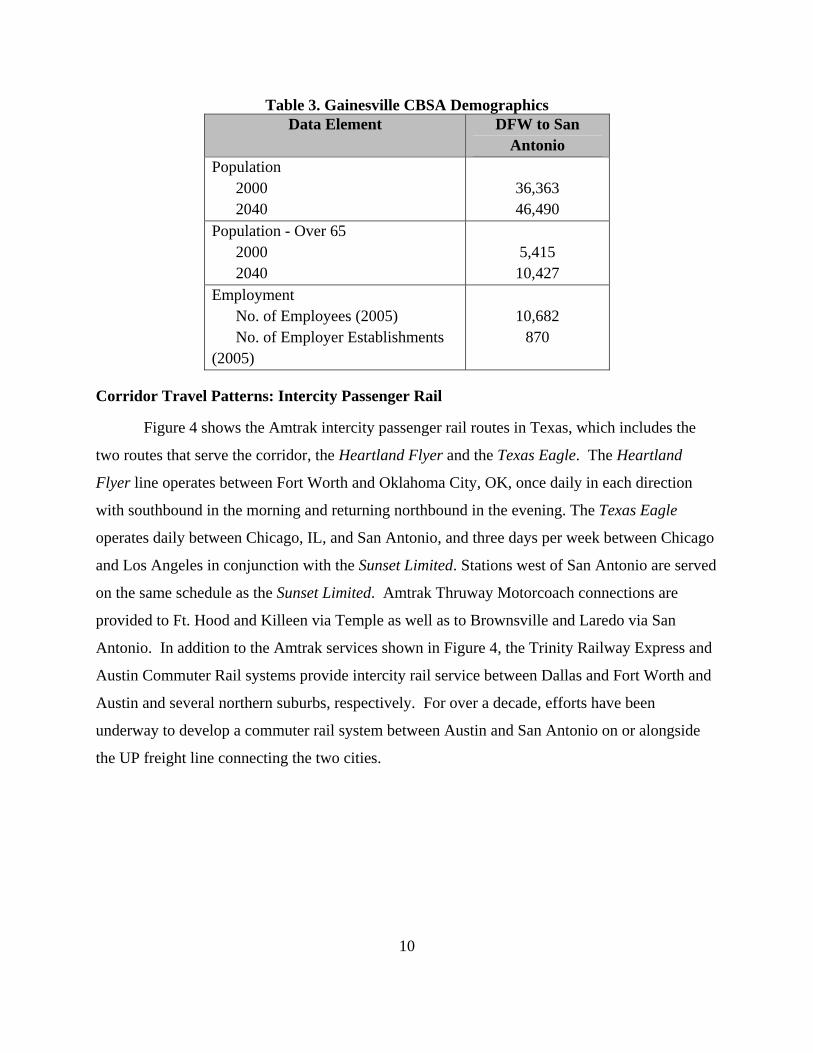
Following I-35 north from Dallas-Fort Worth to the Texas-Oklahoma border would travel
primarily through Cooke County, TX, which is a designated Micropolitan CBSA, named the
Gainesville CBSA. Although not included in the original 0-5930 research project, considering
the Gainesville CBSA as part of the combined Dallas-Fort Worth CBSA adds the following
demographic data, as presented in
8

9
Table 3.
10
Table 3. Gainesville CBSA Demographics Data Element DFW to San
Antonio Population
2000 2040
36,363 46,490
Population - Over 65 2000 2040
5,415 10,427
Employment No. of Employees (2005) No. of Employer Establishments
(2005)
10,682
870
Corridor Travel Patterns: Intercity Passenger Rail
Figure 4 shows the Amtrak intercity passenger rail routes in Texas, which includes the
two routes that serve the corridor, the Heartland Flyer and the Texas Eagle. The Heartland
Flyer line operates betw y in each direction
with southbound in the morning and returning northbound in the evening. The Texas Eagle
operate
are
ies.
een Fort Worth and Oklahoma City, OK, once dail
s daily between Chicago, IL, and San Antonio, and three days per week between Chicago
and Los Angeles in conjunction with the Sunset Limited. Stations west of San Antonio are served
on the same schedule as the Sunset Limited. Amtrak Thruway Motorcoach connections
provided to Ft. Hood and Killeen via Temple as well as to Brownsville and Laredo via San
Antonio. In addition to the Amtrak services shown in Figure 4, the Trinity Railway Express and
Austin Commuter Rail systems provide intercity rail service between Dallas and Fort Worth and
Austin and several northern suburbs, respectively. For over a decade, efforts have been
underway to develop a commuter rail system between Austin and San Antonio on or alongside
the UP freight line connecting the two cit

F 4. Amtr tes and s in Texa
able 4 displays e-year s for the three Amtrak routes in Texas - the
Heartland Flyer, the Sunset Limited, an xas Eag e that th l ridersh s
are reported for the fed l year ( ich sta ber 1. R p on the
H in FFY as appro ly 10 per ss than F 8, refle
general nationwide trend of lower Amtr ic recession
i l pattern ver, rid n the tw
t t Limited and t s Eagle, were opposite of the national trend, with ridership gains
realized in FFY 2009 compared with F . All th s routes d riders s
in FFY 2009 as compa 2007
Table 4: Amtrak Texas Routes Ridership, FFY 2007-2009
igure ak Rou Station s
T the thre ridership total
d the Te le. Not e annua ip total
eral fisca FFY), wh rts Octo idershi
eartland Flyer 2009 w ximate cent le FY 200 cting a
ak ridership in FFY 2009 due to the econom
mpacting trave s e. How e orship o Amtrak long-distance routes in Texas,
he Sunse he Texa
FY 2008 ree Texa realize hip gain
red to FFY .
Ridership Percent Change Route FFY 2009 FFY 2008 FFY 2007 vs. FFY 2008 vs. FFY 2007Heartland Flyer 73,564 80,892 68,246 -9.1 +7.8 Sunset Limited 78,775 71,719 63,336 +9.8 +24.4 Texas Eagle 260,467 251,518 218,321 +3.6 +19.3
11

12
FFY 2007 , and e cou
pas rains pl ins
stat 200 ,0 ak trains a ns
along the corridor, a slight m F rom FFY 2007.
Pas at corrid T 2009 (as compared with
FFY 2008) and increased 24 percent comp
Table 5: Corridor Amtrak Station
Table 5 displays the total ridership activity for Amtrak stations along the corridor for
2009. Ridership activity at a given station consists of th, 2008 nt of
sengers boarding t at the station us the count of passengers alighting tra at the
ion. During FFY 9, almost 325 00 passengers connected to Amtr t statio
decrease fro FY 2008 but a 20 percent increase f
senger activity or stations in exas increased slightly in FFY
ared with FFY 2007.
s - Boardings and Alightings, FFY 2007-2009 Ridership Percent Change
Station FFY 2009 FFY 2008 FFY 2007 vs. FFY 2008
vs. FFY 2007
Oklahoma Ardmore 9,094 8,607 9,642 +5.7 -5.7 Norman 12,573 13,414 11,033 +-6.3 +14.0 Oklahoma City 48,434 55,015 43,293 -12.0 +11.9 Pauls Valley 5,393 5,942 6,357 -9.2 -15.2 Purcell 2,073 2,086 2,801 -0.6 -26.0 Oklahoma Total 68,473 76,457 63,484 -10.4 +7.9
Texas Austin 25,404 23,829 19,388 +6.6 +31.0 Cleburne 2,455 2,135 1,831 +15.0 +34.1 Dallas 39,592 35,860 27,374 +10.4 +44.6 Fort Worth 104,107 109,012 85,069 -4.5 +22.4 Gainesville 8,018 9,249 9,589 -13.3 -16.4 McGregor 4,238 3,141 2,382 +34.9 +77.9 San Antonio 48,804 48,151 40,908 +1.4 +19.3 San Marcos 4,339 3,741 3,084 +16.0 +40.7 Taylor 3,908 3,981 3,464 -1.8 +12.8 Temple 15,163 12,914 13,349 +17.4 +13.6 Texas Total 256,028 252,013 206,438 +1.6 +24.0 Grand Total 324,501 328,470 269,922 -1.2 +20.2
Table 6 reports the five largest city pairs by Amtrak ridership in the corridor for the time
period between September 2006 and August 2007. A vast majority of the intercity passenger rail
travel patterns flow along the Heartland Flyer route endpoints, with more than 35,000
passengers along this segment of the corridor.

13
Table er City-Pairs with at Least one Endpoint in Texas for the Period September 2006 - August 2007
6. Five Largest Amtrak Intercity Passeng
Train Station Codes Station Names Ridership
Heartland Flyer FTW-OKC Fort Worth, TX - Oklahoma City, OK 35,663 Heartland Flyer FTW-NOR Fort Worth, TX - Norman, OK 7,924 Texas Eagle FTW-SAS Fort Worth, TX - San Antonio, TX 7,192 Texas Eagle AUS-FTW Austin, TX - Fort Worth, TX 5,721 Heartland Flyer GLE-OKC Gainesville, TX - Oklahoma City, OK 3,675
In the late 1990s, the Texas Department of Transportation (TxDOT) and the Austin
San Antonio metropolitan planning organizations (CAMPO and SA-BC MPO), and the Austin
and San Antonio transit authorities (Capital Metro and VIA) formed a regional partnership t
fund and manage a feasibilit
and
o
y study of passenger rail service on the existing Union Pacific
freight line that parallels I-35 between Georgetown and San Antonio. The study concluded that a
cally and financially
feasible s
and
ble
g
n
ission
of provi in/San
Antonio corridor. The Rail District’s govern uth istrict cquire,
construct, deve wn, operate, a ain” passenger rail fac service
commuter rail system between Georgetown and San Antonio is techni
. The study provided basic information on the proposed passenger rail system such a
ridership forecasts, capital costs, rail operation costs and revenues, passenger stations
intermodal connections, financing scenarios, and Union Pacific freight demand and possi
routes for relocating freight traffic.
Authorized by the Texas Legislature in 1997, the cities of Austin and San Antonio and
Travis and Bexar counties voted to create the Rail District in December 2002. The first meetin
of the Rail District Board of Directors took place in February 2003 and the name, Austin-Sa
Antonio Intermunicipal Commuter Rail District” was adopted. The name was changed to Lone
Star Rail District in 2009.
Lone Star Rail District is a political subdivision of the state focused solely on the m
ding regional passenger rail service to Central and South Texas along the Aust
ing statute a orizes the d
ities and
to “a
s. lop, o nd maint il
The ail District f Dire ently f electe private Lone Star R Board o ctors is curr made up o d and
sector officials who represent:
14
• Member cities and counties
• Capital Area Metropolitan Planning Organization (CAMPO) and San
Antonio-Bexar County Metropolitan Planning Organization (SA-BC MPO)
This study will also include work done by the Lone Star Rail District for the Austin-San
Antonio Commuter Rail Project. The Rail District conducted a commuter rail study in 1999
which was updated in 2004. In addition to these studies they also conducted studies on the
financial and economic impact of passenger rail service and a study on station locations
economic impact. This work and Lone Star’s vision for passenger service in the Austin-San
Antonio Corridor will be incorporated into the Service D
and their
evelopment Plan to ensure that the final
passenger rail plan will be a comprehensive and seamless passenger rail network that meets the
included in
the 0-5930 project corridor evaluation, the airport in Oklahoma City, the Oklahoma City Will
Rogers
es for
needs of the region and state.
Corridor Travel Patterns: Commercial Air Carrier Service
The existing commercial airports within the Dallas-Fort Worth to San Antonio corridor
include Dallas/Fort Worth International (DFW), Dallas Love Field (DAL), Waco Regional
Airport (ACT), Killeen-Fort Hood Robert Gray AAF (GRK), Austin-Bergstrom International
Airport (AUS), and San Antonio International Airport (SAT). While not specifically
World Airport (OKC), is included in the scope of the proposed high-speed rail corridor.
The longest corridor air market distance is between SAT and OKC, at just over 400 miles. The
air travel distance between the two DFW-region airports and SAT is approximately 250 miles.
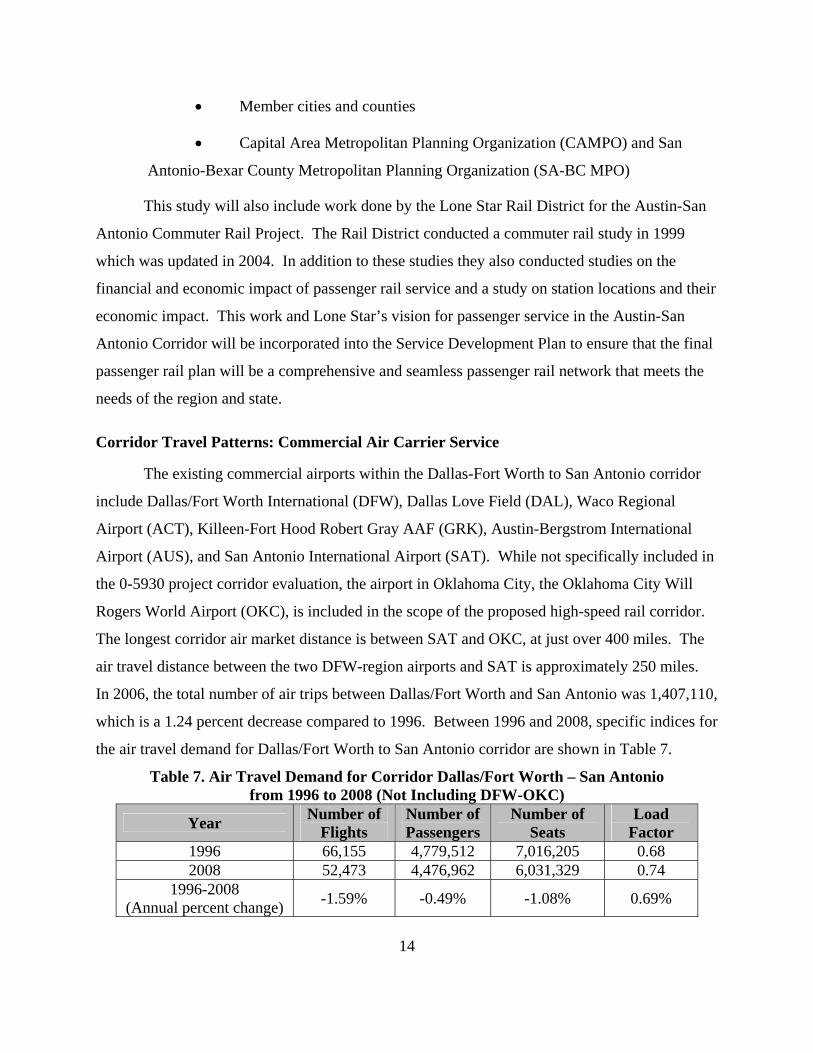
In 2006, the total number of air trips between Dallas/Fort Worth and San Antonio was 1,407,110,
which is a 1.24 percent decrease compared to 1996. Between 1996 and 2008, specific indic
the air travel demand for Dallas/Fort Worth to San Antonio corridor are shown in Table 7.
Table 7. Air Travel Demand for Corridor Dallas/Fort Worth – San Antonio from 1996 to 2008 (Not Including DFW-OKC)
Year Number of Flights
Number of Passengers
Number of Seats
Load Factor
1996 66,155 4,779,512 7,016,205 0.68 2008 52,473 4,476,962 6,031,329 0.74
1996-2008 (Annual percent change) -1.59% -0.49% -1.08% 0.69%

15
illion per
air travel activity from OKC to the activity at the other corridor
airports ied.
ase
orts.
Corridor Travel Patterns: Highway
Inter s
international trade with Mexico, bringing goods from exico into the
Midwestern U.S. or to the industrial centers of the U.S. East Coast.
tran tion mode along this corridor, and TxDOT has spent millions of dollars over the past
for its entire length within the state.
hows the highway travel statistics. Traffic levels on I-35 between Dallas-Fort
Worth and San Antonio grew 2.9 percent annually on a weighted average basis between 1997
expected to grow from 88,000 in 2006 to over
8. The overall corridor to-capacity
ratio in 2002 was 0.80, with a 1.0 representing a roadway at capacity. The 2035 projected
volume-to-capacity ratio worsens to an expected value of 1.90. This is shown in the 2002 and
2035 estimated average speed over the corridor dropping from 55 mph in 2002 to 15 mph in
2035. The percentage of trucks along the corridor is expected to remain relatively steady to
2035. The trend line for growth in AADT from 1997 to 2006 is shown in Figure 5.
Projections indicate that the 38.2 million vehicle miles traveled on I-35 in 2005 will
increase 57 percent by 2025, whereas actual highway lane capacity on I-35 will increase
nowhere near this amount in the coming decades. Without an increase in highway lane capacity
In 2006, the average number of scheduled flights per day on the corridor between
Dallas/Fort Worth and San Antonio was 155 flights per day. In Texas, nearly 71 million
passengers were enplaned in 2007 and the number is expected to grow more than 104 m
year by 2025. Adding estimated
, the 2008 traffic patterns total 69,249 flight operations and 5,780,839 passengers carr
Also, it is estimated from 2008 air traffic data that approximately 14 percent of all commercial
air carrier flight operations at corridor airports were operating between two airports in the
corridor. Development of a high-speed intercity passenger rail system may reduce this
percentage by diverting corridor trips from air to high-speed rail, which would in turn incre
capacity and operational efficiency at corridor airp
state 35 is one of the busiest highways in the U.S. The major urban center
experience high levels of passenger traffic, not only internally but also between urban areas.
I-35 is also a vital link for M
The highway is the major
sporta
several decades widening and improving safety
Table 8 s
and 2006 as shown in Figure 5. The levels are
178,000 vehicles per day in 2035 as shown in Table volume-

16
in proportion to this growth in vehicle miles traveled, mobility and safety within the I-35 corridor
will be significantly reduced, lessening the region’s economic potential and quality of life for
business travelers, commuters, tourists and all who rely on the efficient movement of
commodities within the region.
According to level-of-service (LOS) projections for 2035, 55 percent of peak period
traffic on I-35 between Oklahoma and Mexico will experience a LOS classification of “F”, and
83 percent of this peak period traffic will experience a LOS classification of “D” or worse. For
the portion of I-35 specifically between DFW and San Antonio, 63 percent of peak period traffic
will experience a LOS classification of “F”, and 89 percent of this peak period traffic will
experience a LOS classification of “D” or worse.
Table 8. Dallas-Fort Worth to San Antonio Highway Travel Patterns
Data Element DFW to San Antonio % Annual Growth in Average Corridor AADT (1997-2006) 2.91% Average Corridor AADT
2006
2035
88,153 vehicles per day 178,452 vehicles per day
Averag
2035 0.80 1.90
e Volume-to-Capacity Ratio 2002
Average Speed 2002035
2 55 mph
15 mph Average % Trucks
2002 2035
16.1% 16.8%

0
10,000
20,000
30,000
40,000
50,000
60,000
70,000
1997 1998 1999 2000 2001 2002 2003 2004 2005 2006
YEAR
WTD
AA
DT
(veh
/day
)
Figure 5. Dallas-Fort Worth to San Antonio 10-year Weighted AADT Trend
EXISTING BUS TRANSIT, INTERMODAL FACILITIES, AND FREIGHT RAIL
The following sections summarize the existing transit and freight rail services and routes
in the study corridor area.
Existing Bus Service
Texas Eagle
route) and three additional stops in Dallas and two stops in Fort Worth including the Fort Worth
terfaces with both the Amtrak Heartland Flyer and Texas Eagle
ity Railway Express com pany also
terlined service with Greyh rom Fort Worth to San
erlined service with Greyhound line is mericanos USA LLC
y along the length of th tercity bus service routes
wn in Figure 7. A listing of the Greyhound stations appears in the
Greyhound serves cities along this corridor eight times daily. Greyhound makes several
stops in the Dallas-Fort Worth vicinity, including Union Station (where it interfaces with the
Trinity Railway Express commuter rail, the DART Light Rail system, and Amtrak’s
Intermodal Station (where it in
routes and with the Trin muter rail). The Kerrville Bus Com
provides intercity in ound line one time daily f
Antonio. Another int provided by A
which runs 10 times dail e corridor. A map of in
operating in Texas is sho
17

18
garding intermodal facilitie g intercity bus service following section re s. Figure 7 is a map showin
routes in Texas.
city Bus Service in Texas
Intermodal faculties include passenger train stations, bus stops/stations, transit centers
r facilities that could potentially become intermodal facilities if market demand and
orth to San Antonio Corridor, there are 26 Greyhound
others. Specific names are as follows:
s/Stop (B)
Figure 7. Inter
Intermodal Facilities
and othe
development allows. On the Dallas/Fort W
Stations/stops, 13 Amtrak stations, as well as
Greyhound Station
• Arlington
• Austin
• Garland
• Greenville
• Bastrop
• Carrollton
• Corsicana
• Lewisville
• Mesquite
• Richardson

19
p
• Gainesville
• Terrell
• Waxahachie
• Weatherford Pilot Travel Center
odal
T
• Gainesville Amt
• K ilways Bus
• McGregor Amtr
• Temple Amtrak Station
Others:
• acility
• Waco Intermodal Transit Center
Transit Agencies
The corridor from Dallas/Fort Worth to San Antonio travels through 6 planning regions
in the state of Texas and contains 14 existing transit agencies. They are namely:
• Alamo Area Regional Transit
• Capital Metro (Austin)
• Capital Area Rural Transit System
• Heart of Texas Council of
Government Rural Transit
• Hill Country Transit
• Dallas
• Dallas Westmoreland
• Dallas South Park & Ride
• Dallas West (B)
• Denton Travel Center
• Dublin Sto
• Fort Worth
• Round Rock
• San Antonio
• San Marcos
• Sherman
• Stephenville
Amtrak Stations
• Austin Central Terminal
• Cleburne Intermodal Terminal
• Dallas Union Station
• Fort Worth Interm
• San Antonio Amtrak Station
• San Marcos Intermodal Station
• Taylor Amtrak Station
ransportation Center
rak Station
illeen Arrow Tra
Station
ak Station
Kerrville Intermodal F

20
• Dallas Area R
• Denton County Transportation
Authority
(San Antonio)
t
• Waco Streak
Existing Freight Rail Opera
two existing freight rail line parallel to I tween D nd Sa
shows th tential rail routes. Route Optio as th Pa
nts: from DFW aco, from W Austin to San Antonio.
also has egments; the egment fro to Te w
d the remaining two to San An nio a
ion Pacific
T . Freight ent Ownership
(CARTS)
• Cletran Transportation (Cleburne)
• Collin County Area Regional Transit
• TAPS Public Transit
• The T (Fort Worth)
• VIA Transit
apid Transit (DART) • Waco Transi
tions
There are routes -35 be FW a n
Antonio. Table 7 ese po n one h ree Union cific-
owned segme to W aco to Austin, and from
Route Option two
BNSF an
three s first s m DFW mple is o ned by
from Temple to Austin and from Austin to re
properties of Un .
able 7 Rail SegmSegment Detail Gener ion of Rail Lines al Descript S nt Regme R
DFW to San An I-35), Optitonio ( on 1 DFW to Wa arallels I-35 co P UPWaco to Austin Parallels I-35 UP
Austin to San Antonio Parallels I-35 UP DFW to San Antonio (I-35), Option 2
DFW to Temple Parallels I-35 BNSF Temple to Austin Parallels I-35 UP
Austin to San Antonio Parallels I-35 UP

21
ture train
volumes per rail line se
T men and R
Table represents the current train volumes provided by the Class I railroads and as
determined through various freight rail mobility studies conducted by TxDOT. Fu
gment are based on a 3% annualized growth rate.
able 8. Seg t Density ail Volumes
Segment Current Volume (trains p y) er da
Future Volume* (trains per day)
Growth (trains per day)
Percent Growth
Segment Density
(MGTM/Mi)
DFW to San (I-35), Option 1 Antonio DF 45- 55-60 120 70 W to Waco*** 50 95-110 60-W
emple to Taylor lor to San
arcos
7-5-10
25-30
25 20-30 60-75
8-13 15-20 35-45
100 200-300 140-150
15 10-15 30-35
aco to Temple TTayM
12 15- 10-
San Marcos to San Antonio
35-40
85-95
50-55
130-140
25-40 ML1 25-30 ML2
DFW to San Antonio (I-35), Option 2 DFW to Temple DFW to Waco Waco to Temple
25-30 45-50 7-12
60-75 110-120 15-25
35-45 65-70 8-13
140-150 140 100
50-70** 60-70*** 10-15***
Temple to Taylor Taylor to San Marcos
5-10 25-30
20-30 60-75
15-20 35-45
200-300 140-150
10-15 30-35
San Marcos to San Antonio
35-40
85-95
50-55
130-140
25-40 ML1 25-30 ML2
*as of year 2035, excluding passenger trains ** on BNSF rail lines *** on UPRR rail lines
22
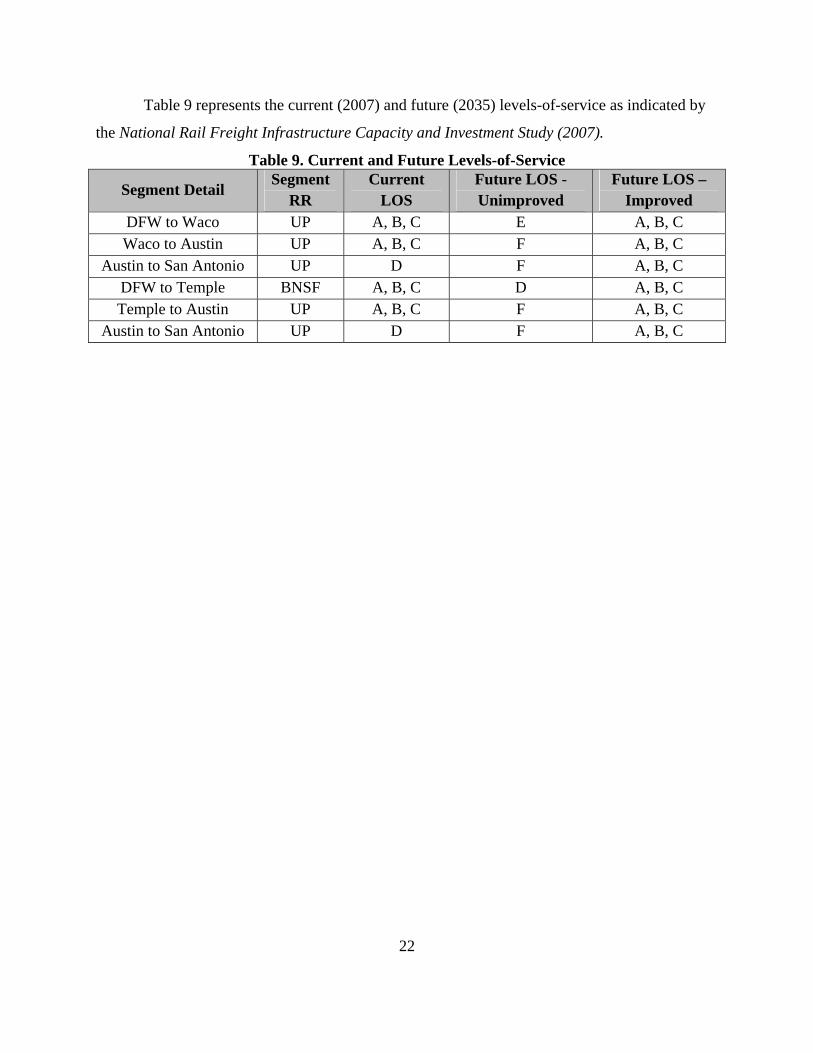
Table 9 re s indicated by
the National Rail Freight Infrastructure Capacity and Investment Study (2007).
presents the current (2007) and future (2035) levels-of-service a
Table 9. Current and Future Levels-of-Service
Segment Detail Segment
RR Current
LOS Future LOS - Unimproved
Future LOS – Improved
DFW to , B, C Waco UP A, B, C E AWaco to , B, C Austin UP A, B, C F A
Austin to San Antonio UP D F A, B, C DFW to Temple BNSF A, B, C D A, B, C Temple to Austin UP A, B, C F A, B, C
Austin to San Antonio UP D F A, B, C

ROUTE OPTIONS SOUTH OF SAN ANTONIO
Two route options between San Antonio and the population centers in the lower Rio
Grande Valley of the state were examined in TxDOT Project 0-5930. Each is described below in
a separate section.
23
1) SAN ANTONIO TO B SVILLE VIA LAREDO
CORRIDOR OVERVIEW
From San Antonio, there are several routes in which to travel to Brownsville. One route
travels south from San Antonio along I-35 to Laredo and then along US 83 south through
McAllen, Harlingen, and Brownsville. This route captures the major growing urban areas on the
Texas-Mexico border. However, no freight rail line exists between Laredo and Rio Grande City,
a distance of approximately 100 miles. Figure 8 shows the San Antonio to Brownsville via
Laredo corridor examined in research project 0-5930.
ROWN
Figure 8. San Antonio to Brownsville via Laredo Corridor Map
24
BSA,
le via Laredo corridor, along with showing the
relative
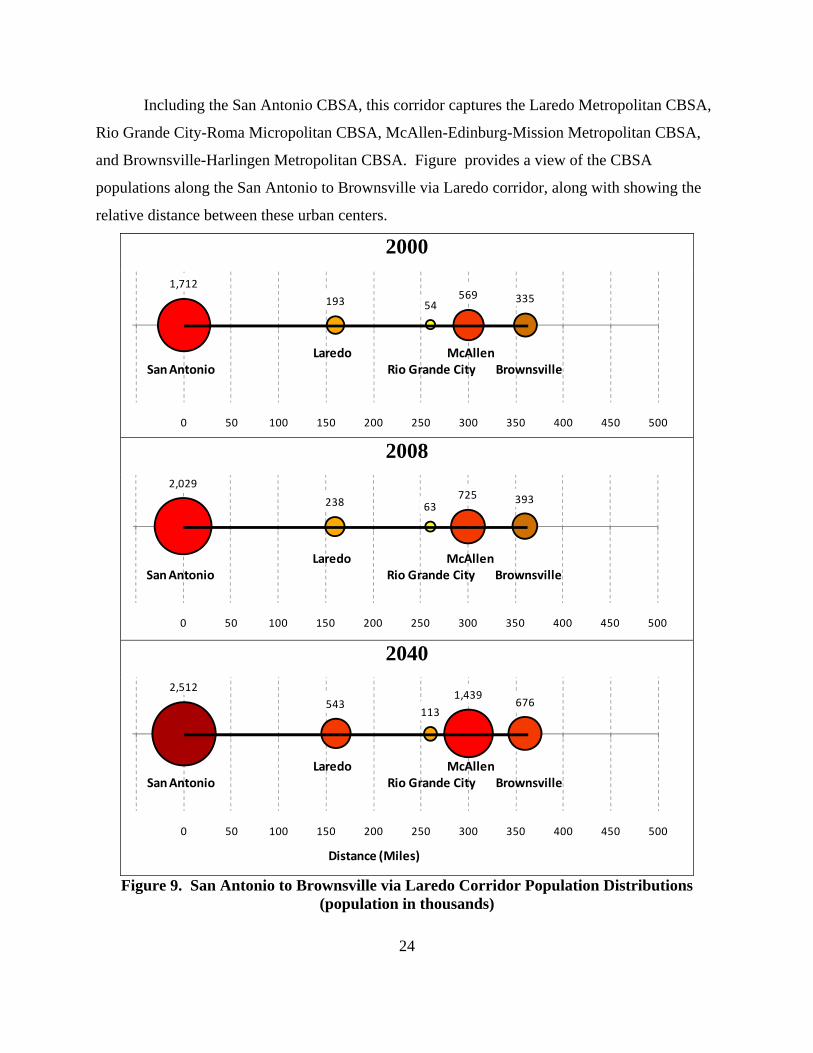
Including the San Antonio CBSA, this corridor captures the Laredo Metropolitan C
Rio Grande City-Roma Micropolitan CBSA, McAllen-Edinburg-Mission Metropolitan CBSA,
and Brownsville-Harlingen Metropolitan CBSA. Figure provides a view of the CBSA
populations along the San Antonio to Brownsvil
distance between these urban centers.
2000 1,712
193 54569 335
Laredo McAllenSan Antonio
50 0 50 100 1 350 400 450 500
Rio Grande City Brownsville
50 200 250 300
2008 2,029
238725 393
63
0 0 50 100 150 200 250 300 350 400 450 500
McA An Ri ande Cit rown
Laredo
lleny BSan tonio o Gr sville
5 2040
2,512543
113
1,439676
50 0 50 100 150 200 250 300 350 400 450 500
Distance (Miles)
Laredo McAllenSan Antonio Rio Grande City Brownsville
Figure 9. San Antonio to Brownsville via Laredo Corridor Population Distributions
(population in thousands)

25
iles in length, with the segment between San
60 miles and the segment between Laredo and Rio Grande City
making
ted
le in 2040. A tremendous level of
growth is expected for the McAllen-Edinburg-Mi
The corridor is approximately 360 m
Antonio and Laredo making up 1
up 100 miles. The portion of the corridor between McAllen and Brownsville is fairly
close together with several major urban areas.
Both Figure 9 and Table 10 provide the 2000 and 2040 populations of the corridor
CBSAs, along with the distances between the urban areas. The San Antonio CBSA is expec
to grow from 1.7 million people in 2000 to 2.5 million peop
ssion CBSA, with projections of an increase
from 569,000 in 2000 to over 1.4 million by 2040. Table 10 also includes estimated travel times
based on an average trip speed. Averaging 60 mph the entire trip takes six hours, compared to
1 hour 48 minutes at 200 mph.
Table 10. San Antonio to Brownsville via Laredo CBSA Population, Distances, and Estimated Travel Times
Population Distance Travel Time (hours:minutes)
CBSA 2000 2008 2040 Segment Cumulative 60
mph 80
mph 110 mph
150 mph
200 mph
San Antonio 1,711,700 2,028,800 2,512,000 0 0 0:00 0:00 0:00 0:00 0:00 Laredo 193,100 238,300 542,600 160 160 2:40 2:00 1:27 1:04 0:48 Rio Grande 53,600 City
62,600 112,700 100 260 4:20 3:15 2:21 1:44 1:18
McAllen 5 0 69,500 725,000 1,439,500 40 300 5:00 3:45 2:43 2:00 1:3Brownsville 335,200 00 60 360 8 393,400 675,7 6:00 4:30 3:16 2:24 1:4

26
MARKET POTENTIAL
adway travel statistics for the San Antonio
to Brownsville via Laredo corridor. Projected population numbers are presented by the Texas
Invento
gth of
persons older than 65 years of age will increase from 10.3 percent in 2000 to 16.2
percent by 2040. Along the corridor there we
employed over 975,000 people i ally, her e rollment in 2006
was 73,451 students.
e 11. San Anto Brownsville via Laredo Demographics
This section lists several demographic and ro
State Demographer, while the roadway information comes from the TxDOT Road–Highway
ry Network (RHiNo) database and FHWA Freight Analysis Framework database.
Population, Economic Activity, and Special Generators
The combined population of the five CBSAs was over 2.8 million in 2000 and is
expected to grow to over 5.2 million by 2040 as shown in Table 1111. Using a corridor len
349 miles, the population per mile in 2000 was 8,203 people, while that value is expected to
grow to over 15,000 by 2040. Additionally, the portion of the population over 65 years of age is
expected to grow from 296,645 in 2000 to 858,473 people by 2040. This indicates that the
portion of
re an estimated 59,605 establishments that
n 2005. Fin the total hig ducation en
Tabl nio toData Element S nio to Ban Anto rownsville
Popu2000
2,863,107
lat on i
2040 5,282,527 Population per Mile*
2000
8,203 15,136 2040
Population - Over 65 200
858,473 0
2040
296,645
Employment No. of Employees (2005) No. of Employer Establishments (2005)
975,101 59,605
Total Public or Private University Enrollment (Fall 2006) 73,451 *Calculation using corridor length = 349 miles

27
le on this corridor. Commuter rail is being
planned for the lower Rio Grande Valley.
Corridor Travel Patterns: Commercial Air Carrier Service
The existing commercial airports within the San Antonio to Brownsville via Laredo
corridor include San Antonio International Airport (SAT), Laredo International Airport (LRD),
McAllen/Miller International Airport (MFE), Harlingen-Valley Airport (HRL), and
Brownsville/South Padre Island Airport (BRO). The air service market distance between SAT
and BRO is 233 miles, and between BRO and Dallas/DFW is 482 miles. In 2006, the total
number of air trips between San Antonio and Brownsville via Laredo was 77,410, which is a
3.24 percent decrease compared to 1996 figures. Between 1996 and 2008, specific indices for
the air travel demand for the San Antonio to Brownsville via Laredo corridor are shown in
Table 12.
Table 12. Air Travel Demand for Corridor San Antonio to Brownsville from 1996 to 2008
Corridor Travel Patterns: Intercity Passenger Rail
No existing passenger rail service is availab
Year Number of
Flights Number of Passengers
Number of Seats Load Factor
1996 1,453 125,663 186,552 0.67 2008 1,331 107,729 175,228 0.61
1996-2008 (Annual percent change) -0.65% -1.10% -0.47% -0.67%
In 2006, the average number of scheduled flights per day on the corridor between San Antonio
and Brownsville is three flights per day.
Corridor Travel Patterns: Highway
The 10-year growth in the AADT for the entire corridor is shown in Figure 10. The
annual growth between 1997 and 2000 was 5.10 percent, as shown in

28
Table 1. ted In 2006 the overall corridor AADT was 28,689 vehicles per day, with the expec
2035 value to reach over 60,500 vehicles per day.
0
5,000
,000
,000
1997 1998 1999 2000 2001 2002 2003 2004 2005 2006
10WT
,000
15
D A
AD
T
20) ,000
/day
25,000
30
(veh
YEAR re 10. San Antonio to Brownsville via Laredo 10-Year Weighted AADT, 1997-2006
Figu
el statistics. The overall volume-to-capacity ratio along
0 representing a roadway at capacity. The
2035 pr
uce from 53
in 2035. Finally, trucks are expected to become a larger portion of the
traffic stream, increasing from
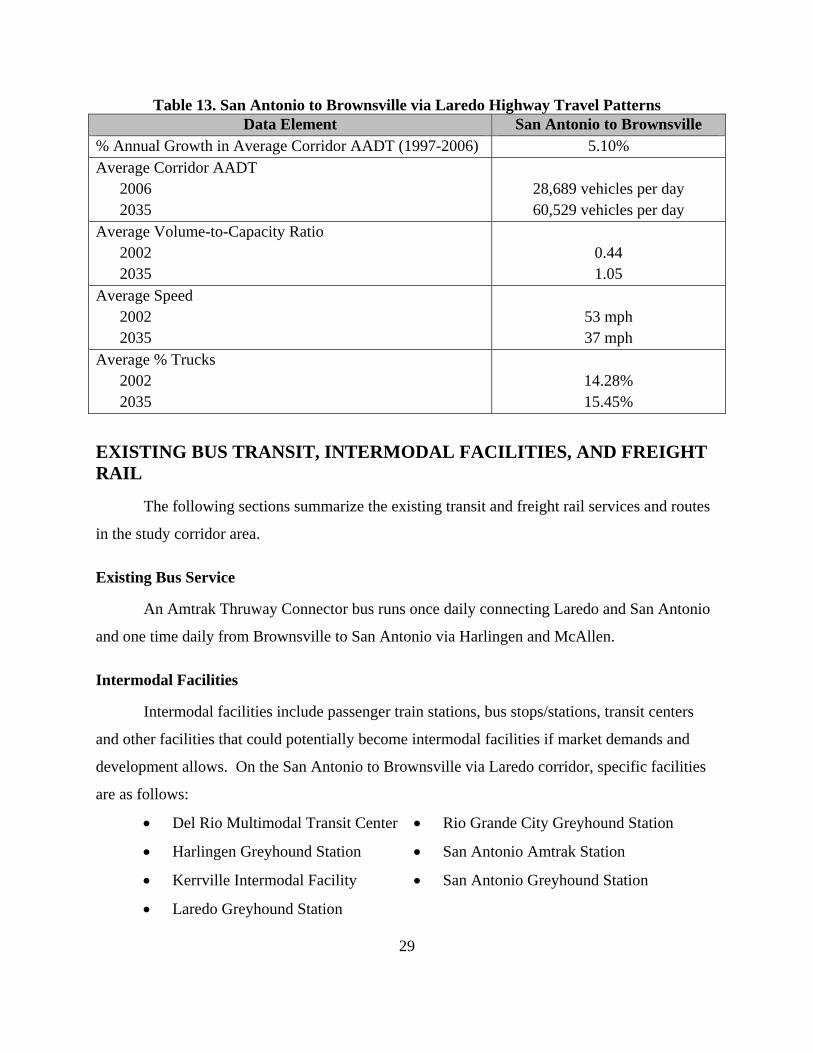
Table 13 shows the highway trav
the roadway corridors in 2002 was 0.44, with a 1.
ojected volume-to-capacity ratio worsens to an expected value of 1.05. As the corridor
exceeds the available capacity, the average speed for the corridor is expected to red
mph in 2002 to 37 mph
14.28 percent in 2002 to 15.45 percent by 2035.
29
sville via Laredo Highway Travel Patterns Table 13. San Antonio to BrownData Element San Antonio to Brownsville
% Annual Growth in Average Corridor AADT (1997-2006) 5.10% Average Corridor AADT
2006
28,689 vehicles per day 60,529 vehicles per day 2035
Average Volume-to-Capacity Ratio 2002 2035
0.44 1.05
Average Speed 2002 2035
53 mph 37 mph
Average % Trucks 2002 2035
14.28% 15.45%
EXISTING BUS TRANSIRAIL
T, INTERMODAL FACILITIES, AND FREIGHT
arize the existing transit and freight rail services and routes
in the s
o statio ops/st ansit
and other facili te te if em
allows e San Anton rownsville edo cor cific f s
ar s:
el Rio Multimodal Transit Center
reyhound Station • San Antonio Amtrak Station
The following sections summ
tudy corridor area.
Existing Bus Service
An Amtrak Thruway Connector bus runs once daily connecting Laredo and San Antonio
and one time daily from Brownsville to San Antonio via Harlingen and McAllen.
Intermodal Facilities
Interm dal facilities inclu
ties that could po
de passenger train
ntially become in
ns, bus st ations, tr
market d
centers
rmodal facilities ands and
development . On th io to B via Lar ridor, spe acilitie
e as follow
• D
• Harlingen G
• Kerrville Intermodal Facility
• Laredo Greyhound Station
• San Antonio Greyhound Station
• Rio Grande City Greyhound Station

30
• McKinney
The San Antonio West Side M ter has been proposed to be another intermodal
c
ransit Agencies
ions
in Texas. There are in total 12 existing transit agencies along the corridor, namely:
ransit • McAllen Express
Existing Freight Rail Operations
There is one existing Union Pacific-owned freight rail line parallel to Interstate 35 within
the corridor between San Antonio to Laredo. No rail service exists between Laredo and the Rio
Grande Valley area where service is provided by shortline rail companies. Table represents the
current train volumes provided by the Class I railroads and as determined through various freight
rail mobility studies conducted by TxDOT. Future train volumes per rail line segment are based
on a 3% annualized growth rate. Table 14. Segment Density and Rail Volumes
Greyhound Station
ultimodal Cen
enter in this corridor.
T
The San Antonio to Brownsville via Laredo corridor goes through four planning reg
• Alamo Area Regional T
• Brownsville Urban Transit
• Capital Area Rural Transportation
System (CARTS)
• El Metro Transit
• El Aguila Rural Transportation
• Harlingen Express
• Rainbow Lines
• Rio Metro
• Rio Transit
• The Wave-South Padre Island
• VIA Metropolitan Transit
Segment Current Volume (trains per day)
Future Volume* (trains per day)
Growth (trains per day)
Percent Growth
Segment Density
(MGTM/Mi) San Antonio
to Laredo 15-25 40-60 25-35 140-170 30-35
Laredo to Brownsville
No freight rail service
*by year of 2035
Table 15 represents the current (2007) and future (2035) levels-of-service as indicated by
the National Rail Freight Infrastructure Capacity and Investment Study (2007).

31
Table 15. Current and Future Levels-of-Service
Segment Current LOS Future LOS - Unimproved
Future LOS - Improved
San Antonio to Laredo A, B, C F A, B, C Laredo to Brownsville No freight rail service
2) SAN ANTONIO TO BROWNSVILLE VIA CORPUS CHRISTI
CORRIDOR OVERVIEW
From San Antonio, there are several routes in which to travel to Brownsville. Another
route investigated as part of research project 0-5930 travels south from San Antonio along I-37
to Corpus Christi and US 77 south through Harlingen and Brownsville. This route captures the
port city of Corpus Christi but does not directly capture the growing areas of McAllen and
Edinburg to the west of Brownsville. Figure shows the San Antonio to Brownsville via Corpus
Christi corridor examined in Project 0-5930.

Figure 11. San Antonio to Brownsville via Corpus Christi
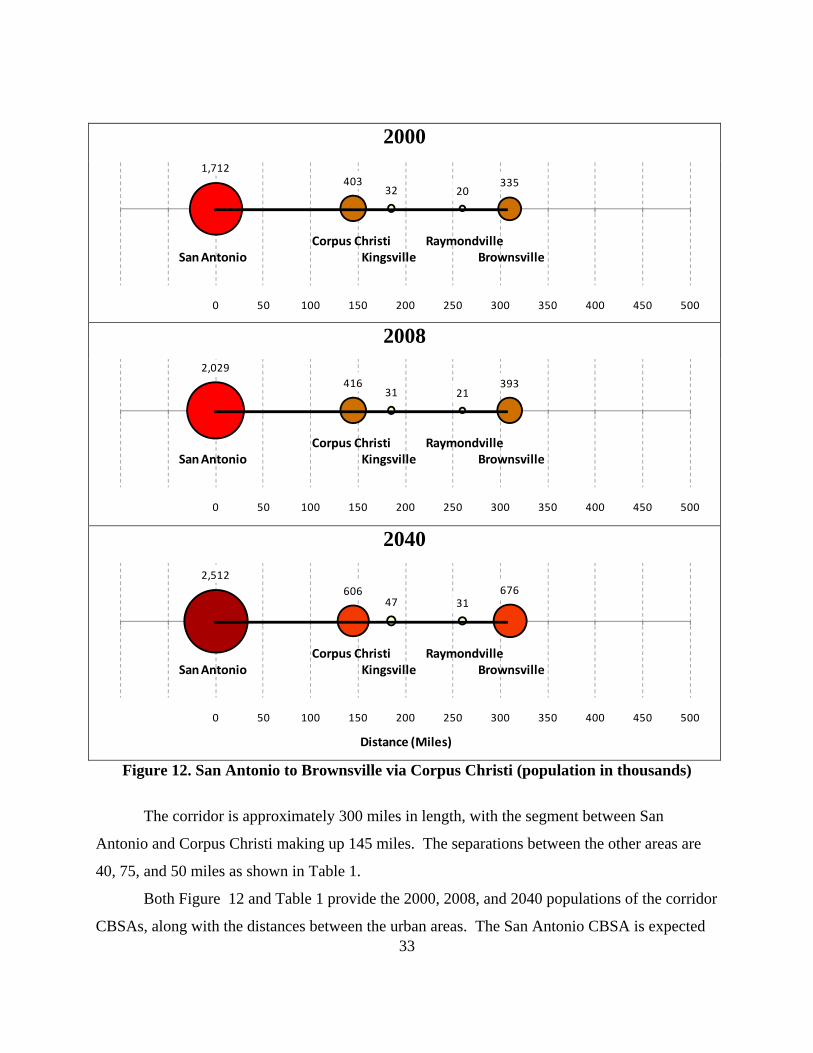
Including the San Antonio CBSA, this corridor captures the Corpus Christi metropolitan
CBSA, Kingsville micropolitan CBSA, Raymondville micropolitan CBSA, and Brownsville-
Harlingen metropolitan CBSA. Figure 12 shows the CBSA populations along the San Antonio
to Brownsville via Corpus Christi corridor, along with a view of the relative distance between
these urban centers.
32
2000 1,712
40332 20
335
0 5 00 2 250 0 0
Co i ymSa gsvil wnsvi
‐100 ‐5 0 0 1 150 00 300 350 400 45 5 0
rpus ChristKin
Ra le
ond levilBron Antonio lle
2008 2,029
41631 21
393
0 0 50 100 150 200 250 300 350 400 450 500‐100 ‐5
Corpus Christi RaymondvilleSan Antonio Kingsville Brownsville
2040 2,512
60647 31
676
‐100 ‐50 0 50 100 150 200 250 300 350 400 450 500
Distance (Miles)
Corpus Christi RaymondvilleSan Antonio Kingsville Brownsville
Figure 12. San Antonio to Brownsville via Corpus Christi (population in thousan
The corridor is a
33
ds)
pproximately 300 miles in length, with the segment between San
Antonio an eas are
iles as 1.
th Figure 12 and Table 1 provide the 2000, 2008, and 2040 populations of the corridor
CBSAs, along with the distances between the urban areas. The San Antonio CBSA is expected
d Corpus Christi making up 145 miles. The separations between the other ar
40, 75, and 50 m shown in Table
Bo

34
on people in 2000 to 2.5 million people by 2040. The Brownsville-
Harlingen CBSA is expected to almost double, from 335,200 in 2000 to over 675,000 by 2040.
io to Brownsville via Corpus Christi CBSA Population, Distances, and Estimated Travel Times
to grow from 1.7 milli
Table 16. San Anton
Population Distance Trave s:minutes) l Time (hourCBSA
2000 2008 2040 Segment Cumulative 60
mph 80
mph 110 mph
150 mph
200 mph
San Antonio 1,711,700 2,028,832 2,512,000 0 0 0:00 0:00 0:00 0:00 0:00 Corp 145 145 2:25 1:48 1:19 0:58 0:43 us Christi 403,300 415,882 606,100 King 32,000 30,978 47,400 40 sville 185 3:05 2:18 1:40 1:14 0:55 Raymondville 20,100 20,975 30,500 75 260 4:20 3:15 2:21 1:44 1:18 Brownsville 335,200 393,355 675,700 50 310 5:10 3:52 2:49 2:04 1:33
MARKET POTENTIAL
r the San
Antonio to Brownsville via Corpus Christi corridor. Projected population numbers are presented
comes from the TxDOT Road–
Highwa
xpected to grow from 274,508 in 2000 to 703, 433 people by 2040. The
portion of persons older than 65 years of age will increase from 10.9 percent in 2000 to 18.1
percent by 2040. Along the corridor there were an estimated 55,162 establishments that
employed over 904,126 people in 2005. Finally, the total higher education enrollment in 2006
was 73,451 students.
Table 17. San Antonio to Brownsville via Corpus Christi Demographics
This section demonstrates several demographic and roadway travel statistics fo
by the Texas State Demographer, while the roadway information
y Inventory Network (RHiNo) database and FHWA Freight Analysis Framework
database.
Population, Economic Activity, and Special Generators
The combined population of the five CBSAs was over 2.5 million in 2000 and is
expected to grow to over 3.8 million by 2040 as shown in Table 17Table . Using a corridor
length of 280 miles, the population per mile in 2000 was 8,936 people. That value is expected to
grow to an average over 13,000 per mile by 2040. Additionally, the portion of the population
over 65 years of age is e
Data Element San Antonio to Brownsville Population
2000 2040
2,502,255 3,871,808
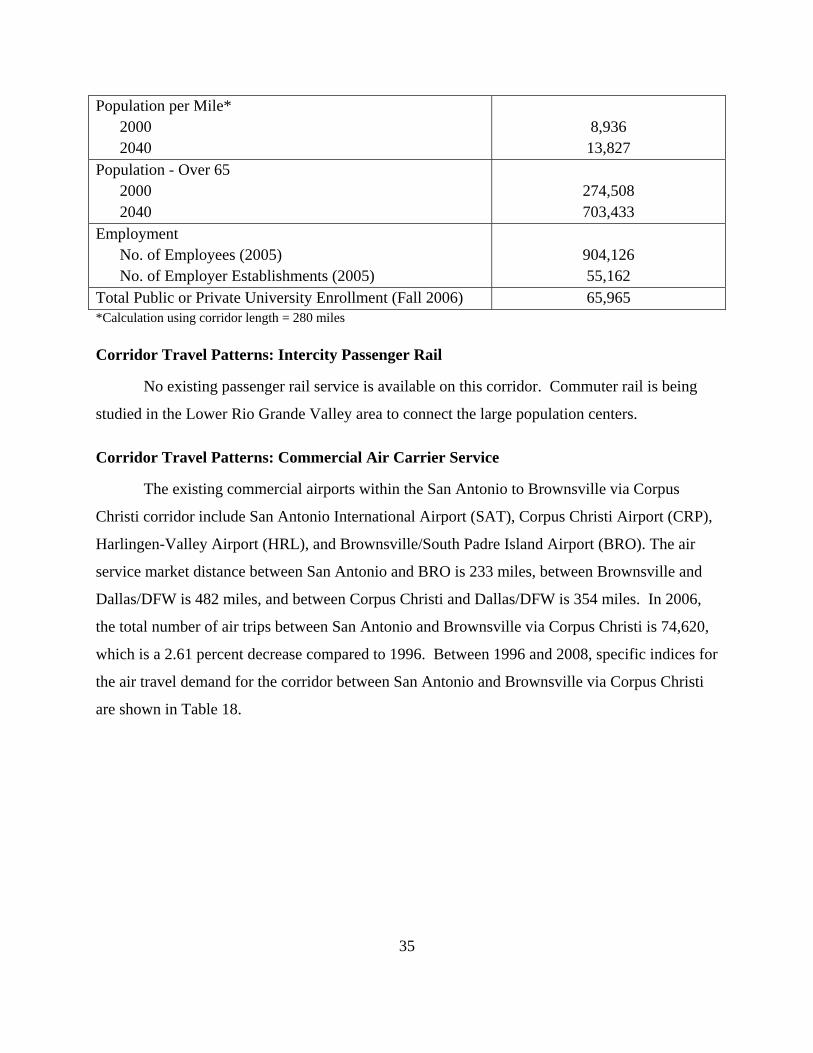
35
Population per 2000 2040
36 ,827
Mile* 8,913
Population - Over 65 2000
4,508
2040 27703,433
Employment
55,162 No. of Employees (2005) No. of Employer Establishments (2005)
904,126
Total Public or Private University Enrollment (Fall 2006) 65,965 *Calculation using corridor length = 280 miles
Corrid
g
Corridor Travel Patterns: Commercial Air Carrier Service
The existing commercial airports within the San Antonio to Brownsville via Corpus
Christi corridor include San Antonio International Airport (SAT), Corpus Christi Airport (CRP),
Harlingen-Valley Airport (HRL), and Brownsville/South Padre Island Airport (BRO). The air
service market distance between San Antonio and BRO is 233 miles, between Brownsville and
Dallas/DFW is 482 miles, and between Corpus Christi and Dallas/DFW is 354 miles. In 2006,
the total number of air trips between San Antonio and Brownsville via Corpus Christi is 74,620,
which is a 2.61 percent decrease compared to 1996. Between 1996 and 2008, specific indices for
the air travel demand for the corridor between San Antonio and Brownsville via Corpus Christi
are shown in Table 18.
or Travel Patterns: Intercity Passenger Rail
No existing passenger rail service is available on this corridor. Commuter rail is bein
studied in the Lower Rio Grande Valley area to connect the large population centers.

Table 18. Air Travel Demand for Corridor from 1996 to 2008
Year Number of
Flights Number of Passengers
Number of Seats Load Factor
1996 1,825 131,327 210,115 0.67 2008 1,331 107,729 175,228 0.61
1996-2008 (Annual percent change) -2.08% -1.38% -1.28% -0.13%
In 2006, the average number of scheduled flights per day on the corridor between San Antonio
three flights per day.
Corridor Travel Patt
annual growth between 1997 and 2000 was 2.65 percent, as shown i
overall corridor AADT was 24,829 vehicles per day, with the expected 2035 value to reach over
and Brownsville via Laredo is
erns: Highway
The 10-year growth in the AADT for the entire corridor is shown in Figure 13. The
n Table 19. In 2006 the
49,173 vehicles per day.
CORRIDOR 17 - SATBVN10-YEAR WEIGHTED AADT
0
10,000
15,000
25,000
WTD
AA
DT
20,000
(veh
/day
)
5,000
1997 1998 1999 2000 2001 2002 2003 2004 2005 2006
YEAR
Figure 13. San Antonio to Brownsville via Corpus Christi 10-Year Weighted AADT, 1997-2006
36

37
way travel statistics for this corridor route. The overall volume-to-
capacit
ph in 2002 to 45 mph in 2035. Finally, trucks are expected to
erns
Table 1 shows the high
y ratio in 2002 was 0.46, with a 1.0 representing a roadway at capacity. The 2035
projected volume-to-capacity ratio weighted over the corridor worsens to an expected value of
1.00. As the corridor approaches the available capacity, the average speed for the corridor is
expected to reduce from 58 m
remain slightly under 14 percent of the traffic mix.
Table 19. San Antonio to Brownsville via Corpus Christi Highway Travel PattData Element San Antonio to Brownsville
% Annual Growth in Average Corridor AADT (1997-2006) 2.65% Average Corridor AADT
2006
2035 24,829 vehicles per day 49,173 vehicles per day
Average Volume-to-Capacity Ratio 2002 203
5 0.46 1.00
Average Speed 2002 2035
58 mph 45 mph
Average % Trucks 2002 2035
13.6% 13.9%
SPA S TRANSIT ES, AND FREIGHT
arize th and routes
Existing Bus Service
An Amtrak Thruway Connector bus runs one time daily from Brownsville to San
. Valley Transit Company, a Greyhound subsidiary in the
United o
SENGER RAIL, BU , AIR SERVICRAIL
The following sections summ e existing transit and freight rail services
in the study corridor area.
Antonio via Harlingen and McAllen
States which serves the Texas-Mexico border area, provides bus service to San Antoni
in this corridor two times daily and one time daily via Alice and McAllen.

38
allows. On the San Antonio to Brownsville via Corpus Christi corridor, specific
facilities are as follows:
• Brownsville Greyhound Sta
• Cor nd
arl tation
errville I
Kingsville Greyhound Station
San Antonio Amtrak Station
• San A o Grey t
est Side Multimodal Center has been proposed to be another intermodal
corridor.
, namely:
• Alamo Are
• unity Action Agency
an Transi
System (CARTS)
•
•
• Rio Transit
l Economic Assistance League
(REAL)
Intermodal Facilities
Intermodal faculties include passenger train stations, bus stops/stations, transit centers
and other facilities that could potentially become intermodal facilities if market demands and
development
tion
Station
•
• pus Christi Greyhou
ingen Greyhound S• H
• K
The San Antonio W
ntermodal Facility
ntoni hound Sta ion
center in this
Transit Agencies
The San Antonio to Brownsville via Corpus Christi corridor goes through three planning
regions in Texas. There are in total 12 existing transit agencies along the corridor
a Regional Transit • McAllen Express
Bee Comm
(BCAA)
• Brownsville Urb t
• Capital Area Rural Transportation • Rura
• Corpus Christi Regional Transit
Authority (CCRTA)
• Harlingen Express
• Kleberg County Human Services
(KCHS)
• The B (Corpus Christi)
• The Wave-South Padre Island
• VIA Metropolitan Transit
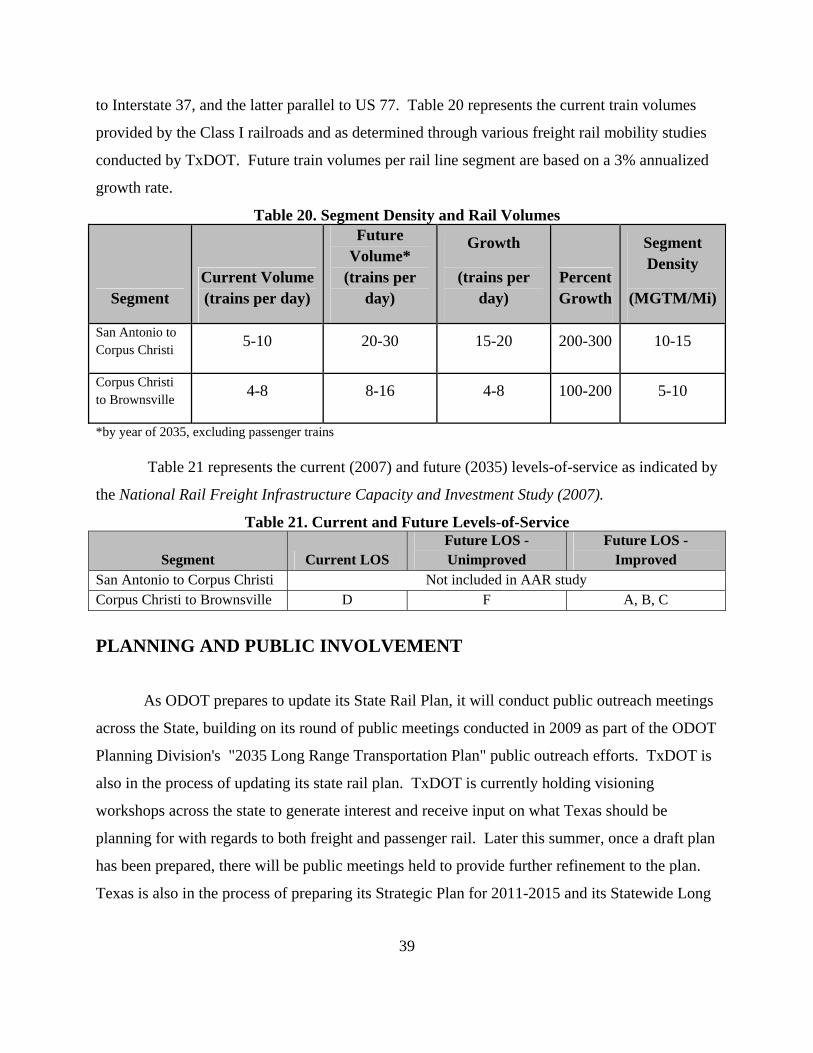
Existing Freight Rail Operations
There are two existing Union Pacific-owned freight rail lines within the corridor: San
Antonio to Corpus Christi and Corpus Christi to Brownsville. The former rail line goes parallel
Rainbow Lines
Rio Metro
39
umes
ed through various freight rail mobility studies
conduc
to Interstate 37, and the latter parallel to US 77. Table 20 represents the current train vol
provided by the Class I railroads and as determin
ted by TxDOT. Future train volumes per rail line segment are based on a 3% annualized
growth rate.
Table 20. Segment Density and Rail Volumes
Segment Current Volume (trains per day)
Future Volume*
(trains per day)
Growth
(trains per day)
Percent Growth
Segment Density
(MGTM/Mi)
San Antonio to Corpus Christi 5-10 20-30 15-20 200-300 10-15
Corpus Christi to Brownsville 4-8 8-16 4-8 100-200 5-10
*by year of 2035, excluding passenger trains
Table 21 represents the current (2007) and future (2035) levels-of-service as indicated by
the National Rail Freight Infrastructure Capacity and Investment Study (2007).
Table 21. Current and Future Levels-of-Service
Segment Current LOS Future LOS - Unimproved
Future LOS - Improved
San Antonio to Corpus Christi Not included in AAR study Corpus Christi to Brownsville D F A, B, C
PLAN
date its State Rail Plan, it will conduct public outreach meetings
across the State, building on its round of public m
Planning Division'
il plan. TxDOT is currently holding visioning
workshops across the state to generate interest and receive input on what Texas should be
planning for with regards to both freight and passe
has been pr
NING AND PUBLIC INVOLVEMENT
As ODOT prepares to up
eetings conducted in 2009 as part of the ODOT
s "2035 Long Range Transportation Plan" public outreach efforts. TxDOT is
also in the process of updating its state ra
nger rail. Later this summer, once a draft plan
epared, there will be public meetings held to provide further refinement to the plan.
Texas is also in the process of preparing its Strategic Plan for 2011-2015 and its Statewide Long

40
ations. TxDOT and ODOT work with the Heartland Flyer
Coalitio
corridors in the context of the purpose and need for
intercit iteria incorporated population and demographic data,
intercit
dor must include rail improvements
ht service
Range Transportation Plan. Both of these plans are multimodal in nature and are being
developed in concert with the Texas Rail Plan.
TxDOT is required by state law to coordinate a long term statewide passenger rail plan.
This includes coordination with other governmental entities as well as private entities. TxDOT
has a history of good working relationships with various rail districts, cities, counties and
economic development corpor
n, a publicly-led support organization aimed at increasing and improving Heartland Flyer
passenger Rail service and operations. Both departments have financially supported this route
for many years.
A recent study of 18 corridors in Texas highlights the potential for intercity rail in the I-
35 Corridor in Texas, especially that portion of the corridor connecting the Dallas – Fort Worth
metropolitan area (DFW) to San Antonio (Report No. FHWA/TX-09/0-5930-1, May 2009).
Evaluation criteria were used to compare
y rail or express bus transit. The cr
y highway and air travel data, and intercity highway and air travel capacity data. The I-35
Corridor between DFW and San Antonio ranked either first or second in order of intercity transit
needs among the 18 corridors.
In November 2008, the Corridor Advisory Committee, in A Citizen’s Report on the
Current and Future Needs of the I-35 Corridor, made the following recommendations:
• The I-35 Corri
• Rail improvements will include both high-speed passenger rail as well as
efficient freig
• The corridor should provide for safety, capacity, and multi-modal
transportation choices.
I-35 Corridor Segment Committees
TxDOT facilitated the creation of the MY 35 program as a citizen-driven process to
develop a blueprint for improving transportation in the I-35 Corridor. Four Corridor Segment
Committees (CSC), each representing a portion of the I-35 Corridor, are developing regional

41
mbers represent metropolitan planning organizations,
and other
stakeholders with interests in
potential solutions in th
plans for their planning areas. CSC me
counties, cities, chambers of commerce, economic development organizations,
transportation. The CSCs are identifying transportation needs and
eir regions, and will lead public involvement and outreach efforts to
solicit additional public input. Each CSC will create a regional transportation blueprint for their
portion of the I-35 Corridor.
Three of the four committees have identified commuter rail improvements as options for
consideration in their planning regions. These regions in combination include all of I-35 from
the Texas – Oklahoma boundary to San Antonio. High-speed passenger rail was specifically
suggested as possible solutions for that portion of I-35 connecting the Dallas – Fort Worth
metropolitan area (DFW) to San Antonio. Committees suggested that high-speed passenger rail
could link the DFW, Waco, Austin, and San Antonio metropolitan areas and provide an option
for travelers driving between these cities.
I-35 Corridor Advisory Committee
The regional CSC plans will be submitted to the citizen-led Corridor Advisory
Committee (CAC). This 18-m
ember committee is made up elected officials, transportation
professionals, and interested citizens from cities throughout the I-35 Corridor. The CAC’s
mission includes:
• study the impact of corridor-wide issues, including economic, political, societal,
demographic, population trends, use of existing / new / upgraded facilities, multi-modal
solutions, and financing options;
• make recommendations on corridor planning, development, and public
involvement; and
• enhance participation and input between TxDOT and affected communities,
governmental entities, and interested parties.
Based on the regional plans created by the segment committees, the CAC will create a
comprehensive MY 35 plan outlining transportation solutions for the entire I-35 Corridor. The
MY 35 plan will serve as TxDOT’s blueprint for transportation projects throughout the corridor.
42
ENVIRONMENTAL QUALITY
ck area and the San Antonio area signed Early Action Compact (EAC)
agreements with the EPA in 2004 to avoid being designated non-attainment areas. The Austin-
Round
ected to continue in
the coming decades. EPA proposals to change the defined limits for measuring various
pollutants also put the A
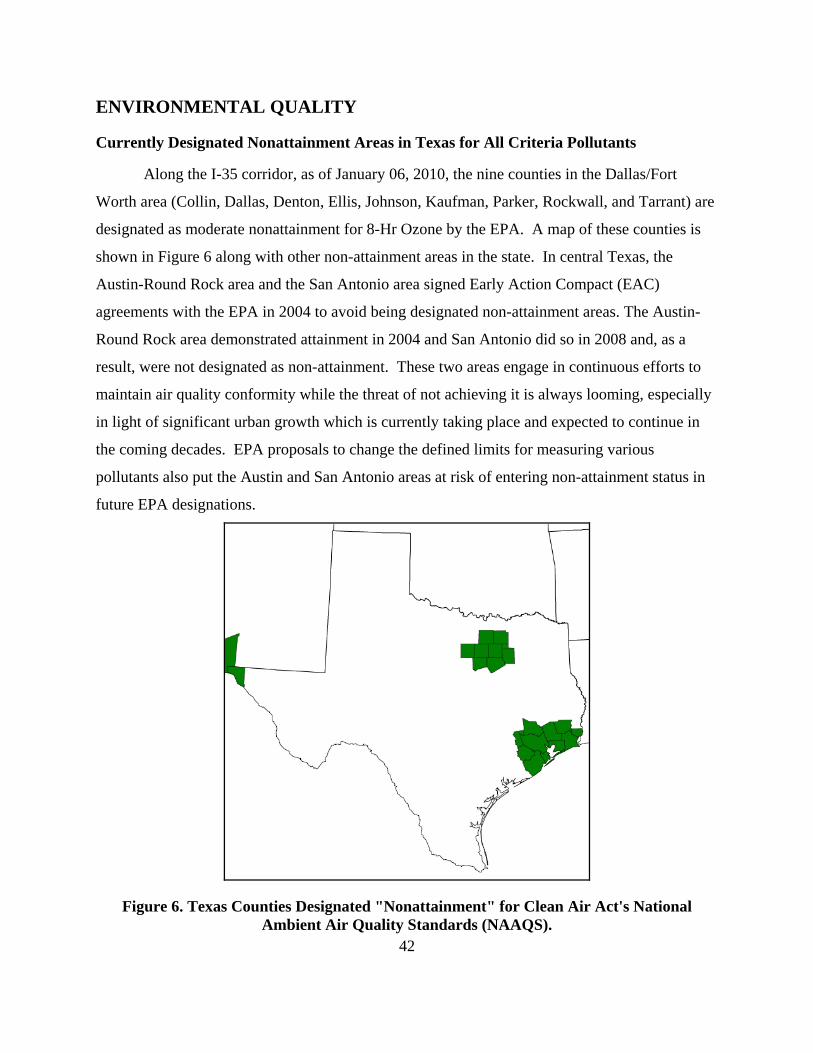
Currently Designated Nonattainment Areas in Texas for All Criteria Pollutants
Along the I-35 corridor, as of January 06, 2010, the nine counties in the Dallas/Fort
Worth area (Collin, Dallas, Denton, Ellis, Johnson, Kaufman, Parker, Rockwall, and Tarrant) are
designated as moderate nonattainment for 8-Hr Ozone by the EPA. A map of these counties is
shown in Figure 6 along with other non-attainment areas in the state. In central Texas, the
Austin-Round Ro
Rock area demonstrated attainment in 2004 and San Antonio did so in 2008 and, as a
result, were not designated as non-attainment. These two areas engage in continuous efforts to
maintain air quality conformity while the threat of not achieving it is always looming, especially
in light of significant urban growth which is currently taking place and exp
ustin and San Antonio areas at risk of entering non-attainment status in
future EPA designations.
Figure 6. Texas Counties Designated "Nonattainment" for Clean Air Act's National Ambient Air Quality Standards (NAAQS).

43
to the
he form of improved
traffic flow on the existing roadway system. Intercity passenger rail service is shown to have an
impact r
s
isruption and
expense of highway expansion. Moreover, increasing rail capacity is as simple as adding another
rail car
ed that “the
average intercity train produces 60 percent fewer CO2 emissions on a per passenger mile basis
than th
s in Central
Texas, a region struggling to comply with federal air quality standards. Intercity high speed
passenger rail will benefit air qual
hicle congestion, fuel consumption and emissions
on inte
vehicle travel are available in the major cities,
There are tangible air quality and congestion management benefits that accrue
public from the existence of the rail services and to the highway users in t
on congestion, and thus pollution, when targeted to areas where roads are at or near thei
design capacity. As more traffic uses these roads, travel time increases sharply and the delay
are felt by all travelers. An intercity rail line that parallels IH-35 would potentially alleviate
highway traffic.
Rail adds capacity to the regional transportation system without the d
or providing more frequent service. And according to Lone Star Rail, at peak hours Lone
Star Rail service can carry the equivalent of two additional lanes on I-35.
According to Will Kempton, Director of the California Department of Transportation, in
testimony provided to the House Committee on Transportation and Infrastructure, “Intercity
passenger rail is estimated to use at least 15 percent less energy on a per passenger mile basis
than the airlines and 21 percent less than the automobile.” Mr Kempton also not
e average auto and about half the green house gas emissions of an airplane.”
A viable intercity rail system would also benefit the environment by limiting urban
sprawl and concentrating development in close proximity to the rail lines.
Vehicles are a primary source of ozone-forming and greenhouse gas emission
ity in Central Texas by providing a viable, fuel efficient option
to automobile or air travel, thereby reducing ve
rregional highways, as well as air traffic congestion and related emissions at airports.
There is considerable passenger travel between cities in Central Texas. There are several
universities located in cities on the IH 35 corridor as well as state government and major
employers. While alternatives to single occupant

44
there a
rtunately, improvements in technology have had a
consid
areas in the
ation, vehicle miles of travel are predicted to increase at a much higher rate than population
growth. Therefore, in order to reduce criteria pollutants, even though we have cleaner vehicles,
ravel. Reduction in the growth of vehicle miles of travel
require
is to reduce the length of most trips and to identify and implement strategies to
encoura
daily from North Bay roads.
re little to no viable alternatives available between cities, leading to increased congestion
and air pollution. Intercity passenger rail would remove vehicles from the road, reducing
emissions and improving travel conditions for the vehicle trips that remain.
In the San Antonio – Bexar County Metropolitan Planning Organization (SA-BC MPO)
region, on-road vehicles are the largest single source of all ozone precursors, the gases that mix
and react in the atmosphere to make ozone. Fo
erable effect on the reduction of air pollution (emissions from new vehicles have declined
over time as emission controls and fuel efficiency have improved). Further improvements in
fossil-fuel burning vehicle emissions will, however, have less significant impacts.
According to the Competitive Enterprise Institute, throughout the metro
n
we must reduce vehicle miles of t
s behavioral changes rather than solely relying on improvements in technology. The
challenge
ge walking, bicycling and transit use, including intercity passenger rail.
In the San Antonio area, vehicle miles of travel are expected to increase. In the next 25
years, population in the area is expected to increase 1.4% annually estimating over 2 million
people in the region by 2035. During the same period, employment is anticipated to increase 2%
per year with 1.2 million persons employed in the area by 2035. Therefore the area must rely on
other alternatives to achieve the emission reductions it needs to improve air quality.
The following reference the reality of the environmental benefits noted by intercity
passenger rail on a local level and nationally:
• According to the California based Sonoma – Marin Area Rail Transit’s
(SMART) Environmental Impact Report, SMART will prevent at least 30 million pounds
of greenhouse gases from entering the atmosphere each year by removing 5,300 car trips

45
-speed rail network
would reduce car travel by 29 million trips and air travel by nearly 500,000 flights
assenger, 40 percent less than a car
The basis of any effective planning effort rests primarily on a determination of the area’s
old income, and land
use) and futur used
2005 a the future years, various federal and state
government data sources were used
year increments to the year 2035. For the first time, the MPO engaged the public and policy
makers in a discussion of alternative growth plans for the area.
as initiated to engage residents and policy makers in a discussion of
the region’s future growth and development patterns. Scenario planning enhances the traditional
transportation
factors th n system. Factors include an aging
population, la l concerns. In scenario planning,
citizens and ider alternative approaches, or “scenarios” to
• Nationally, The Center for Clean Air Policy and the Center for
Neighborhood Technology estimate that completion of a national high
annually. Additionally, they estimate that a national high-speed rail network would
reduce global warming pollution by 6 billion pounds, the equivalent of taking almost
500,000 cars off the road.
• Concerning energy savings, intercity passenger rail could reduce our
dependence on oil. According to a February 9, 2010 article by U.S. PIRG, the federation
of state Public Interest Research Groups (PIRGs), “On average, an Amtrak passenger
uses 23 percent less energy per mile than an airplane p
passenger, and 57 percent less than a passenger in an SUV or pickup truck.”
LIVABLE COMMUNITIES
The following serves as an example of one of the studies that has occurred along this
corridor.
base year demographics (population, household size, employment, househ
e projections of these demographics. The San Antonio-Bexasr County MPO
s the base year for this update of the MTP. For
for the population and employment forecast totals in five
Scenario Planning w
planning process by raising awareness of citizens and decision makers of the
at affect growth and impact our transportatio
nd use policies, economics, and environmenta
policy makers are asked to cons

46
shaping the region and u es between each approach. The ultimate goal
is to create a s
The Federal Highway Adm planning as an enhancement
of, not a replacement for, the traditio les communities
and tra
representatives from the Alamo Area
Water
ework for the development of scenarios. Generally, the group
consid
ng to consider other transportation
alternatives to travel in their daily life?
congestion levels;
• local, regional and world economy;
nderstanding the differenc
ustained quality of life for citizens and visitors in our region.
inistration (FHWA) sees scenario
nal transportation planning process. It enab
nsportation agencies to better prepare for the future. Scenario planning highlights the
major forces that may shape the future and identifies how the various forces might interact,
rather than attempting to predict one specific outlook. As a result, regional decision makers are
prepared to recognize various forces to make more informed decisions in the present and be
better able to adjust and strategize to meet tomorrow's needs.
The Demographic Working Group (comprised of
Council of Governments, Bexar County, City of San Antonio, CPS Energy, MPO, San Antonio
System, Texas Department of Transportation, and VIA Metropolitan Transit) began the
task of developing the initial fram
ered quality of life issues facing the region and expressed those issues in terms of
questions:
How far do people want to live from work, school or recreation activities?
• Are people willi
• How long are people willing to spend on a daily work
commute?
The group also considered:
• the amount of expected growth in the region based on the adopted
population and employment control totals;
• development trends over time;
•
47
evelopment scenarios were considered: Each growth pattern is distinct
and represents clear choices. All growth scenarios have the same population growth, job growth,
and new
• Current Growth Trends – the majority of new growth continues outside of
Loop 1604.
ment – beyond year 2015, several high-capacity
transit e region and the majority of new, higher density
growth these corridors.
new policies and incentives result in all
new growth occurring inside Loop 1604.
Although th challenge
existing thought patterns, basic stories can be created that bring these scenarios to life for
residen
large
transportation projects supporting single occupant auto driving may not be able to be built. Also
there is an increased awareness
• expected gas prices;
• air quality, climate change and other environmental concerns;
• future availability of transportation funding, and
• technological improvements.
In generating the scenarios, the Demographic Working Group realistically considered
what was achievable and in what timeframe. Plus the scenarios had to differ significantly from
traditional growth patterns in order to realize impacts to the transportation system using the
available tools. Three d
households. Differences in the scenarios are shown in where and how the land use in
our region occurs. The three growth scenarios are:
• Transit Oriented Develop
corridors are defined throughout th
is attracted to station locations in
• Infill Development – by year 2020,
e transit oriented development and infill development scenarios
ts and policy makers. Gas prices, while not as high as they were in the Fall of 2005,
were still higher than they were prior to 2005. State and federal transportation funding is
becoming more unreliable and without additional local participation in funding, many
of alternative fuels, the environment and policies that support a
sustainable economy.

48
e potential demographic growth scenarios (Current Trend Development, Transit
Oriented Development and Infill Development) and the selected growth scenario (combination
highest to lowest density, Central Business District, Urban Fringe, Urban Residential, Suburban
Geographic Information System Screening Tool (GISST) data layers were used to
identify
• Percent Agriculture Lands
• Federal and State Threatened and Endangered Species
bility. In utilizing the 2035 travel statistics,
Consistent with the emphasis on linking planning and environmental considerations,
MPO staff undertook an environmental analysis of the 2005 base year demographic scenario,
each of the thre
of Transit Oriented Development and Infill Development). For this analysis, the year 2035
population and employment distribution, at the traffic analysis zone level, of each of the growth
scenarios, was converted to ‘area type’ for ease of analysis. Area Types used were, in order of
Residential, and Rural.
high-level environmental encroachment differences between the base year dat1, the three
initial growth scenarios and the adopted growth scenario. The GISST data layers used were:
• Edwards Aquifer
• Percent Wetlands
• Percent Wildlife
• Managed Lands
• Total Maximum Daily Load (water quality), and
The environmental analysis showed the adopted scenario, combination of Transit
Oriented Development and Infill Development, had the lowest encroachment on the
environmental sensitivities identified above, followed by the Infill Development scenario.
In March 2009, the MPO’s Transportation Policy Board adopted a combined Transit
Oriented Development/Infill Development scenario for use in the 2035 MTP update with the
knowledge that concepts from both scenarios are centered around compact and mixed use
development, connectivity, accessibility and walka

49
the com sen scenario results in savings of over 1 million total hours of delay each
weekday and saves over $15 in cost of lost productivity per day over the Current Trend
Develo
MULTI-MODAL PLANNING PROCESS
The MPO’s typically address all types of transportation modes when considering its long
range
luding:
bicycle and pedestrian facilities, public transportation systems and roadway needs. See the
following as an exam
etropolitan area, a
greater burden will be placed on the transportation system. To accommodate traffic increases on
the roa anes and operational improvements will be needed. In addition
to congestion levels, factors considered when developing the future year roadway network
include
bined cho
pment.
In April 2009, the Transportation Policy Board unanimously approved a resolution
supporting the adopted combined scenario. The resolution is meant to share with other
municipalities and to communicate the desired long-term growth for the region, which ties in
nicely with the proposed intercity passenger rail line from Austin to San Antonio.
plan. Planning for the future transportation needs of the MPO regions require a
comprehensive look at the current transportation system, future demographics, and the
anticipated available funding for the area for transportation projects. For example, the San
Antonio metropolitan area's economy and environment depend heavily on the condition and
efficient performance of the regional transportation system. Recognizing the mobility needs of
the community and addressing those needs will eventually lead to improvements in the economy
and quality of life.
The MPO’s and their partner agencies look at all modes of transportation, inc
ple in the San Antonio region.
Roadway
As population and employment continue to grow in the San Antonio m
dway system, additional l
d impacts to neighborhoods, acceptability by the public, environmental concerns and
fiscal constraints. Because of this, regional leaders understand the importance of creating and
maintaining a multi-modal transportation system.
50
uality and the public interest in promoting alternative
transportation modes, the adoption of policies that encourage alternate transportation modes will
aid in r
and momentum toward improving pedestrian facilities as
well. This awareness began to develop in the early 1990s upon passage of the Americans with
Disabil
hed to help meet increasing pedestrian mobility needs.
egional pedestrian system.
• Provide a safe pedestrian system.
Engage the public in the transportation planning process.
Bicycling
Bicycling is a cost effective, energy efficient, clean, and a healthy way to travel. With
the growing concerns of congestion, air q
educing congestion, improving air quality, and enhancing the community’s quality of life.
The Regional Bicycle Master Plan and the City of San Antonio's adopted Master Plan and the
Bicycle Map publication support this objective. The MPO will continue to work to accomplish
these goals and implement the region’s Bicycle Master Plan.
Pedestrian
There is a continued awareness
ities Act (ADA). Roadway construction projects (capacity projects and rehabilitation
projects) within the Urbanized Area often include accessible pedestrian facilities. For example,
in 2006 an analysis was completed by the City of San Antonio to look at the gaps in pedestrian
facilities. As this momentum continues and is extended, we continue to get closer to a
comprehensive pedestrian facilities system that will accommodate pedestrian mobility needs.
The following goals were establis
• Develop a r
• Employ accessible, barrier-free, state-of-the-art design.
•
• Identify and efficiently use available funding.
Public Transportation
VIA Metropolitan Transit (VIA) is the local public transportation agency. It is a political
subdivision of the State of Texas, authorized by State Enabling Legislation to receive locally-
generated sales tax income at a rate not to exceed one percent and subject to approval by voters

51
d in the November 1977 referendum that established VIA. VIA is also supported, to a
uch smaller degree, by fare box revenue, Federal Transit Administration (FTA) funding,
IA’s operational fleet consists of 393 full-size buses, 22 small buses, 19 streetcars,
for a to
and
kneeling vehicles to accommodate patrons who cannot negotiate steps. VIA’s entire bus fleet
le by 2008.
While
, its fiscal
t
nal
sit.
Intercity Passenger Rail
within the VIA service area. VIA currently collects sales tax income at a rate of one-half percent
as approve
m
advertising revenue, and interest income.
As of 2009, VIA serves nearly 7,000 bus stops and nine transit centers and park and ride
facilities. V
tal of 434 fixed route vehicles. For VIAtrans service, VIA operates 105 vans directly and
121 vans are operated by a private contractor. (Bus Operations Daily Report of Bus Availability
for October 7, 2004). Since 1990 all transit vehicles purchased by VIA have been equipped with
lifts or ramps to accommodate persons in wheelchairs. VIA has also purchased low floor
was accessib
The San Antonio region faces many challenges in the area of public transportation.
VIA has long been one of the most financially efficient transit systems in the country
constraints and service area characteristics somewhat limit what it can offer. However, VIA is
currently working on a long range comprehensive transportation plan for the region that looks a
the needs of the region and how the region is best served with different modes of traditio
transit and high-capacity tran
• Capital Metropolitan Transportation Authority in Austin and VIA
Metropolitan Transit in San Antonio
• Two rural transit districts Capital Area Rural Transportation System
(CARTS) and Alamo Rural Transit (ART)
• Representatives of business communities and the general public
Our region is very interested in this idea, as intercity passenger rail could contribute to
our economic growth by making it easier to travel between cities, fostering regional business
connections and encouraging an alternative to traveling on congested highways. Investments in

52
passenger rail can moreover reduce the need for costly investments in highways and airport
capacity.
Intercity passenger rail can provide convenient, efficient travel, where riders can travel directly
from downtown to downtown, even in inclement weather – avoiding the need to drive to outlying
airports.
Recently, VIA Metropolitan Transit, along with Lone Star Rail District and other
partners, produced feasibility and planning studies for a new facility on the western edge of
downtown, to be used not only by the Lone Star Rail, but by VIA’s Fredericksburg Road Bus
Rapid Transit line, providing service to the very busy South Texas Medical Center complex.
SAFETY
Over 11,400 crashes on the Texas portion of I-35 were reported in 2008. Of these
crashes, roadway sections covering approximately 26 percent of the 591-mile corridor
experienced crash rates in excess of the statewide average, and another three percent experienced
crash rates of more than double the statewide average. By shifting a share of total vehicle miles
traveled from automobile to high-speed rail, accident rates can be improved by lessening the
interaction among vehicles.