overview of non- medical use of pharmaceutical opioids in
TRANSCRIPT


Overview of non-medical use of
pharmaceutical opioids in Australia
27 - 28 March 2018, QT Hotel Canberra
Marissa Veld
Introduction• What are pharmaceutical opioids? Defining non-medical use
– Common pharmaceutical opioids, what is misuse, impacts of misuse– International context and trends in deaths
• Consumption patterns– National wastewater analysis and Pharmaceutical Benefits Scheme
data– Illicit and non-medical use (National Drug Strategy Household Survey)
• Harms and Treatment– Ambulance attendances and Hospitalisations – Treatment (Alcohol and Other Drug Treatment Services)
• Policy responses• Breaking down the data silos

What are pharmaceutical opioids?
• Pharmaceutical opioids are used to treat acute and chronic pain (including cancer and post operative) and opioid (including heroin) dependence
• Examples include oxycodone, codeine, fentanyl, methadone.
• The immediate effects include relief from pain and euphoria (feeling of wellbeing).

How do we define non-medical use?
Terminology
• The non-medical use of pharmaceuticals includes the use of over-the-counter or prescription-only drugs for non-therapeutic purposes, or prescription only drugs without a valid prescription
• Misuse includes non-medical use and the use of pharmaceuticals for genuine medical purposes:– without a valid prescription– prescribed in excessive quantities or frequencies– due to a drug dependence that has developed following medical
treatment
Can be difficult to determine from data

Impacts of non-medical use
Short term effects
• Constipation• Nausea• Sedation• Vomiting• Dizziness• Slowed breathing• Overdose (fatal and non-
fatal)
Long term effects
• Tolerance and dependence
• Decreased cognitive function
• Occlusion of blood vessels • Gastro-intestinal bleeding• Mental health problems
including depression

How big is the problem of non-medical use of opioids?
Source: 2016 National Drug Strategy Household Survey
Significant harms in the USA• In the USA, in 2015, almost 22,000 deaths—or about 62 deaths each day—
involved prescription opioids (including methadone and synthetic opioids, such as fentanyl and tramadol)
• In the 12 months between 2014 and 2015, the rate of deaths involving opioids increased 15.6% to 10.4 per 100,000 population
Australians appear less aware of the harms• 28% of Australians aged 14 and over perceived the non-medical use of
pharmaceuticals to be acceptable (up from from 23% in 2013)• This is higher than approval of the regular use of tobacco (15.7%) and cannabis
(14.5%).
Sources: Centers for Disease Control (2016) and Rudd et al 2016

Rate of drug induced deaths rising
Rate of drug-induced deaths for selected drug classes, 1999-2016
Source: ABS Cause of Death 2016
0
1
2
3
4
5
6
7
1997 1998 1999 2000 2001 2002 2003 2004 2005 2006 2007 2008 2009 2010 2011 2012 2013 2014 2015 2016
Rate per 100,000
Opioids Depressants Anti-depressants Non-Opioid Analgesics
Defined as deaths that can be directly attributable to drug use, as determined by toxicology and pathology reports

Opioid related deaths
Number of drug-induced deaths from opioids and heroin, 1999-2016
0
100
200
300
400
500
600
700
800
1999 2000 2001 2002 2003 2004 2005 2006 2007 2008 2009 2010 2011 2012 2013 2014 2015 2016
NumberMethadone Other opioids Other synthetic narcotics Heroin
Source: ABS Cause of Death 2016
In 2016, there were 550 drug-induced deaths from ‘other opioids’ (includes prescription painkillers such as oxycodone, morphine and codeine – but excludes heroin).
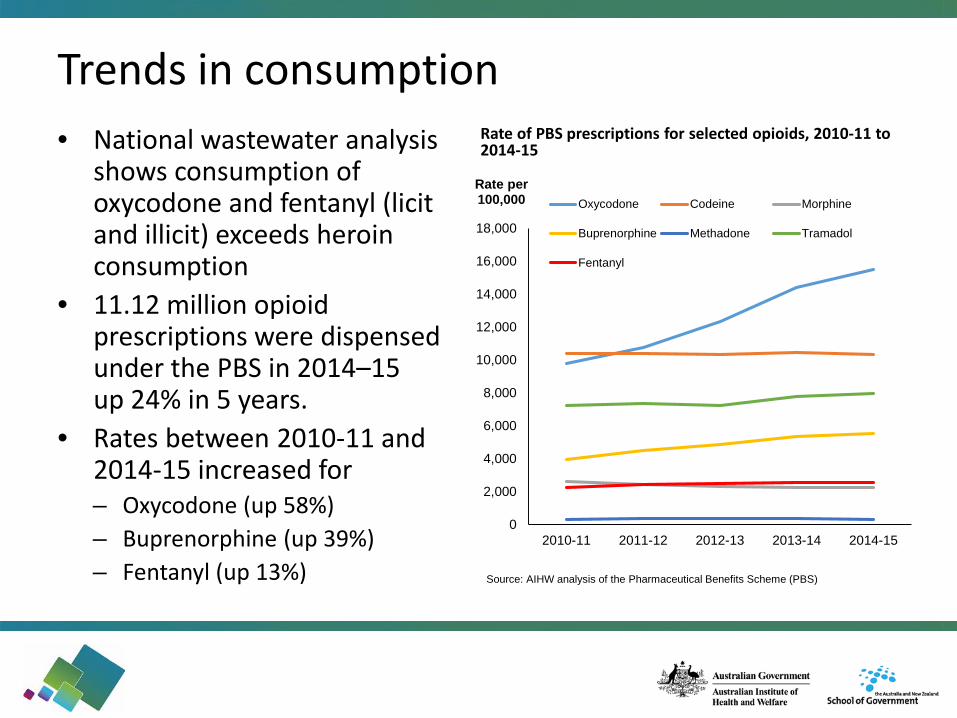
Trends in consumption • National wastewater analysis
shows consumption of oxycodone and fentanyl (licit and illicit) exceeds heroin consumption
• 11.12 million opioid prescriptions were dispensed under the PBS in 2014–15up 24% in 5 years.
• Rates between 2010-11 and 2014-15 increased for– Oxycodone (up 58%)– Buprenorphine (up 39%)– Fentanyl (up 13%)
0
2,000
4,000
6,000
8,000
10,000
12,000
14,000
16,000
18,000
2010-11 2011-12 2012-13 2013-14 2014-15
Rate per 100,000 Oxycodone Codeine Morphine
Buprenorphine Methadone Tramadol
Fentanyl
Rate of PBS prescriptions for selected opioids, 2010-11 to 2014-15
Source: AIHW analysis of the Pharmaceutical Benefits Scheme (PBS)

Self reported non-medical use2016 National Drug Strategy Household Survey - Self reported information on the use of pharmaceutical opioids for non-medical purposes
• 3.6% Australians had misused painkillers / opioids in the previous 12 months
• 3 in 4 (75%) of recent painkillers/ opioids misusers had misused an over the counter codeine product
• Non-medical use of painkillers / opioids was:– Higher for people in their 40s (4.5%); and users were generally older than
users of other illicit drugs– More prevalent for people living with mental illness (29%) or chronic pain
(16%)– Purchased over the counter at a pharmacy by around half (52%) of users – Reported by around 1 in 10 (10.6%) that they could not stop or cut down
if they wanted to

Frequency of non-medical use
Source: 2016 National Drug Strategy Household Survey
0
5
10
15
20
25
30
35
40
45
Pain-killers/ opioids Tranquillisers/sleeping pills Cannabis Meth/Amphetamines Cocaine
Percent
Male Female Persons
Daily or weekly use of selected drugs by sex, 2016
Of Australians who had misused pain-killers / opioids in the previous 12 months, 30% reporting do so daily or weekly, and use was higher for females (33%)

Harms from pharmaceutical opioids increasing
Ambulance data• No national data available• Victorian data show that of
the pharmaceutical-related ambulance attendances, 1 in 10 (11%) involved opioid analgesics.
• 4% were related to opioid pharmacotherapy drugs, like methadone and buprenorphine
Hospitals separations• with a principal diagnosis of
substance use disorder or harm due to opioids (including heroin, opium, morphine, and methadone) is increasing
• In 2015–16, the rate was 37.1 per 100,000 population (or 6.6% of drug-related separations) up from 33.0 per 100,000 population in 2011–12.Source: National Hospitals Morbidity Dataset 2015-16 Source: Alcohol and Other Drugs Statistics, Turning Point

Treatment for pharmaceutical opioids Alcohol and Other Drug Treatment Services (AODTS)
• Increase in the proportion of treatment episodes for most pharmaceutical opioids
• Of treatment episodes for pharmaceuticals over the last 10 years:– Oxycodone increased 3.8 times– Codeine increased 2.4 times– Other opioids (fentanyl and
tramadol) increased 5.2 times
Proportion of closed treatment episodes for selected pharmaceutical drugs of concern, 2006-07 to 2015-16
0
5
10
15
20
25
30Per cent Codeine Methadone
Oxycodone Other opioidsOther analgesics
Source: Alcohol and Other Drug Treatment Services NMDS 2015-16

Policy responses
Restricting access to codeine medicines to prescription only from 1 February 2018• This includes analgesic preparations combined with other
pain relief medicines such as aspirin, paracetamol and ibuprofen
Real time prescription monitoring• Implementation of a national real-time monitoring
system of prescription drugs. • The system will provide an instant alert to pharmacists
and doctors if patients are receiving multiple supplies of prescription only medicines (also referred to as ‘doctor or pharmacy shopping’).

Breaking down the data silos
• AIHW continues to work withstakeholders to collect, analyse and report data on non-medical use of opioids
• Recent report released on 19 December 2017
International collaboration• AIHW and Canadian Institute
for Health Information (CIHI)• Analysis of comparable data between countries• Initial findings show similar trends between countries,
report due for release September 2018

The impacts of a tamper-resistant oxycodone formulation on opioid use and harms in Australia
27 - 28 March 2018, QT Hotel Canberra
Dr BRIONY LARANCENDARC, UNSW
The National Opioid Medications Abuse Deterrence (NOMAD) studyBriony Larance, Louisa Degenhardt, Nicholas Lintzeris, Raimondo Bruno, Amy Peacock, Michael Farrell
The Difference is ResearchThe Difference is Research
3
Disclosures
The NOMAD study was funded via an investigator-driven, untied educational grant from MundipharmaAustralia. The funder has no role in the design, conduct, analysis, interpretation or decision of what/where to publish.
I have also received untied educational grants from Reckitt Benckiser/Indivior and Seqirus for work unrelated to this presentation.
4
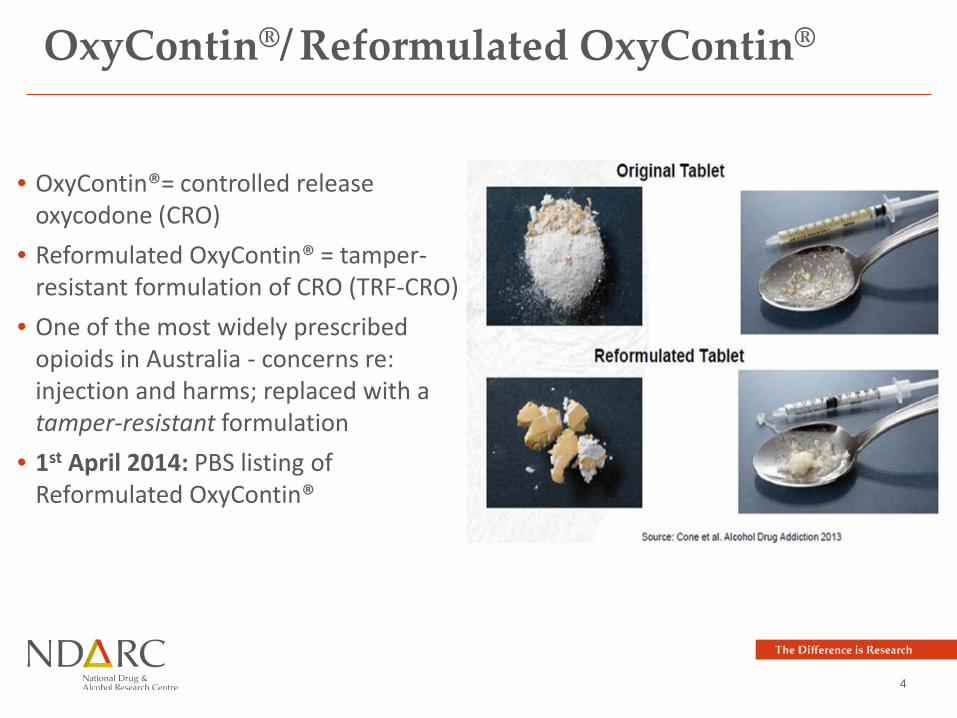
OxyContin®/ Reformulated OxyContin®
• OxyContin®= controlled release oxycodone (CRO)
• Reformulated OxyContin® = tamper-resistant formulation of CRO (TRF-CRO)
• One of the most widely prescribed opioids in Australia - concerns re: injection and harms; replaced with a tamper-resistant formulation
• 1st April 2014: PBS listing of Reformulated OxyContin®

The Difference is Research
National Opioid Medication Abuse Deterrence (NOMAD) study:
Degenhardt et al (2015). Evaluating the potential impact of a reformulated version of oxycodone upon tampering, non-adherence and diversion of opioids: The National Opioid Medications Abuse Deterrence (NOMAD) study protocol. Addiction, 110, 226-237
Following the introduction of Reformulated OxyContin®…
1. Population-level utilisation of oxycodone and other opioids?2. Extra-medical use of OxyContin®?3. Extra-medical use of other forms of oxycodone or other pharmaceutical
opioids?4. Injection of other illicit drugs?5. Attractiveness for tampering?6. Methods of tampering with Reformulated OxyContin® evolve/become
widespread?7. Unintended consequences?

Data source/custodianQ1
Population use of opioids
Q2OxyContin®
use
Q3Other pharm
opioid use
Q4Illicit drug injection
Q5Attractive-
ness
Q6Tampering
Q7Unintended
conseq’s
Population-based indicators of opioid utilisation
1. IMS Health opioid sales data •Use, extra-medical use and tampering of oxycodone, other pharmaceutical opioids and of other drugs2. NOMAD study prospective cohort • • • • • •3. Illicit Drug Reporting System (PWID) • • • •4. Sydney MSIC data • •5. Kirketon Road Centre NSP data • •6. Queensland NSP data (QMDS-NSP) • •Opioid-related morbidity7. New South Wales (NSW) Ambulance •8. Ambulance Tasmania •9. Hospital separations NSW •10. Hospital separations TAS •11. Emergency department data NSW •12. Emergency department data TAS •13. Royal Adelaide Hospital ED data •Opioid treatment and help-seeking14. PHDAS NSW •15. DASSA OST treatment episodes SA •16. ADIS NSW •17. ADIS TAS •

7
Data source/custodianQ1
Population use of opioids
Q2OxyContin®
use
Q3Other pharm
opioid use
Q4Illicit drug injection
Q5Attractive-
ness
Q6Tampering
Q7Unintended
conseq’s
Population-based indicators of opioid utilisation
1. IMS Health opioid sales data •Use, extra-medical use and tampering of oxycodone, other pharmaceutical opioids and of other drugs2. NOMAD study prospective cohort • • • • • •3. Illicit Drug Reporting System (PWID) • • • •4. Sydney MSIC data • •5. Kirketon Road Centre NSP data • •6. Queensland NSP data (QMDS-NSP) • •Opioid-related morbidity7. New South Wales (NSW) Ambulance •8. Ambulance Tasmania •9. Hospital separations NSW •10. Hospital separations TAS •11. Emergency department data NSW •12. Emergency department data TAS •13. Royal Adelaide Hospital ED data •Opioid treatment and help-seeking14. PHDAS NSW •15. DASSA OST treatment episodes SA •16. ADIS NSW •17. ADIS TAS •
Main components of the NOMAD study:
1. A prospective cohort of 606 people who misuse or tamper with pharmaceutical opioids
2. Illicit Drug Reporting System (IDRS) data, including additional module in 2014 and 2015
3. Routinely-collected indicator data (~240 individual series):• Opioid sales• Drugs used by clients at needle and syringe programs (NSP)• Opioid overdose/poisoning• Help-seeking and treatment• Mortality (not currently available)
8
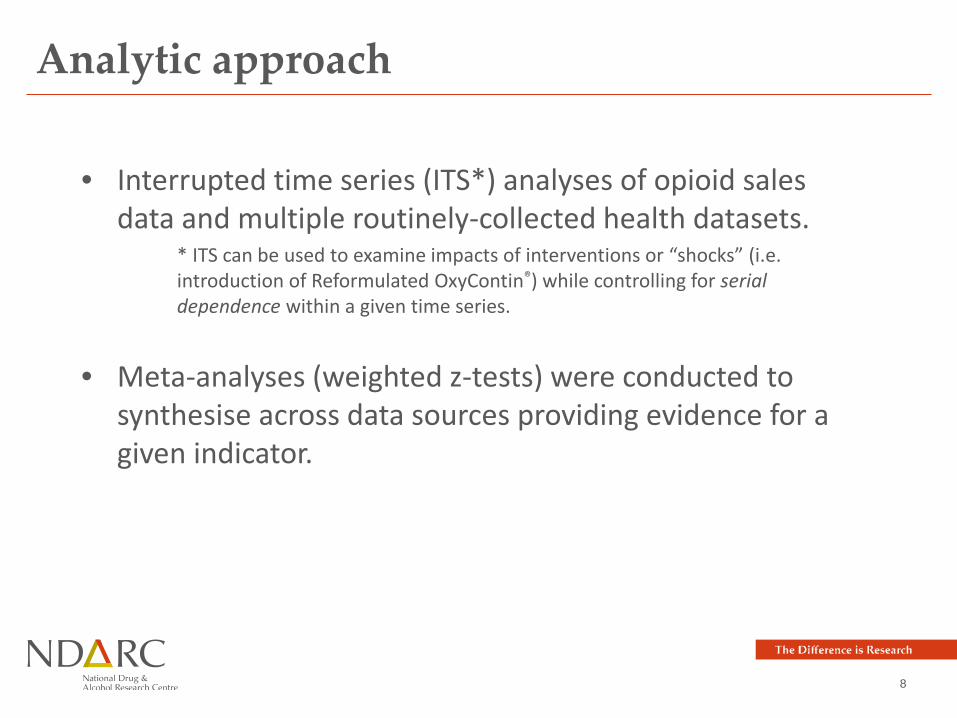
• Interrupted time series (ITS*) analyses of opioid sales data and multiple routinely-collected health datasets.
* ITS can be used to examine impacts of interventions or “shocks” (i.e. introduction of Reformulated OxyContin®) while controlling for serial dependence within a given time series.
• Meta-analyses (weighted z-tests) were conducted to synthesise across data sources providing evidence for a given indicator.
Analytic approach

9
Q1: Was there a change in the population-level utilisation of oxycodone?

11
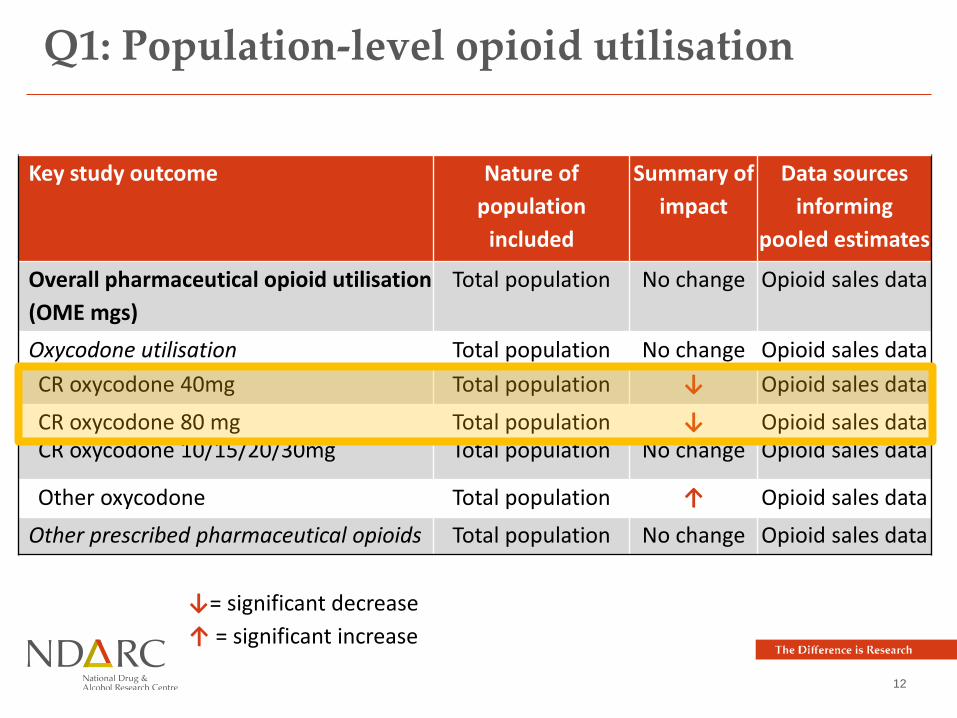
Q1: Population-level opioid utilisation
Key study outcome Nature of population
included
Summary of impact
Data sources informing
pooled estimates
Overall pharmaceutical opioid utilisation (OME mgs)
Total population No change Opioid sales data
Oxycodone utilisation Total population No change Opioid sales dataCR oxycodone 40mg Total population ↓ Opioid sales data
CR oxycodone 80 mg Total population ↓ Opioid sales dataCR oxycodone 10/15/20/30mg Total population No change Opioid sales data
Other oxycodone Total population ↑ Opioid sales dataOther prescribed pharmaceutical opioids Total population No change Opioid sales data
↓= significant decrease↑ = significant increase
12
Q1: Population-level opioid utilisation
Key study outcome Nature of population
included
Summary of impact
Data sources informing
pooled estimates
Overall pharmaceutical opioid utilisation (OME mgs)
Total population No change Opioid sales data
Oxycodone utilisation Total population No change Opioid sales dataCR oxycodone 40mg Total population ↓ Opioid sales data
CR oxycodone 80 mg Total population ↓ Opioid sales dataCR oxycodone 10/15/20/30mg Total population No change Opioid sales data
Other oxycodone Total population ↑ Opioid sales dataOther prescribed pharmaceutical opioids Total population No change Opioid sales data
↓= significant decrease↑ = significant increase

13
Q1: Population-level opioid utilisation
Key study outcome Nature of population
included
Summary of impact
Data sources informing
pooled estimates
Overall pharmaceutical opioid utilisation (OME mgs)
Total population No change Opioid sales data
Oxycodone utilisation Total population No change Opioid sales dataCR oxycodone 40mg Total population ↓ Opioid sales data
CR oxycodone 80 mg Total population ↓ Opioid sales dataCR oxycodone 10/15/20/30mg Total population No change Opioid sales data
Other oxycodone Total population ↑ Opioid sales dataOther prescribed pharmaceutical opioids Total population No change Opioid sales data
↓= significant decrease↑ = significant increase

14
Q2 and 3: Were there changes in the injection of OxyContin® or other
pharmaceutical opioids?
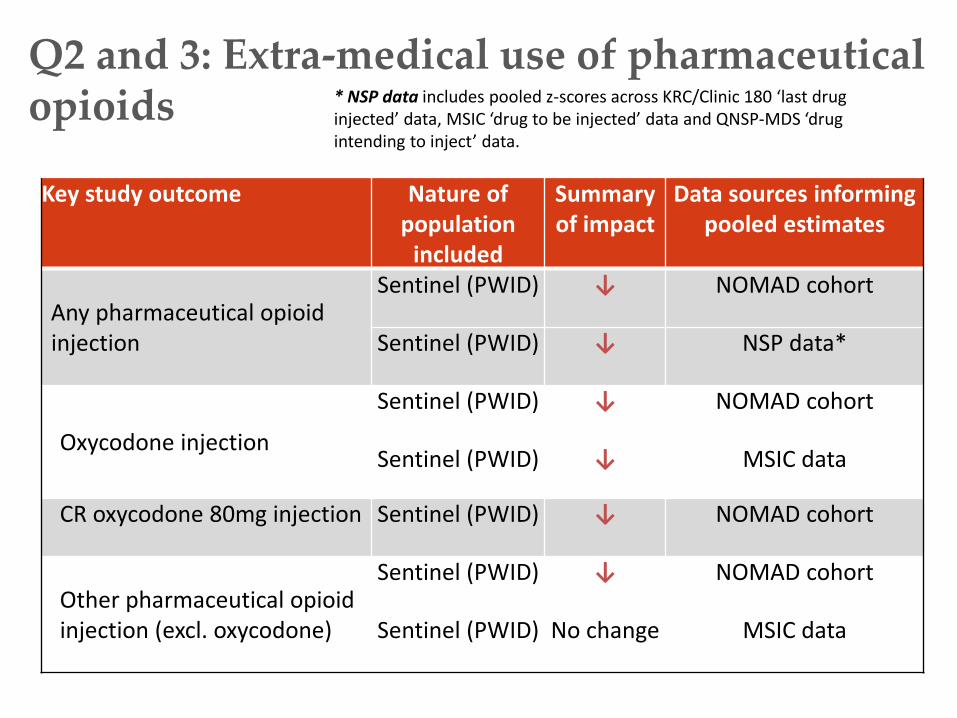
Q2 and 3: Extra-medical use of pharmaceutical opioids
Key study outcome Nature of population
included
Summary of impact
Data sources informing pooled estimates
Any pharmaceutical opioid injection
Sentinel (PWID) ↓ NOMAD cohort
Sentinel (PWID) ↓ NSP data*
Oxycodone injection
Sentinel (PWID) ↓ NOMAD cohort
Sentinel (PWID) ↓ MSIC data
CR oxycodone 80mg injection Sentinel (PWID) ↓ NOMAD cohort
Other pharmaceutical opioid injection (excl. oxycodone)
Sentinel (PWID) ↓ NOMAD cohort
Sentinel (PWID) No change MSIC data
* NSP data includes pooled z-scores across KRC/Clinic 180 ‘last drug injected’ data, MSIC ‘drug to be injected’ data and QNSP-MDS ‘drug intending to inject’ data.

19
Q4: Were there changes in the injection of illicit drugs?

20
Q4: Injection of illicit drugs
* NSP data includes: pooled z-scores across KRC/Clinic 180 ‘last drug injected’ data, MSIC ‘drug to be injected’ data and QNSP-MDS ‘drug intending to inject’ data.
Key study outcome Nature of population
included
Summary of impact
Data sources informing pooled estimates
Heroin Sentinel population
No change NSP data*
Amphetamine Sentinel population
No change NSP data*

21
Q5: How attractive was Reformulated OxyContin® for extra-medical use?

The Difference is Research
Q5: Attractiveness
Key study outcome Nature of population
included
Summary of impact
Data sources informing
pooled estimatesMedian street price per 80mg tablet(CRO vs. TRF-CRO tablet)
Sentinel population
↓ NOMAD cohort
Strongly agreed difficult to inject (CRO vs. TRF-CRO)
Sentinel population
↑ NOMAD cohort
Intentions to tamper (CRO vs. TRF-CRO)
Sentinel population
↓ NOMAD cohort

25
Q6: Did methods of tampering evolve or become widespread?

The Difference is Research
Q5: Evolution and spread of tampering
Key study outcome Nature of population
included
Summary of impact
Data sources informing
pooled estimatesSuccessfully tampered with TRF-CRO (ever) (Wave 2 vs. Wave 3)
Sentinel population
↑ NOMAD cohort
Past month tampering with TRF-CRO(Wave 2 vs. Wave 3)
Sentinel population
No change NOMAD cohort

28
Q7: Were there any unintended consequences (help-seeking, overdose)?

Q5: Unintended consequencesKey study outcome Nature of
population included
Summary of impact
Data sources informing
pooled estimates
Drug overdose (all drugs) Total pop No change Available health data
Opioid overdose/poisoning Total pop No change NSW health service data
Other drug overdose/poisoning Total pop No change NSW health service data
Help-seeking for drugs (all helpline calls) Total pop No change Available ADIS data
Help-seeking for opioids Total pop No change NSW ADIS only
Help-seeking for other drugs Total pop No change NSW ADIS only
Opioid substitution therapy (total) Total pop No change Available OST data
Total new treatment entrants Total pop No change NSW PHDAS only
Treatment entry – oxycodone Total pop ↓ NSW PHDAS only
•‘Available health data’: pooled z-scores across drug overdose/poisonings data from Tasmania EDDC, Tasmania hospital, NSW EDDC, NSW APDC and Royal Adelaide Hospital emergency department data.•‘NSW health service data’ includes: pooled z-scores on opioid overdose from NSW ambulance data, NSW EDDC and NSW APDC.•‘NSW health service data’ includes: pooled z-scores on other (non-opioid) drug overdose from NSW ambulance data, NSW EDDC and NSW APDC.•‘Available ADIS data’ includes: pooled z-scores across NSW and Tasmanian ADIS data.•‘Available OST data’ includes: pooled z-scores across total number of OST patients in NSW (PHDAS) and South Australia (DASSA).

Q5: Unintended consequencesKey study outcome Nature of
population included
Summary of impact
Data sources informing
pooled estimates
Drug overdose (all drugs) Total pop No change Available health data
Opioid overdose/poisoning Total pop No change NSW health service data
Other drug overdose/poisoning Total pop No change NSW health service data
Help-seeking for drugs (all helpline calls) Total pop No change Available ADIS data
Help-seeking for opioids Total pop No change NSW ADIS only
Help-seeking for other drugs Total pop No change NSW ADIS only
Opioid treatment program (total) Total pop No change Available OST data
Total new treatment entrants Total pop No change NSW PHDAS only
Treatment entry – oxycodone Total pop ↓ NSW PHDAS only
•‘Available health data’: pooled z-scores across drug overdose/poisonings data from Tasmania EDDC, Tasmania hospital, NSW EDDC, NSW APDC and Royal Adelaide Hospital emergency department data.•‘NSW health service data’ includes: pooled z-scores on opioid overdose from NSW ambulance data, NSW EDDC and NSW APDC.•‘NSW health service data’ includes: pooled z-scores on other (non-opioid) drug overdose from NSW ambulance data, NSW EDDC and NSW APDC.•‘Available ADIS data’ includes: pooled z-scores across NSW and Tasmanian ADIS data.•‘Available OST data’ includes: pooled z-scores across total number of OST patients in NSW (PHDAS) and South Australia (DASSA).

31
Key findings
• Qu 1: Decline in OxyContin® use (increase in Targin®) • Qu 2 and 3: Declines in OxyContin® and total oxycodone injection• Qu 4: No switching to other opioids or heroin (some differences in
MSIC data – a special case?) • Qu 5: Reduced attractiveness for tampering • Qu 6: Tampering increased, but among a small proportion and
infrequent use • Qu 7: To date, no evidence of other unintended consequences
Larance et al (2018) Impacts of a potentially tamper-resistant oxycodone formulation on opioid use and harms in Australia: Main findings from the National Opioids Abuse Deterrence (NOMAD) study. Lancet Psychiatry
32
Conclusions
• Clear impacts among PWID, with reductions in injection of OxyContin®/Reformulated OxyContin®, no switch to other oxycodone, and no clear evidence of a shift to other opioids or drugs.
• Did not appear to impact at population-level upon opioid use or harms.
• ADFs may make tampering more difficult, but limited impact addressing issues related to overprescribing, overuse and harms of opioids when taken via the intended route.
Larance et al (2018) Impacts of a potentially tamper-resistant oxycodone formulation on opioid use and harms in Australia: Main findings from the National Opioids Abuse Deterrence (NOMAD) study. Lancet Psychiatry

33
Acknowledgements• Many thanks to the NOMAD study participants, who generously shared their experiences.• NOMAD Investigators: Louisa Degenhardt, Briony Larance, Michael Farrell, Nicholas Lintzeris, Raimondo Bruno, Amy Peacock,
Robert Ali, Nancy White, Timothy Dobbins • Associate Investigators and NOMAD Advisory Committee members: Suzanne Nielsen, Gabrielle Campbell, Lesley Brydon,
Malcolm Dobbin, Adrian Dunlop, Angella Duvnjak, Mary Ellen Harrod, Paul Haber, Marianne Jauncey, Robert Kemp, Nghi Phung, Ann Roche and Hester Wilson.
• Other NOMAD study team members: Ivana Kihas, Toni Hordern, Elena Cama, Dominic Oen, Oluwadamisola Sotade and our team of interviewers in NSW, SA and TAS
• Special Acknowledgements: Billy Henderson (Mundipharma, NSW, Australia; IMS Health data); Jenny Stafford and Lucy Burns (National Drug and Alcohol Research Centre, NSW, Australia; Illicit Drug Reporting System data); Amanda Roxburgh (National Drug and Alcohol Research Centre, NSW Australia; National Illicit Drugs Indicator Project data); Marianne Jauncey and Allison Salmon (Uniting Medically Supervised Injecting Centre, NSW, Australia; medically supervised injecting centre client visit data); Ingrid van Beek and Karen Chronister (Kirketon Road Centre and Clinic 180, NSW, Australia; last drug injected data for two inner-Sydney needle and syringe programmes); Robert Kemp and Abhilash Dev (Queensland Health, Queensland Government, Australia; Queensland Minimum Data Set for the Needle-Syringe Programs); Peter Mansfield (Department of Health and Human Services, Tasmania Government; Tasmanian Emergency Department Data Collection data/Admitted Patient Data Collection data); Orson Rapose (Turning Point, VIC, Australia; Alcohol and Drug Information Service data for Victoria, Australia); Ambulance Australia, Tasmania Department of Health and Human Services, Tasmania Government (Tasmanian Ambulance data); Ian Richards (Community Based Treatment Division, Drug and Alcohol Services South Australia, SA Health, South Australia, Australia; Alcohol and Drug Information Service data for South Australia, and opioid substitution therapy data from Drug and Alcohol Services South Australia); Pia Salmelainen (New South Wales Ministry of Health; Pharmaceutical and Drugs of Addiction System data); David Lester (St Vincents Hospital, New South Wales; New South Wales Alcohol and Drug Information Service data); Francine Smith (Tasmanian Department of Health and Human Services, TAS, Australia); and the National Clinical Terminology Service from the Australian Digital Health Agency for assistance with SNOMED mapping and codes. Thanks also to the Centre for Epidemiology and Evidence, New South Wales Ministry of Health for preparation and provision of data from (a) the Emergency Department Records for Epidemiology and (b) Combined Admitted Patient Epidemiology Data held by the New South Wales Ministry of Health Secure Analytics for Population Health Research and Intelligence.
• NHMRC fellowships: Briony Larance, Louisa Degenhardt, Amy Peacock• Mundipharma: Untied educational grant

34
Thank you!
Briony LaranceSenior Research Fellow (NHMRC ECF)NDARC, UNSW Australia: (02) 9385 0241 : [email protected]
SafeScriptVictoria’s Real-Time Prescription Monitoring system
Australian and New Zealand School of Government
Breaking the Data Silos Conference
27 March 2018

Harms from high-risk prescription medicines
Deaths in Victoria 2011 2012 2013 2014 2015 2016
Prescription medicines 275 306 313 316 358 372Illicit drugs 153 133 166 164 227 257Road toll 287 282 243 248 257 291
• 34 coronial findings since 2012 where Coroners have called for a monitoring system in Victoria
• All key health and consumer organisations strongly advocate a monitoring system

SafeScript: sharing data between clinicians
If dispensed, record
captured in the system
Doctor(or other
prescriber)
PharmacistsPharmacist
decides whether to
dispense or not
Pharmacist checks system
Patient presents
prescription at pharmacy
If safe, doctor writes a
prescription
Doctor checks the
system
Patient visits doctor
Doctor decides whether to
prescribe or not
DHHS has access to SafeScript to oversee compliance and the
appropriate supply of medicines

Supporting activity
Support for Clinicians and Consumers• Training for prescribers and pharmacists
• Public Awareness Campaign
• “GP Champions” Initiative
• Minor enhancements to the Alcohol and Other Drugs (AOD) treatment sector
This is in addition to broader activity being implemented through Victorian DHHS• Significant new investment in AOD treatment sector
• AOD Workforce Strategy and development projects

Implementation Details
Scope of medicines to be monitored through SafeScript• All Schedule 8 Medicines
• Some Schedule 4 medicines including all benzodiazepines
Mandatory use by prescribers and pharmacists• After transitional period of 18 months
Implementation Approach• Implementation in a study area will commence in late 2018
• Review of deployment activities before further roll-out

Stakeholders influence
• An Expert Advisory Group provides advice about key policy and implementation aspects of SafeScript that affect patients and health professionals.
• Early feedback from the EAG and other key stakeholders indicated a need for a system with:
• minimal interruption to clinical workflow
• integration with existing prescribing and dispensing software
• minimal or no additional data entry required by clinicians
• This led to a reconsideration of the available technology
• Move to seek more contemporary data and technology solutions

Being smarter about data and technology
Victorian RTPMSourcing Data SafeScript architecture provides a more efficient approach to sourcing data by
leveraging existing digital health assets to integrate with ePrescription Exchange Services (PES)
Technology-Scalability andPerformance
SafeScript architecture leverages more contemporary technology on a cloud-based platform which can scale indefinitely to support any future needs including growth in prescription volumes and number of users without requiring any significant system redevelopment.
Integration into health professionals workflow
Capability to reticulate notifications to health professionals to ensure integration into health professionals workflow
Additionally, the solution will provide an application programming interface (API) which will allow for seamless integration with prescriber and pharmacy software.
Patient identification and matching
The Victorian approach provides a real-time data enrichment function that will enable retrieving the patient IHI through calls to the HI services. Therefore, the patient identification processes for will be more reliable.
National integration As other jurisdictions develop monitoring systems, coordination with their data will provide information about cross-border supply of high risk medicines. Meanwhile, our legislative framework enables us to capture data about all prescribing and dispensing to Victorian patients.

SafeScript data
• Patient name • Patient address• Demographics • Prescriber name and address, specialty • Number of prescribers • Pharmacy name and address• Number of pharmacies• Monitored drug(s) • Drug dose• Drug combinations• Number of prescriptions per patient

Current Progress and Activity
• The Bill to establish the legislative framework for the system recently passed through Victorian Parliament
• Draft regulations and Regulatory Impact Statement (RIS) was released for consultation
• Fred IT Group has been appointed to build the system
• Working with a consortium, comprising all Victorian Primary Health Networks and NPS MedicineWise, to develop training for prescribers and pharmacists
• Market research for concepts for the Public Awareness Campaign
• Planning for implementation including communication and stakeholder engagement

For more information
https://www2.health.vic.gov.au/public-health/drugs-and-poisons/safescript
Email: [email protected]
STAY ON THE SAFE SIDE