overview of food security and hunger situation in asia and ... · pdf file... food security...
TRANSCRIPT
Overview of Food Security and Hunger situation
in Asia and the Pacific and the Double Burden of Malnutrition
at The Round Table on the Double Burden of Malnutrition
(14 March 2014, Ulaanbaatar, Mongolia)
Hiroyuki Konuma Assistant Director-General and Regional Representative
FAO Regional Office for the Asia & the Pacific

Global challenges in achieving food security and nutrition
Global Scenario on Malnutrition
Food Security and Nutrition Landscape in Asia
Malnutrition in the Pacific Island countries
Why Investing in reducing Malnutrition matters?
Causes of Malnutrition
Addressing the Double burden of malnutrition
Outline/Structure of Presentation

Global challenges in achieving food security and nutrition
Population growth projected to reach 9.2 billion by 2050
Production
Urbanization
Food price hike and volatility
Climate change
Market infrastructure
Land degradation, desertification, and land use change
Water scarcity for producing more foods
Food consumption trends
Food losses and wastes
Food Safety

4
World Population Trends
Source: UN, 2011
0.00
0.50
1.00
1.50
2.00
2.50
0
2000
4000
6000
8000
10000
12000
19
50
19
55
19
60
19
65
19
70
19
75
19
80
19
85
19
90
19
95
20
00
20
05
20
10
20
15
20
20
20
25
20
30
20
35
20
40
20
45
20
50
20
55
20
60
20
65
20
70
20
75
20
80
20
85
20
90
20
95
21
00
developed Sub-Saharan Africa
NothAfrica and the Middle East Latin America and Caribb
South Asia Eastern Asia
percentage annual growth rate (right scale)
millions

60% increase in food production needed by 2050
(77% increase, if developing countries only)
5
56
317
170
24
77
60
0 100 200 300 400
developed countries
developing countries
world
percent
2005/07-
2050 (projected)
1961-2005/07 (observed)
Source: Bruinsma, 2011

6
Global Urbanization Trends
Source: UN, 2011 0.0
1.0
2.0
3.0
4.0
5.0
6.0
7.01
95
0
19
55
19
60
19
65
19
70
19
75
19
80
19
85
19
90
19
95
20
00
20
05
20
10
20
15
20
20
20
25
20
30
20
35
20
40
20
45
20
50
Rural Urban
billions

Asia Urbanization trends Urbanization – growing rapidly – 50% currently live in urban areas
Estimated that by 2050, close to 70 percent of the world’s population will be residing in urban areas
In Asia urban population is 42.2% growth fastest rate
In last 20 years Asian cities grown faster than any other region
13 of 20 most populated urban areas now in Asia
SE Asia, by 2050 nearly 63% of total population expected to live in urban areas
Region Urban 2010
Rural 2010
Total 2010 Urban 2050
Rural 2050
Total 2050
ASIA 1.8 2.4 4.2 3.4 1.7 5.1
WORLD 3.5 3.4 6.9 6.3 3 9.3
Population (Asia figs)
• ~20% increase in total population; ~89% increase in urban population
~89%
~70%

FAO Food Price Index in September 2013 averaged 199 point s which was 1% lower than previous month, but still 100 % higher than 10 years ago
Download full dataset: Excel, CSV
| For more information contact us.

The number of natural disasters occurring worldwide has doubled in past 10 years – affecting
food production & price stability
0
50
100
150
200
250
300
350
400
1980
1982
1984
1986
1988
1990
1992
1994
1996
1998
2000
2002
2004
2006
2008
Africa Asia-Pacific Caribbean Europe Latin America North America
Number of Disasters
Source: ESCAP and ISDR, The Asia-Pacific Disaster Report 2010.

Arable land is getting limited in Asia Arable land in use, 1997-99, million ha.
Source: FAO 2001. World Agriculture towards 2015/30, Summary Report
Total suitable for rainfed crop production, million ha.

Water Scarcity

12
Food Consumption Trends (Kcal/person/day)
Source: Alexandratos, 2011
1500
2000
2500
3000
3500
1969/71 1979/81 1990/92 2005-07 2030 2050
Industrial countries Sub-Saharan Africa
Near East-North Africa Latin America & Caribbean
South Asia East Asia

Globally, An Estimated 1.3 Billion Tons of Food is Lost or Wasted Every Year
Global Food Losses
0%
10%
20%
30%
40%
50%
60%
cereals roots &
tubers
oilseeds &
pulses
fruits &
vegetables
meat fish &
seafood
dairy
products
Consumption
Distribution
Processing
Postharvest
Agriculture
waste
Loss
Source: FAO 2011. Food Losses – extent, causes and prevention - FAO, Rome
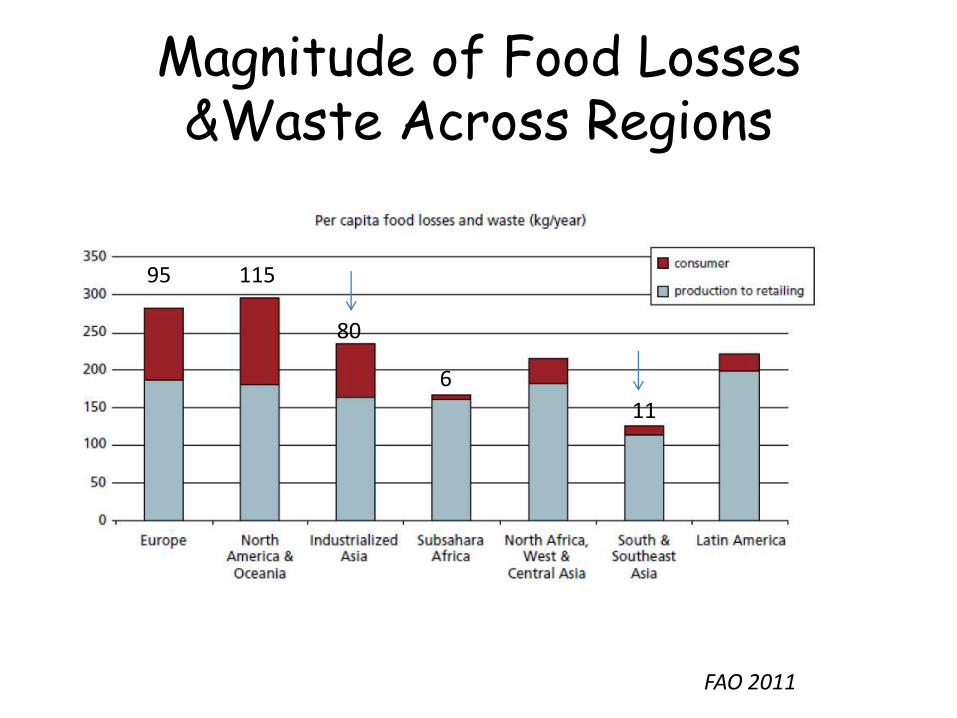
Magnitude of Food Losses &Waste Across Regions
FAO 2011
95 115
6
80
11

Food Safety
Food safety has a strong impact on food security and nutrition status of populations thereby influencing productivity & livelihoods
Public health impact due to food borne illness with social & economic impacts (Food and waterborne diarrhoeal diseases cause ~2.2 m deaths worldwide annually (1.9 m children) [WHO]
Impacts costs - public health as well as destruction/ rework/ recall of food consignments
Impacts food losses and wastes
Impacts national & international market access, which effects purchasing power of farmers, food businesses & consumers

Global scenario on malnutrition
Undernourishment currently at 842 m (12% of global population)
Around 2 billion people suffer from micronutrient deficiencies (30%)
165 million children are stunted (26%)
1.4 billion adults are overweight, of which 500 million are obese

Food Security & Nutrition scenario in Asia
60% of world’s population
Most populous countries
Fastest growing economies with wide income inequalities
Per capita income increases: 64% East Asia, 31% South Asia, 21%
South East Asia
Large agricultural exporter and importer
Proportion of undernourished population decreased from 24.1%
to 13.5% between 1992 to 2013
563 million people are undernourished (62% of world total)
In South Asia around 39 percent of children under age of 5 are
stunted
~75 percent of people with micronutrient deficiencies live in Asia

Millennium Development Goal Hunger Indicator (%)

Undernourishment in Asia
Numbers (left axis) Prevalence (right axis)

Undernourishment Trends

Prevalence of Undernourishment (%) in Asian Countries (1990/1 to 2011/3)
Source: FAO

Number of Undernourished People in Asian Countries (2011 to 2013)
Source: FAO

Micronutrient deficiencies still high in Asia
Accumulative Mineral and Vitamin Deficiency Index, Asia
Source: Maplecroft 2012

Prevalence of Wasting in Children less than 5 years (%)
(2000 to 2012)
Source: FAO

Prevalence of Stunting among Children less than 5 years (%)
(2000 to 2012)
Source: FAO

Source: UNICEF State of the World’s Children 2012, compiled with data from MICS, DHS and other national surveys, 2006–2010.
47
42
19
45
38
18
40
23
11
39
15
6
28
11
9
19
10
6
15
4
2
0
5
10
15
20
25
30
35
40
45
50
Stunting Underweight Wasting
South Asia
SEARO Region
West/Central Africa
East/Southern Africa
Middle East/N. Africa
East Asia/Pacific
Latin America/Caribbean
Globally - All forms of undernutrition are highest in South Asia

Low-income
Asian countries
Middle-income
Asian countries
High-income
countries
Prevalence of Overweight in Asian countries (BMI≥25) in adults
Source: WHO Global NCD Status Report, 2010

Average Dietary Energy Supply (kcal/person/day) Asian Countries
Source: FAO

Huge Disparities: by wealth and residence
Fig. 1: Stunting in children U5 by Wealth Quintile (%)
Fig. 2: Stunting in children U5 by Urban/Rural Area (%)
UNICEF
Source: MICS and DHS, 2005-2010

Malnutrition in the Pacific Island countries
80% of adults are overweight in the Cook Islands, Kiribati, the Republic of the Marshall Islands, Nauru, Tokelau, Tonga and Samoa
60% of adults are obese in Tonga and the Cook Islands;
75% of all adult deaths are due to NCDs;
40% of children under the age of five are anaemic in Papua New Guinea, Fiji, Nauru, the Solomon Islands; Tuvalu;
40% of pregnant women are anaemic in the Solomon Islands, Fiji, Nauru and Samoa

Good Nutrition is the foundation for human health and well-being, physical and cognitive development and economic productivity
Why Investing in reducing Malnutrition matters?
Causes of malnutrition
A complex interplay of economic; social; environmental and behavioral factors
Diets low in quantity, quality and variety – insufficient micronutrients (Vitamin A, iron, iodine, folate, etc);
Infectious diseases and parasitic infections;
Overconsumption or excessive energy-dense and highly processed foods with low levels of physical activity;
High food prices can exacerbate food insecurity and malnutrition

Addressing the Double burden of malnutrition Policy and Institutions
Political will, commitment and support for nutrition;
Nutrition objectives in the health, agriculture, and development agenda and policies and programs;
Advocacy on nutrition issues – civil society, media and academia;
Technical/ institutional/ financial/ human capacity strengthened – to assess, design intervention strategies, provide operational/ managerial support;
Transfer of scientific knowledge to academic /field levels;
More budget allocation for direct nutrition and nutrition-sensitive programmes

Addressing the Double burden of malnutrition Food Systems
Focus on improving nutrition through adequate diets (rather than medical based interventions)
Recognizes that every aspect of food system impacts the availability/ accessibility of nutritious foods – agricultural production, supply chain and consumer level
Identifying critical points in food chain for enhancing and protecting nutritional value Promotion of community, home and school gardens Crop varieties with higher nutritional content; Research for nutrient-dense foods; Post-harvest/processing methods to preserve nutrition value; Markets for nutritious foods;
Empowering women and supporting women farmers
Addressing the Double burden of malnutrition Food Systems – Data and Statistics
Correct assessment of nutritional situation important – for policy making, advocacy, accountability, allocating funds, decision making for eradicating malnutrition
Data and appropriate indicators on nutrition important – total energy, micro-nutrient consumption
Design efficient data parameters, collection tools and cost-effective indicators;
Collect both agricultural and nutrition information with consistent and timely data analysis & interpretation;
Conduct baseline surveys and nutritional impact assessments of agriculture interventions
Addressing the Double burden of malnutrition Food Systems – Education and Awareness
Nutrition education for increase consumption of adequate and diverse diets;
Focus on maternal and child nutrition - education to teenage girls, women, mothers, grandmothers important;
Interventions such as home/school gardens, complementary feeding education, school curricula, extension services effective;
Consumer awareness and education for better food choices, changing consumer behaviour for healthier diets;
Food labelling on nutritional content/ FBDGs also important for changing consumer and FBO behaviour

Addressing the Double burden of malnutrition Food Systems – Partnerships and Coordination
Multiple causes (diets, water, sanitation, medical facilities) – so requires multi-sectoral holistic approach with integrated action & complementary interventions;
Coordination with other sectors (agriculture/ health/ social affairs/ education and finance/ trade); private sector; civil society actors
Global and regional platforms and collaborations – SUN, REACH, UN Standing Committee on Nutrition: facilitate regional dialogues to identify opportunities for action and collaboration among sectors

THANK YOU
Any Questions?