overview of darajat reservoir characterization; a volcanic ... · november 2002) and gunung guntur...
TRANSCRIPT
Proceedings World Geothermal Congress 2005 Antalya, Turkey, 24-29 April 2005
1
Overview of Darajat Reservoir Characterization: A Volcanic Hosted Reservoir
Julfi Hadi1, Chris Harrison2, Joao Keller2, Sri Rejeki1
1Amoseas Indonesia Inc, Jakarta, Indonesia, 2ChevronTexaco Energy Technology Co, San Ramon CA USA
[email protected], [email protected], [email protected], [email protected]
Keywords: Darajat, gOcad®, Fracture Density, Pore Volume
ABSTRACT
Reservoir Characterization using a combination of geothermal techniques and geostatistical modeling tools has been used to produce a realistic fine scale volcanic reservoir model that consists of discontinuous layers of rock with a distributed fracture system. This geological model used as a framework to estimate reserves and productivity for the field is especially critical since in a vapor dominated geothermal system the reserves are believed to be stored primarily within the rock matrix, while productivity is dominated by the fractures.
An existing undisturbed andesite stratovolcanic model was compared to cores and cuttings from 24 wells that have been drilled and surface samples to produce a subsurface volcanic facies model. The model indicates that the reservoir consists of thick lava and intrusive rock of a stratovolcano central facies that dominates the center of the reservoir and thick pyroclastic sequences of proximal to medial facies that were deposited on the margin. X-ray fluorescence analysis (XRF) on key samples and gravity data were used to confirm the model. Fractures in the wells were analyzed using FMS data and were related to well productivities via PLT and interference tests
gOcad® modeling incorporated the correlations between petrophysical groupings and matrix and alteration porosities with fracture density and connectivity and permeabilities in the wells. To capture pore volume uncertainties within the model, factors controlling pore volume were identified and different geology cases were created modeling reservoir geometry, lithology type proportion, alteration zone and porosity distribution. The fine scale models have been scaled up and are currently being history matched using 3D simulation. Predictions based on the models will be used to validate the technical feasibility of a major expansion of the Darajat facilities planned for 2004.
1. INTRODUCTION
1.1 Background
Indonesia has one of the largest geothermal energy reserves in the world. These reserves are primarily used for converting geothermal energy to electricity. With electricity demand out pacing supply and the move toward cleaner energy in the world, this has created opportunity for the expansion of the Darajat Geothermal project.
In geothermal development the estimated sustainable resource potential is the most important assumption made as this forecast naturally imposes constraints on the type and scale of future developments. Currently, reservoir simulation is the most accurate method for assessing the power generation capacity of geothermal fields under production (PB Power, 2000). Fluid reserves in a vapor system such as Darajat are believed to be stored within the porosity in the rock matrix. Understanding the geology
framework of the reservoir, especially rock type and distribution, fault structure and alteration, is therefore critical when evaluating this type of geothermal reservoir. This framework governs key reservoir parameters for simulation, such as porosity, connectivity and permeability.
Interpreting rock types and distributions in a volcanic setting is complex due to alteration and discontinuity of lava flows, however using an integrated geological approach has led to the development of a consistent reservoir rock framework. A detailed geological model representing the 3-dimensional distribution of petrophysical properties at Darajat is essential for estimating the porosity and permeability distribution in the reservoir and for then assessing the resource base and predicted performance for the field.
Key elements of this study were to identify and understand the key drivers of pore volume (PV) at Darajat and to include uncertainties in these in a probabilistic resource assessment. Since PV is a key component of the total resource available in the field, this overview focuses on the processes used to assess this critical component.
1.2 Location
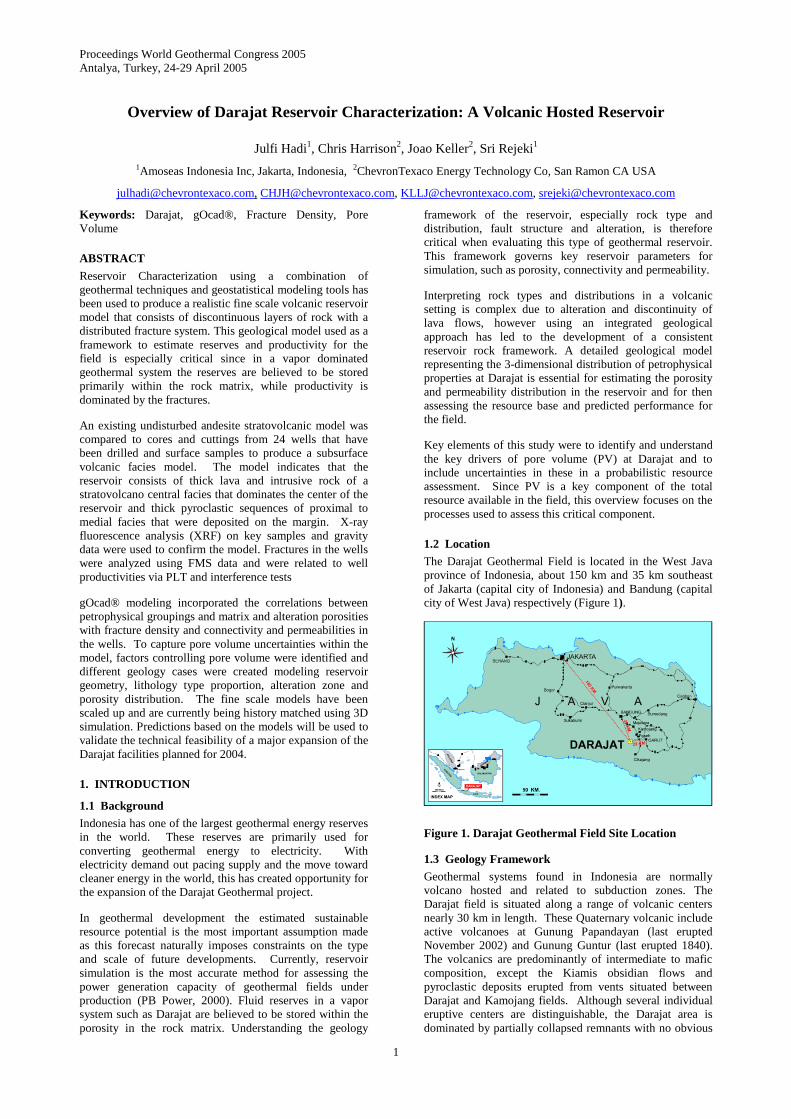
The Darajat Geothermal Field is located in the West Java province of Indonesia, about 150 km and 35 km southeast of Jakarta (capital city of Indonesia) and Bandung (capital city of West Java) respectively (Figure 1).
Figure 1. Darajat Geothermal Field Site Location
1.3 Geology Framework
Geothermal systems found in Indonesia are normally volcano hosted and related to subduction zones. The Darajat field is situated along a range of volcanic centers nearly 30 km in length. These Quaternary volcanic include active volcanoes at Gunung Papandayan (last erupted November 2002) and Gunung Guntur (last erupted 1840). The volcanics are predominantly of intermediate to mafic composition, except the Kiamis obsidian flows and pyroclastic deposits erupted from vents situated between Darajat and Kamojang fields. Although several individual eruptive centers are distinguishable, the Darajat area is dominated by partially collapsed remnants with no obvious

Hadi et al.
2
associated cone. Structures can be recognized generally only from topographic evidence. The dominant lineament directions in the region are the NE-SW and NW-SE trending faults. This pattern, which is found also in other adjacent fields, may be explained as a result of a south to north compression brought on by the movements of the Samudara Hindia Plate. The most visible structural features on aerial photographs and the most important faults in the production area are the Kendang and Gagak faults (main productive faults).
2. RESERVOIR CHARACTERIZATION
2.1 Reservoir top and bottom (Volume)
In geothermal field development, wells are targeted to penetrate zones with permeability and high temperature. Down hole pressure-temperature (P-T) surveys indicate that the top of the reservoir is marked by a change in temperature gradient and pressure within the reservoir. For most of the production wells, the point at which they penetrate the top of the reservoir is indicated by a distinct change in the temperature to around 240°C. In a vapor geothermal system the only reliable tool to interpret the top of the reservoir is from the down hole P-T survey, since other geology data such as temperature dependent minerals, alteration and geophysics detect mainly relict alteration from the previous liquid system.
In previous reservoir models of Darajat the bottom of the reservoir was defined by the elevation of the TD of the deepest well in the reservoir (-908 m subsea). However, Darajat micro earthquake (MEQ) data showing seismic events occurring as deep as -4 km elevation suggests that defining the bottom of the reservoir in this way has been too conservative. Deep MEQ data that indicates “thermal stress” produced when cold injected fluid enters hot geothermal reservoir has been used to estimate reservoir thickness at The Geysers field (pers. comm. T. Powell, 2001). Similar to The Geysers, MEQ in Darajat are found to depths approximately 5 km below the surface (Figure 2a). At The Geysers the MEQ Floor or bottom (- 5 km) is used tentatively to interpret the base of the reservoir (Stark, 1990). On this basis the new model of Darajat field includes Pore Volumes down to -4000m elevation (Figure 2b),
although a sensitivity to reservoir base depth is included in the analysis.
In summary, the volume geometry of the reservoir followed the top of reservoir identified from well P-T data and the base at -4000 masl based on deepest MEQ events.
Figure 2. (a) Deep MEQ epicenters (- 3 to – 4 km asl) in the Geysers and Darajat fields (b) Darajat model sgrid showing MEQ and interpreted Kendang fault plane
2.2 Reservoir geology model (2D)
2.2.1 Background
Interpreting rock distribution in a volcanic setting is complex and unpredictable, unlike the more predictable ‘layer cake’ correlation in a sedimentary basin environment. In the past, rock correlation with minimum knowledge of the Darajat geologic history caused major correlation problems and unrealistic distribution of different low porosity rock units. However, the addition of new data from wells, data integration and application of new technology has helped refine the geology model as well as porosity values and distribution in the reservoir (Table 1).
Table 1. Increase of data set from wells, data integration and application of new technology to refine geology model
Hadi et al.
3
To solve the complexity in modeling lava and pyroclastics flow, different volcanic models related to andesite stratovolcanoes were compared. A realistic reservoir geology model framework and reconstruction of the Darajat geology history were made by integrating surface geology mapping and subsurface lithology data. Since the previous map constructed by Healy (1974) was out of date, a new surface geology map of Darajat was produced and updated (Widodo, 2001 and Widjayanti, 2001). In this study a robust framework for the subsurface reservoir model was constructed by combining the lithology information from wells, gravity (dense body) interpretation and known facies models of andesite stratovolcanoes.
2.2.2 Rock interpretation
Detail reviews of all core and cuttings including 7 deep core hole and cuttings from 24 wells supported by FMS were used to establish consistent definitions which resolved different rock names given by several works in the past. All lithology data (core, thin section, and cuttings descriptions and FMS imagery) were integrated on composite logs for the interpretation. Confidence levels when interpreting lithologies were ranked based on the type of data used as follows: (1) thin section analysis, (2) core examination, (3) FMS imagery and (4) cuttings descriptions.
2.2.3 Surface geology interpretation
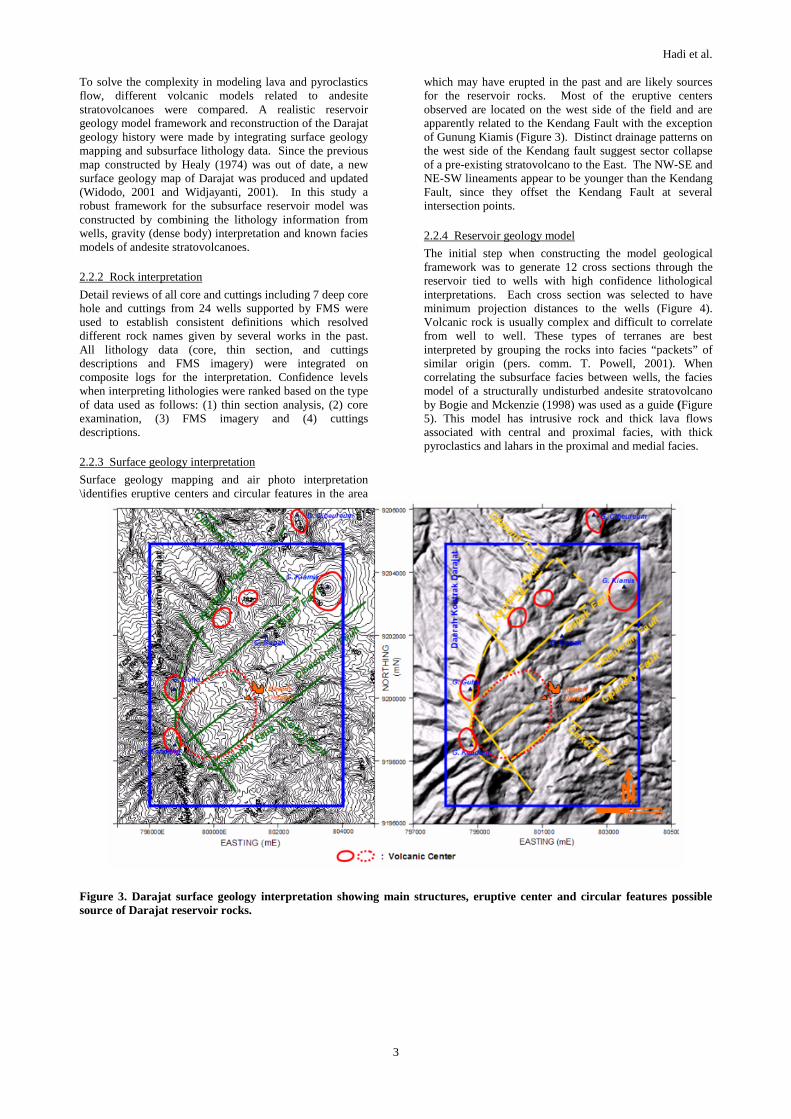
Surface geology mapping and air photo interpretation \identifies eruptive centers and circular features in the area
which may have erupted in the past and are likely sources for the reservoir rocks. Most of the eruptive centers observed are located on the west side of the field and are apparently related to the Kendang Fault with the exception of Gunung Kiamis (Figure 3). Distinct drainage patterns on the west side of the Kendang fault suggest sector collapse of a pre-existing stratovolcano to the East. The NW-SE and NE-SW lineaments appear to be younger than the Kendang Fault, since they offset the Kendang Fault at several intersection points.
2.2.4 Reservoir geology model
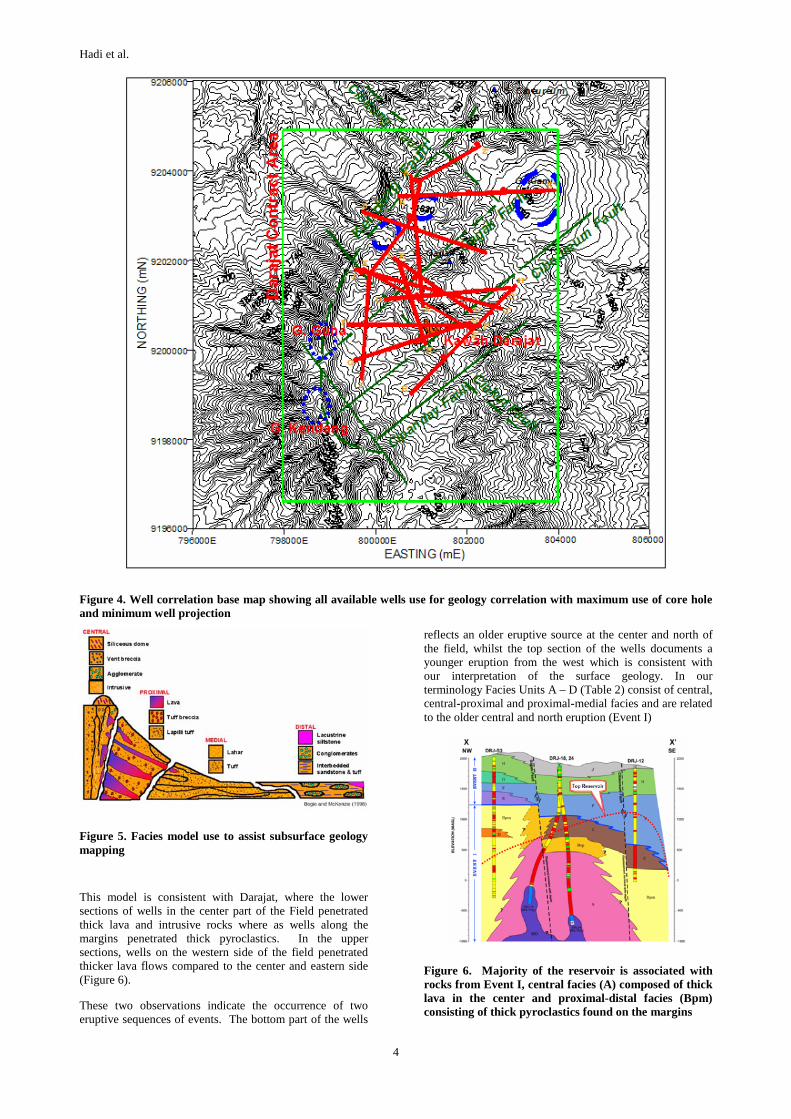
The initial step when constructing the model geological framework was to generate 12 cross sections through the reservoir tied to wells with high confidence lithological interpretations. Each cross section was selected to have minimum projection distances to the wells (Figure 4). Volcanic rock is usually complex and difficult to correlate from well to well. These types of terranes are best interpreted by grouping the rocks into facies “packets” of similar origin (pers. comm. T. Powell, 2001). When correlating the subsurface facies between wells, the facies model of a structurally undisturbed andesite stratovolcano by Bogie and Mckenzie (1998) was used as a guide (Figure 5). This model has intrusive rock and thick lava flows associated with central and proximal facies, with thick pyroclastics and lahars in the proximal and medial facies.
Figure 3. Darajat surface geology interpretation showing main structures, eruptive center and circular features possible source of Darajat reservoir rocks.
Hadi et al.
4
Figure 4. Well correlation base map showing all available wells use for geology correlation with maximum use of core hole and minimum well projection
Figure 5. Facies model use to assist subsurface geology mapping
This model is consistent with Darajat, where the lower sections of wells in the center part of the Field penetrated thick lava and intrusive rocks where as wells along the margins penetrated thick pyroclastics. In the upper sections, wells on the western side of the field penetrated thicker lava flows compared to the center and eastern side (Figure 6).
These two observations indicate the occurrence of two eruptive sequences of events. The bottom part of the wells
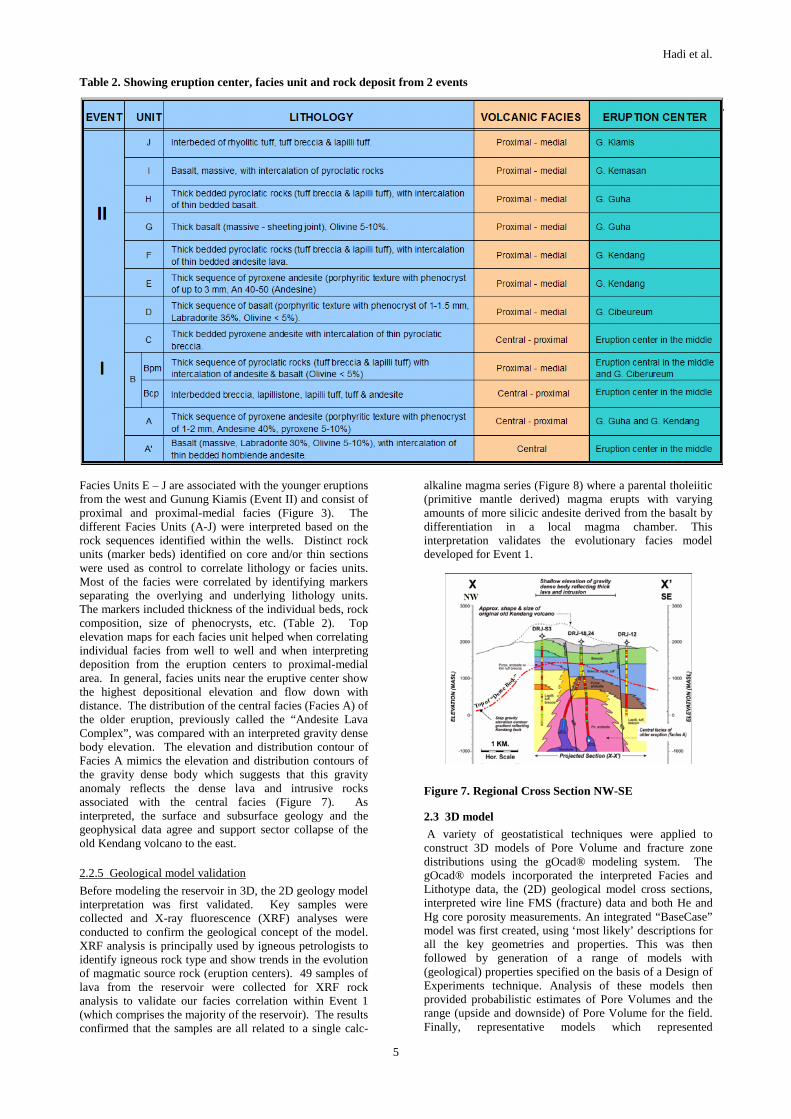
reflects an older eruptive source at the center and north of the field, whilst the top section of the wells documents a younger eruption from the west which is consistent with our interpretation of the surface geology. In our terminology Facies Units A – D (Table 2) consist of central, central-proximal and proximal-medial facies and are related to the older central and north eruption (Event I)
Figure 6. Majority of the reservoir is associated with rocks from Event I, central facies (A) composed of thick lava in the center and proximal-distal facies (Bpm) consisting of thick pyroclastics found on the margins
Hadi et al.
5
Table 2. Showing eruption center, facies unit and rock deposit from 2 events
Facies Units E – J are associated with the younger eruptions from the west and Gunung Kiamis (Event II) and consist of proximal and proximal-medial facies (Figure 3). The different Facies Units (A-J) were interpreted based on the rock sequences identified within the wells. Distinct rock units (marker beds) identified on core and/or thin sections were used as control to correlate lithology or facies units. Most of the facies were correlated by identifying markers separating the overlying and underlying lithology units. The markers included thickness of the individual beds, rock composition, size of phenocrysts, etc. (Table 2). Top elevation maps for each facies unit helped when correlating individual facies from well to well and when interpreting deposition from the eruption centers to proximal-medial area. In general, facies units near the eruptive center show the highest depositional elevation and flow down with distance. The distribution of the central facies (Facies A) of the older eruption, previously called the “Andesite Lava Complex”, was compared with an interpreted gravity dense body elevation. The elevation and distribution contour of Facies A mimics the elevation and distribution contours of the gravity dense body which suggests that this gravity anomaly reflects the dense lava and intrusive rocks associated with the central facies (Figure 7). As interpreted, the surface and subsurface geology and the geophysical data agree and support sector collapse of the old Kendang volcano to the east.
2.2.5 Geological model validation
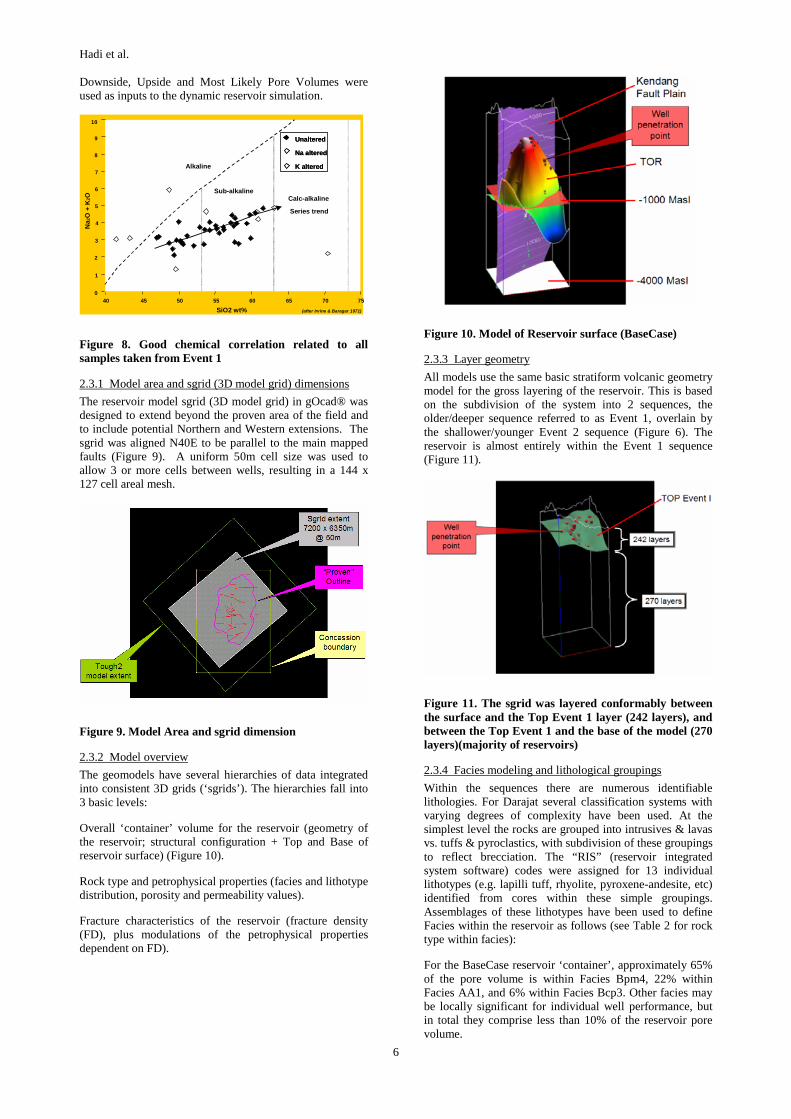
Before modeling the reservoir in 3D, the 2D geology model interpretation was first validated. Key samples were collected and X-ray fluorescence (XRF) analyses were conducted to confirm the geological concept of the model. XRF analysis is principally used by igneous petrologists to identify igneous rock type and show trends in the evolution of magmatic source rock (eruption centers). 49 samples of lava from the reservoir were collected for XRF rock analysis to validate our facies correlation within Event 1 (which comprises the majority of the reservoir). The results confirmed that the samples are all related to a single calc-
alkaline magma series (Figure 8) where a parental tholeiitic (primitive mantle derived) magma erupts with varying amounts of more silicic andesite derived from the basalt by differentiation in a local magma chamber. This interpretation validates the evolutionary facies model developed for Event 1.
Figure 7. Regional Cross Section NW-SE
2.3 3D model
A variety of geostatistical techniques were applied to construct 3D models of Pore Volume and fracture zone distributions using the gOcad® modeling system. The gOcad® models incorporated the interpreted Facies and Lithotype data, the (2D) geological model cross sections, interpreted wire line FMS (fracture) data and both He and Hg core porosity measurements. An integrated “BaseCase” model was first created, using ‘most likely’ descriptions for all the key geometries and properties. This was then followed by generation of a range of models with (geological) properties specified on the basis of a Design of Experiments technique. Analysis of these models then provided probabilistic estimates of Pore Volumes and the range (upside and downside) of Pore Volume for the field. Finally, representative models which represented
Hadi et al.
6
Downside, Upside and Most Likely Pore Volumes were used as inputs to the dynamic reservoir simulation.
10
9
8
7
6
5
4
3
2
1
040 45 50 55 60 65 70 75
SiO2 wt%
Na2
O +
K2O
Alkaline
Sub-alkalineCalc-alkaline
Series trend
Unaltered
Na altered
K altered
10
9
8
7
6
5
4
3
2
1
040 45 50 55 60 65 70 75
SiO2 wt%
Na2
O +
K2O
Alkaline
Sub-alkalineCalc-alkaline
Series trend
Unaltered
Na altered
K altered
Unaltered
Na altered
K altered
(after Irvine & Baragar 1971)
Figure 8. Good chemical correlation related to all samples taken from Event 1
2.3.1 Model area and sgrid (3D model grid) dimensions
The reservoir model sgrid (3D model grid) in gOcad® was designed to extend beyond the proven area of the field and to include potential Northern and Western extensions. The sgrid was aligned N40E to be parallel to the main mapped faults (Figure 9). A uniform 50m cell size was used to allow 3 or more cells between wells, resulting in a 144 x 127 cell areal mesh.
Figure 9. Model Area and sgrid dimension
2.3.2 Model overview
The geomodels have several hierarchies of data integrated into consistent 3D grids (‘sgrids’). The hierarchies fall into 3 basic levels:
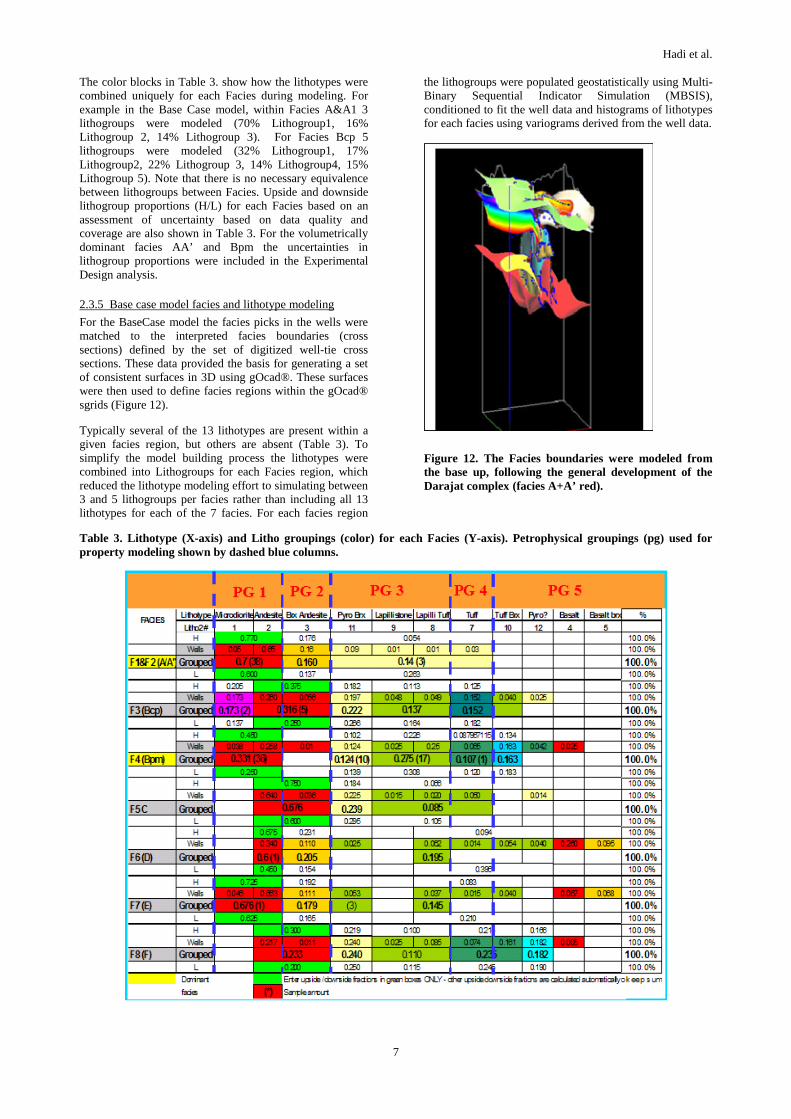
Overall ‘container’ volume for the reservoir (geometry of the reservoir; structural configuration + Top and Base of reservoir surface) (Figure 10).
Rock type and petrophysical properties (facies and lithotype distribution, porosity and permeability values).
Fracture characteristics of the reservoir (fracture density (FD), plus modulations of the petrophysical properties dependent on FD).
Figure 10. Model of Reservoir surface (BaseCase)
2.3.3 Layer geometry
All models use the same basic stratiform volcanic geometry model for the gross layering of the reservoir. This is based on the subdivision of the system into 2 sequences, the older/deeper sequence referred to as Event 1, overlain by the shallower/younger Event 2 sequence (Figure 6). The reservoir is almost entirely within the Event 1 sequence (Figure 11).
Figure 11. The sgrid was layered conformably between the surface and the Top Event 1 layer (242 layers), and between the Top Event 1 and the base of the model (270 layers)(majority of reservoirs)
2.3.4 Facies modeling and lithological groupings
Within the sequences there are numerous identifiable lithologies. For Darajat several classification systems with varying degrees of complexity have been used. At the simplest level the rocks are grouped into intrusives & lavas vs. tuffs & pyroclastics, with subdivision of these groupings to reflect brecciation. The “RIS” (reservoir integrated system software) codes were assigned for 13 individual lithotypes (e.g. lapilli tuff, rhyolite, pyroxene-andesite, etc) identified from cores within these simple groupings. Assemblages of these lithotypes have been used to define Facies within the reservoir as follows (see Table 2 for rock type within facies):
For the BaseCase reservoir ‘container’, approximately 65% of the pore volume is within Facies Bpm4, 22% within Facies AA1, and 6% within Facies Bcp3. Other facies may be locally significant for individual well performance, but in total they comprise less than 10% of the reservoir pore volume.
Hadi et al.
7
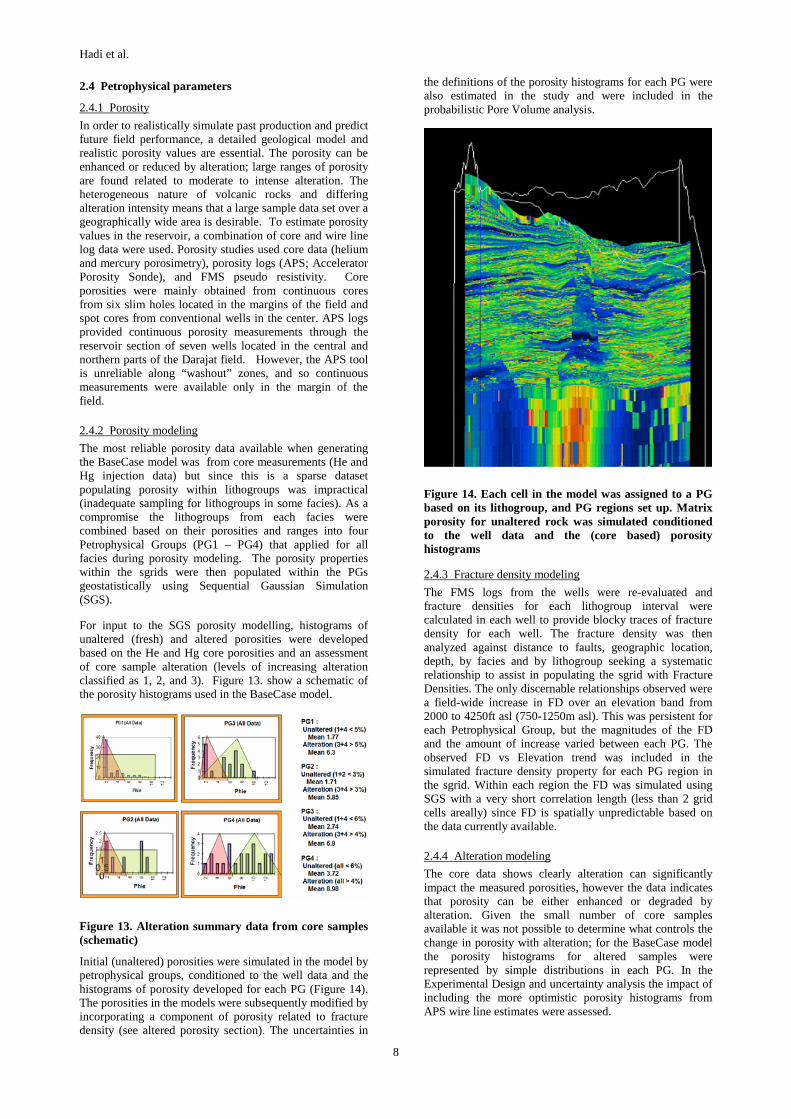
The color blocks in Table 3. show how the lithotypes were combined uniquely for each Facies during modeling. For example in the Base Case model, within Facies A&A1 3 lithogroups were modeled (70% Lithogroup1, 16% Lithogroup 2, 14% Lithogroup 3). For Facies Bcp 5 lithogroups were modeled (32% Lithogroup1, 17% Lithogroup2, 22% Lithogroup 3, 14% Lithogroup4, 15% Lithogroup 5). Note that there is no necessary equivalence between lithogroups between Facies. Upside and downside lithogroup proportions (H/L) for each Facies based on an assessment of uncertainty based on data quality and coverage are also shown in Table 3. For the volumetrically dominant facies AA’ and Bpm the uncertainties in lithogroup proportions were included in the Experimental Design analysis.
2.3.5 Base case model facies and lithotype modeling
For the BaseCase model the facies picks in the wells were matched to the interpreted facies boundaries (cross sections) defined by the set of digitized well-tie cross sections. These data provided the basis for generating a set of consistent surfaces in 3D using gOcad®. These surfaces were then used to define facies regions within the gOcad® sgrids (Figure 12).
Typically several of the 13 lithotypes are present within a given facies region, but others are absent (Table 3). To simplify the model building process the lithotypes were combined into Lithogroups for each Facies region, which reduced the lithotype modeling effort to simulating between 3 and 5 lithogroups per facies rather than including all 13 lithotypes for each of the 7 facies. For each facies region
the lithogroups were populated geostatistically using Multi-Binary Sequential Indicator Simulation (MBSIS), conditioned to fit the well data and histograms of lithotypes for each facies using variograms derived from the well data.
Figure 12. The Facies boundaries were modeled from the base up, following the general development of the Darajat complex (facies A+A’ red).
Table 3. Lithotype (X-axis) and Litho groupings (color) for each Facies (Y-axis). Petrophysical groupings (pg) used for property modeling shown by dashed blue columns.
Hadi et al.
8
2.4 Petrophysical parameters
2.4.1 Porosity
In order to realistically simulate past production and predict future field performance, a detailed geological model and realistic porosity values are essential. The porosity can be enhanced or reduced by alteration; large ranges of porosity are found related to moderate to intense alteration. The heterogeneous nature of volcanic rocks and differing alteration intensity means that a large sample data set over a geographically wide area is desirable. To estimate porosity values in the reservoir, a combination of core and wire line log data were used. Porosity studies used core data (helium and mercury porosimetry), porosity logs (APS; Accelerator Porosity Sonde), and FMS pseudo resistivity. Core porosities were mainly obtained from continuous cores from six slim holes located in the margins of the field and spot cores from conventional wells in the center. APS logs provided continuous porosity measurements through the reservoir section of seven wells located in the central and northern parts of the Darajat field. However, the APS tool is unreliable along “washout” zones, and so continuous measurements were available only in the margin of the field.
2.4.2 Porosity modeling
The most reliable porosity data available when generating the BaseCase model was from core measurements (He and Hg injection data) but since this is a sparse dataset populating porosity within lithogroups was impractical (inadequate sampling for lithogroups in some facies). As a compromise the lithogroups from each facies were combined based on their porosities and ranges into four Petrophysical Groups (PG1 – PG4) that applied for all facies during porosity modeling. The porosity properties within the sgrids were then populated within the PGs geostatistically using Sequential Gaussian Simulation (SGS).
For input to the SGS porosity modelling, histograms of unaltered (fresh) and altered porosities were developed based on the He and Hg core porosities and an assessment of core sample alteration (levels of increasing alteration classified as 1, 2, and 3). Figure 13. show a schematic of the porosity histograms used in the BaseCase model.
Figure 13. Alteration summary data from core samples (schematic)
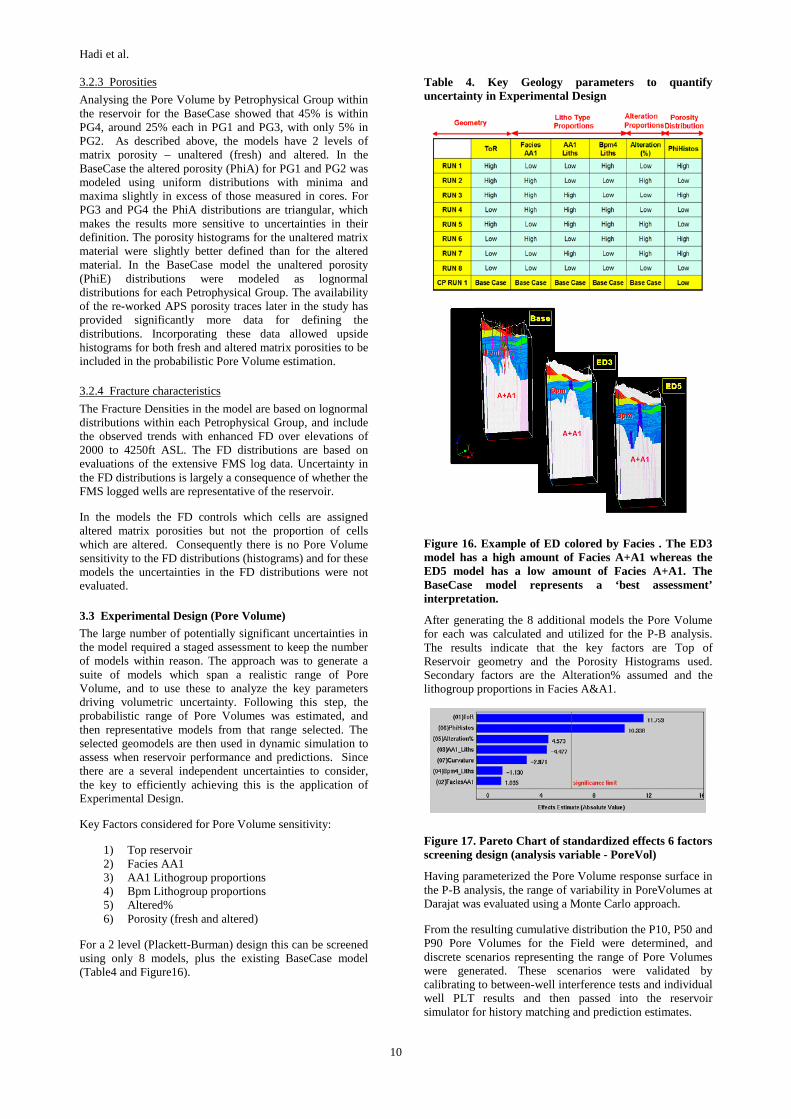
Initial (unaltered) porosities were simulated in the model by petrophysical groups, conditioned to the well data and the histograms of porosity developed for each PG (Figure 14). The porosities in the models were subsequently modified by incorporating a component of porosity related to fracture density (see altered porosity section). The uncertainties in
the definitions of the porosity histograms for each PG were also estimated in the study and were included in the probabilistic Pore Volume analysis.
Figure 14. Each cell in the model was assigned to a PG based on its lithogroup, and PG regions set up. Matrix porosity for unaltered rock was simulated conditioned to the well data and the (core based) porosity histograms
2.4.3 Fracture density modeling
The FMS logs from the wells were re-evaluated and fracture densities for each lithogroup interval were calculated in each well to provide blocky traces of fracture density for each well. The fracture density was then analyzed against distance to faults, geographic location, depth, by facies and by lithogroup seeking a systematic relationship to assist in populating the sgrid with Fracture Densities. The only discernable relationships observed were a field-wide increase in FD over an elevation band from 2000 to 4250ft asl (750-1250m asl). This was persistent for each Petrophysical Group, but the magnitudes of the FD and the amount of increase varied between each PG. The observed FD vs Elevation trend was included in the simulated fracture density property for each PG region in the sgrid. Within each region the FD was simulated using SGS with a very short correlation length (less than 2 grid cells areally) since FD is spatially unpredictable based on the data currently available.
2.4.4 Alteration modeling
The core data shows clearly alteration can significantly impact the measured porosities, however the data indicates that porosity can be either enhanced or degraded by alteration. Given the small number of core samples available it was not possible to determine what controls the change in porosity with alteration; for the BaseCase model the porosity histograms for altered samples were represented by simple distributions in each PG. In the Experimental Design and uncertainty analysis the impact of including the more optimistic porosity histograms from APS wire line estimates were assessed.

Hadi et al.
9
The core data itself provided no obvious basis for determining how to assign “altered” rock property flags to cells within the sgrid between the wells. For this study model the paradigm that alteration is related to fracture density was invoked. The fraction of altered to total core samples for each Petrophysical Group was calculated, and this fraction translated to an equivalent fracture density cutoff from the appropriate FD cumulative distribution function (Figure 15). Each cell in each Petrophysical Group which had an FD greater than that cutoff were then assigned an altered porosity (PhiA) by geostatistically simulating (SGS) using the appropriate histogram of altered rock porosity.
Figure 15. Fracture density thresholds used to assign alteration property
In the BaseCase model the proportions of altered core samples for the Petrophysical Groups were PG1 = 0.20, PG2 = 0.38, PG3 = 0.58, PG4 = 0.59. These equate to FD cutoffs for PG1 = 0.55, PG2 = 0.35, PG3 = 0.07, PG4 = 0.005. This implies that a relatively low proportion of PG1 rocks (intrusives and lavas) are altered, i.e. only those with a very high fracture density (>0.55), whereas a high proportion of PG3 and PG4 rocks (tuffs and pyroclastics) are altered, corresponding to those which have very low fracture densities (>0.07 and > 0.005 respectively). Overall this is believed to be a plausible solution based on our current understanding of the reservoir rocks.
3. UNCERTAINTY DEFINITION
The BaseCase model is an attempt to provide a ‘most likely’ scenario incorporating a lot of prior interpretation, core data, and information from the well production data. However, this is not known to represent a P50 ) case. For assessment of the range of possible outcomes for the expansion project, a range of model scenarios were generated which captured the impacts of the key uncertainties in the model building.
The uncertainties in the model have 2 main impacts: Firstly the Pore-Volume of the reservoir can vary, which impacts the total resource base for the project and hence project life. Secondly, the connectivity of the reservoir can vary, which alters drainage areas and well performance predictions (not discussed in this paper). In the hierarchical approach of this study, the uncertainties were categorized into 3 basic levels:
3.1 Overall ‘container’ volume uncertainty: ( top and base of the reservoir).
The overall layer geometry in the model is constrained by the ‘Top of Event 1’ surface. By far the major part of the reservoir is within the Event 1 sequence, and the portion within Event 2 is defined by well penetrations, so variations in the geometry which impact the pore-volume are
primarily a consequence of uncertainty in the Top of Reservoir (ToR) surface. The BaseCase ToR surface incorporates the well picks, the hand contoured ToR maps, and the MT32ohm contour data. In the uncertainty assessment the well picks for Top of Reservoir (measured from PT data) remained fixed while the MT32ohm contours were discarded and the resulting ToR surface warped to produce optimistic and pessimistic scenarios.
The optimistic (upside) ToR surface was generated in gOcad® by running the DSI interpolator on the well picks alone, then applying a Range Thickness Constraint (+500ft to -5000ft) from the BaseCase ToR surface. The result was a ToR surface which still ties the wells but which is significantly broader on the flanks.
The pessimistic (downside) ToR surface was also made using the well picks as control nodes, but also included the lowest closing contour from the BaseCase ToR surface. Without the MT32ohm and hand drawn ToR contours as ‘soft’ control in gOcad® this results in a tightly ‘wrapped’ surface where wells tend to be located at local peaks. The pessimistic ToR surface was adjusted using a Range Thickness Constraint (0 to +500ft) to constrain it to be deeper than the BaseCase ToR on the Eastern margin of the model.
Based on the MEQ data and the Geysers analogue there is no reason to limit the bottom of the reservoir to the deepest productive well’s TD, since permeable zones are still found at the TD of the deepest well located at the margin of the field. In the models the Base of Reservoir was fixed at -4000m / -13120ft ss, slightly below the deepest MEQ data event (Figure 2). Sensitivity to a shallower Base of the reservoir was evaluated by applying limits in the dynamic simulation.
3.2 Rock type and petrophysical uncertainties
3.2.1 Facies
The main components contributing to the BaseCase model Pore Volume are Facies AA1 (21%) and Facies Bpm (64%). Facies Bcp only comprises around 6% of the Pore Volume in the BaseCase model. Other Facies below the ToR are volumetrically minor components. For uncertainty assessment the well-tie cross-sections were re-interpreted to provide optimistic and pessimistic versions for the top of Facies AA1. These surfaces were used to redefine the Upside / Downside cases of the Facies AA1 and the Bpm Facies distributions.
3.2.2 Lithotypes
Lithogroups were distributed geostatistically within the Facies by MBSIS using the well data and lithogroup proportions as control. As described above, the BaseCase model used lithogroup proportions for each Facies which were identical to those observed in the wells. However, the actual lithogroup proportions within each Facies are uncertain since the observed data may be biased as a consequence of the locations of the wells. To address this uncertainty alternative lithogroup proportions were generated for each Facies. In terms of Pore Volume, the optimistic cases have higher proportions of pyroclastics and tuffs, whereas the pessimistic cases have greater proportions of intrusives and lavas. Given the dominance of the Bpm and AA1 Facies in Pore Volumes, the lithogroup proportions for these were independently varied to reflect these uncertainties. Lithogroup proportions for the other Facies remained as per the BaseCase (i.e. as observed in the core data).
Hadi et al.
10
3.2.3 Porosities
Analysing the Pore Volume by Petrophysical Group within the reservoir for the BaseCase showed that 45% is within PG4, around 25% each in PG1 and PG3, with only 5% in PG2. As described above, the models have 2 levels of matrix porosity – unaltered (fresh) and altered. In the BaseCase the altered porosity (PhiA) for PG1 and PG2 was modeled using uniform distributions with minima and maxima slightly in excess of those measured in cores. For PG3 and PG4 the PhiA distributions are triangular, which makes the results more sensitive to uncertainties in their definition. The porosity histograms for the unaltered matrix material were slightly better defined than for the altered material. In the BaseCase model the unaltered porosity (PhiE) distributions were modeled as lognormal distributions for each Petrophysical Group. The availability of the re-worked APS porosity traces later in the study has provided significantly more data for defining the distributions. Incorporating these data allowed upside histograms for both fresh and altered matrix porosities to be included in the probabilistic Pore Volume estimation.
3.2.4 Fracture characteristics
The Fracture Densities in the model are based on lognormal distributions within each Petrophysical Group, and include the observed trends with enhanced FD over elevations of 2000 to 4250ft ASL. The FD distributions are based on evaluations of the extensive FMS log data. Uncertainty in the FD distributions is largely a consequence of whether the FMS logged wells are representative of the reservoir.
In the models the FD controls which cells are assigned altered matrix porosities but not the proportion of cells which are altered. Consequently there is no Pore Volume sensitivity to the FD distributions (histograms) and for these models the uncertainties in the FD distributions were not evaluated.
3.3 Experimental Design (Pore Volume)
The large number of potentially significant uncertainties in the model required a staged assessment to keep the number of models within reason. The approach was to generate a suite of models which span a realistic range of Pore Volume, and to use these to analyze the key parameters driving volumetric uncertainty. Following this step, the probabilistic range of Pore Volumes was estimated, and then representative models from that range selected. The selected geomodels are then used in dynamic simulation to assess when reservoir performance and predictions. Since there are a several independent uncertainties to consider, the key to efficiently achieving this is the application of Experimental Design.
Key Factors considered for Pore Volume sensitivity:
1) Top reservoir 2) Facies AA1 3) AA1 Lithogroup proportions 4) Bpm Lithogroup proportions 5) Altered% 6) Porosity (fresh and altered)
For a 2 level (Plackett-Burman) design this can be screened using only 8 models, plus the existing BaseCase model (Table4 and Figure16).
Table 4. Key Geology parameters to quantify uncertainty in Experimental Design
Figure 16. Example of ED colored by Facies . The ED3 model has a high amount of Facies A+A1 whereas the ED5 model has a low amount of Facies A+A1. The BaseCase model represents a ‘best assessment’ interpretation.
After generating the 8 additional models the Pore Volume for each was calculated and utilized for the P-B analysis. The results indicate that the key factors are Top of Reservoir geometry and the Porosity Histograms used. Secondary factors are the Alteration% assumed and the lithogroup proportions in Facies A&A1.
Figure 17. Pareto Chart of standardized effects 6 factors screening design (analysis variable - PoreVol)
Having parameterized the Pore Volume response surface in the P-B analysis, the range of variability in PoreVolumes at Darajat was evaluated using a Monte Carlo approach.
From the resulting cumulative distribution the P10, P50 and P90 Pore Volumes for the Field were determined, and discrete scenarios representing the range of Pore Volumes were generated. These scenarios were validated by calibrating to between-well interference tests and individual well PLT results and then passed into the reservoir simulator for history matching and prediction estimates.

Hadi et al.
11
4. SUMMARY
The work undertaken to characterize the subsurface and its associated uncertainties for Darajat Field can be summarized as follows;
1. Surface mapping, core, cutting and XRF data indicate Darajat is related to a single calc-alkaline series trend (single eruptive center)
2. A BaseCase model was generated constrained by soft data from gravity, MT and MEQ and hard data from well cores and cuttings
3. Core data is relatively sparse but was used to estimate ranges of fresh matrix porosities for key PGs and altered rock porosities and proportions (uncertainty range used APS and FMS)
4. PG classification simplified the lithogroups into 4 consistent rock types for porosity and fracture density modeling
5. Altered rock was modeled using an assumed dependency of alteration on fracture density within each PG.
6. The models contain fracture connectivity and permeabilities which are consistent with and calibrate to the observed well production data.
7. Primary factors controlling Pore Volume uncertainty in the model are the TOR and the (fresh and altered) porosity histograms. Secondary factors are the degree of alteration and the lithology proportions is the facies themselves
8. A key finding is that the BaseCase model is conservative based on the estimated pore volume distribution for the models.
REFERENCES
Amoseas Indonesia.: Subsurface Technical Review – Reservoir Characterization (Static Model), AI internal report, 2003.
Amoseas Indonesia,: Darajat Reservoir Simulation – Reservoir Framework and Petrophysical Input, AI internal report, 2002.
Hadi, Julfi,: A hydrothermal Alteration Study to Assess Temperature and Overprinting From S-1 Exploration Well, North Darajat Field, Indonesia, this thesis was made for the University of Auckland, Geothermal Institute, New Zealand, 1997.
Harrison, Christopher.: Darajat Earth Model Overview part I-III (workshop notes), workshop made for AI, ChevronTexaco Energy Technology Company ,2004.
Keller, Joao.: Fracture Characterization and Density Modeling in The Darajat Geothermal Field (workshop notes), workshop made for AI, ChevronTexaco Energy Technology Company, 2004.
Narr, Wayne, et all.: Fracture Reservoir Characterization Approach at East Painter Reservoir Field, Wyoming, for Prediction & Simulation of Open Fractures, ChevronTexaco Energy Technology Company, San Ramon, 2001.
Satik C, Walters M, Horne, R.N.: Adsorption Characteristics of Rocks from Vapor-Dominated Geothermal Reservoir at The Geysers, Proceedings Twenty First Workshop on Geothermal Reservoir Engineering, Stanford University, Stanford, California, 1996.
Schlumberger Data Service Jakarta.: Porosity Sudy Using FMS and APS Data S3A, DRJ-15, 17, and 19 Darajat Geothermal Field, 2004.
Stimac J.A, Powell T.S, Golla G.U.: Porosity and Permeability of the Tiwi Geothermal Field. Philiphines, Based on Continuous and Spot Core Measurements, Geothermics 33, (2004,), page 87-107.
Geosystem srl.: Darajat Microseismicity Studies: Seismic Tomography and Moment Tensor Analysis, report made for AI, 2004.
PB Power.: Reservoir simulation and reserves assessment 1999, Report made for AI, 2000.