overview of current flux practices and challenges for the ... · overview of current flux practices...
TRANSCRIPT
Overview of Current Flux Practices and Challenges for the Oxygen Steelmaking Process
Rich Brelowski, Carmeuse Lime 5633 Woodridge Dr, Toledo, OH 43263
Tel: 419-882-8922 Fax: 419-882-6089
E-mail: [email protected]
Larry Wolfe, Carmeuse Lime 11 Stanwix Street, Pittsburgh, PA 15222
Tel.: 412-777-0702 Fax: 412-777-0727
E-mail: [email protected]
Key words: dolomitic and high calcium lime, hot metal chemistry, basic oxygen process, secondary metallurgical treatment, sulfur in lime
Abstract
This paper will present an overview of comparative domestic and international flux practices for several oxygen steelmaking processes. Comparative data is examined and historical developments in flux practices are discussed. Challenges facing oxygen steelmakers in optimizing operations based on blast furnace developments, hot metal quality, secondary metallurgy and raw material issues are addressed. Recent successful trials in the BOF involving lime with increased sulfur levels related to future environmental requirements that impact lime production and product quality are also presented.
History of Basic Oxygen Steelmaking The modern Basic Oxygen Steelmaking Process we have today is a result of the following innovations:1
(1) 1928 Oxygen becomes available is large quantities. (2) 1936-39 Lellep trial was performed using bottom blowing in a 1 ton converter. (3) 1939 Schwartz patents an oxygen top blowing process. (4) 1949 Voest-Alpine makes a 2 tons trial heat by top blowing oxygen into a modified Bessemer Converter. (5) 1952 Voest-Alpine makes a 30 ton heat in Linz, Austria. (6) 1953 Donawitz, Austria begins basic steelmaking using the oxygen top blowing process in a 30 ton converter, and hence it
was called the LD process.
From this point on, there were several innovations to the LD process. There were 3 main methods for introduction of process gases. The primarily process gas is oxygen. Secondarily, natural gas and/or an inert gas for cooling or stirring are used. Oxygen is introduced either with a water cooled lance or through a tuyere in the bottom of the vessel. Stirring and cooling gases such as Argon, Nitrogen or Natural Gas are introduced through a tuyere or porous plug in the vessel bottom. The different configurations employed are numerous. There are still many steel producers using some version of the LD process. This may include bottom blowing or bottom stirring. There is a handful successfully using only a bottom blowing configuration. Refractories were a major limiting factor in furnace life and performance. The demand for better LD Process refractories fueled the growth and fortunes of numerous brick manufacturers from 1950 to 1970. Practice innovations such as slag blowing that began in the early 1990’s have changed the face of the North American refractory industry forever. The use of slag blowing in North America has also had a dramatic effect on vessel flux practice. As Basic Practice LD steelmaking began to grow, so did the need for support industries such as quicklime manufacturing. The rapid rate of growth in high tonnage LD steelmaking demanded the quick growth of the lime industry. To fill the need, lime production was engineered, funded and owned mainly by the steelmakers. Much of the lime producing capacity still used today was constructed in the 1960’s and 70’s. Much of the lime calcining technology is also of that era.
Many of the North American lime production facilities were owned by the steelmakers until about 1985. As the steelmakers put less emphasis on backwards integration into raw material sources, the lime plants were slowly sold off to other major commercial lime producers. Because the integrated steel industry has been viewed as a mature or declining market in North America, little capital had been invested to maintain current lime capacity or to add new lime capacity for steelmaking. Most of the new lime capacity that has recently been added has been to service other growing high tonnage consumers such as coal burning power plants. The technology used in these new lime plants has a lot to do with lime specifications for those target industries. This will be discussed in more detail later in this paper.
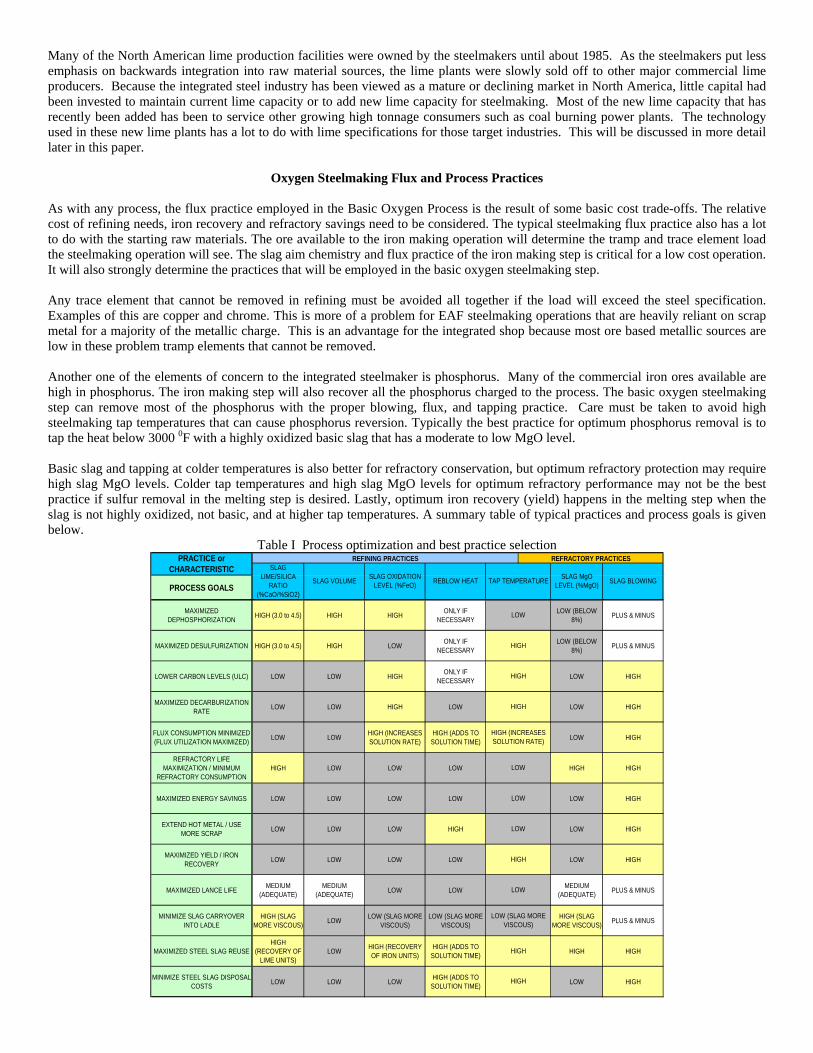
Oxygen Steelmaking Flux and Process Practices As with any process, the flux practice employed in the Basic Oxygen Process is the result of some basic cost trade-offs. The relative cost of refining needs, iron recovery and refractory savings need to be considered. The typical steelmaking flux practice also has a lot to do with the starting raw materials. The ore available to the iron making operation will determine the tramp and trace element load the steelmaking operation will see. The slag aim chemistry and flux practice of the iron making step is critical for a low cost operation. It will also strongly determine the practices that will be employed in the basic oxygen steelmaking step. Any trace element that cannot be removed in refining must be avoided all together if the load will exceed the steel specification. Examples of this are copper and chrome. This is more of a problem for EAF steelmaking operations that are heavily reliant on scrap metal for a majority of the metallic charge. This is an advantage for the integrated shop because most ore based metallic sources are low in these problem tramp elements that cannot be removed. Another one of the elements of concern to the integrated steelmaker is phosphorus. Many of the commercial iron ores available are high in phosphorus. The iron making step will also recover all the phosphorus charged to the process. The basic oxygen steelmaking step can remove most of the phosphorus with the proper blowing, flux, and tapping practice. Care must be taken to avoid high steelmaking tap temperatures that can cause phosphorus reversion. Typically the best practice for optimum phosphorus removal is to tap the heat below 3000 0F with a highly oxidized basic slag that has a moderate to low MgO level. Basic slag and tapping at colder temperatures is also better for refractory conservation, but optimum refractory protection may require high slag MgO levels. Colder tap temperatures and high slag MgO levels for optimum refractory performance may not be the best practice if sulfur removal in the melting step is desired. Lastly, optimum iron recovery (yield) happens in the melting step when the slag is not highly oxidized, not basic, and at higher tap temperatures. A summary table of typical practices and process goals is given below.
Table I Process optimization and best practice selection
PROCESS GOALS
MAXIMIZED DEPHOSPHORIZATION HIGH (3.0 to 4.5) HIGH HIGH ONLY IF
NECESSARYLOW (BELOW
8%) PLUS & MINUS
MAXIMIZED DESULFURIZATION HIGH (3.0 to 4.5) HIGH LOW ONLY IF NECESSARY
LOW (BELOW 8%) PLUS & MINUS
LOWER CARBON LEVELS (ULC) LOW LOW HIGH ONLY IF NECESSARY LOW HIGH
MAXIMIZED DECARBURIZATION RATE LOW LOW HIGH LOW LOW HIGH
FLUX CONSUMPTION MINIMIZED (FLUX UTILIZATION MAXIMIZED) LOW LOW HIGH (INCREASES
SOLUTION RATE)HIGH (ADDS TO
SOLUTION TIME) LOW HIGH
REFRACTORY LIFE MAXIMIZATION / MINIMUM
REFRACTORY CONSUMPTIONHIGH LOW LOW LOW HIGH HIGH
MAXIMIZED ENERGY SAVINGS LOW LOW LOW LOW LOW HIGH
EXTEND HOT METAL / USE MORE SCRAP LOW LOW LOW HIGH LOW HIGH
MAXIMIZED YIELD / IRON RECOVERY LOW LOW LOW LOW LOW HIGH
MAXIMIZED LANCE LIFE MEDIUM (ADEQUATE)
MEDIUM (ADEQUATE) LOW LOW MEDIUM
(ADEQUATE) PLUS & MINUS
MINIMIZE SLAG CARRYOVER INTO LADLE
HIGH (SLAG MORE VISCOUS) LOW LOW (SLAG MORE
VISCOUS)LOW (SLAG MORE
VISCOUS)HIGH (SLAG
MORE VISCOUS) PLUS & MINUS
MAXIMIZED STEEL SLAG REUSEHIGH
(RECOVERY OF LIME UNITS)
LOW HIGH (RECOVERY OF IRON UNITS)
HIGH (ADDS TO SOLUTION TIME) HIGH HIGH
MINIMIZE STEEL SLAG DISPOSAL COSTS LOW LOW LOW HIGH (ADDS TO
SOLUTION TIME) LOW HIGH
LOW (SLAG MORE VISCOUS)
HIGH
LOW
HIGH
HIGH
HIGH
HIGH
LOW
LOW
HIGH
PRACTICE or CHARACTERISTIC
TAP TEMPERATURE
REFINING PRACTICES REFRACTORY PRACTICES
SLAG VOLUME SLAG BLOWING
SLAG LIME/SILICA
RATIO (%CaO/%SiO2)
SLAG MgO LEVEL (%MgO)
SLAG OXIDATION LEVEL (%FeO) REBLOW HEAT
LOW
HIGH (INCREASES SOLUTION RATE)
LOW
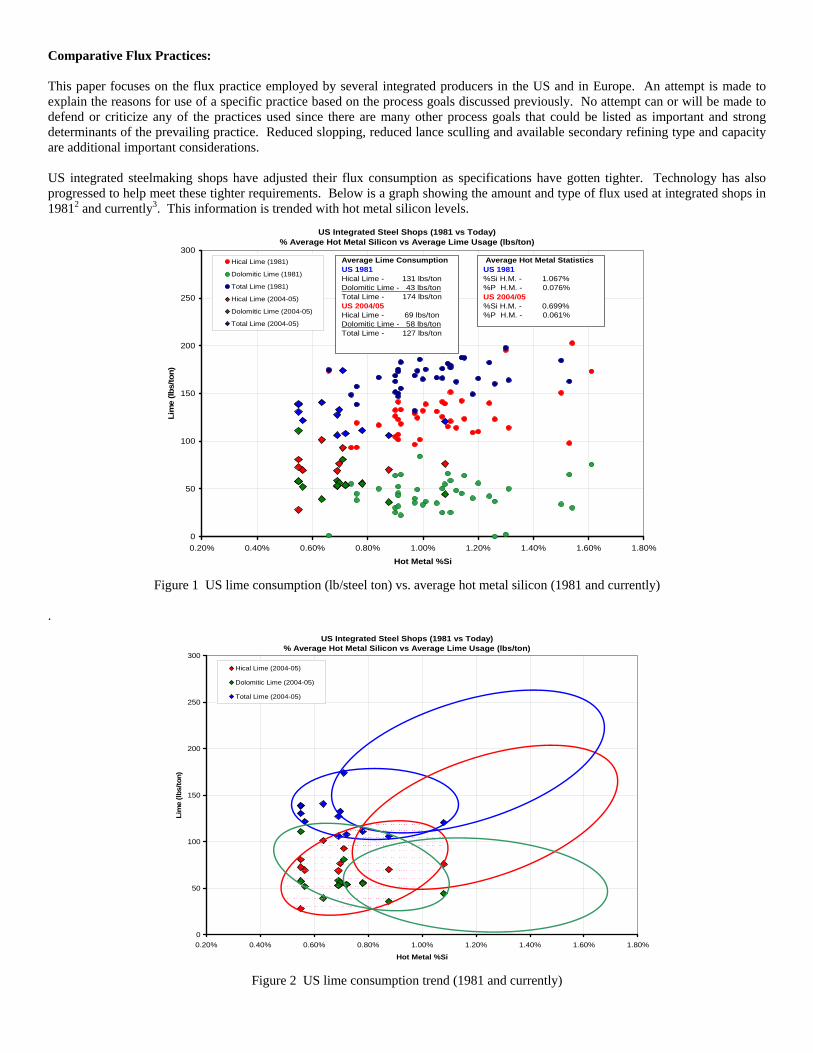
Comparative Flux Practices: This paper focuses on the flux practice employed by several integrated producers in the US and in Europe. An attempt is made to explain the reasons for use of a specific practice based on the process goals discussed previously. No attempt can or will be made to defend or criticize any of the practices used since there are many other process goals that could be listed as important and strong determinants of the prevailing practice. Reduced slopping, reduced lance sculling and available secondary refining type and capacity are additional important considerations. US integrated steelmaking shops have adjusted their flux consumption as specifications have gotten tighter. Technology has also progressed to help meet these tighter requirements. Below is a graph showing the amount and type of flux used at integrated shops in 19812 and currently3. This information is trended with hot metal silicon levels.
US Integrated Steel Shops (1981 vs Today)% Average Hot Metal Silicon vs Average Lime Usage (lbs/ton)
0
50
100
150
200
250
300
0.20% 0.40% 0.60% 0.80% 1.00% 1.20% 1.40% 1.60% 1.80%
Hot Metal %Si
Lim
e (lb
s/to
n)
Hical Lime (1981)
Dolomitic Lime (1981)
Total Lime (1981)
Hical Lime (2004-05)
Dolomitic Lime (2004-05)
Total Lime (2004-05)
Average Lime Consumption US 1981 Hical Lime - 131 lbs/ton Dolomitic Lime - 43 lbs/ton Total Lime - 174 lbs/ton US 2004/05 Hical Lime - 69 lbs/ton Dolomitic Lime - 58 lbs/ton Total Lime - 127 lbs/ton
Average Hot Metal Statistics US 1981 %Si H.M. - 1.067% %P H.M. - 0.076% US 2004/05 %Si H.M. - 0.699% %P H.M. - 0.061%
Figure 1 US lime consumption (lb/steel ton) vs. average hot metal silicon (1981 and currently)
.
US Integrated Steel Shops (1981 vs Today)% Average Hot Metal Silicon vs Average Lime Usage (lbs/ton)
0
50
100
150
200
250
300
0.20% 0.40% 0.60% 0.80% 1.00% 1.20% 1.40% 1.60% 1.80%
Hot Metal %Si
Lim
e (lb
s/to
n)
Hical Lime (2004-05)
Dolomitic Lime (2004-05)
Total Lime (2004-05)
Figure 2 US lime consumption trend (1981 and currently)
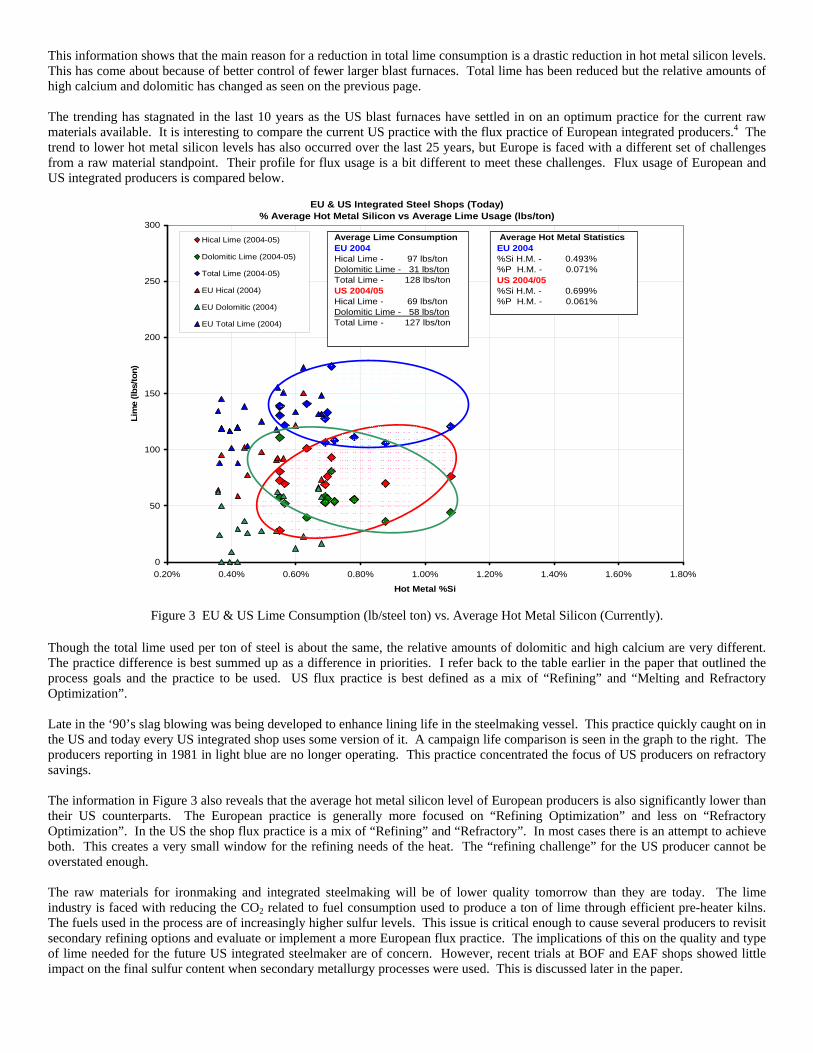
This information shows that the main reason for a reduction in total lime consumption is a drastic reduction in hot metal silicon levels. This has come about because of better control of fewer larger blast furnaces. Total lime has been reduced but the relative amounts of high calcium and dolomitic has changed as seen on the previous page. The trending has stagnated in the last 10 years as the US blast furnaces have settled in on an optimum practice for the current raw materials available. It is interesting to compare the current US practice with the flux practice of European integrated producers.4 The trend to lower hot metal silicon levels has also occurred over the last 25 years, but Europe is faced with a different set of challenges from a raw material standpoint. Their profile for flux usage is a bit different to meet these challenges. Flux usage of European and US integrated producers is compared below.
EU & US Integrated Steel Shops (Today)% Average Hot Metal Silicon vs Average Lime Usage (lbs/ton)
0
50
100
150
200
250
300
0.20% 0.40% 0.60% 0.80% 1.00% 1.20% 1.40% 1.60% 1.80%
Hot Metal %Si
Lim
e (lb
s/to
n)
Hical Lime (2004-05)
Dolomitic Lime (2004-05)
Total Lime (2004-05)
EU Hical (2004)
EU Dolomitic (2004)
EU Total Lime (2004)
Average Lime Consumption EU 2004 Hical Lime - 97 lbs/ton Dolomitic Lime - 31 lbs/ton Total Lime - 128 lbs/ton US 2004/05 Hical Lime - 69 lbs/ton Dolomitic Lime - 58 lbs/ton Total Lime - 127 lbs/ton
Average Hot Metal Statistics EU 2004 %Si H.M. - 0.493% %P H.M. - 0.071% US 2004/05 %Si H.M. - 0.699% %P H.M. - 0.061%
Figure 3 EU & US Lime Consumption (lb/steel ton) vs. Average Hot Metal Silicon (Currently).
Though the total lime used per ton of steel is about the same, the relative amounts of dolomitic and high calcium are very different. The practice difference is best summed up as a difference in priorities. I refer back to the table earlier in the paper that outlined the process goals and the practice to be used. US flux practice is best defined as a mix of “Refining” and “Melting and Refractory Optimization”. Late in the ‘90’s slag blowing was being developed to enhance lining life in the steelmaking vessel. This practice quickly caught on in the US and today every US integrated shop uses some version of it. A campaign life comparison is seen in the graph to the right. The producers reporting in 1981 in light blue are no longer operating. This practice concentrated the focus of US producers on refractory savings. The information in Figure 3 also reveals that the average hot metal silicon level of European producers is also significantly lower than their US counterparts. The European practice is generally more focused on “Refining Optimization” and less on “Refractory Optimization”. In the US the shop flux practice is a mix of “Refining” and “Refractory”. In most cases there is an attempt to achieve both. This creates a very small window for the refining needs of the heat. The “refining challenge” for the US producer cannot be overstated enough. The raw materials for ironmaking and integrated steelmaking will be of lower quality tomorrow than they are today. The lime industry is faced with reducing the CO2 related to fuel consumption used to produce a ton of lime through efficient pre-heater kilns. The fuels used in the process are of increasingly higher sulfur levels. This issue is critical enough to cause several producers to revisit secondary refining options and evaluate or implement a more European flux practice. The implications of this on the quality and type of lime needed for the future US integrated steelmaker are of concern. However, recent trials at BOF and EAF shops showed little impact on the final sulfur content when secondary metallurgy processes were used. This is discussed later in the paper.
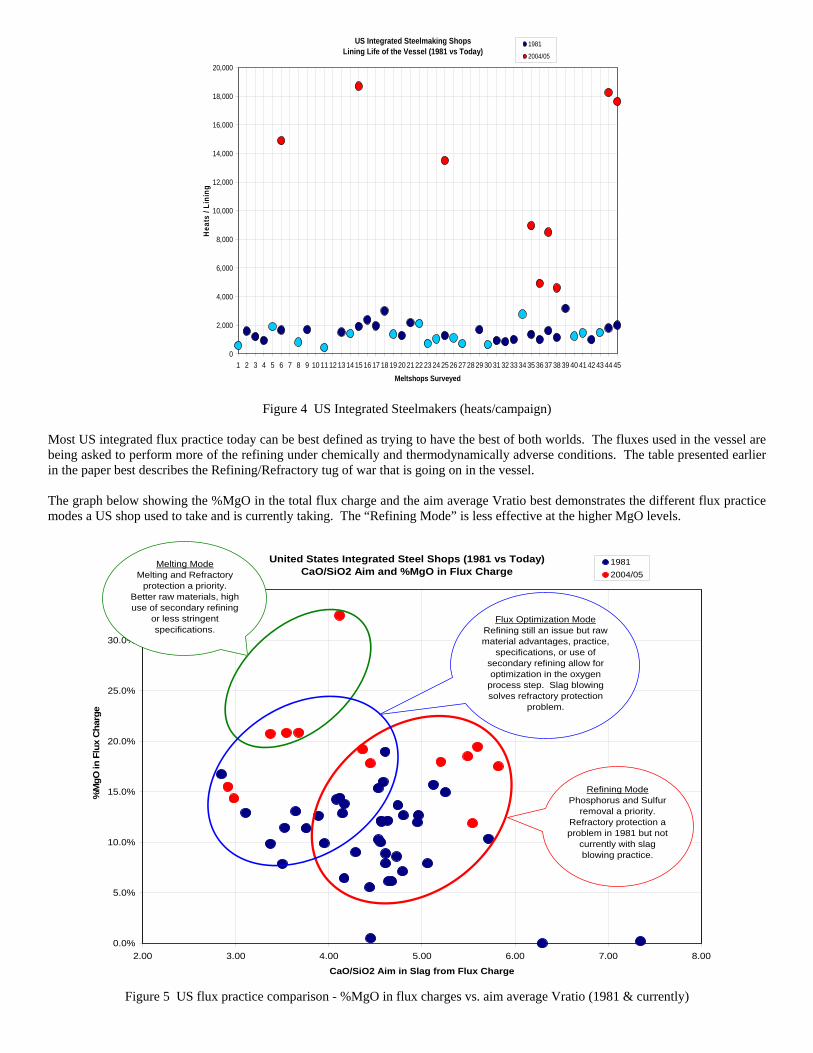
Figure 4 US Integrated Steelmakers (heats/campaign) Most US integrated flux practice today can be best defined as trying to have the best of both worlds. The fluxes used in the vessel are being asked to perform more of the refining under chemically and thermodynamically adverse conditions. The table presented earlier in the paper best describes the Refining/Refractory tug of war that is going on in the vessel. The graph below showing the %MgO in the total flux charge and the aim average Vratio best demonstrates the different flux practice modes a US shop used to take and is currently taking. The “Refining Mode” is less effective at the higher MgO levels.
United States Integrated Steel Shops (1981 vs Today)CaO/SiO2 Aim and %MgO in Flux Charge
0.0%
5.0%
10.0%
15.0%
20.0%
25.0%
30.0%
35.0%
2.00 3.00 4.00 5.00 6.00 7.00 8.00
CaO/SiO2 Aim in Slag from Flux Charge
%M
gO in
Flu
x C
harg
e
19812004/05
Refining ModePhosphorus and Sulfur
removal a priority. Refractory protection a problem in 1981 but not
currently with slag blowing practice.
Flux Optimization ModeRefining still an issue but raw material advantages, practice,
specifications, or use of secondary refining allow for optimization in the oxygen
process step. Slag blowing solves refractory protection
problem.
Melting ModeMelting and Refractory
protection a priority. Better raw materials, high use of secondary refining
or less stringent specifications.
Figure 5 US flux practice comparison - %MgO in flux charges vs. aim average Vratio (1981 & currently)
US Integrated Steelmaking ShopsLining Life of the Vessel (1981 vs Today)
0
2,000
4,000
6,000
8,000
10,000
12,000
14,000
16,000
18,000
20,000
1 2 3 4 5 6 7 8 9 10 11 12 13 14 15 16 17 18 19 20 21 22 23 24 25 26 27 28 29 30 31 32 33 34 35 36 37 38 39 40 41 42 43 44 45
Meltshops Surveyed
Hea
ts /
Lini
ng
1981
2004/05
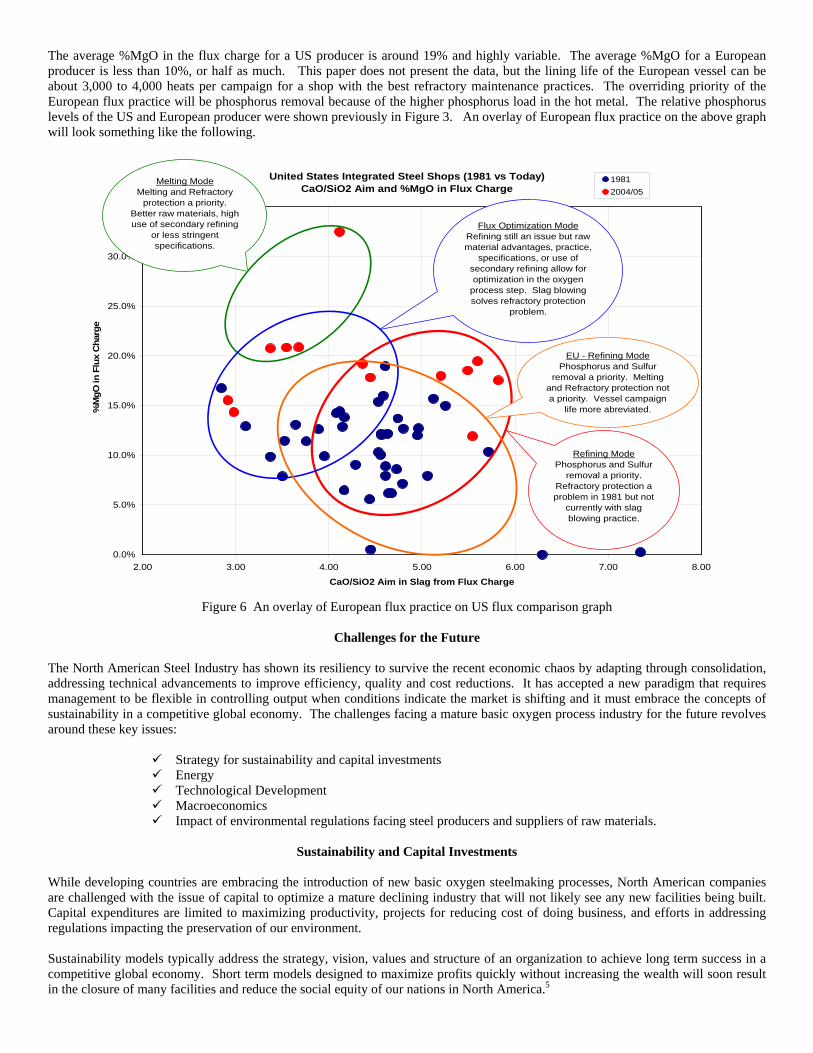
The average %MgO in the flux charge for a US producer is around 19% and highly variable. The average %MgO for a European producer is less than 10%, or half as much. This paper does not present the data, but the lining life of the European vessel can be about 3,000 to 4,000 heats per campaign for a shop with the best refractory maintenance practices. The overriding priority of the European flux practice will be phosphorus removal because of the higher phosphorus load in the hot metal. The relative phosphorus levels of the US and European producer were shown previously in Figure 3. An overlay of European flux practice on the above graph will look something like the following.
United States Integrated Steel Shops (1981 vs Today)CaO/SiO2 Aim and %MgO in Flux Charge
0.0%
5.0%
10.0%
15.0%
20.0%
25.0%
30.0%
35.0%
2.00 3.00 4.00 5.00 6.00 7.00 8.00
CaO/SiO2 Aim in Slag from Flux Charge
%M
gO in
Flu
x C
harg
e
19812004/05
Refining ModePhosphorus and Sulfur
removal a priority. Refractory protection a problem in 1981 but not
currently with slag blowing practice.
Flux Optimization ModeRefining still an issue but raw material advantages, practice,
specifications, or use of secondary refining allow for optimization in the oxygen
process step. Slag blowing solves refractory protection
problem.
Melting ModeMelting and Refractory
protection a priority. Better raw materials, high use of secondary refining
or less stringent specifications.
EU - Refining ModePhosphorus and Sulfur
removal a priority. Melting and Refractory protection not a priority. Vessel campaign
life more abreviated.
Figure 6 An overlay of European flux practice on US flux comparison graph
Challenges for the Future
The North American Steel Industry has shown its resiliency to survive the recent economic chaos by adapting through consolidation, addressing technical advancements to improve efficiency, quality and cost reductions. It has accepted a new paradigm that requires management to be flexible in controlling output when conditions indicate the market is shifting and it must embrace the concepts of sustainability in a competitive global economy. The challenges facing a mature basic oxygen process industry for the future revolves around these key issues:
Strategy for sustainability and capital investments Energy Technological Development Macroeconomics Impact of environmental regulations facing steel producers and suppliers of raw materials.
Sustainability and Capital Investments
While developing countries are embracing the introduction of new basic oxygen steelmaking processes, North American companies are challenged with the issue of capital to optimize a mature declining industry that will not likely see any new facilities being built. Capital expenditures are limited to maximizing productivity, projects for reducing cost of doing business, and efforts in addressing regulations impacting the preservation of our environment. Sustainability models typically address the strategy, vision, values and structure of an organization to achieve long term success in a competitive global economy. Short term models designed to maximize profits quickly without increasing the wealth will soon result in the closure of many facilities and reduce the social equity of our nations in North America.5
Successful companies who embrace sustainability will be profitable and efficient through cost reductions, improved productivity, greater innovation, supplier partnerships, continued expansion of customer base, reduced liability and increased competitiveness over the long term.6
Macroeconomics
Steelmakers facing the pressures of sustained profitability are now focused on the movements and trends in the global economy as well as the local economy as a whole and how these will influence decisions by companies in meeting their goals. The impact of emerging economies and growth economies such as China and India have far reaching affect on the supply and steel products due to impact from the variable cost of raw materials, energy, transportation and imports.
Energy
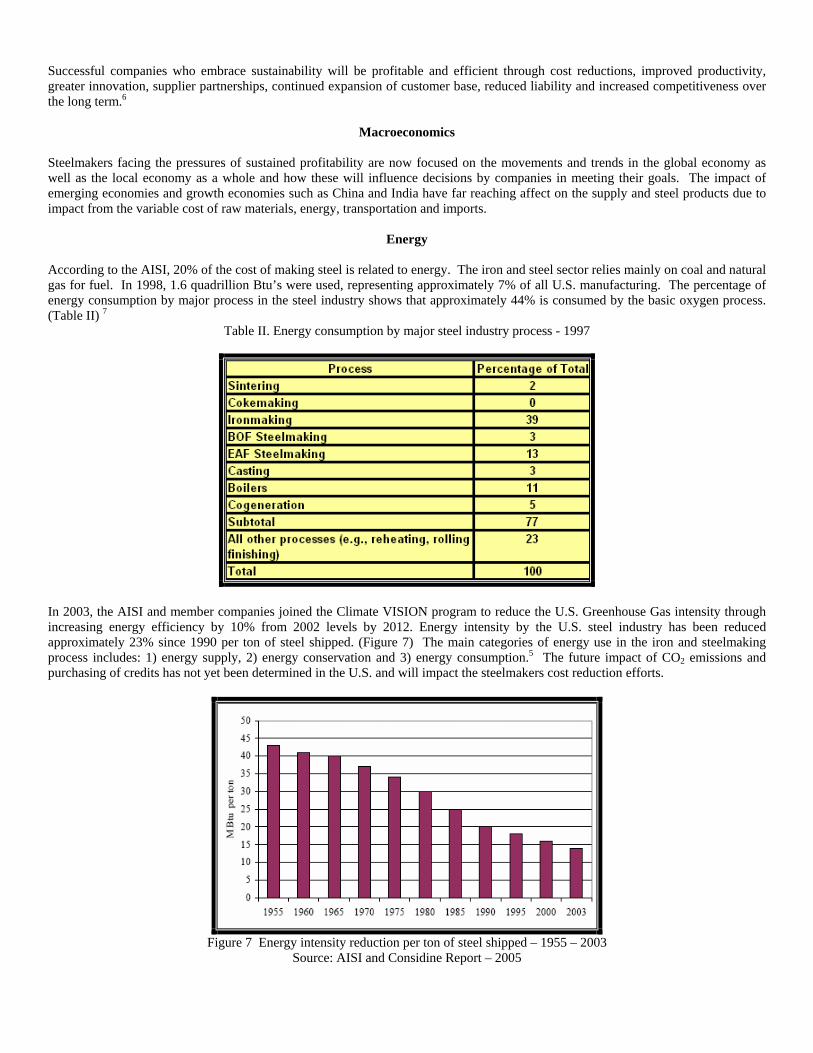
According to the AISI, 20% of the cost of making steel is related to energy. The iron and steel sector relies mainly on coal and natural gas for fuel. In 1998, 1.6 quadrillion Btu’s were used, representing approximately 7% of all U.S. manufacturing. The percentage of energy consumption by major process in the steel industry shows that approximately 44% is consumed by the basic oxygen process. (Table II) 7
Table II. Energy consumption by major steel industry process - 1997
In 2003, the AISI and member companies joined the Climate VISION program to reduce the U.S. Greenhouse Gas intensity through increasing energy efficiency by 10% from 2002 levels by 2012. Energy intensity by the U.S. steel industry has been reduced approximately 23% since 1990 per ton of steel shipped. (Figure 7) The main categories of energy use in the iron and steelmaking process includes: 1) energy supply, 2) energy conservation and 3) energy consumption.5 The future impact of CO2 emissions and purchasing of credits has not yet been determined in the U.S. and will impact the steelmakers cost reduction efforts.
Figure 7 Energy intensity reduction per ton of steel shipped – 1955 – 2003
Source: AISI and Considine Report – 2005
Technological Development The challenges are numerous and require a concerted effort through improving technology, work practices, research and development, and partnerships with suppliers to meet the intended goals. The Steel Industry Roadmap in 20038 suggested areas of opportunities to achieve improvements: modeling, measurement and control, operating techniques and best practices, process equipment, fuels, feed stocks, recycling, material properties and manufacturing technologies. The challenges in improving production efficiency and use of available raw materials effectively are being addressed. Efforts in the use of sensors and computers for modeling have enhanced the control over the process. Operational knowledge and training of personnel in the methods to improve practices is ongoing for harnessing the power of people in the process. Further reduction of wastes, yield improvements and increased use of recycling of materials are opportunities that will benefit the environment and cost reductions for the steelmaker. The BOF process uses 25 to 35 percent old steel to make new. According to the U.S. Geological Survey, in 2004, 15,983,000 tons of ferrous scrap was used in production of 52, 594,600 tons of liquid steel.9 Efforts in utilizing cost effective raw materials and new technologies for production of metallics are being developed. The need for increased metallics has driven projects such as HIsmelt, FastMelt and Mesabi Iron Nuggets to produce alternatives for iron. The decline of the blast furnace in North America requires innovative technologies to replace this source of iron for steelmaking. The reliance on coke is a challenge to the reduction in energy and GHG intensity. This can be improved by increased use of alternatives such as coal and natural gas. The Steel Industry Technology Roadmap – 2003 projected that injection of coal into the blast furnace is expected to rise to 500 lbs/ton of hot metal by 2015 as compared to the 300 lbs/ton of hot metal currently. Development of alternative fuels requires an increased understanding of the process to advance this technology.10
Utilization of lime injection technology is being addressed by the electric arc furnace shops. The basic oxygen process has development opportunity to re-open the door for lime injection in the BOF as a result of improved oxygen lance design and improved flowability of pulverized lime products. Injection technology has allowed shops to introduce additional materials such as baghouse dust and DRI fines. To meet the “Refining Challenge” increased knowledge and experience with flux practices, slag control techniques and secondary metallurgical equipment may result in downstream desulfurization instead of the current reliance on hot metal desulfurization prior to the BOF. Lime is a critical raw material in the steelmaking process. The environmental pressures require the lime industry to consider sustainability to meet the future needs of the steel industry. The demand for lime from other industries like the utilities industry to meet their environment requirements through desulfurization of flue gases using high sulfur coal result in competition for lime supplies. The increased demand is being addressed to meet these commitments by lime suppliers. It is being done with lower cost and more environmentally acceptable pre-heater production capacity by providing a metallurgical grade lime which has a slightly different specification than current lime products.
Environmental Regulation Impacts Steelmakers11 and raw material suppliers have embraced the reduction of CO2 dictated by either the Kyoto Accord or the “Clear Skies Initiative” of the Bush Administration. The financial impact related to the reduction of CO2 emissions and purchase of CO2 credit will result in a “trickle down effect: of cost to customers in the chain. Currently CO2 credits in the European Union are selling for approximately $32 USD per ton in January 200613. In North America, Canada has stated it will hold the cost to $15 per ton CDN while it is still unknown what will be in the U.S. but likely in the neighborhood of $25 per ton. In 2005, lime production in the U.S. was approximately 22.5 million tons. The steel industry accounted for approximately 6.8 million tons of lime consumption. The basic oxygen process accounted for 49.6% of that total. The lime industry has committed to reduction for CO2 of 8% by 201212. This reduction is related to that CO2 that is generated in the production process from the use of fuel. Approximately 45% of the CO2 generation comes from the fuel portion in the process. The lime industry could meet this commitment through use of modern pre-heater kilns as compared to the straight kilns that have traditionally been used to produce lime for the steelmaker. Further reductions in CO2 based on tons produced can be realized by utilization of all lime fractions produced in a kiln. Figure 2 shows the CO2 generation through calcination of limestone and fuel consumption.
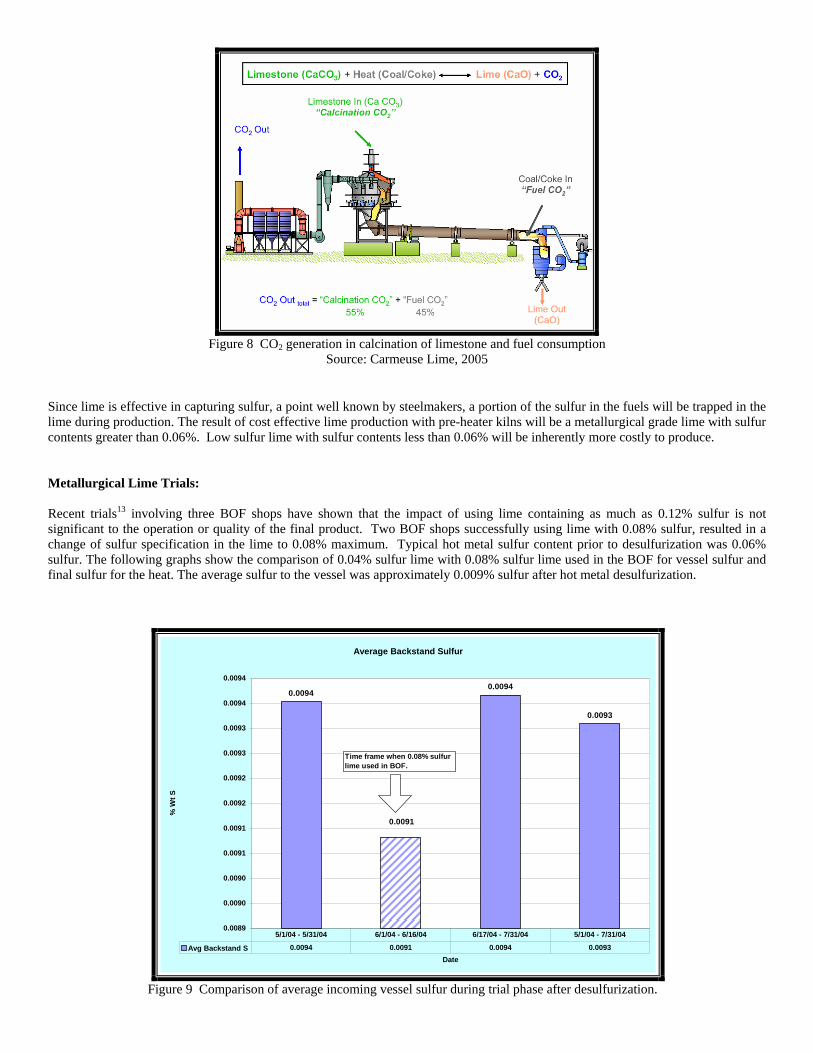
Figure 8 CO2 generation in calcination of limestone and fuel consumption
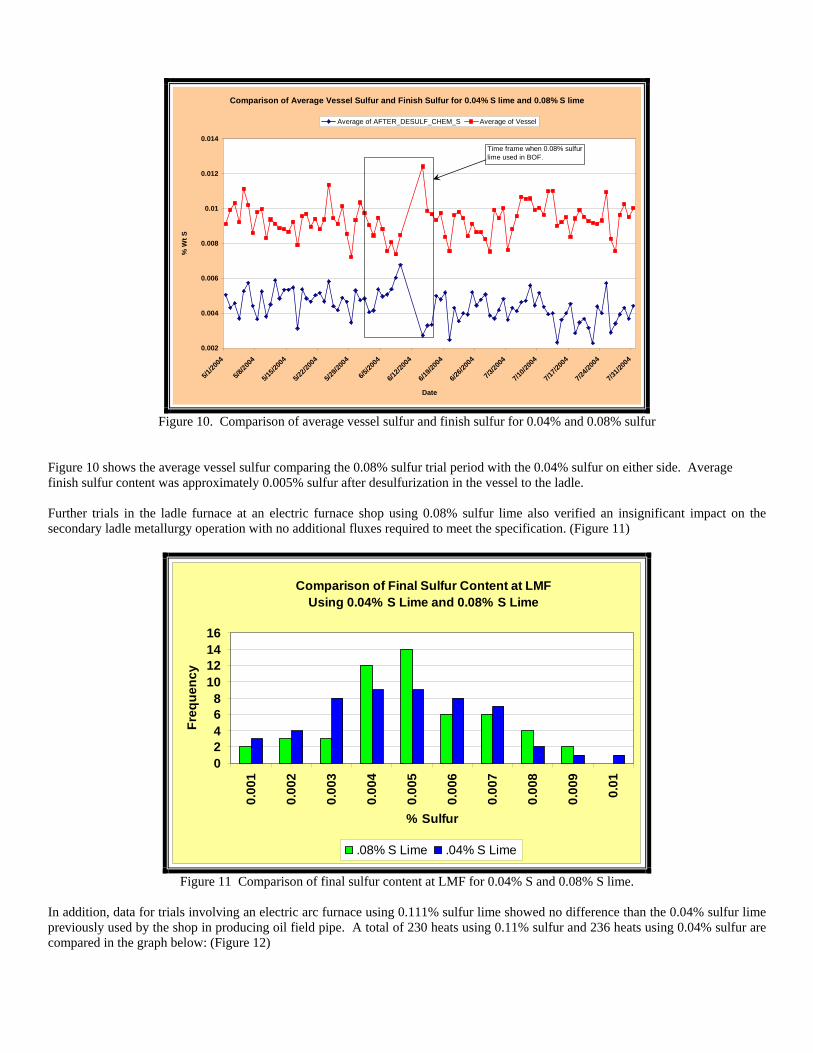
Source: Carmeuse Lime, 2005 Since lime is effective in capturing sulfur, a point well known by steelmakers, a portion of the sulfur in the fuels will be trapped in the lime during production. The result of cost effective lime production with pre-heater kilns will be a metallurgical grade lime with sulfur contents greater than 0.06%. Low sulfur lime with sulfur contents less than 0.06% will be inherently more costly to produce. Metallurgical Lime Trials: Recent trials13 involving three BOF shops have shown that the impact of using lime containing as much as 0.12% sulfur is not significant to the operation or quality of the final product. Two BOF shops successfully using lime with 0.08% sulfur, resulted in a change of sulfur specification in the lime to 0.08% maximum. Typical hot metal sulfur content prior to desulfurization was 0.06% sulfur. The following graphs show the comparison of 0.04% sulfur lime with 0.08% sulfur lime used in the BOF for vessel sulfur and final sulfur for the heat. The average sulfur to the vessel was approximately 0.009% sulfur after hot metal desulfurization.
Average Backstand Sulfur
0.00940.0094
0.0093
0.0091
0.0089
0.0090
0.0090
0.0091
0.0091
0.0092
0.0092
0.0093
0.0093
0.0094
0.0094
Date
% W
t S
Avg Backstand S 0.0094 0.0091 0.0094 0.0093
5/1/04 - 5/31/04 6/1/04 - 6/16/04 6/17/04 - 7/31/04 5/1/04 - 7/31/04
Time frame when 0.08% sulfur lime used in BOF.
Figure 9 Comparison of average incoming vessel sulfur during trial phase after desulfurization.
Comparison of Average Vessel Sulfur and Finish Sulfur for 0.04% S lime and 0.08% S lime
0.002
0.004
0.006
0.008
0.01
0.012
0.014
5/1/20
04
5/8/20
04
5/15/2
004
5/22/2
004
5/29/2
004
6/5/20
04
6/12/2
004
6/19/2
004
6/26/2
004
7/3/20
04
7/10/2
004
7/17/2
004
7/24/2
004
7/31/2
004
Date
% W
t S
Average of AFTER_DESULF_CHEM_S Average of Vessel
Time frame when 0.08% sulfur lime used in BOF.
Figure 10. Comparison of average vessel sulfur and finish sulfur for 0.04% and 0.08% sulfur
Figure 10 shows the average vessel sulfur comparing the 0.08% sulfur trial period with the 0.04% sulfur on either side. Average finish sulfur content was approximately 0.005% sulfur after desulfurization in the vessel to the ladle. Further trials in the ladle furnace at an electric furnace shop using 0.08% sulfur lime also verified an insignificant impact on the secondary ladle metallurgy operation with no additional fluxes required to meet the specification. (Figure 11)
Comparison of Final Sulfur Content at LMFUsing 0.04% S Lime and 0.08% S Lime
02468
10121416
0.00
1
0.00
2
0.00
3
0.00
4
0.00
5
0.00
6
0.00
7
0.00
8
0.00
9
0.01
% Sulfur
Freq
uenc
y
.08% S Lime .04% S Lime
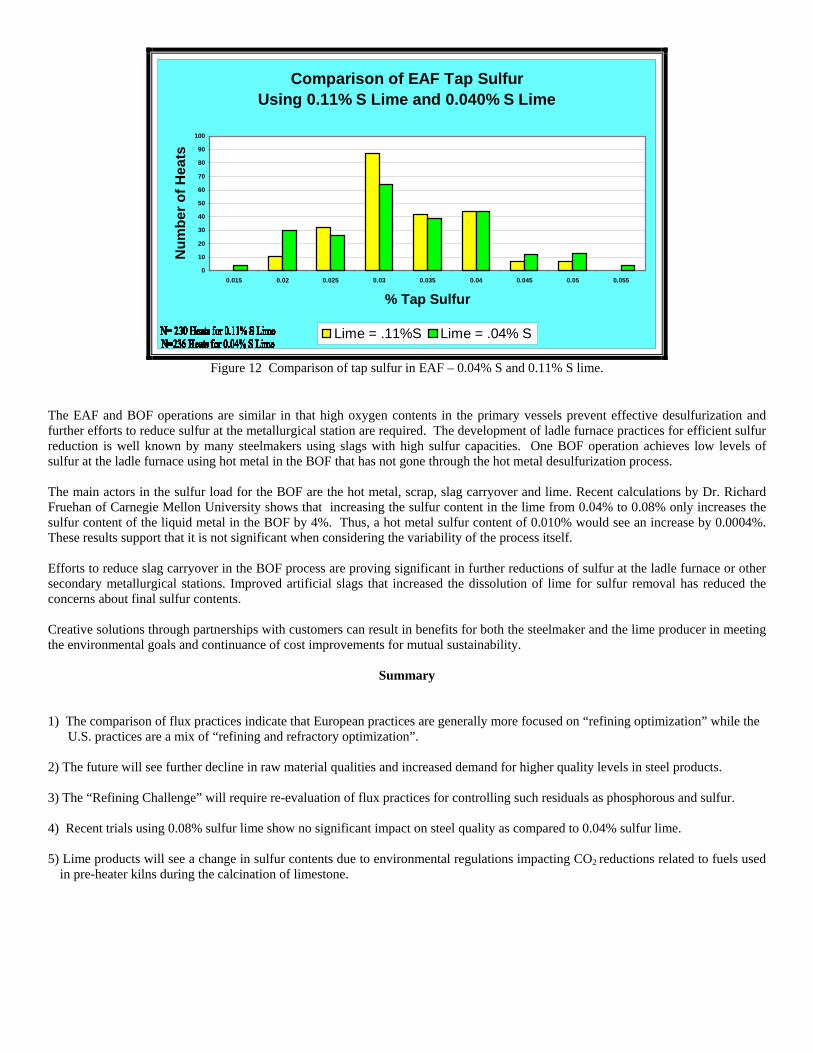
Figure 11 Comparison of final sulfur content at LMF for 0.04% S and 0.08% S lime. In addition, data for trials involving an electric arc furnace using 0.111% sulfur lime showed no difference than the 0.04% sulfur lime previously used by the shop in producing oil field pipe. A total of 230 heats using 0.11% sulfur and 236 heats using 0.04% sulfur are compared in the graph below: (Figure 12)
Comparison of EAF Tap Sulfur Using 0.11% S Lime and 0.040% S Lime
0
10
20
30
40
50
60
70
80
90
100
0.015 0.02 0.025 0.03 0.035 0.04 0.045 0.05 0.055
% Tap Sulfur
Num
ber o
f Hea
ts
Lime = .11%S Lime = .04% S
Figure 12 Comparison of tap sulfur in EAF – 0.04% S and 0.11% S lime. The EAF and BOF operations are similar in that high oxygen contents in the primary vessels prevent effective desulfurization and further efforts to reduce sulfur at the metallurgical station are required. The development of ladle furnace practices for efficient sulfur reduction is well known by many steelmakers using slags with high sulfur capacities. One BOF operation achieves low levels of sulfur at the ladle furnace using hot metal in the BOF that has not gone through the hot metal desulfurization process. The main actors in the sulfur load for the BOF are the hot metal, scrap, slag carryover and lime. Recent calculations by Dr. Richard Fruehan of Carnegie Mellon University shows that increasing the sulfur content in the lime from 0.04% to 0.08% only increases the sulfur content of the liquid metal in the BOF by 4%. Thus, a hot metal sulfur content of 0.010% would see an increase by 0.0004%. These results support that it is not significant when considering the variability of the process itself. Efforts to reduce slag carryover in the BOF process are proving significant in further reductions of sulfur at the ladle furnace or other secondary metallurgical stations. Improved artificial slags that increased the dissolution of lime for sulfur removal has reduced the concerns about final sulfur contents. Creative solutions through partnerships with customers can result in benefits for both the steelmaker and the lime producer in meeting the environmental goals and continuance of cost improvements for mutual sustainability.
Summary 1) The comparison of flux practices indicate that European practices are generally more focused on “refining optimization” while the U.S. practices are a mix of “refining and refractory optimization”.
2) The future will see further decline in raw material qualities and increased demand for higher quality levels in steel products. 3) The “Refining Challenge” will require re-evaluation of flux practices for controlling such residuals as phosphorous and sulfur. 4) Recent trials using 0.08% sulfur lime show no significant impact on steel quality as compared to 0.04% sulfur lime. 5) Lime products will see a change in sulfur contents due to environmental regulations impacting CO2 reductions related to fuels used
in pre-heater kilns during the calcination of limestone.
References
1. “The Making, Shaping and Treating of Steel, 10th Edition”, United States Steel Co., Chapter 1, Section 7, Modern Steelmaking Processes, pg 24-35
2. “AISI Operating Data – Operating Report - First Quarter 1981”, Technical Committee on Open Hearth and Basic Steelmaking,
American Iron and Steel Institute, 1000 Sixteenth Street, N.W., Washington, D.C. 20036 3. “Carmeuse North America – Operating Data Survey of US Integrated Steelmakers 2004/05”, Carmeuse North America, 11
Stanwix St., Pittsburgh, PA, 15222 4. “Carmeuse Lime Belgium – Operating Data Survey of European Integrated Steelmakers 2004”, 5. Business Sustainability, Resource Venture, website – February 23, 2006 http://www.resourceventure.org/rv/issues/other-
issues/business-sust/index.php 6. “Business Sustainability Maturity Model”, Cristiano Hugo Cagnin, Denis Loveridge, Jeff Butler, Institute of Innovation of the
University of Manchester, UK. Business Strategy and Environment Conference, September 4-6, 2005, Devonshire Hall, University of Leeds, UK
7. Steel Industry Analysis Brief: Energy Use: “Energy Consumption by Sector”, U.S. Department of Energy website:
http://www.eia.doe.gov/emeu/mecs/iab98/steel/sector.html, February, 26, 2006. 8. Steel Industry Technology Roadmap, “Barriers and Pathways for Yield Improvements”, Energetics, Inc. for AISI, pp. IV, October
7, 2003 9. Iron and Steel Scrap, Michael D. Fenton, U.S. Geological Survey, page9, Table 4, 2004 10. Steel Industry Technology Roadmap, “Fuel, Feedstock and Reclying”, Energetics, Inc. for AISI, page 6, October 7, 2003 11. AISI annoucement to Secretary of Energy, January 7, 2003, Steel Industry’s Climate VISION goals. Andrew G. Sharkey III,
President AISI. 12. National Lime Association announcement, June 11, 2003, NLA’s Climate VISION goals, Stuart Wolfe, Graymont, President
NLA and Arline Seager, Executive Director NLA 13. Point Carbon Publication, “Carbon Market Europe” page 3, February 3, 2006. 14. “The Future of Lime for Steelmaking”, Larry Wolfe and Philip Johnson, Carmeuse Lime, Pittsburgh, PA, Iron & Steel
Technology, February 2005,