overview of 2017 state accountability, telpas, graduation
TRANSCRIPT

Overview of 2017 State Accountability,
TELPAS, Graduation Rate, SAT, ACT, Advanced Placement, and
Dual Credit
Dr. Curtis NullOctober 17, 2017

Special Thanks to the Team
Dr. Chris Hines – Deputy Superintendent of Operations
Jim Kacur – Assistant Superintendent of Secondary Education
Dr. Debbie Phillips – Assistant Superintendent of Elementary Education
Shellie Winkler – Director of Elementary Education
Dr. Tamika Taylor – Director of Assessment and Evaluation
Greg Shipp – Director of Career and Technical Education
Dayren Carlisle – Coordinator of Bilingual and ESL
Denise Cipolla – Coordinator of Guidance and Counseling
Debbie McNeely – Coordinator for Advanced Academic Programs
Laura Willard – College Readiness Specialist
Tricia Fesler– Secretary for the Deputy Superintendent of Schools

Student Achievement
Index I
Student Progress
Index 2
Closing Performance
Gaps
Index 3
Postsecondary Readiness
Index 4
Student Achievement provides an overview of student performance based on satisfactory student achievement across all subjects for all students.
• Subjects: Combined over Reading, Mathematics, Writing, Science, and Social Studies
• Student Groups: All Students and all versions of the test
• Performance Standards: Approaches Grade Level
Index 1: Student Achievement

Target Score
60
Index 1: Student Achievement
85
75
0
10
20
30
40
50
60
70
80
90
100
District State
Index 1

Index 2: Student Progress
Student Progress focuses on actual student growth independent of overall achievement levels for each race/ethnicity student group, students with disabilities, and English language learners.
• By Subject Area: Reading and Mathematics for available grades
• Credit based on weighted performance:• One point credit given for each percentage of students at the Met or Exceeded Progress Measure• Two point credit given for each percentage of students at the Exceeded Progress Measure
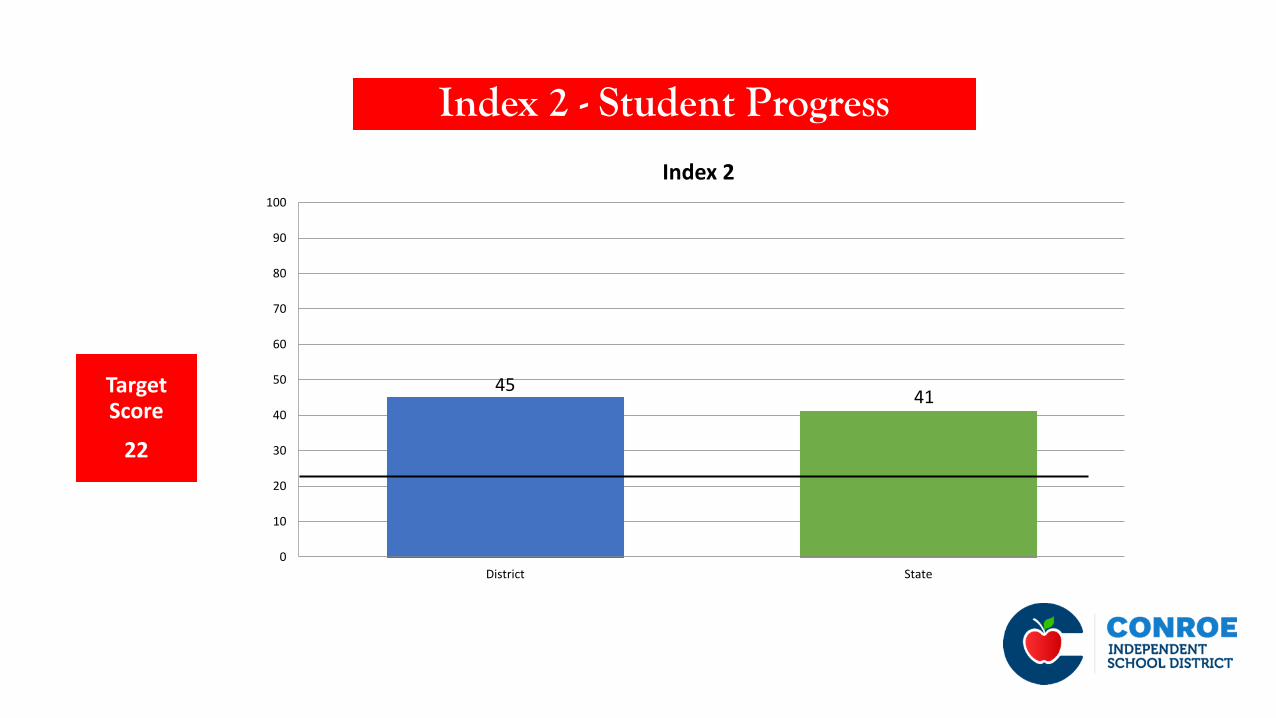
Index 2 - Student Progress
Target Score
22
4541
0
10
20
30
40
50
60
70
80
90
100
District State
Index 2

Index 3: Closing Performance Gaps
Closing Performance Gaps emphasizes advanced academic achievement of economically disadvantaged students and up to the two lowest performing race/ethnicity student groups.
• Credit based on weighted performance:
• One point for each percent of students at or above the Approaches Grade Level Standard
• Two points for each percent of students at the Masters Grade Level Standard
• By Subject Area: Reading, Mathematics, Writing, Science, and Social Studies
• Student Groups:
• Socioeconomic: Economically Disadvantaged
• Lowest Performing Race/Ethnicity: Up to two of the lowest performing race/ethnicity student groups on the campus or district (based on prior-year assessment results)

Index 3- Closing Performance Gaps
Target Score
28
49
40
0
10
20
30
40
50
60
70
80
90
100
District State
Index 3
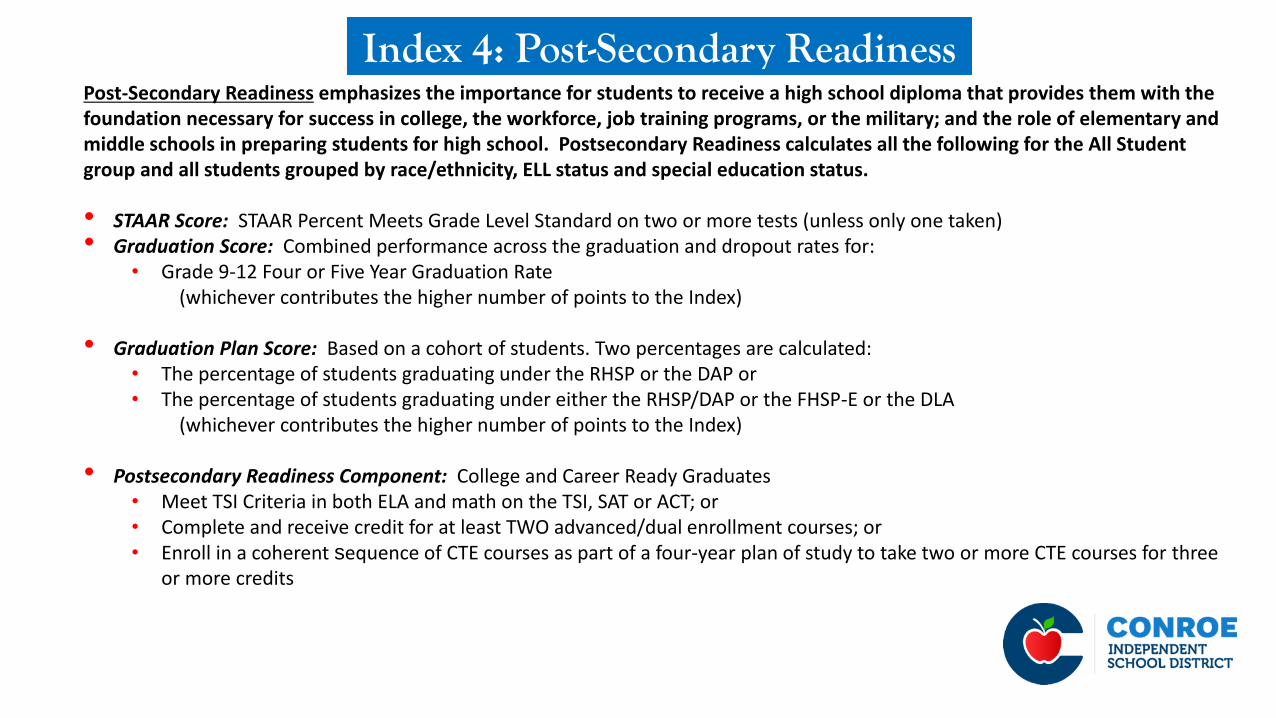
Index 4: Post-Secondary ReadinessPost-Secondary Readiness emphasizes the importance for students to receive a high school diploma that provides them with the foundation necessary for success in college, the workforce, job training programs, or the military; and the role of elementary and middle schools in preparing students for high school. Postsecondary Readiness calculates all the following for the All Student group and all students grouped by race/ethnicity, ELL status and special education status.
• STAAR Score: STAAR Percent Meets Grade Level Standard on two or more tests (unless only one taken)• Graduation Score: Combined performance across the graduation and dropout rates for:
• Grade 9-12 Four or Five Year Graduation Rate (whichever contributes the higher number of points to the Index)
• Graduation Plan Score: Based on a cohort of students. Two percentages are calculated:• The percentage of students graduating under the RHSP or the DAP or• The percentage of students graduating under either the RHSP/DAP or the FHSP-E or the DLA
(whichever contributes the higher number of points to the Index)
• Postsecondary Readiness Component: College and Career Ready Graduates• Meet TSI Criteria in both ELA and math on the TSI, SAT or ACT; or• Complete and receive credit for at least TWO advanced/dual enrollment courses; or• Enroll in a coherent sequence of CTE courses as part of a four-year plan of study to take two or more CTE courses for three
or more credits
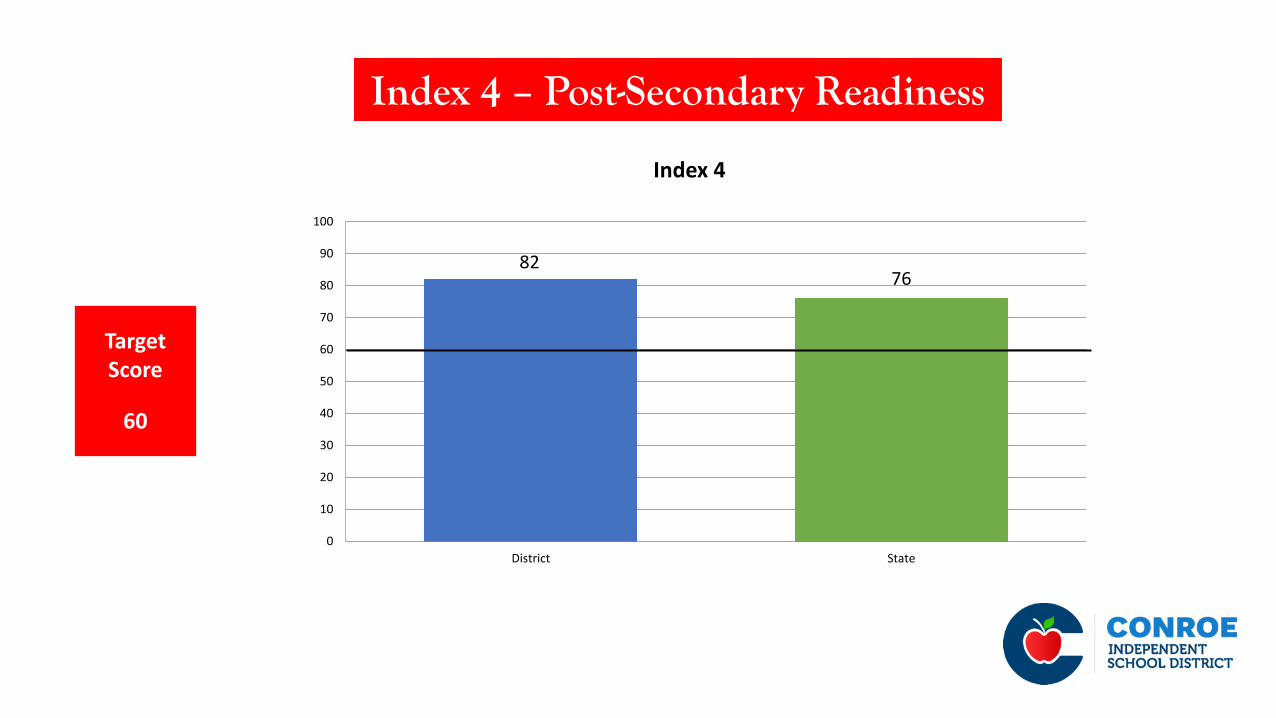
Index 4 – Post-Secondary Readiness
Target Score
60
8276
0
10
20
30
40
50
60
70
80
90
100
District State
Index 4

System Safeguards
Apply Safeguards to Specific Performance Indexes:
• Reporting system will disaggregate performance by student group and subject area.
• Performance rates are calculated from the assessment results used to calculate performance rates in the performance index (Index 1).
• Target for the disaggregated results are:
• STAAR performance target corresponds to Index 1 (60%)
• STAAR participation target required by federal accountability (95%)
• Federal graduation rate targets and improvement calculations for4-year rate (88.5%) and 5-year rate (91%)
• Federal limit on use of alternate assessments (1% and 2%)
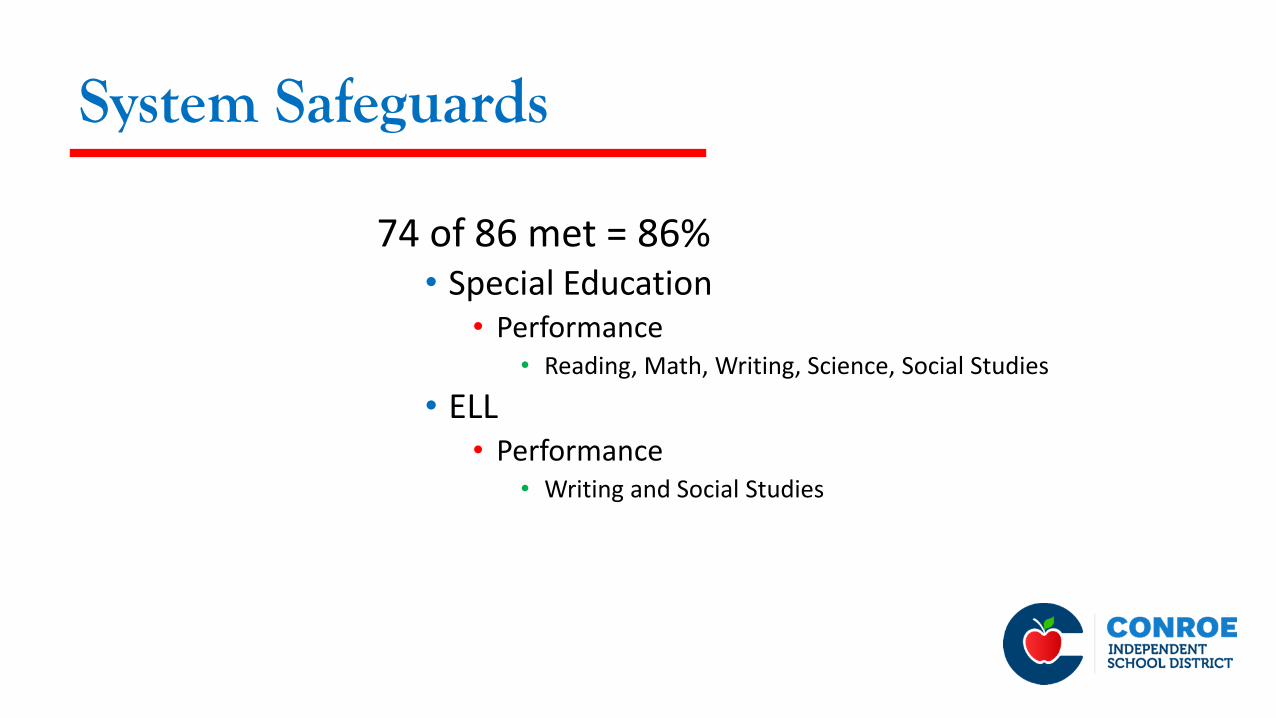
System Safeguards
74 of 86 met = 86%• Special Education
• Performance• Reading, Math, Writing, Science, Social Studies
• ELL• Performance
• Writing and Social Studies
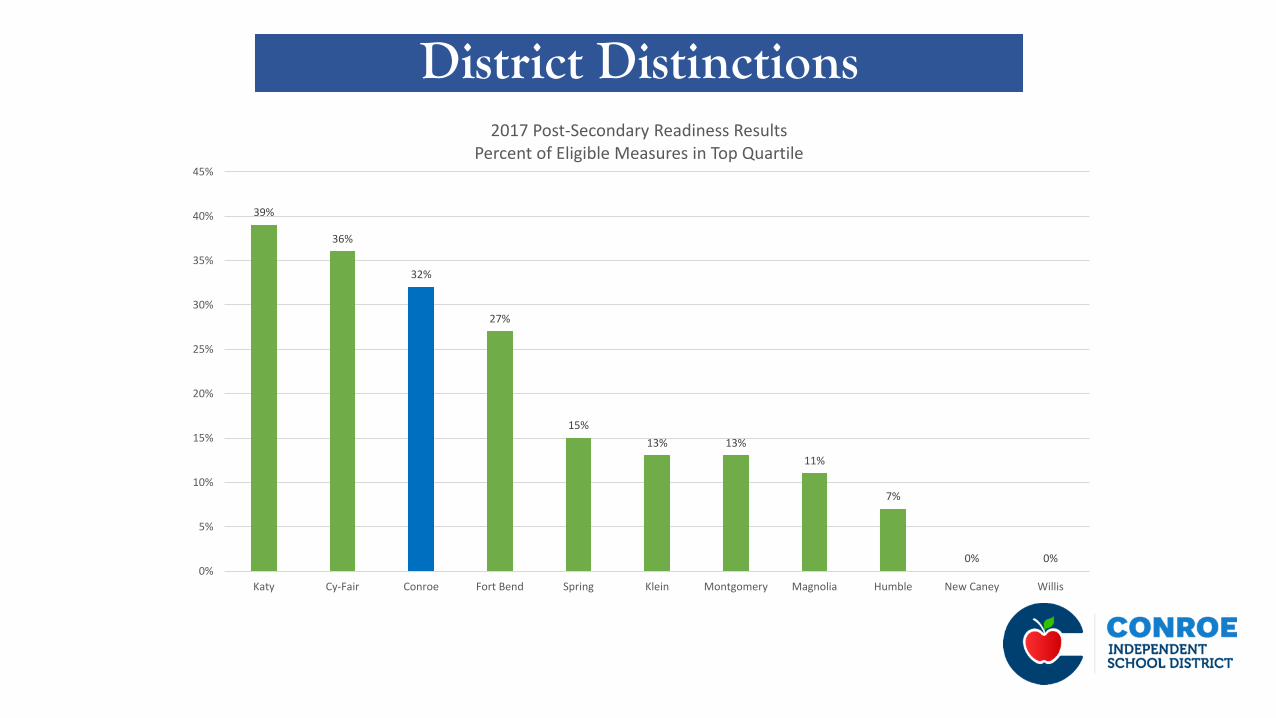
District Distinctions
39%
36%
32%
27%
15%
13% 13%
11%
7%
0% 0%0%
5%
10%
15%
20%
25%
30%
35%
40%
45%
Katy Cy-Fair Conroe Fort Bend Spring Klein Montgomery Magnolia Humble New Caney Willis
2017 Post-Secondary Readiness ResultsPercent of Eligible Measures in Top Quartile
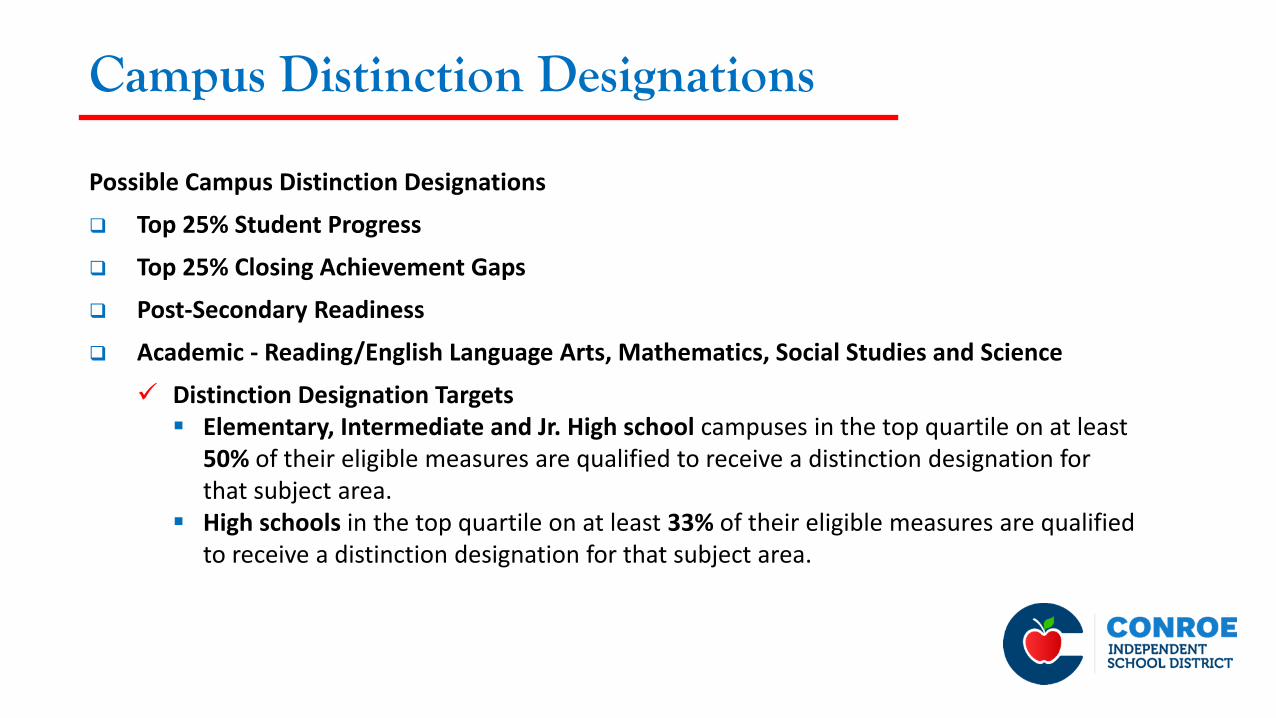
Campus Distinction Designations
Possible Campus Distinction Designations
Top 25% Student Progress
Top 25% Closing Achievement Gaps
Post-Secondary Readiness
Academic - Reading/English Language Arts, Mathematics, Social Studies and Science
Distinction Designation Targets Elementary, Intermediate and Jr. High school campuses in the top quartile on at least
50% of their eligible measures are qualified to receive a distinction designation for that subject area.
High schools in the top quartile on at least 33% of their eligible measures are qualified to receive a distinction designation for that subject area.
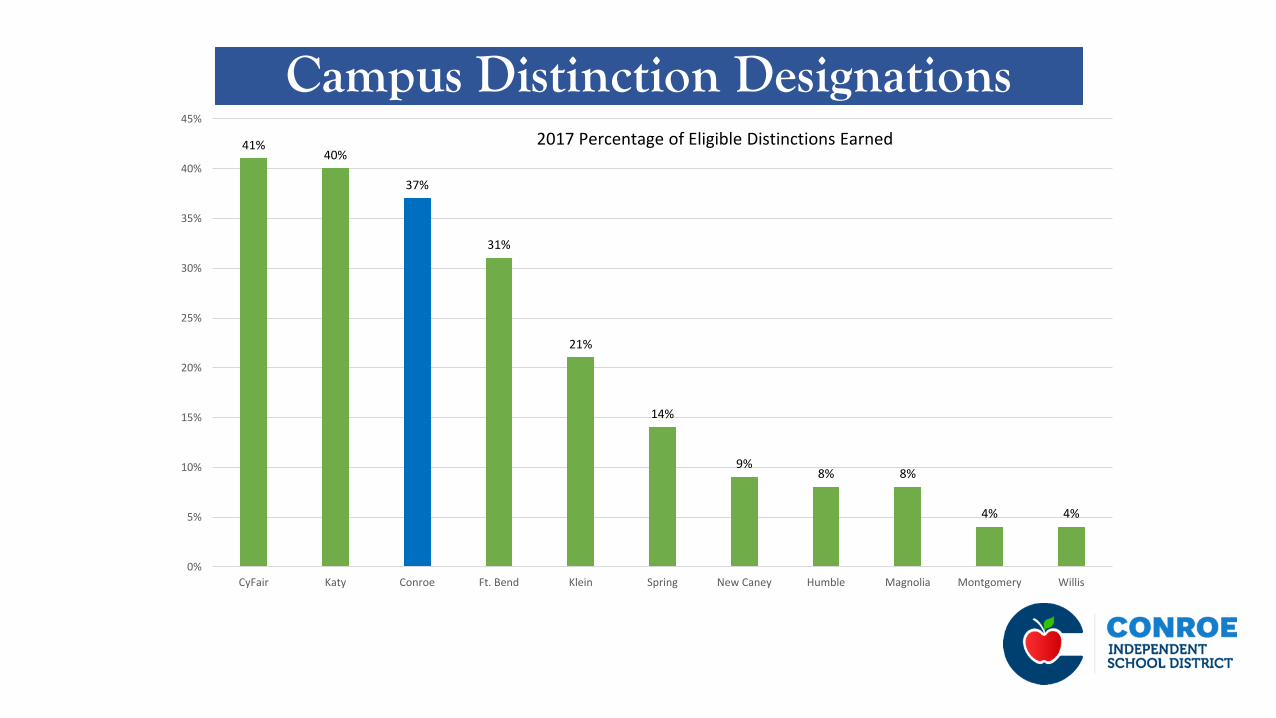
Campus Distinction Designations41%
40%
37%
31%
21%
14%
9%8% 8%
4% 4%
0%
5%
10%
15%
20%
25%
30%
35%
40%
45%
CyFair Katy Conroe Ft. Bend Klein Spring New Caney Humble Magnolia Montgomery Willis
2017 Percentage of Eligible Distinctions Earned
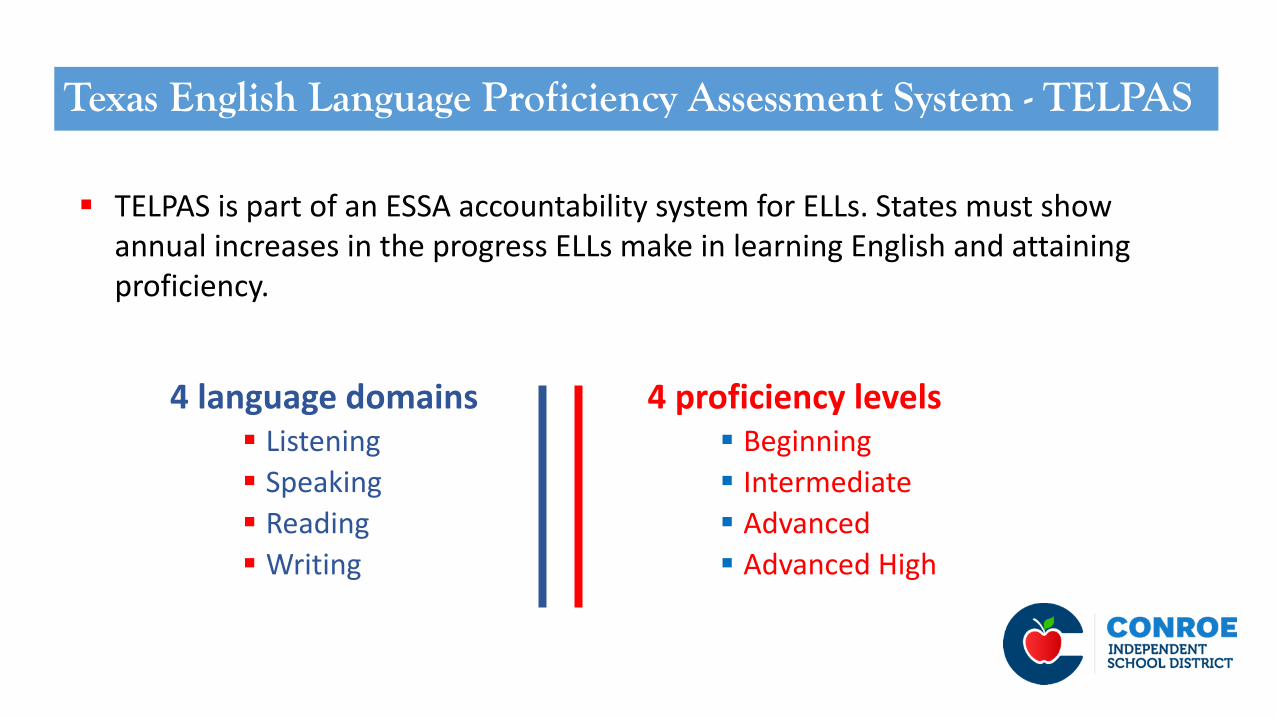
Texas English Language Proficiency Assessment System - TELPAS
4 language domains Listening
Speaking
Reading
Writing
4 proficiency levels Beginning
Intermediate
Advanced
Advanced High
TELPAS is part of an ESSA accountability system for ELLs. States must show annual increases in the progress ELLs make in learning English and attaining proficiency.

Key Features of Each Proficiency Level
Beginning Little or no English ability
Intermediate Limited ability, simple language structures,
high-frequency vocabulary, routine contexts
Advanced Grade appropriate, with second language acquisition support
Advanced High Grade appropriate, with minimal second language acquisition
support

Year Grade Level/
Number of Students
Conroe ISD TELPAS Composite Rating Spring 2017 Results Percent of students in each rating
Beginning Intermediate Advanced Advanced High
K / 810 54 31 11 3
1st / 958 19 37 29 15
2nd / 941 11 37 35 18
3rd / 946 7 25 39 29
4th / 826 5 18 46 31
5th / 725 4 11 38 46
6th / 635 3 13 40 44
7th / 521 6 12 44 38
8th / 418 9 12 42 36
9th / 338 15 18 41 26
10th / 317 15 21 39 26
11th / 205 8 18 34 40
12th / 111 1 19 49 32

Conroe ISD TELPAS ComparisonPercent of students who progressed ONE proficiency level
2015-2016 2016-2017
Kinder to 1st Grade 46 50
1st to 2nd Grade 41 39
2nd to 3rd Grade 49 51
3rd to 4th Grade 49 45
4th to 5th Grade 57 61
5th to 6th Grade 41 53
6th to 7th Grade 49 49
7th to 8th Grade 51 48
8th to 9th Grade 38 38
9th to 10th Grade 45 41
10 to 11th Grade 52 49
11th to 12th Grade 46 44

Grade Level
Conroe ISD STAAR Spanish Spring 2017 Results
Reading % Approaches / # of
Students Tested
Writing% Approaches / # of
Students Tested
Math% Approaches / # of
Students Tested
Science% Approaches / # of
Students Tested
3rd 50% / 244 47% / 185
4th 46% / 105 46% / 114 51% / 84
5th 80% / 61 48% / 52 55% / 53
Grade Level
STATE STAAR Spanish Spring 2017 Results
Reading % Approaches / # of
Students Tested
Writing% Approaches / # of
Students Tested
Math% Approaches / # of
Students Tested
Science% Approaches / # of
Students Tested
3rd 63% / 35,697 67% / 16,832
4th 59% / 24,667 64% / 25,904 57% / 9,439
5th 77% / 13,763 52% / 5,241 45% / 7,794
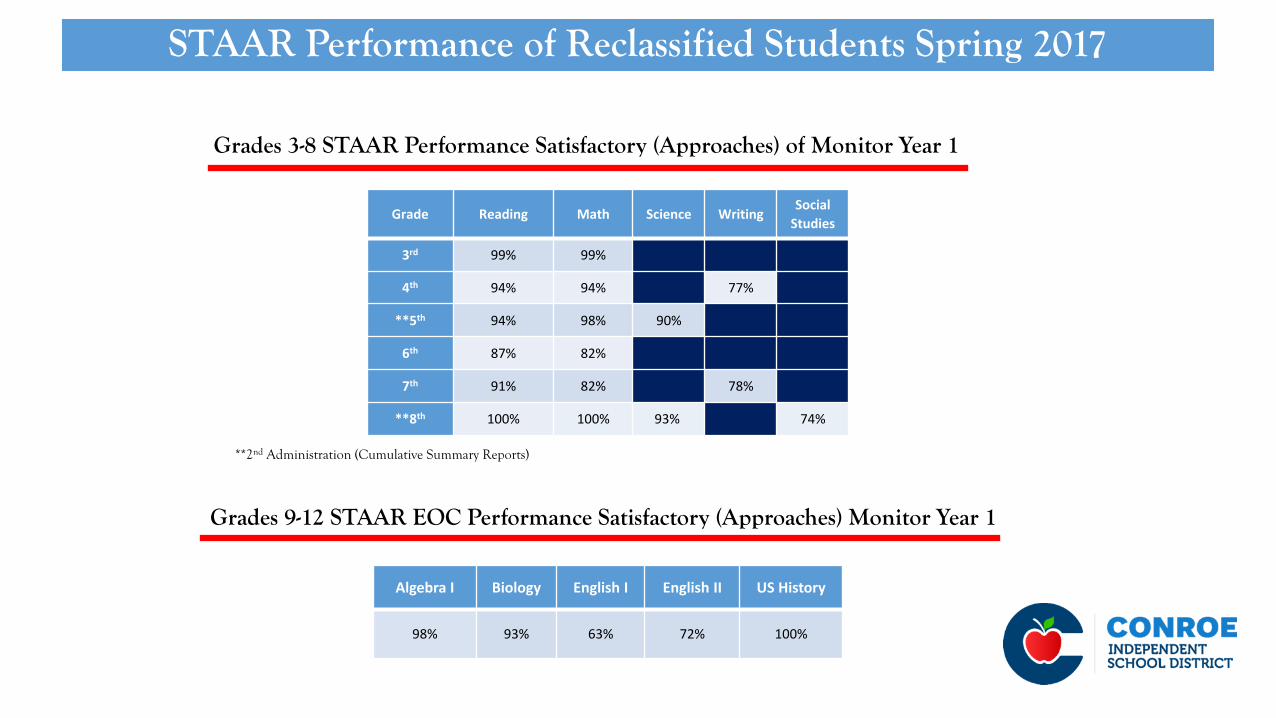
STAAR Performance of Reclassified Students Spring 2017
Grade Reading Math Science WritingSocial
Studies
3rd 99% 99%
4th 94% 94% 77%
**5th 94% 98% 90%
6th 87% 82%
7th 91% 82% 78%
**8th 100% 100% 93% 74%
Grades 9-12 STAAR EOC Performance Satisfactory (Approaches) Monitor Year 1
Algebra I Biology English I English II US History
98% 93% 63% 72% 100%
Grades 3-8 STAAR Performance Satisfactory (Approaches) of Monitor Year 1
**2nd Administration (Cumulative Summary Reports)

Grades 3-8 STAAR Performance Satisfactory (Approaches) of Monitor Year 2
Grade Reading Math Science WritingSocial
Studies
3rd 99% 100%
4th 98% 97% 87%
**5th 99% 100% 97%
6th 89% 92%
7th 84% 84% 78%
**8th 100% 100% 88% 82%
Grades 9-12 STAAR EOC Performance Satisfactory (Approaches) Monitor Year 2
Algebra I Biology English I English II US History
91% 92% 71% 61% 100%
STAAR Performance of Reclassified Students Spring 2017
**2nd Administration (Cumulative Summary Reports)

Graduation Rate Trend
75.00%
80.00%
85.00%
90.00%
95.00%
100.00%
2006 2007 2008 2009 2010 2011 2012 2013 2014 2015
CISD Texas
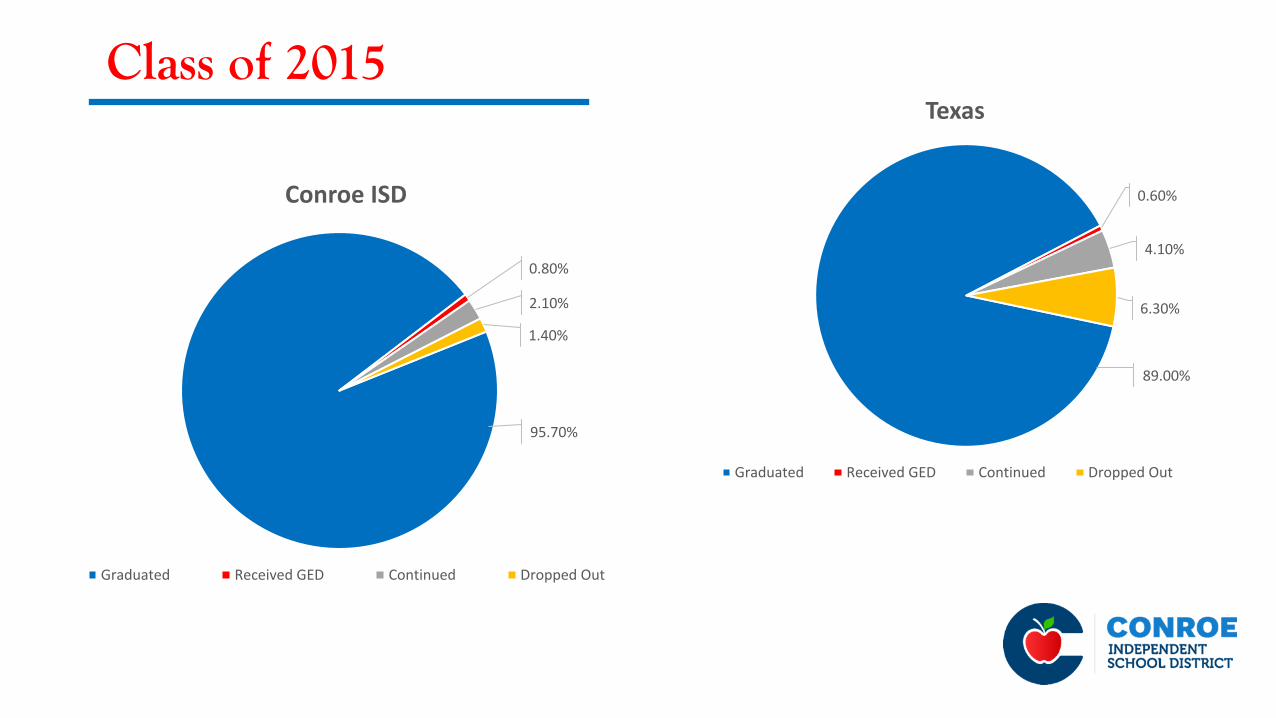
Class of 2015
95.70%
0.80%
2.10%
1.40%
Conroe ISD
Graduated Received GED Continued Dropped Out
89.00%
0.60%
4.10%
6.30%
Texas
Graduated Received GED Continued Dropped Out

Graduation Plans
0%
10%
20%
30%
40%
50%
60%
70%
80%
90%
100%
2005 2006 2007 2008 2009 2010 2011 2012 2013 2014 2015 2016
CISD 10-Year Trend: Percentage of Graduates by Graduation Plan
Recommended/DAP Minimum Program Foundations

2017 SAT Performance
538 533512 507
573 569
0
100
200
300
400
500
600
700
800
Evidence Based Reading + Writing (EBW) Math
National
Texas
Conroe ISD
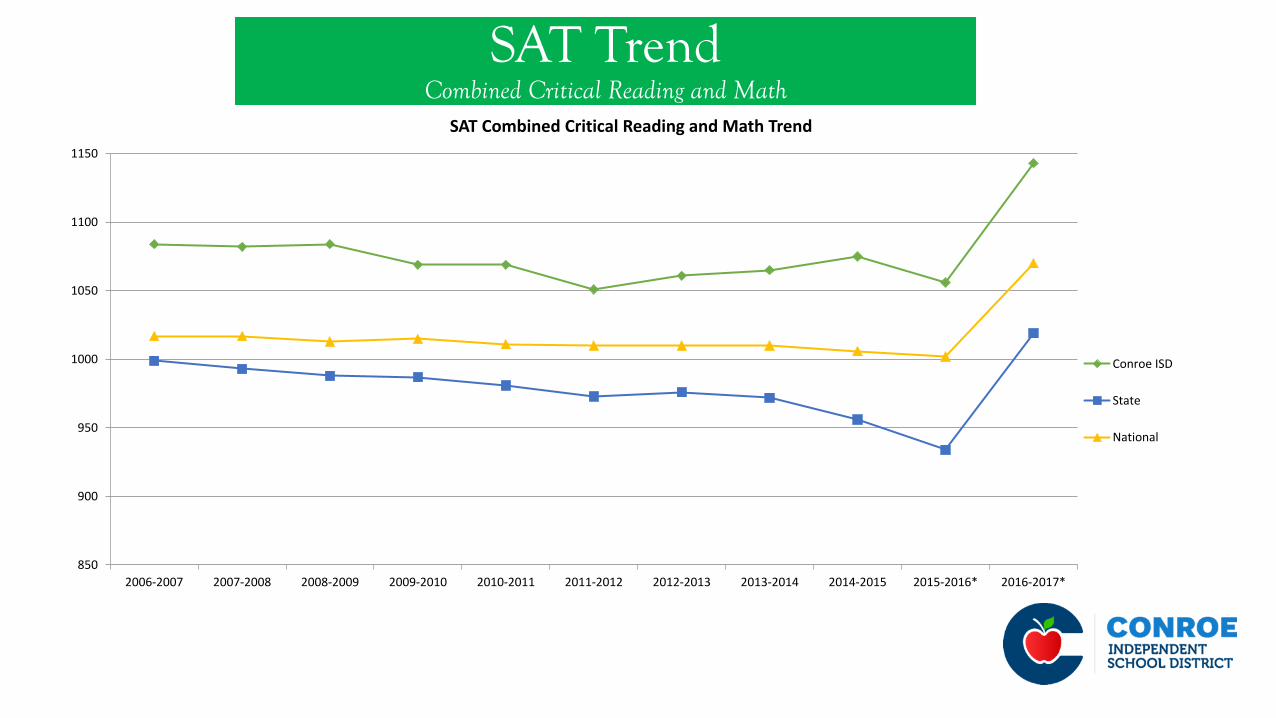
SAT TrendCombined Critical Reading and Math
850
900
950
1000
1050
1100
1150
2006-2007 2007-2008 2008-2009 2009-2010 2010-2011 2011-2012 2012-2013 2013-2014 2014-2015 2015-2016* 2016-2017*
SAT Combined Critical Reading and Math Trend
Conroe ISD
State
National
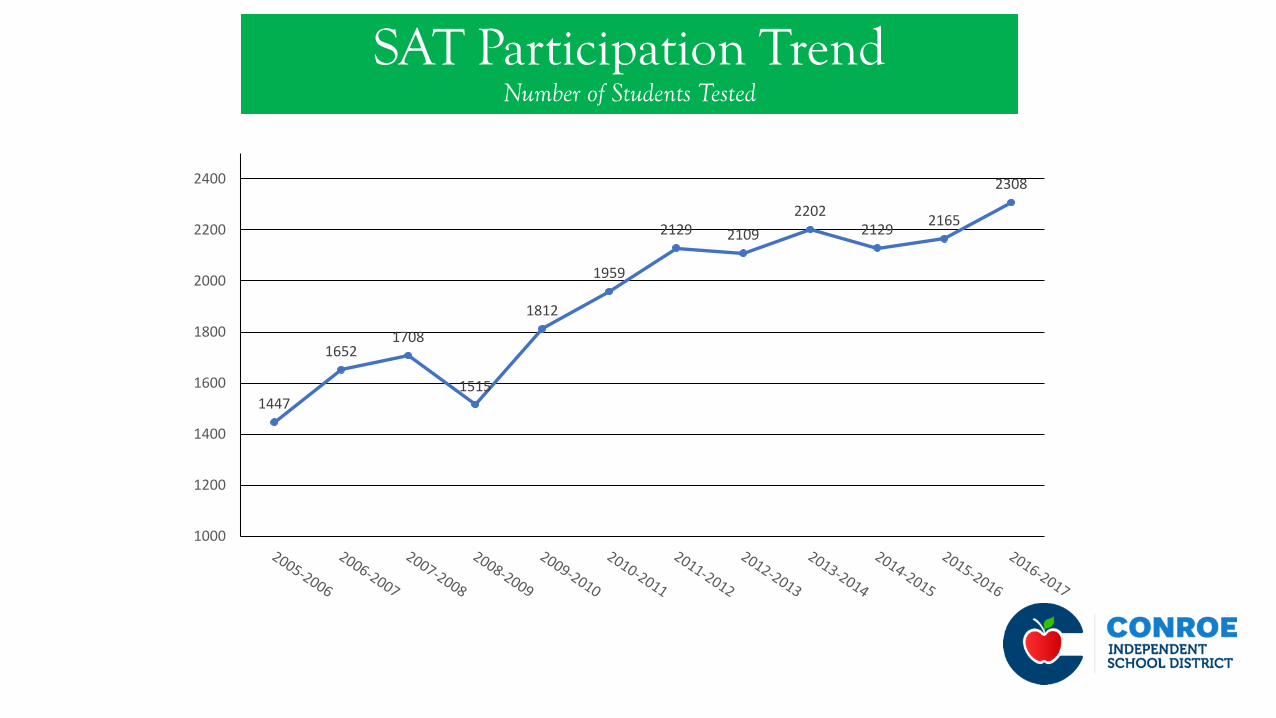
SAT Participation TrendNumber of Students Tested
1447
16521708
1515
1812
1959
2129 2109
22022129
2165
2308
1000
1200
1400
1600
1800
2000
2200
2400
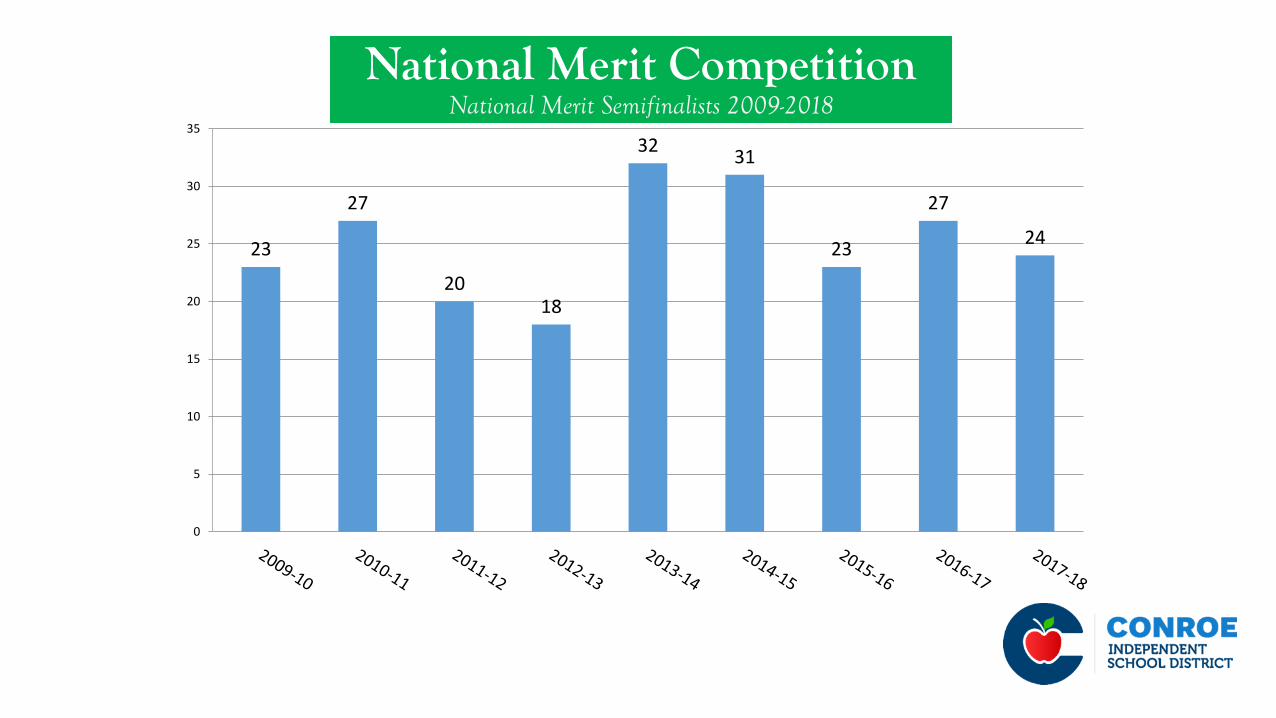
National Merit CompetitionNational Merit Semifinalists 2009-2018
23
27
2018
3231
23
27
24
0
5
10
15
20
25
30
35

2017 ACT Results
20.3 20.7
21.4 21 21
19.5
20.7 21.1 20.9 20.7
22.723.4
24.123.4 23.5
10
12
14
16
18
20
22
24
26
English Math Reading Science Composite
National
Texas
Conroe ISD

ACT Composite Test Trend2007-2017
23.3
23.2 23.2
23.4
23.7
22.9
23.3
23.5
24.1
23.2
23.5
22.8
23
23.2
23.4
23.6
23.8
24
24.2

ACT Subject Test Trend2007-2017
21.5
22
22.5
23
23.5
24
24.5
2007 2008 2009 2010 2011 2012 2013 2014 2015 2016 2017
English
Math
Reading
Science

ACT College Readiness TrendPercent Meeting All Four Subjects
2022
24 24 2426 26 27 26 26
35 36
4143
3842 43
51
44 45
0
10
20
30
40
50
60
2008 2009 2010 2011 2012 2013 2014 2015 2016 2017
TX Meeting All Four
CISD Meeting All Four

Advanced Placement Exams
2410 24322604 2735
30043324
3633
41214377
4544
0
1000
2000
3000
4000
5000
6000
7000
8000
9000
10000
2008 2009 2010 2011 2012 2013 2014 2015 2016 2017
CISD Ten Year AP Trend: Students and Tests
Number of Tests Number of Students
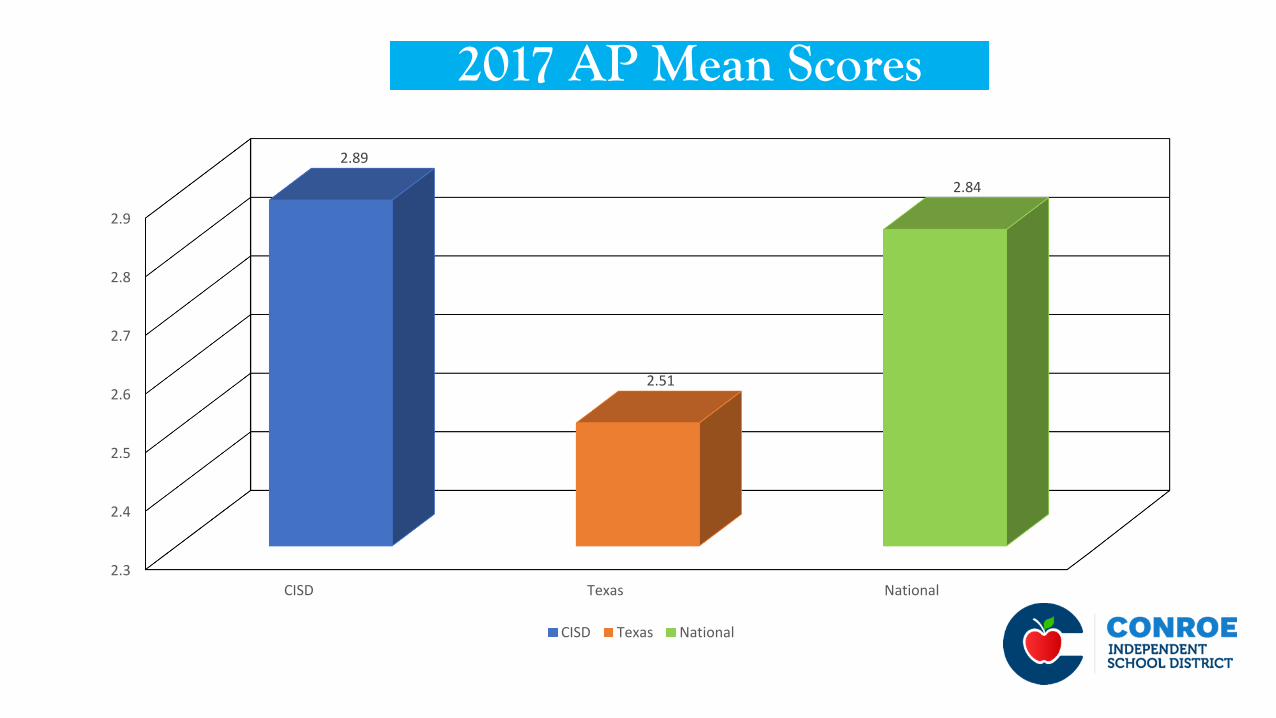
2017 AP Mean Scores
2.3
2.4
2.5
2.6
2.7
2.8
2.9
CISD Texas National
2.89
2.51
2.84
CISD Texas National
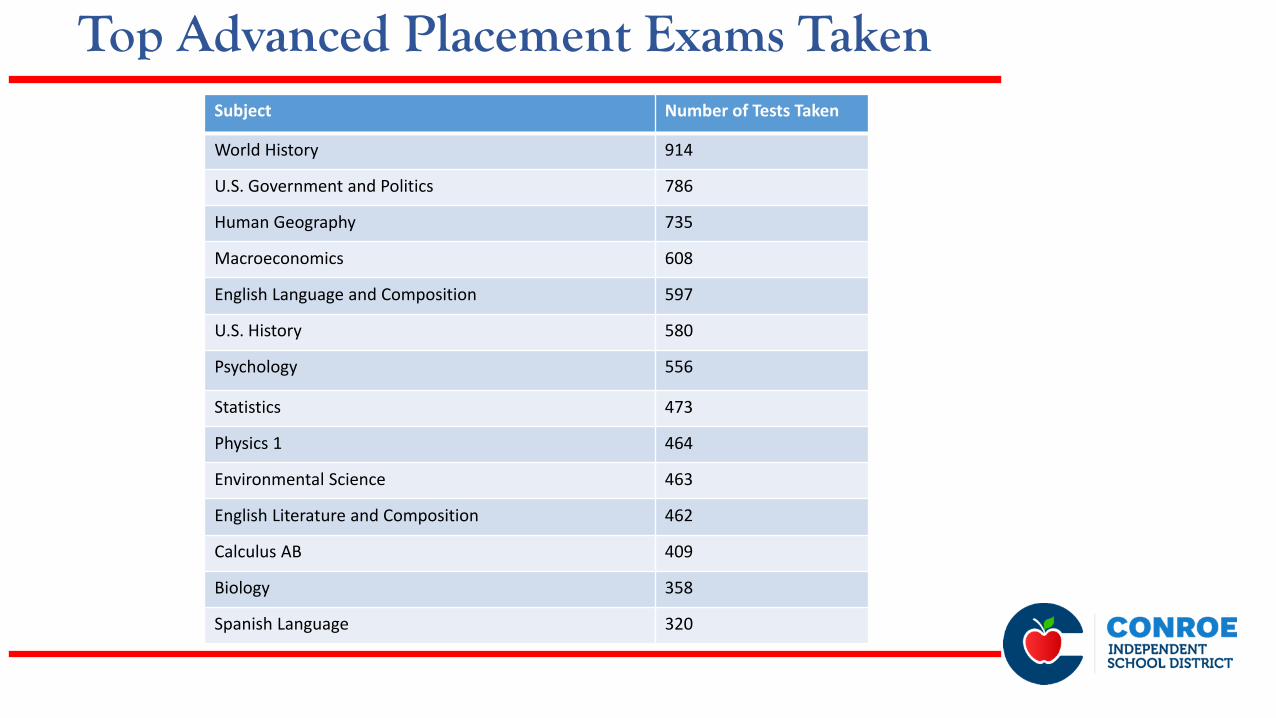
Top Advanced Placement Exams TakenSubject Number of Tests Taken
World History 914
U.S. Government and Politics 786
Human Geography 735
Macroeconomics 608
English Language and Composition 597
U.S. History 580
Psychology 556
Statistics 473
Physics 1 464
Environmental Science 463
English Literature and Composition 462
Calculus AB 409
Biology 358
Spanish Language 320

Lone Star College Fall Dual Credit Enrollment Trend
0
500
1000
1500
2000
2500
2009 2010 2011 2012 2013 2014 2015 2016 2017
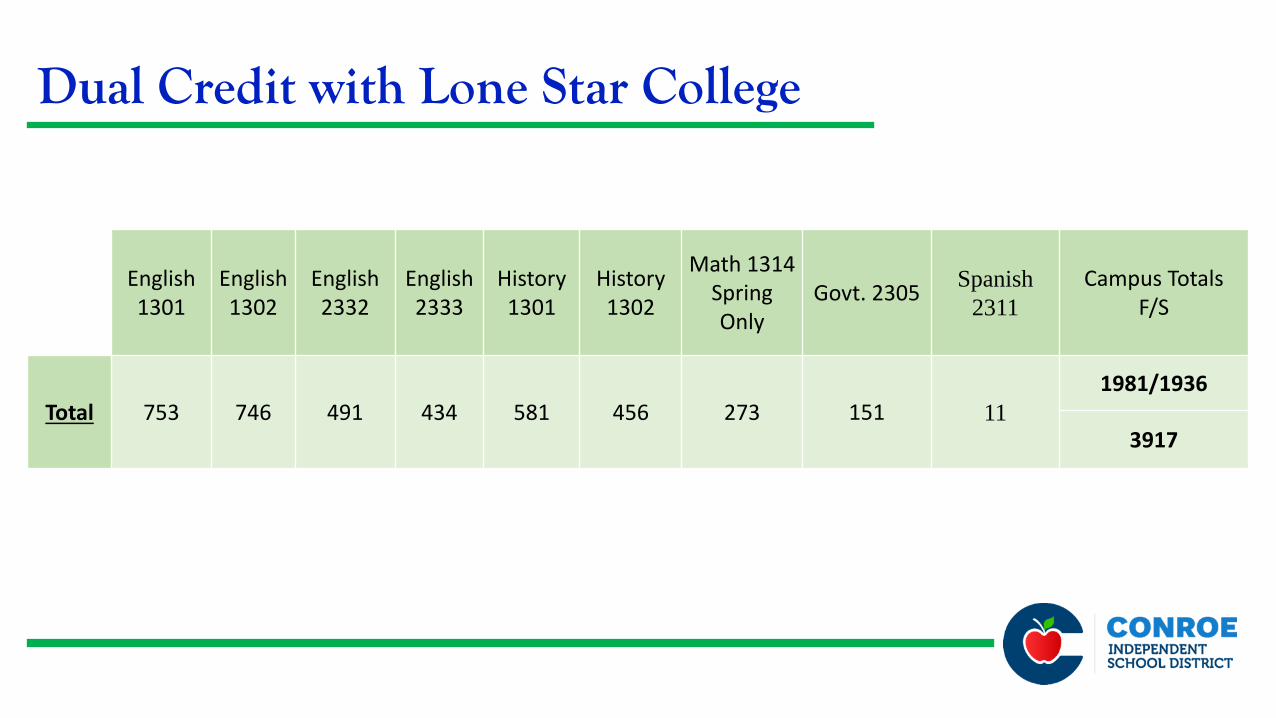
Dual Credit with Lone Star College
English1301
English 1302
English2332
English2333
History1301
History1302
Math 1314Spring Only
Govt. 2305Spanish
2311
Campus TotalsF/S
Total 753 746 491 434 581 456 273 151 11
1981/1936
3917
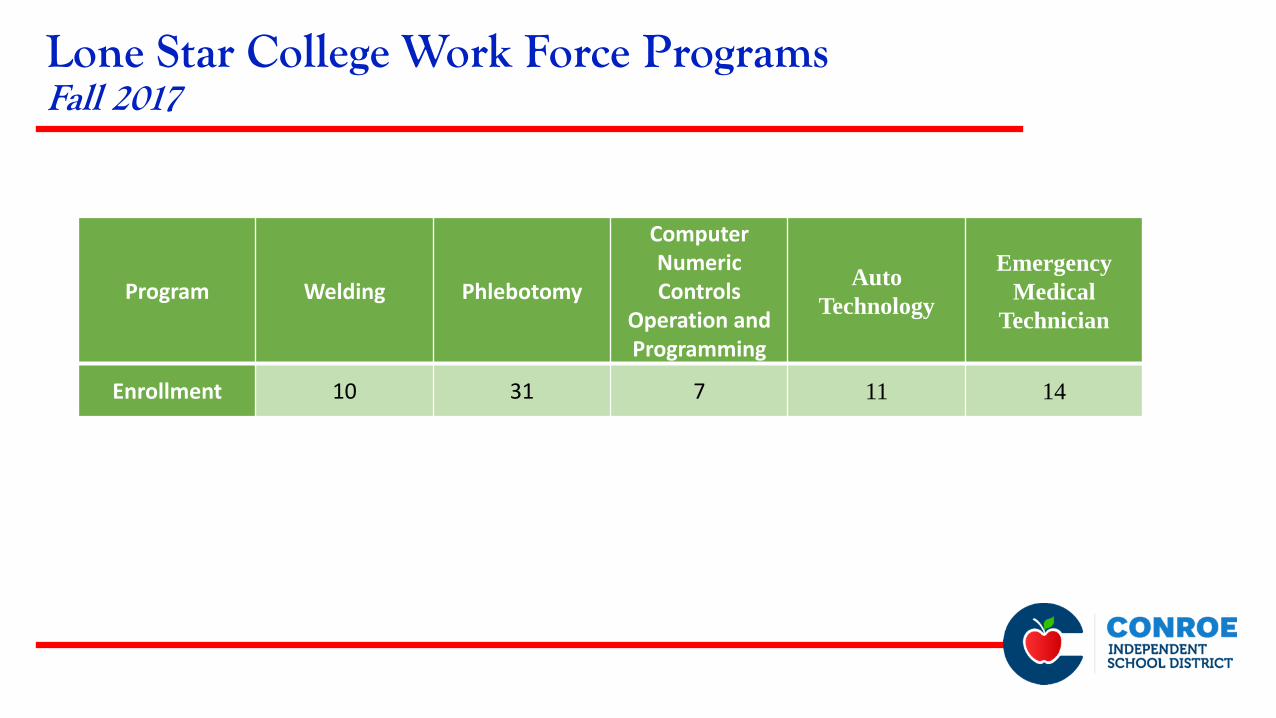
Lone Star College Work Force Programs Fall 2017
Program Welding Phlebotomy
Computer Numeric Controls
Operation and Programming
Auto
Technology
Emergency
Medical
Technician
Enrollment 10 31 7 11 14
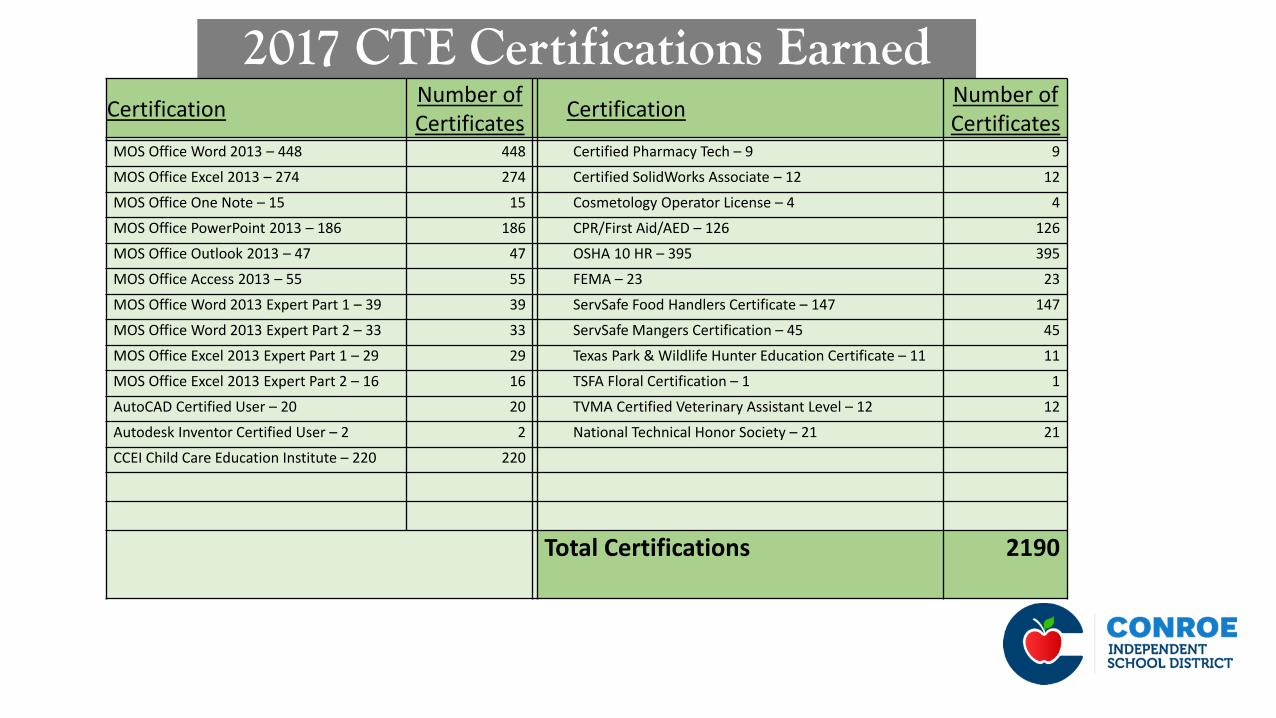
2017 CTE Certifications EarnedCertification
Number of Certificates
CertificationNumber of Certificates
MOS Office Word 2013 – 448 448 Certified Pharmacy Tech – 9 9
MOS Office Excel 2013 – 274 274 Certified SolidWorks Associate – 12 12
MOS Office One Note – 15 15 Cosmetology Operator License – 4 4
MOS Office PowerPoint 2013 – 186 186 CPR/First Aid/AED – 126 126
MOS Office Outlook 2013 – 47 47 OSHA 10 HR – 395 395
MOS Office Access 2013 – 55 55 FEMA – 23 23
MOS Office Word 2013 Expert Part 1 – 39 39 ServSafe Food Handlers Certificate – 147 147
MOS Office Word 2013 Expert Part 2 – 33 33 ServSafe Mangers Certification – 45 45
MOS Office Excel 2013 Expert Part 1 – 29 29 Texas Park & Wildlife Hunter Education Certificate – 11 11
MOS Office Excel 2013 Expert Part 2 – 16 16 TSFA Floral Certification – 1 1
AutoCAD Certified User – 20 20 TVMA Certified Veterinary Assistant Level – 12 12
Autodesk Inventor Certified User – 2 2 National Technical Honor Society – 21 21
CCEI Child Care Education Institute – 220 220
Total Certifications 2190
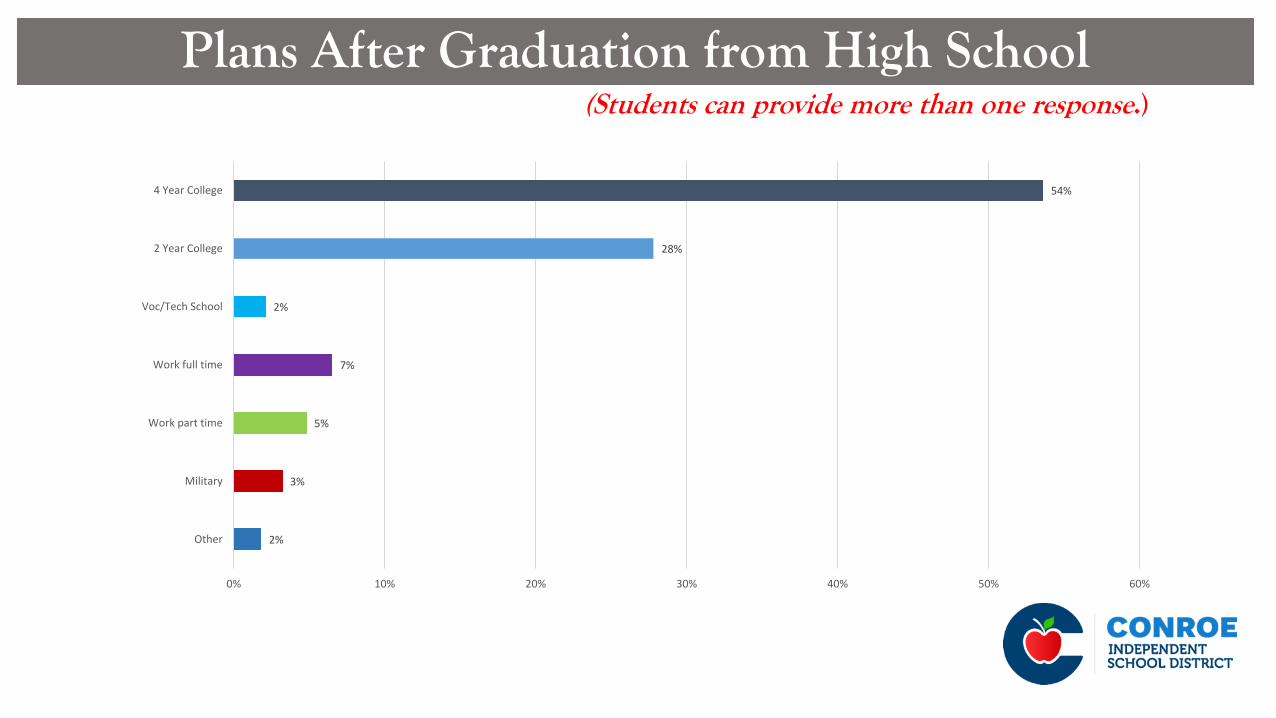
Plans After Graduation from High School(Students can provide more than one response.)
2%
3%
5%
7%
2%
28%
54%
0% 10% 20% 30% 40% 50% 60%
Other
Military
Work part time
Work full time
Voc/Tech School
2 Year College
4 Year College
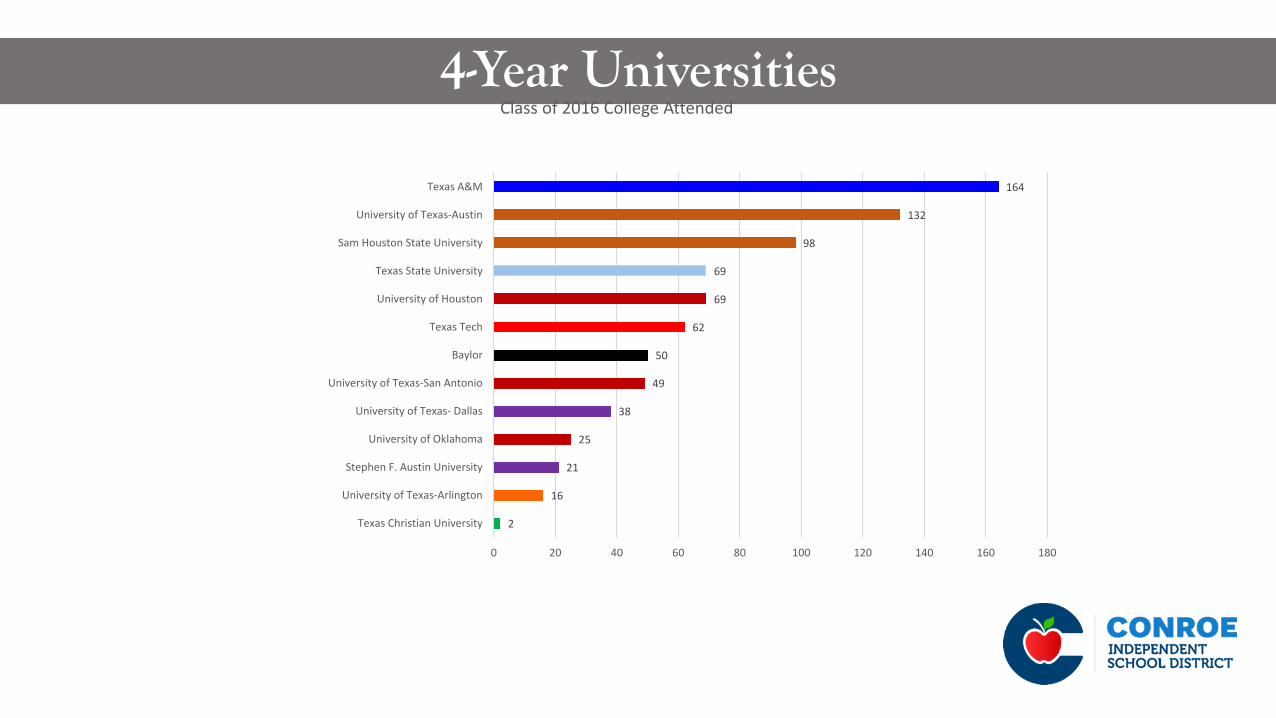
4-Year Universities
2
16
21
25
38
49
50
62
69
69
98
132
164
0 20 40 60 80 100 120 140 160 180
Texas Christian University
University of Texas-Arlington
Stephen F. Austin University
University of Oklahoma
University of Texas- Dallas
University of Texas-San Antonio
Baylor
Texas Tech
University of Houston
Texas State University
Sam Houston State University
University of Texas-Austin
Texas A&M
Class of 2016 College Attended
