overview - minnesota department of natural resourcesfiles.dnr.state.mn.us/eii/overview_a.pdf ·...
TRANSCRIPT

DEVELOPING ENVIRONMENTAL INDICATORS FOR MINNESOTA
An Overview
The Environmental Indicators Initiative
State of MinnesotaFunded by
Minnesota Legislatureon recommendation of the
Legislative Commission on Minnesota ResourcesSponsored by
The Environmental Quality Board
1998

OVERVIEW EII
2
PURPOSE OF THIS REPORT
ACKNOWLEDGMENTS
The Environmental IndicatorsInitiative (EII), under the auspices ofthe Minnesota EnvironmentalQuality Board, is developing astrategy to provide comprehensiveenvironmental information fordecision making that better protectsand manages Minnesota�s environ-ment. The strategy relies on environ-mental monitoring via a statewideintegrated network using environ-mental indicators.
This report describes the EII�srationale and approach for develop-ing indicators. It gives specificexamples of indicators and how they
might be used by governmentagencies, environmental decisionmakers, and citizens. It outlines theessential steps for developingindicators, implementing integratedmonitoring, and reporting onenvironmental indicators based onthe state�s geographic ecoregions.The report provides a scientific basisfor measuring ecosystem integrityand presents a framework fororganizing information about thecomplex relationships betweenhuman activities and the condition ofMinnesota�s environment. Otherproducts of the EII, summarized inthis report, characterize the ecosys-tems of Minnesota, describe the uses
of individual indicators, report onsources of environmental informa-tion, and document the results of EIIindicator selection workshops. Thisreport is intended for resourceprofessionals, environmental scien-tists, informed policymakers, andothers interested in environmentalmonitoring.
The Environmental Indicators Initiative is an interagency project sponsored by the Minnesota Environmental QualityBoard. Funding for this project was approved by the Minnesota Legislature from the Minnesota Environment andNatural Resources Trust Fund as recommended by the Legislative Commission on Minnesota Resources.
This project is guided by the Environmental Indicators Initiative Task Force:Kim Chapman, The Nature ConservancyMohamed T. Elnabarawy, 3M CorporationGeorge Host, Natural Resources Research InstituteTim Kelly, Minnesota Department of Natural ResourcesLee Pfannmuller, Minnesota Department of Natural ResourcesCarl Richards, Natural Resources Research InstituteKurt Rusterholz, Minnesota Department of Natural ResourcesPaul Schmiechen, Minnesota Pollution Control Agency, Co-chairDan Symonik, Minnesota Department of HealthPaul Toren, Minnesota Environmental Quality BoardKeith Wendt, Minnesota Department of Natural Resources, Co-chairMark Zumwinkle, Minnesota Department of Agriculture
This report was prepared byKeith Wendt, Project ManagerPaul Pajak, Coordinator (August 1995-June 1997)Clarence Turner, Coordinator (July 1997-present)Charlotte Bryant, EcologistLaura Preus, Ecologist
Designed and produced byLinda McNary, design & layoutTom Klein, graphicsMary Keirstead, editing

OVERVIEW EII
3
CONTENTS
PURPOSE OF THIS REPORT ................................................................................................................... 2
INTRODUCTION ................................................................................................................................................................ 4
THE APPLICATION OF ENVIRONMENTAL INDICATORS:SELECTED EXAMPLES ............. 6Minnesota Department of Natural Resources ........................................................................................................ 6Minnesota Pollution Control Agency and U.S. Environmental Protection Agency:
Performance Partnership Agreements ............................................................................................. ................... 6Strategic Planning and the U.S. Fish and Wildlife Service 6 State of the Environment
Reporting: Minnesota Milestones ....................................................................................................................... 7The Cannon River Watershed and Big Woods Ecosystems ................................................................................ 7Sustainable Forest Resources Act: Monitoring Requirements ............................................................................... 8Citizens and Communities .......................................................................................................................................... 8
DEVELOPING ENVIRONMENTAL INDICATORS: THE ENVIRONMENTALINDICATORS INITIATIVE APPROACH ................................................................................... 9Steps in the Development and Use of Indicators .................................................................................................. 9Minnesota Ecosystems and Ecosystem Integrity .................................................................................................. 10The EII Framework for Indicator Development ................................................................................................ 12
GETTING INVOLVED ............................................................................................................................. 15
REFERENCES ............................................................................................................................................ 16
APPENDIX A: ENVIRONMENTAL INDICATORS INITIATIVE PRODUCTS ............................ 17Developing Environmental Indicators for Minnesota: An Overview ............................................................. 17Minnesota Ecosystems .............................................................................................................................................. 17Environmental Indicator Fact Sheets ............................................................................................ .......................... 18Environmental Indicators Catalog of Databases and Information Sources .................................................... 18Workshop Results ...................................................................................................................................................... 19
APPENDIX B: MONITORING NETWORKS FOR CITIZENS ANDRESOURCE PROFESSIONALS ................................................................................................ 20

OVERVIEW EII
4
INTRODUCTION
The health of Minnesota�s ecosys-tems and the quality of life of itscitizens are interdependent. Humansare an integral part of the naturalenvironment and depend on ecosys-tems for a variety oflife-support services, for raw materi-als that fuel the economy, and for avariety of other benefits (e.g.,recreation, spiritual renewal, aesthet-ics; Daily et al. 1997). But humanimpacts are drivingsome ecosystems beyond their abilityto sustain the basic resources of soils,water, vegetation, and wildlife. Asthe health of ecosystems declines,human health and welfare arethreatened.
Healthy, functioning ecosystems are awell-established state goal that isclearly reflected in the MinnesotaEnvironmental Policy Act, theSustainable Development Initiative,and other state andfederal mandates. Policymakers,resource managers, and the publicneed environmental, economic, andsocial information to make wisechoices about the desired conditionof the state�s ecosystems and thehuman economies and communitiesthat ecosystems support. Emergingenvironmental issues (loss of diver-sity, ecosystem health andsustainability) and high-risk environ-mental problems (such as nonpoint-source pollution, toxic contaminationof biota, habitat loss) require morecomplete and integrated informationfrom monitoring approaches aimedat entir e ecosystems. Yet, Minnesotalacks a strategy for providing its
citizens with comprehensive infor-mation about the environment.
Environmental monitoring has longbeen narrowly focused on discreteecosystem elements (e.g., game fishand animals, selected endangeredspecies, or commodity outputs suchas timber) and regulated activities forcompliance reporting (e.g., pollutiondischarge monitoring). Monitoringhas produced a wealth of data onthese individual concerns but littleintegrated information on the stateof the environment as a whole. Weneed new approaches that integratedisparate information into morecomprehensive yardsticks of envi-ronmental heath.
An ecosystem approach to environ-mental evaluation stresses the interre-lationships among resources andhuman use rather than treating eachas separate components. Ecosys-tems are communities of plants,animals, and people connected toeach other and their environmentthrough a myriad of interactions.These interactions include foodwebs, nutrient cycles, predator-preyrelationships, and many otherecological phenomena. The com-plexity of these interactions givesecosystems the ability to recoverfrom disturbances, to change overtime, and to continue to supplyresource goods and services. Butmeasuring the health of such compli-cated systems can be difficult�wecannot measure every aspect of anecosystem. We can, however,measure the most important. Theseare environmental indicators, selectedmeasures of the environment andhuman activities that can be used to
assess ecosystem health. A compre-hensive set of environmental indica-tors can help us to� understand and forecast how
natural and managed ecosystemsrespond to human use, assess theability of ecosystems to sustaindiversity and provide resourcegoods, ecosystem services, andother benefits,
� anticipate emerging problemsbefore they reach crisisproportions, and plan andprioritize responses to those andestablished problems,
� measure progress in maintainingand restoring ecosystems, and
� communicate information inunderstandable ways to citizensand decision makers.
The Environmental IndicatorsInitiative (EII) seeks to develop acomprehensive set of environmentalindicators for Minnesota. The EII isan interagency effort sponsored bythe Minnesota EnvironmentalQuality Board (EQB) and funded bythe Legislative Commission onMinnesota Resources (LCMR). Thegoal of the EII is to create astatewide integrated network forselecting and monitoringenvironmental indicators. Thespecific objectives of the initiative areas follows:
1. Review and catalog existingenvironmental monitoring data.Much environmental data alreadyexist and can be integrated into anassessment of ecosystem health. Anevaluation of those data and theprograms that generate them isneeded to determine if additionaldata collection efforts ar e necessary.

OVERVIEW EII
5
2. Develop environmental indicatorsand descriptions for selectedecosystems. Useful environmentalindicators depend on a thoroughunderstanding of how ecosystemsoperate and respond to human use.
3. Design an EnvironmentalIndicators Network. A statewidenetwork of cooperating resourceprofessionals and citizens usingstandard protocols will facilitateconsistent data collection andreporting.
The EII is guided by a task forceappointed by the EQB. The currentmembers of the task force includerepresentatives from MinnesotaDepartment of Natural Resources,Minnesota Pollution Control Agency,Minnesota Department of Health,Minnesota Department ofAgriculture, MinnesotaEnvironmental Quality Board,Natural Resources Research Institute,The Nature Conservancy, 3MCompany, and U.S. Fish and WildlifeService.
BackgroundThe Minnesota Environmental PolicyAct recognizes the profound impactof human activity on theenvironment. Among other efforts,the act directs state agencies toprevent or eliminate damage to theenvironment, enrich theunderstanding of ecological systemsand natural resources, and establishand maintain statewideenvironmental information systemssufficient to gauge environmentalconditions. Similarly, the SustainableDevelopment Initiative (establishedin 1993) recognizes the need to
protect and restore the naturalenvironment on which people andeconomies depend. In accordancewith these needs, in 1993 theMinnesota Environmental QualityBoard appointed an EnvironmentalIndicator Task Force to� create a process for developing
environmental indicators thatmonitor the health ofMinnesota�s resources, itsecosystems, and its environment,
� develop LCMR or otherfunding proposals fordevelopment of environmentalindicators, and
� identify criteria to evaluate futureenvironmental indicator projects.
The task force, over a one-yearperiod, developed guiding principlesfor selecting, collecting, andreporting environmental indicators.These principles are idealistic. Someprinciples are targetsthat may not be attained in theforeseeable future. According tothese principles, environmentalindicators should
� help characterize the benefitspeople receive from ecosystems,and recognize the relationshipbetween ecosystem health andhuman health;
� be part of a unifying frameworkthat enables the monitoring andintegration of chemical, physical,and biological indicators ofecosystem health;
� be understandable to the public;� provide a general measure of
ecosystem quality and possessdiagnostic capabilities fordetermining specific causes ofecosystem degradation;
� be practical, meaningful, andeasily measured using methodscompatible with a standardizedframework; and
� enable resource managers andpolicymakers to developecosystem-based managementstrategies to protect theenvironment.
In addition, the task forcerecommended that an indicatorinitiative� be committed to long-ter m
environmental monitoring,� foster cooperation and
information exchange amongrepresentatives of allenvironmental monitoringinterests,
� be integrated into strategicplanning activities allowing foreffective evaluation of long-termenvironmental protection goals,
� provide a process for the annualcompilation, production, anddissemination of environmentalindicator reports, and
� be practical while notunderestimating oroversimplifying the complexityof ecosystems and the difficultyin measuring ecosystem health orintegrity.
With these guiding principles, the EIITask Force presented a proposal andreceived funding through theLegislative Commission onMinnesota Resources in 1995 tocreate a framework for developingcomprehensive environmentalindicators for Minnesota.

OVERVIEW EII
6
Potential users of environmentalindicators include statewidepolicymakers and legislators, regionalresource managers, other decisionmakers, and private citizens andlandowners (Fig. 1). Indicators are avaluable tool for guiding thedevelopment and evaluation ofenvironmental plans and policies,evaluating the performance ofenvironmental agencies and federalland-management programs (e.g.,Conservation Reserve Program), andassessing environmental impacts andlocal zoning. In short, indicatorshelp answer a fundamental question:Do our efforts make a difference,and how do we know? A fewexamples of indicator users follow.
Minnesota Departmentof Natural ResourcesThe biennial strategic planningprocess (Directions) of theMinnesota Department of NaturalResources (DNR) establishes DNRmanagement direction and integratesplanning and budgeting activities toachieve sustainability of Minnesota�secosystems and the natural resourcesthey provide the public. The EIIprovides a framework thateffectively integrates science-basedassessment and monitoring into theDirections process. The EIIframework helps DNR strategicplanning (1) assess and monitorecosystem status and trends; (2)identify priority ecosystemsustainability issues; (3) adapt andmodify DNR programs andactivities to meet desired
environmental outcomes; and (4)collaborate with partners in theevaluation of progress towardcommon sustainability goals. Todate, the EII framework has beenused in the production of Directions97: An Ecosystem-basedFramework for Setting NaturalResource Management Priorities, tohelp DNR Region 2 develop anassessment report for a SustainableLakes and Lakeshore Initiative, andto facilitate DNR participation in theForest Resource Council�s forestlandscape assessment design. TheEII will play a key role in DNRefforts to develop new systems forecosystem-based performancemeasurement that work towardmore effectively integratingevaluation of ecosystem health withDNR program performance.
Minnesota PollutionControl Agency andU.S. EnvironmentalProtection Agency:PerformancePartnership AgreementsThe Minnesota Pollution ControlAgency (MPCA) uses environmentalindicators in a variety of internaldecision-making processes.Comprehensive application ofindicators began with the 1998Environmental PerformancePartnership Agreement (EnPPA).The EnPPA describes theenvironmental goals of the MPCAand the U.S. Environmental
Protection Agency for fiscal year1998-99. Environmental indicatorswill be used to track progress inachieving those goals. EnPPAindicators focus primarily onpollutant emissions and ambientconcentrations of pollutants. Asrefinements to the agreement aremade, current indicators may besupplemented with other resource-based indicators identified by theEII.
Strategic Planning andthe U.S. Fish andWildlife ServiceUnder the GovernmentPerformance and Results Act of1993, all federal agencies mustprepare strategic plans that includeôoutcome-related goals andobjectives for the major functionsand operations of the agency.ö TheEII will provide a menu ofenvironmental indicators to trackoutcome-related goals used in thestrategic plans of the U.S. Fish andWildlife Service. For example,indicators of diversity (such aspercentage of native species that areconsidered rare and endangered) arelogical measures of progress inachieving the goals of theEndangered Species Act. Adoptingthe EII environmental indicators willadvance the partnership andadaptive-management goals of theU.S. Fish and Wildlife Service�secosystem-based managementstrategies.
THE APPLICATION OF ENVIRONMENTAL INDICATORS:SELECTED EXAMPLES

OVERVIEW EII
7
6&$/( 327(17,$/86(56
5(6285&(,668(6
327(17,$/,1',&$7256
,1',&$725$33/,&$7,216
� OHJLVODWRUV� VWDWH�DQG�IHGHUDODJHQFLHV
� LQGXVWU\� FRQVHUYDWLRQRUJDQL]DWLRQV
� FOLPDWH�FKDQJH� SROOXWLRQ� ELRGLYHUVLW\
� JUHHQKRXVH�JDVHPLVVLRQV
� SHUFHQWDJH�RIVZLPPDEOH�ILVKDEOH�ZDWHUV
� SHUFHQWDJH�RIUDUH�RUHQGDQJHUHGVSHFLHV
� VXVWDLQDEOHGHYHORSPHQWSROLF\
� HQYLURQPHQWDOODZV
� DJHQF\�SODQQLQJ� HQYLURQPHQWDOKHDOWK�UHSRUWV
� UHVRXUFH�PDQDJHUV� UHJLRQDO�SODQQHUV� ZDWHUVKHG�GLVWULFWV� FROOHJHV� HQYLURQPHQWDOJURXSV
� VRLO�HURVLRQ�IORRGLQJ
� VXUIDFH�ZDWHUTXDOLW\
� RXWGRRUUHFUHDWLRQ
� SHUFHQWDJH�RIYHJHWDWLRQ�FRYHU
� ILVK�FRPPXQLW\LQGH[
� RXWGRRUUHFUHDWLRQ�GD\VSHU�FDSLWD
� ZDWHUVKHGUHVWRUDWLRQ
� HQYLURQPHQWDODVVHVVPHQW
� WDUJHWLQJ�RIIHGHUDOSURJUDPV
� ORFDO�JRYHUQPHQW� VFKRROV� QHLJKERUKRRGV� QDWXUH�FHQWHUV� ODQGRZQHUV� FRQFHUQHG�FLWL]HQV
� JURXQG�ZDWHUSURWHFWLRQ
� ZLOGOLIHSRSXODWLRQV
� VROLG�ZDVWHGLVSRVDO
� SHUFHQWDJH�RIJURXQGZDWHUWKDW�PHHWVVWDQGDUGV
� VRQJELUGGLYHUVLW\
� WRQV�RI�ZDVWHJHQHUDWHG�SHUFDSLWD
� FRXQW\�KHDOWKUHSRUWV
� ODQG�XVHSODQQLQJ
� FLWL]HQPRQLWRULQJSURJUDPV
State of theEnvironment Reporting:Minnesota MilestonesMinnesota Milestones: A ReportCard for the Future is �a report cardfor measuring the state�s progressand a tool for helping Minnesotanscreate the future they want forthemselves and theirchildren.� It tracks the state�sprogress toward achieving its vision,represented by 20 goals, using 79measures of progress (indicators).Four goals and 20 indicators addressenvironmental issues.The report recommends thatstatewide goals be regularlymonitored and that state agenciescollect data that are useful inassessing results. Initial indicatorswere chosen in part because annual
data existed and because theindicators measured outcomes, notthe resources committed to achievingresults. Data definitions, timeframes, and data-gathering tools forsome indicators have alreadychanged (Minnesota Planning 1996).The EII will assist MinnesotaPlanning by providing acomprehensive framework forensuring that indicators provideconsistent, comparable informationover the long-term, focus onsignificant environmental problems,and measure the most importantaspects of the environment.
The Cannon RiverWatershed and BigWoods EcosystemsThe Cannon River WatershedPartnership and the DNR BigWoods Project recently establishedecosystem management and citizenoutreach programs to protect theCannon River watershed area insoutheastern Minnesota. Localmanagers will use indicators toevaluate progress in achieving theirenvironmental goals. The EII willassist by providing indicators that arebased on the cause-and-effect linksamong landscape change, resourceuse patterns, management practices,and resource sustainability.
Figure 1
Potential Users of Environmental Indicators○ ○ ○ ○ ○ ○ ○ ○ ○ ○ ○ ○ ○ ○ ○ ○ ○ ○ ○ ○ ○ ○ ○ ○ ○ ○ ○ ○ ○ ○ ○ ○ ○ ○ ○ ○ ○ ○ ○ ○ ○ ○ ○ ○ ○ ○ ○ ○ ○ ○ ○ ○ ○ ○ ○
○ ○ ○ ○ ○ ○ ○ ○ ○ ○ ○ ○ ○ ○ ○ ○ ○ ○ ○ ○ ○ ○ ○ ○ ○ ○ ○ ○ ○ ○ ○ ○ ○ ○ ○ ○ ○ ○ ○ ○ ○ ○ ○ ○ ○ ○ ○ ○ ○ ○ ○ ○ ○ ○ ○
○ ○ ○ ○ ○ ○ ○ ○ ○ ○ ○ ○ ○ ○ ○ ○ ○ ○ ○ ○ ○ ○ ○ ○ ○ ○ ○ ○ ○ ○ ○ ○ ○ ○ ○ ○ ○ ○ ○ ○ ○ ○ ○ ○ ○ ○ ○ ○ ○ ○ ○ ○ ○ ○ ○

OVERVIEW EII
8
Sustainable ForestResources Act:MonitoringRequirementsThe Minnesota Sustainable ForestResources Act directs the ForestResource Council to developmonitoring programs to assess thecurrent condition of and likely trendsregarding Minnesota�s forestresources as well as the effectivenessof existing and new managementguidelines. Monitoring programswill (1) increase the understandingamong the state�s forestrycommunity of the degree to whichsuggested practices are applied andeffective, and (2) provide directionfor effectively targeting those timberharvesting or forest managementpractices in need of improvement.The EII will assist the ForestResource Council in selectingindicators that accurately assess thecurrent status of Minnesota forestsand help identify forest managementpractices that best achievesustainability goals.
Citizens andCommunitiesMinnesotans make decisions thataffect their environment each day:whether to recycle the newspaperand junk mail or to send them to thelandfill with the trash, whether tokeep or release the fish just caught,whether to car pool with a neighboror drive alone to work. Decisions
made individually by millions ofcitizens collectively determine thestate of Minnesota�s environment.Environmental indicators provideinformation that connects individualactions with consequences for theenvironment.
For example, bird populations inhighly developed urban andsuburban areas (where nativevegetation has been removed)depend primarily on plantings forfood and breeding sites.Consequently, lawn-care decisionsare important determinants of birdhabitat and food availability. Giveninformation about trends in urbanbird diversity and habitatrequirements, individual homeowners may opt to plant shrubs orapply lawn chemicals in a mannerthat maximizes the benefit for birds.In a similar manner, communitiesmay retain or restore corridors ofnative vegetation to provide for bothurban wildlife and recreation.
Environmental indicators are aneffective tool for communities to usein identifying the causes ofenvironmental degradation,developing desired future conditionsfor their environment, and trackingprogress toward those goals.Indicators are now being used bycitizens throughout the state (e.g.,River Watch and 1000 Friends ofFrogs) to track issues of concern.Indicators help citizens recognize the
relationship between human activitiesand environmental conditions, setpriorities as to how limited financialresources should be allocated tosolve complex environmental issues,and determine whether their actionsare improving the overall conditionof the state�s natural resources. TheEII assists citizens in collecting andinterpreting environmental indicatorsthrough citizen monitoring networksand technical assistance.

OVERVIEW EII
9
Steps in theDevelopment andUse of IndicatorsThe EII uses an iterative, multistepprocess to develop environmentalindicators (Fig. 2). A five-stepprocess defines the initiative:information gathering, integration,testing, monitoring, andcommunication. These steps aregenerally sequential, though notexclusively so. For example, step1�information gathering�usesmodels of ecosystem functionproduced in step 2�integration.Model development depends ondiscovery of relevant information
about ecosystems obtained in step4�monitoring. The process isdeliberately iterative to allowknowledge gained early in theinitiative to guide later effort.
Information gatheringThe EII gathers information fromscientific and nontechnical sources tocatalog existing environmentalmonitoring databases, to documentpotential indicators, and to describeMinnesota ecosystems. Ecosystemdescriptions include the benefitsprovided by ecosystems� �goods�(such as timber, wildlife, and fish)and �services� (such as water storage
and protection from floods bywetlands, pollination of agriculturalcrops, and recreationalopportunities). The EII alsoidentifies human activities that canalter ecosystems and the primarypublic policies and programs thataffect Minnesota�s natural resources.The initiative relies on environmentalinformation collected by state andfederal agencies as well aseducational and privateorganizations.
IntegrationThe EII uses an ecosystem-basedframework to organize, integrate,and distill large amounts ofinformation into indicators thatmeasure environmental health.Regional workshops bring togethercitizens, policymakers, and resourcemanagers to select candidateindicators that are relevant to keyenvironmental issues.
TestingGood indicators (1) describe thecurrent extent and geographicaldistribution of Minnesota�secosystems, (2) quantify ecosystemintegrity in terms that areunderstandable and suggestrestorative actions where necessary,and (3) define relationships amongecosystem conditions, humanpressures, and the flow of benefits.The use of environmental indicatorsto measure ecosystem health isrelatively new. Like other newmeasuring devices, they must betested to ensure their accuracy. EII-
DEVELOPING ENVIRONMENTAL INDICATORS: THEENVIRONMENTAL INDICATORS INITIATIVE APPROACH
IndicatorDevelopment
Environmental Health
science
ideas
data values
issues
workshops
indicators
poor
good
okay
INFORMATION
INTEGRATION
TESTING
R E P O R T
MONITORING
COMMUNICATION
Figure 2
Indicator Development
○ ○ ○ ○ ○ ○ ○ ○ ○ ○ ○ ○ ○ ○ ○ ○ ○ ○ ○ ○ ○ ○ ○ ○ ○ ○ ○ ○ ○ ○ ○ ○ ○ ○ ○ ○ ○ ○ ○ ○ ○ ○
○ ○ ○ ○ ○ ○ ○ ○ ○ ○ ○ ○ ○ ○ ○ ○ ○ ○ ○ ○ ○ ○ ○ ○ ○ ○ ○ ○ ○ ○ ○ ○ ○ ○ ○ ○ ○ ○ ○ ○ ○ ○
○ ○ ○ ○ ○ ○ ○ ○ ○ ○ ○ ○ ○ ○ ○ ○ ○ ○ ○ ○ ○ ○ ○ ○ ○ ○ ○ ○ ○ ○ ○ ○ ○ ○ ○ ○ ○ ○ ○ ○ ○ ○

OVERVIEW EII
10
sponsored research comparesecosystem condition in areas that arestressed and areas that are notstressed (benchmark or referenceareas) as one means of verifyingindicator utility. The EII alsoimproves indicators by testing themin local watershed and ecosystemprojects. External evaluation byresource professionals andenvironmental scientists also providesvaluable insight on improvingindicators.
MonitoringLong-term environmentalmonitoring operates through asystem of monitoring professionals,scientists, managers, and the publicand through a network ofmonitoring sites. The systemincludes benchmark sites forintensive monitoring as well asstatewide coverage based on anecological classification system orwatershed units. Protocols forstandardized measurement and dataanalysis ensure consistent and timelydata collection by participants in thenetwork. Forums for informationexchange foster wide use ofenvironmental data. These toolsfacilitate the accumulation ofenvironmental data for indicatorsthat permit comparisons over broadgeographic areas and comparisons topast years.
CommunicationThe EII reports about environmentalindicators in a presentation formatthat informs the public,policymakers, and managers aboutstatewide ecosystem conditions andtrends. Periodic state-of-the-environment updates, via printed
reports and Internet Web pages,provide integrated indicatorinformation that is understandableand educates the public aboutMinnesota�s ecosystems.
Minnesota Ecosystemsand Ecosystem IntegrityEcosystemsThe EII organizes environmentalindicators by broad ecosystemclasses and resource categories. Atthe broadest level are sevenecosystem classes�agriculturalsystems, forests, lakes, prairies,rivers and streams, urban anddeveloped systems, and wetlands �and two resource categories� airand groundwater. These ecosystemsare distinctive in plant and animalspecies composition and the benefitsthey provide. Air and groundwaterare integral components of allterrestrial and aquatic ecosystems anddirectly affect human health.
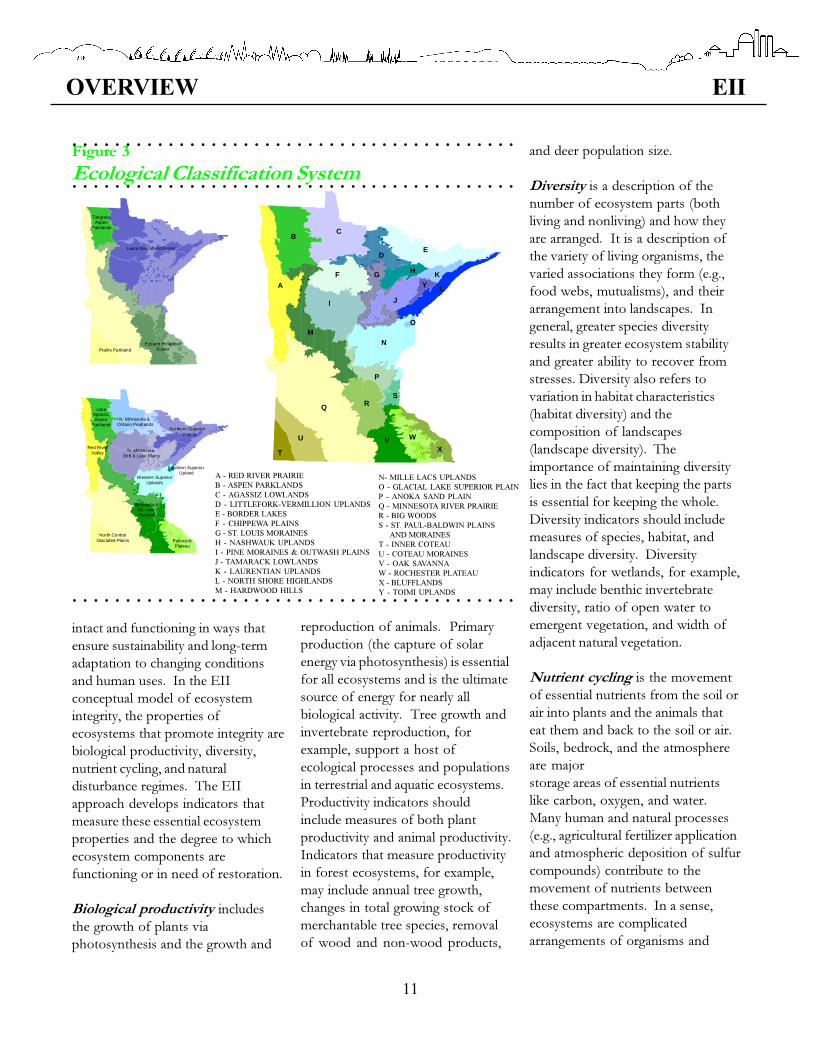
Geography strongly influences howecosystems respond to humanpressures, and ecosystems themselvesvary geographically across the state.To capture this variation, the EIIorganizes ecosystem classes byecological units as defined inMinnesota�s Ecological ClassificationSystem (Hargrave 1993). Ecologicalunits are segments of the landscapethat have relatively uniform climate,landform, and natural vegetativeattributes.
The Ecological Classification Systemdelineates ecological units at severalspatial scales ranging from tens ofacres to millions of acres. Minnesotais stratified into a nested set of large-scale ecological units: provinces,
sections, and subsections (Fig. 3).The EII develops environmentalindicators for the seven ecosystemclasses, focusing on how ecosystemsdiffer between ecological units. Inessence, the Ecological ClassificationSystem and the EII�s ecosystemclasses are tools to organizeinformation about ecosystems, adaptindicators to the ecologicalconditions in various geographicregions of the state, and report onecosystem condition. These toolsprovide a scientific base withincreasingly fine ecological andgeographic resolution and acommon language for developersand users of environmentalindicators.
Other geographic units areappropriate for organizing sometypes of information. Aquaticsystems may be monitored mosteffectively using watersheds.Watershed boundaries can becombined with ecological units forevaluation of the linkages betweenterrestrial and aquatic systems. Fine-scale watershed delineations are alsoan effective spatial scale for collectingindicator information andimplementing ecosystemmanagement at the local level.Political boundaries determine theextent and intensity of many humanactivities (such as land use and urbandevelopment) and are appropriatespatial scales for documentinghuman influences on theenvironment.
Ecosystem integrityEcosystem integrity is the degree towhich ecosystem elements� species,habitats, and natural processes�are
OVERVIEW EII
11
A
BC
DE
F G H
I J
L
MN
O
P
Q RS
T
U V W
X
KY
ECS Subsections - V99aA - Red River PrairieB - Aspen ParklandsC - Agassiz LowlandsD - Littlefork-Vermilion UplandsE - Border LakesF - Chippewa PlainsG - St. Louis MorainesH - Nashwauk UplandsI - Pine Moraines & Outwash PlainsJ - Tamarack LowlandsK - Laurentian UplandsY - Toimi UplandsL - North Shore HighlandsM - Hardwood HillsN - Mille Lacs UplandsO - Glacial Lake Superior PlainP - Anoka Sand PlainQ - Minnesota River PrairieR - Big WoodsS - St. Paul-Baldwin Plains and MorainesT - Inner CoteauU - Coteau MorainesV - Oak SavannaW - Rochester PlateauX - The Blufflands
Laurentian Mixed Forest
Prairie ParklandEastern Broadleaf
Forest
TallgrassAspen
Parklands
North CentralGlaciated Plains
Red RiverValley
Western SuperiorUplands
Minnesota & NE Iowa Morainal
Northern Superior Uplands
N. Minnesota Drift & Lake Plains
PaleozoicPlateau
Southern Superior Upland
LakeAgassiz,Aspen
ParklandsN. Minnesota &
Ontario Peatlands
A - RED RIVER PRAIRIEB - ASPEN PARKLANDSC - AGASSIZ LOWLANDSD - LITTLEFORK-VERMILLION UPLANDSE - BORDER LAKESF - CHIPPEWA PLAINSG - ST. LOUIS MORAINESH - NASHWAUK UPLANDSI - PINE MORAINES & OUTWASH PLAINSJ - TAMARACK LOWLANDSK - LAURENTIAN UPLANDSL - NORTH SHORE HIGHLANDSM - HARDWOOD HILLS
N- MILLE LACS UPLANDSO - GLACIAL LAKE SUPERIOR PLAINP - ANOKA SAND PLAINQ - MINNESOTA RIVER PRAIRIER - BIG WOODSS - ST. PAUL-BALDWIN PLAINS AND MORAINEST - INNER COTEAUU - COTEAU MORAINESV - OAK SAVANNAW - ROCHESTER PLATEAUX - BLUFFLANDSY - TOIMI UPLANDS
intact and functioning in ways thatensure sustainability and long-termadaptation to changing conditionsand human uses. In the EIIconceptual model of ecosystemintegrity, the properties ofecosystems that promote integrity arebiological productivity, diversity,nutrient cycling, and naturaldisturbance regimes. The EIIapproach develops indicators thatmeasure these essential ecosystemproperties and the degree to whichecosystem components arefunctioning or in need of restoration.
Biological productivity includesthe growth of plants viaphotosynthesis and the growth and
reproduction of animals. Primaryproduction (the capture of solarenergy via photosynthesis) is essentialfor all ecosystems and is the ultimatesource of energy for nearly allbiological activity. Tree growth andinvertebrate reproduction, forexample, support a host ofecological processes and populationsin terrestrial and aquatic ecosystems.Productivity indicators shouldinclude measures of both plantproductivity and animal productivity.Indicators that measure productivityin forest ecosystems, for example,may include annual tree growth,changes in total growing stock ofmerchantable tree species, removalof wood and non-wood products,
Figure 3
Ecological Classification Systemand deer population size.
Diversity is a description of thenumber of ecosystem parts (bothliving and nonliving) and how theyare arranged. It is a description ofthe variety of living organisms, thevaried associations they form (e.g.,food webs, mutualisms), and theirarrangement into landscapes. Ingeneral, greater species diversityresults in greater ecosystem stabilityand greater ability to recover fromstresses. Diversity also refers tovariation in habitat characteristics(habitat diversity) and thecomposition of landscapes(landscape diversity). Theimportance of maintaining diversitylies in the fact that keeping the partsis essential for keeping the whole.Diversity indicators should includemeasures of species, habitat, andlandscape diversity. Diversityindicators for wetlands, for example,may include benthic invertebratediversity, ratio of open water toemergent vegetation, and width ofadjacent natural vegetation.
Nutrient cycling is the movementof essential nutrients from the soil orair into plants and the animals thateat them and back to the soil or air.Soils, bedrock, and the atmosphereare majorstorage areas of essential nutrientslike carbon, oxygen, and water.Many human and natural processes(e.g., agricultural fertilizer applicationand atmospheric deposition of sulfurcompounds) contribute to themovement of nutrients betweenthese compartments. In a sense,ecosystems are complicatedarrangements of organisms and
○ ○ ○ ○ ○ ○ ○ ○ ○ ○ ○ ○ ○ ○ ○ ○ ○ ○ ○ ○ ○ ○ ○ ○ ○ ○ ○ ○ ○ ○ ○ ○ ○ ○ ○ ○ ○ ○ ○ ○ ○ ○
○ ○ ○ ○ ○ ○ ○ ○ ○ ○ ○ ○ ○ ○ ○ ○ ○ ○ ○ ○ ○ ○ ○ ○ ○ ○ ○ ○ ○ ○ ○ ○ ○ ○ ○ ○ ○ ○ ○ ○ ○ ○
○ ○ ○ ○ ○ ○ ○ ○ ○ ○ ○ ○ ○ ○ ○ ○ ○ ○ ○ ○ ○ ○ ○ ○ ○ ○ ○ ○ ○ ○ ○ ○ ○ ○ ○ ○ ○ ○ ○ ○ ○ ○

OVERVIEW EII
12
nonliving substrates designed tofacilitate the use and reuse ofnutrients. Indicators of nutrientcycling should focus on theconcentration and the processing andmovement of important nutrients.Soil compaction, litter removal, andsoil nutrient status are indicators thatcan measure relationships betweennutrient cycling, soil water retention,and plant growth.
Natural disturbance regimes arerecurring events that result in largechanges in ecosystems over arelatively brief period. Forest firesand flooding are examples ofperiodically recurring disturbances.In most ecosystems, disturbancehelps maintain diversity. In somesystems, natural disturbance regimesmaintain the conditions necessary forthe dominant species to remaindominant. In other ecosystems,recurrent disturbances prevent theplant community (and associatedanimal communities) from changingto a later successional stage. Someecosystems are dependent on naturaldisturbance regimes. For example,in the long-term absence of fire,tallgrass prairie is invaded by woodyspecies that displace the tall grasses.Without fire, tallgrass prairie soonbecomes brushland or savannah. InMinnesota, there is virtually novegetative habitat that lacks evidenceof past fire. In all ecosystems,natural disturbance regimes play anessential role in determiningfundamental ecosystemcharacteristics. Indicators ofdisturbance should measure thecharacteristics of natural disturbanceregimes that are important formaintaining ecosystems. Indicators
may include abundance of fire-dependent species, buildup of fuelloads, and frequency of flooding.
The four properties of ecosystemintegrity are highly interdependent.For example, diversity and naturaldisturbance events (e.g., fire,herbivory, insect outbreaks, flooding)influence nutrient cycling directly andindirectly. Diversity affects nutrientavailability because plant speciesdiffer in their nutrient uptake andtissue decomposition rates. Fireswarm soils (by exposing them tothe sun), which promotesdecomposition of organic matterand nutrient mineralization. Firesalso promote rapidly growingpioneer species that enhance nutrientavailability. Nutrient availability inturn affects ecosystem productivity.Human activities influence nutrientcycling directly (e.g., fertilizerapplication) and indirectly throughdecisions that affect fire frequencyand diversity.
In most ecosystems, changes in anyof the properties of ecosystemintegrity can alert us to problems andsuggest needed managementinterventions. Indicators measurethose changes. Together, indicatorsof biological productivity, diversity,nutrient cycling, and naturaldisturbance regimes provide (1) themost reliable evidence of whether anecosystem will be able to adapt tochanging conditions and cope withthe pressures we exert on it, and (2) acomprehensive basis for identifyingthe underlying cause of change.
The EII Framework forIndicator DevelopmentAn organizing framework makesenvironmental informationunderstandable and accessible todecision makers and the public byorganizing diverse information sothat relationships between humanactivities and environmentalconsequences can be identified. The�pressure-state-response� (P-S-R)model of the Organization forEconomic Cooperation andDevelopment groups informationinto pressure, state, and responsecategories. �Pressure� indicatorsmeasure human activities that causeenvironmental change. �State�indicators quantify the condition ofthe environment or specific elementsof it. �Response� indicators reporton the efforts made by individuals ororganizations to improve theenvironment or mitigate damage.Environment Canada organizesindicators in a similar framework. Intheir framework, changes in�environmental condition� result in�ecological and socioeconomiceffects.� These effects elicit �societalresponses� designed to modify the�human activities� that causedunwanted changes in theenvironment.
Combining the best aspects of theseframeworks, the EII framework(Fig. 4) organizes environmentalinformation into categories ofhuman activities, environmentalcondition, the flow of benefits, andsocietal strategies for sustaininghealthy environments. It addressesfour questions that provide insightinto complex human-environmentinteractions:

OVERVIEW EII
13
1. What is happening to theenvironment? (the conditionof the environment)
2. Why is it happening?(human activities that alter theenvironment)
3. How does it affect us?(impacts on the sustainableflow of benefits)
4. What are we doing about it?(societal strategies to sustainhealthy ecosystems and thebenefits they provide)
Comprehensive assessment of theenvironment is central to the EIIframework. In healthyenvironments, ecosystems are self-sustaining and are capable ofrecovering from reasonable stresses.Such ecosystems produce with
minimal human intervention thegoods and services on which humansocieties depend. These ecosystemsare described as having a high degreeof integrity. Assessing environmentalhealth, then, is based on determiningthe characteristic natural limits forproductivity, diversity, nutrientcycling, and natural disturbancewithin which an ecosystem willmaintain itself over long periods.Effective environmental indicatorsshould alert us to ecosystemthresholds beyond which acceptablelevels of benefits and ecosystemintegrity cannot be sustained. Inlakes, for example, phosphorusinputs that exceed normal amountsmay result in algal blooms, lowdissolved oxygen levels, and fish kills.A comprehensive suite of indicatorsof lake health should include ameasure of phosphorus availability.By considering environmental
indicators within the EII framework,decision makers can� focus on benefits and desired
environmental conditions andthe human activities most likelyto reduce or sustain them,
� identify the cumulative pressuresthat may alter environmentalcondition, and
� assess the integrity of wholeecosystems (or combinations ofecosystems in a landscape).
To illustrate the EII framework,consider the following scenario:urban expansion into a rurallandscape of agricultural lands,woodlands, wetlands, and clear lakesand streams. At first, ducks andherons are abundant in wetlandsscattered throughout the landscape,and frogs and toads call in theevening. As housing developmentsexpand into the area, woodlands andnative vegetation around thewetlands and streams become themanicured lawns around houses.Improved roads and stor mdrainage systems alter natural waterlevels and flow across the landscape.In the wetlands exotic species andinvasive native species, such ascattails, form uniform stands thatreplace the original mixture ofrushes, sedges, and herbs.Eventually, essential wildlife habitat isscarce, and animal populations, fromducks and herons to crayfish andfrogs, decline. The altered wetlandslose their capacity to filter nutrientsfrom runoff and to prevent floodsand can no longer protect waterquality in adjacent lakes and streams.Excessive algal blooms in lakes andstreams are common, and fishingsuccess declines.
ENVIRONM ENTALCONDITION
Ecosystem integrity asmeasured by:
Natural disturbancesN utrient cycling
ProductivityDiversity
BENEFITSBenefits provided
by ecosystems:Resources of economic value
Fish & w ildlifeClean waterRecreationA esthetics
SOCIETALSTRATEGIES
Strategies to sustain healthyecosystems and their benefits:
Management approachesEducation & research
Market incentivesLaws & policies
HUM AN ACTIVITIESActivities that directly affect
the environment such as:
Resource harvest & use
Land use
Pollution
Figure 4
EII Framework for Illustrating IndicatorRelationships
○ ○ ○ ○ ○ ○ ○ ○ ○ ○ ○ ○ ○ ○ ○ ○ ○ ○ ○ ○ ○ ○ ○ ○ ○ ○ ○ ○ ○ ○ ○ ○ ○ ○ ○ ○ ○ ○ ○ ○ ○ ○
○ ○ ○ ○ ○ ○ ○ ○ ○ ○ ○ ○ ○ ○ ○ ○ ○ ○ ○ ○ ○ ○ ○ ○ ○ ○ ○ ○ ○ ○ ○ ○ ○ ○ ○ ○ ○ ○ ○ ○ ○ ○
○ ○ ○ ○ ○ ○ ○ ○ ○ ○ ○ ○ ○ ○ ○ ○ ○ ○ ○ ○ ○ ○ ○ ○ ○ ○ ○ ○ ○ ○ ○ ○ ○ ○ ○ ○ ○ ○ ○ ○ ○ ○
OVERVIEW EII
14
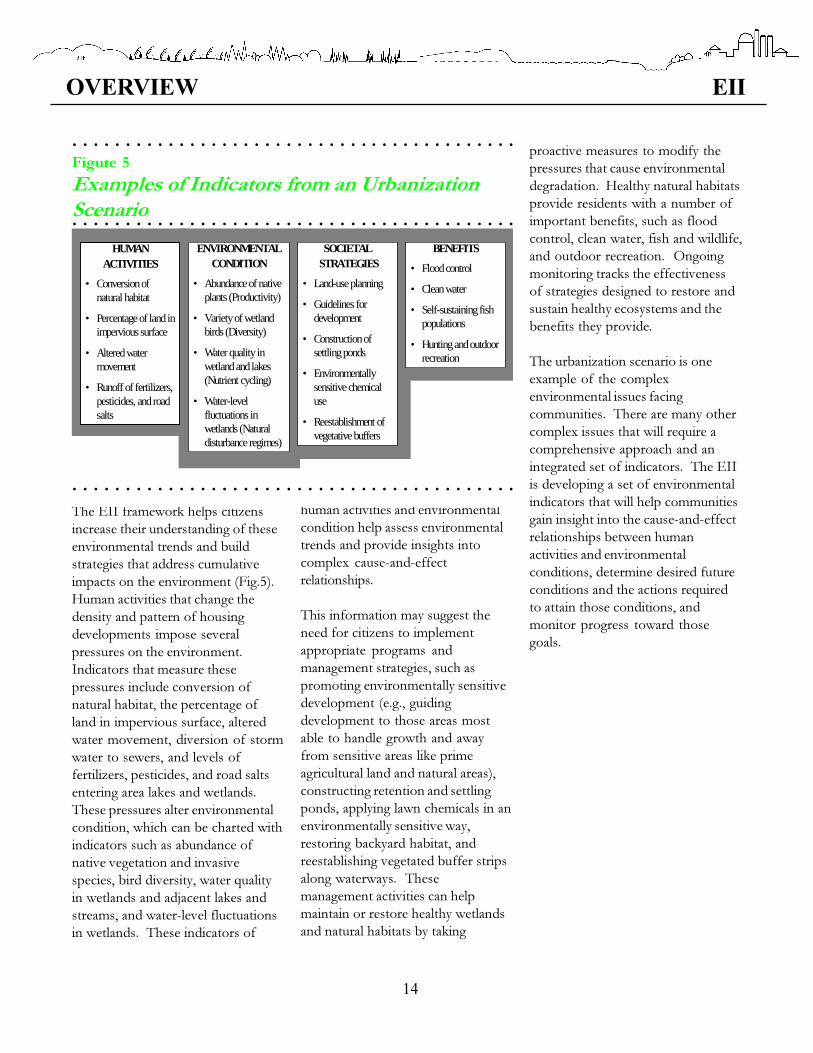
The EII framework helps citizensincrease their understanding of theseenvironmental trends and buildstrategies that address cumulativeimpacts on the environment (Fig.5).Human activities that change thedensity and pattern of housingdevelopments impose severalpressures on the environment.Indicators that measure thesepressures include conversion ofnatural habitat, the percentage ofland in impervious surface, alteredwater movement, diversion of stormwater to sewers, and levels offertilizers, pesticides, and road saltsentering area lakes and wetlands.These pressures alter environmentalcondition, which can be charted withindicators such as abundance ofnative vegetation and invasivespecies, bird diversity, water qualityin wetlands and adjacent lakes andstreams, and water-level fluctuationsin wetlands. These indicators of
human activities and environmentalcondition help assess environmentaltrends and provide insights intocomplex cause-and-effectrelationships.
This information may suggest theneed for citizens to implementappropriate programs andmanagement strategies, such aspromoting environmentally sensitivedevelopment (e.g., guidingdevelopment to those areas mostable to handle growth and awayfrom sensitive areas like primeagricultural land and natural areas),constructing retention and settlingponds, applying lawn chemicals in anenvironmentally sensitive way,restoring backyard habitat, andreestablishing vegetated buffer stripsalong waterways. Thesemanagement activities can helpmaintain or restore healthy wetlandsand natural habitats by taking
proactive measures to modify thepressures that cause environmentaldegradation. Healthy natural habitatsprovide residents with a number ofimportant benefits, such as floodcontrol, clean water, fish and wildlife,and outdoor recreation. Ongoingmonitoring tracks the effectivenessof strategies designed to restore andsustain healthy ecosystems and thebenefits they provide.
The urbanization scenario is oneexample of the complexenvironmental issues facingcommunities. There are many othercomplex issues that will require acomprehensive approach and anintegrated set of indicators. The EIIis developing a set of environmentalindicators that will help communitiesgain insight into the cause-and-effectrelationships between humanactivities and environmentalconditions, determine desired futureconditions and the actions requiredto attain those conditions, andmonitor progress toward thosegoals.
HUMANACTIVITIES
• Conversion ofnatural habitat
• Percentage of land inimpervious surface
• Altered watermovement
• Runoff of fertilizers,pesticides, and roadsalts
ENVIRONMENTALCONDITION
• Abundance of nativeplants (Productivity)
• Variety of wetlandbirds (Diversity)
• Water quality inwetland and lakes(Nutrient cycling)
• Water-levelfluctuations inwetlands (Naturaldisturbance regimes)
SOCIETAL STRATEGIES
• Land-use planning
• Guidelines fordevelopment
• Construction ofsettling ponds
• Environmentallysensitive chemicaluse
• Reestablishment ofvegetative buffers
BENEFITS
• Flood control
• Clean water
• Self-sustaining fishpopulations
• Hunting and outdoorrecreation
Figure 5
Examples of Indicators from an UrbanizationScenario
○ ○ ○ ○ ○ ○ ○ ○ ○ ○ ○ ○ ○ ○ ○ ○ ○ ○ ○ ○ ○ ○ ○ ○ ○ ○ ○ ○ ○ ○ ○ ○ ○ ○ ○ ○ ○ ○ ○ ○ ○ ○
○ ○ ○ ○ ○ ○ ○ ○ ○ ○ ○ ○ ○ ○ ○ ○ ○ ○ ○ ○ ○ ○ ○ ○ ○ ○ ○ ○ ○ ○ ○ ○ ○ ○ ○ ○ ○ ○ ○ ○ ○ ○
○ ○ ○ ○ ○ ○ ○ ○ ○ ○ ○ ○ ○ ○ ○ ○ ○ ○ ○ ○ ○ ○ ○ ○ ○ ○ ○ ○ ○ ○ ○ ○ ○ ○ ○ ○ ○ ○ ○ ○ ○ ○
OVERVIEW EII
15
The EII encourages resourcemanagers, policymakers, citizens, andother stakeholders to participate inthe development of environmentalindicators and in collectingenvironmental data as part of astatewide monitoring network.Opportunities for involvementinclude the following:
Indicator developmentRegional workshops and pilotprojects allow diverse stakeholdersto participate in selection and testingof indicators.
Data collection andmonitoringThe EII indicators network engagesindividuals and organizations in datacollection, facilitates informationexchange among network members,and connects local citizen-ledmonitoring projects to a statewidenetwork.
Public disseminationof indicator informationThe EII communicatesenvironmental information todecision makers and the public.Interested individuals have access toindicator information through �state-of-the-environment� updates,indicator fact sheets, and the Internet.
For more information or tocomment on EII activities, pleasecontact the EII staff.
Clarence Turner, CoordinatorMinnesota Department of NaturalResources500 Lafayette Road, Box 10St. Paul, MN 55155-4010612-297-3357 (voice)612-296-6047 (fax)[email protected]
Laura Preus, EcologistMinnesota Department of NaturalResources500 Lafayette Road, Box 10St. Paul, MN 55155-4010612-296-1548 (voice)612-296-6047 (fax)[email protected]
Faith Balch, EcologistMinnesota Department of NaturalResources500 Lafayette Road, Box 10St. Paul, MN 55155-4010612-297-4707 (voice)612-296-6047 (fax)[email protected]
GETTING INVOLVED
Keith Wendt, Project Manager andChair, EII Task ForceMinnesota Department of NaturalResources500 Lafayette Road, Box 10St. Paul, MN 55155-4010612-297-7879 (voice)612-296-6047 (fax)[email protected]
Paul Schmiechen, Co-Chair, EIITask ForceMinnesota Pollution Control Agency520 Lafayette RoadSt. Paul, MN 55155612-296-7795 (voice)612-297-8676 (fax)[email protected]

OVERVIEW EII
16
REFERENCES
Daily, G. C., S. Alexander, P. R.Ehrlich, L. Goulder, J. Lubchenco,P. A. Matson, H. A. Mooney, S.Postel, S. H. Schneider, D. Tilman,and G. M. Woodwell. 1997.Ecosystem services: Benefitssupplied to human societies bynatural ecosystems. Issues inEcology Number 2. EcologicalSociety of America.
Hammond, A., A. Adriaanse, E.Rodenburg, D. Bryant, and R.Woodward. 1995. Environmentalindicators: A systematic approach tomeasuring and reporting onenvironmental policy performance inthe context of sustainabledevelopment. World ResourcesInstitute.
Hargrave, B. 1993. The upper levelsof an ecological classification systemfor Minnesota. MinnesotaDepartment of Natural Resources,St. Paul.
Minnesota Planning. 1996.Minnesota milestones: 1996progress report. MinnesotaPlanning, St. Paul.

OVERVIEW EII
17
The Environmental IndicatorInitiative describes its progress inDeveloping EnvironmentalIndicators for Minnesota, a series offive reports. These reportsdocument the status of the initiative,serve as prototypes for future state-of-the-environment reports, and helpeducate the public about Minnesotaecosystems and environmentalindicators. These reports will beupdated as the EII accumulatesinformation and improves itscapacity to communicate about thehealth of Minnesota�s environment.
DEVELOPINGENVIRONMENTALINDICATORS FORMINNESOTA: ANOVERVIEW(Report 1)is this document.
MINNESOTAECOSYSTEMS(Report 2)This report describes the ecology,status, and trends of Minnesota�sagricultural systems, forests, lakes,prairies, rivers and streams, urbanand developed systems, wetlands,and air and groundwater resources.For each system the reportsummarizes the followinginformation:
Ecosystem benefitsThe EII identifies resource �goods�provided by each ecosystem (such astimber, wildlife, and recreationalvalues provided by forests), and�services� performed by eachecosystem (such as water storage andflood protection by wetlands,cleaning of atmospheric pollutants byforests, etc.). By identifying valuedecosystem goods and services, theEII ensures that indicators will bemeaningful to decision makers andthe public.
Important ecologicalpropertiesThis section identifies criticalecological properties that must bemaintained to ensure ecosystemrenewal and sustainable productionof resource benefits. Theseproperties include biologicalproductivity, diversity, nutrientcycling, and natural disturbances.Indicators ensure a comprehensiveassessment of ecosystem conditionsby measuring these properties.
Human pressures thataffect ecosystem conditionsHuman activities such as loss andfragmentation of natural habitat,resource use, erosion, pollution, andexotic species threaten long-termenvironmental health. The EIIidentifies these pressures for eachecosystem class and integrates themin a useful framework.
Available data onstatus and trendsA variety of programs collect issue-specific data on Minnesota�sresources. The EII summarizes thisinformation to highlight the statusand trends of Minnesota�s majorecosystems. However, thesesummaries are not a comprehensiveassessment of environmentalconditions because they are not yetbased on an integrated set ofenvironmental indicators.
Existing policy goalsand programsThe EII highlights major policies andprograms that affect ecosystems toensure that indicators are relevant todecision makers and the public.
Environmental indicatorsproposed by the EIIThe EII provides examples ofpotential indicators for each majorecosystem class. The developmentand evaluation of specific indicatorswill be reported as workshop results(Report 5).
This report achieves several EIIobjectives. First, it helps stakeholdersin the indicator development processby identifying key ecosystemproperties that should be consideredwhen selecting indicators. Second, itprovides resource managers, decisionmakers, and interested citizens withuseful information about the statusand trends of Minnesota�secosystems, and identifies gaps inlong-term monitoring information.
APPENDIX A:ENVIRONMENTAL INDICATOR INITIATIVE PRODUCTS

OVERVIEW EII
18
Finally, this report is a prototype forfuture state-of-the-environmentupdates, which will be based on anintegrated set of EII indicators.
ENVIRONMENTALINDICATOR FACTSHEETS(Report 3)Fact sheets present informationabout environmental indicators thatis critical for widespread acceptanceand use of indicators by landmanagers, local planners, citizens, andpolicymakers. The fact sheetsprovide short, user-friendlysummaries for use with ecosystemdescriptions and the databasecatalog. The fact sheets promote theuse of environmental indicators atthe local level while facilitatingintegration of information at the statelevel by standardizing methods foruse and interpretation of indicators.The following information isincluded on each fact sheet:
BackgroundA rationale for the indicator discusseswhat the indicator can tell andexplains how it relates to ecologicalintegrity.
Recommended measurementtechniquesFor some indicators there are manypractical measurement techniques.Fact sheets facilitate informationexchange and integration byrecommending specific methods andproviding detailed descriptions.
Examples of useCharts, tables, and graphics presentcurrent indicator data and illustratehow the indicator is used to improveunderstanding of the ecosystembeing measured. For someindicators, case studiesdemonstrate use.
Estimates of data availabilityAn assessment of the currentavailability of data accompanies eachindicator.
Potential limitationsA brief discussion outlines thepotential limitations of the indicatorto facilitate decisions about whichindicators to measure and how toallocate monitoring resources.
The EII�s Indicator Fact SheetFolder presents information sheetsfor indicators in agricultural systems,forests, lakes, prairies, rivers, streams,urban and developed systems,wetlands, and air and groundwaterresources. As indicator informationis updated and new indicators areidentified, fact sheets will beupdated. The Indicator Fact SheetFolder will be distributed widely toresource managers, local planners,and other interested parties.
ENVIRONMENTALINDICATORSCATALOG OFDATABASES ANDINFORMATIONSOURCES(Report 4)Version 1.0 of this report describesmore than 160 sources ofenvironmental information. Topicsinclude Minnesota�s physicalenvironment (climate, geology,topography, surface waters, andgroundwater), biotic resources(terrestrial and aquatic animalpopulations, plant species andcommunities), management and useof natural resources in Minnesota(recreation, hunting, fishing, timberharvest, mineral extraction, wateruse), and human activities that affectthe environment (land use,transportation, agriculture, humanpopulations, air and water pollution).
For each database, the catalogprovides the following information:
Description of the databaseA general description of thedatabase, including its name, themanagement or scientific purposefor which it was designed and ismaintained, keywords that provideaccess to users, the organization thatis primarily responsible for thedatabase, and contact informationfor the person who can supplyadditional information or access.
Geographic areas covered Parts of the state for which data areavailable. Geographic areas may bedescribed by Ecosystem

OVERVIEW EII
19
Classification System unit, watershed,political unit, or region.
Time periods coveredWhen data collection began and howoften new data are added or existingdata are updated.
EII ecosystem classesAll EII ecosystem classes for whichdata are supplied. Databases maysupply information on more thanone EII ecosystem class.
Characteristics of the dataInformation useful to individualswho want to use data contained inthe database. Fields describe thespatial and temporal scales for whichthe data are appropriate, the units ofmeasurement used,the type of sampling schemeemployed, published andunpublished documentation for themethods of data collection andanalysis, key publications that arebased on the data, and the locationwhere the data may be accessedelectronically.
Version 1.0 includes databases from6 state agencies and 18 federalagencies. Updates of this catalog ofdatabases will be released asappropriate.
WORKSHOP RESULTS(Report 5)The EII uses a participatoryapproach in developingenvironmental indicators forMinnesota. Regional workshops arean integral part of this process.Report 5 describes the context,results, and follow-up activities forthe first EII workshop, held April16-17, 1997. The results of the otherthree workshops will beincorporated into this report whenthey become available.
Workshop contextThe Eastern Broadleaf ForestWorkshop is one of four regionalworkshops to develop a statewideintegrated set of environmentalindicators. Other workshops willfocus on the Prairie ParklandProvince, the Laurentian MixedForest Province, and Urban/Developed areas.
Workshop summary and resultsThe workshop brought together 30participants to evaluate a set ofindicators focused on the transitionalzone of Minnesota. Participantsincluded representatives from localand state agencies, citizen groups,consulting firms, and universities.The goal of the workshop was to�incorporate local and regional needsand experience in evaluating anddeveloping an ecologicallycomprehensive and socially relevantset of environmental indicators forthe state of Minnesota.�
Participants engaged in groupactivities to evaluate a set ofindicators presented by the EII. Thereport summarizes proposedindicators for lakes, rivers andstreams, wetlands, forests, andagricultural systems. Participantsevaluated these indicators forcontent, completeness, and relativeimportance. Conceptual models andindicator criteria assisted in theevaluation process.
The report also presents indicatorsthat are useful for measuringprogress toward environmental goalsin the Cannon River watershed andBig Woods region. Participantsnominated and prioritized indicatorsaccording to a set of managementobjectives for that region.
In addition, the report highlightsimportant issues for indicatordevelopment. For example, issuesconcerning data availability, indicatorcharacteristics, measurementtechniques, and geographicscale need to be addressed asindicator development continues.Finally, the report summarizesfeedback from participants andsuggestions for how to improvefuture workshops.
Workshop follow-upIndicator development is anongoing, iterative process. Futureworkshops will build on the resultsfrom this first workshop. Thereport summarizes EII follow-upactivities and �next steps.�

OVERVIEW EII
20
A primary goal in establishing astatewide network for environmentalmonitoring is to enable consistentcollection of data that can be used to(1) analyze long-term trends inenvironmental health and (2) gaininsight into causal relationshipsbetween pressures on ecosystemsfrom human activities and changes inenvironmental quality. An equallyimportant goal is to promoteecosystem-based approaches toenvironmental decision making byincreasing public awareness of thecause-and-effect relationshipsbetween human activities andchanges in the environment. Tothese ends, the EnvironmentalIndicators Initiative will establishvoluntary networks of environmentalprofessionals and citizens to collectenvironmental data.
Incentives for participation arenumerous. The networks willprovide technical assistance toparticipants in the form of training,guidance documents, reports, andforums for sharing experiences.Financial assistance, using fundsobtained from private, state, andfederal granting agencies in responseto cooperative applications, will likelybe available. More importantly, thenetworks offer participants theopportunity to compare their resultsto those of others doing similarwork and to see their work influencedecision making and policydevelopment.
Although both networks will bebased on established guidelines andstandards for collaborative collectionand reporting of environmental data,establishing a network ofenvironmental professionals presentsdifferent challenges than doesestablishing a network of citizens.The primary task in creating anetwork of professionals is to bringtogether the information currentlybeing collected in unrelated effortsinto a cohesive whole. In contrast,creating the citizen network will
APPENDIX B: MONITORING NETWORKS FOR CITIZENSAND RESOURCE PROFESSIONALS
require the ability to motivate, train,and coordinate volunteers locatedthroughout the state. The steps forthe formation of monitoringnetworks reflect these differences(Figures 6 and 7).
,GHQWLI\
RUJDQL]DWLRQV
WKDW�FROOHFW�GDWD
(VWDEOLVK
PHDVXUHPHQW
SURWRFROV
(VWDEOLVK�GDWD
SURFHVVLQJ�DQG
LQWHUSUHWDWLRQ
SURWRFROV
)DFLOLWDWH
LQIRUPDWLRQ
VKDULQJ�DPRQJ
FROOHFWLQJ
RUJDQL]DWLRQV
� ,GHQWLI\�DYDLODEOHGDWDEDVHV
�'HWHUPLQHDJHQFLHV��SULYDWHRUJDQL]DWLRQV��DQGXQLYHUVLW\�IDFXOW\UHVSRQVLEOH�IRUFROOHFWLQJ�UHOHYDQWGDWD
�8VH�SLORW�SURMHFWVDFURVV�WKH�VWDWH�WRHQVXUH�FROOHFWLRQRI�WKH�PRVW�XVHIXOGDWD�DQG�WRVWUHDPOLQH�HIIRUWV
�)DFLOLWDWH�QHZH[FKDQJHV
�(VWDEOLVK�SURWRFROIRU�DQQXDO�UHSRUWV
�(QFRXUDJH�UHJXODUVWDWH�RI�WKH�HQYLURQPHQWUHSRUWV
�3URYLGH�,QWHUQHWDFFHVV�WR�(,,LQGLFDWRULQIRUPDWLRQ
�3URPRWH�,QWHUQHWLQIRUPDWLRQH[FKDQJH�DPRQJLQGLFDWRU�XVHUV
�3URYLGH�H[DPSOHVDQGUHFRPPHQGDWLRQVIRU�SURFHVVLQJ�DQGLQWHUSUHWDWLRQ�YLD�
3LORW�SURMHFWV
*XLGDQFHGRFXPHQWV
)DFW�VKHHWV
$QQXDO�UHSRUWV
,QWHUQHW
�5HYLHZ�VFLHQWLILFOLWHUDWXUH
�5HYLHZ�RWKHUIHGHUDO�DQG�VWDWHDJHQF\�SURWRFROV
�'HYHORS�JXLGDQFHGRFXPHQWV�RQGDWD�FROOHFWLRQDQG�LQGLFDWRU�XVH
�'HYHORS�IDFWVKHHWV�IRU�HDFKLQGLFDWRU
�([SODLQ�DQGGHPRQVWUDWHPHDVXUHPHQWWHFKQLTXHV�IRUHDFK�SLORW�SURMHFW
Figure 6
Steps in Establishing an Environmental Indica-tors Network for Resource Professionals○ ○ ○ ○ ○ ○ ○ ○ ○ ○ ○ ○ ○ ○ ○ ○ ○ ○ ○ ○ ○ ○ ○ ○ ○ ○ ○ ○ ○ ○ ○ ○ ○ ○ ○ ○ ○ ○ ○ ○ ○ ○
○ ○ ○ ○ ○ ○ ○ ○ ○ ○ ○ ○ ○ ○ ○ ○ ○ ○ ○ ○ ○ ○ ○ ○ ○ ○ ○ ○ ○ ○ ○ ○ ○ ○ ○ ○ ○ ○ ○ ○ ○ ○
○ ○ ○ ○ ○ ○ ○ ○ ○ ○ ○ ○ ○ ○ ○ ○ ○ ○ ○ ○ ○ ○ ○ ○ ○ ○ ○ ○ ○ ○ ○ ○ ○ ○ ○ ○ ○ ○ ○ ○ ○ ○

OVERVIEW EII
21
ENVIRONMENTAL INDICATORS INITIATIVEMinnesota Department of Natural Resources Minnesota Pollution Control Agency
Minnesota Department of HealthMinnesota Department of Agriculture
Natural ResourcesResearch Institute
The Nature Conservancy3M Company
U.S. Fish and Wildlife ServiceMinnesota Environmental Quality Board
�'LVWULEXWHLQIRUPDWLRQ�RQKRZ�FLWL]HQVFDQ�XVHLQGLFDWRUV
�&RQGXFWRXWUHDFK�WRHQYLURQPHQWDOJURXSV
�&RQGXFW�ILHOGWULSV�DQGSXEOLFZRUNVKRSV�RQHQYLURQPHQWDOPRQLWRULQJ
�5HYLHZ�RWKHU&LWL]HQ6FLHQFHSURJUDPV
�&RPSLOHLQIRUPDWLRQ�RQHQYLURQPHQWDOLVVXHV�RILQWHUHVW�WRFLWL]HQ�JURXSV
�2UJDQL]HLQGLYLGXDOVLQWHUHVWHG�LQPRQLWRULQJ
� ,GHQWLI\DGYLVRUV�LQVWDWH�DJHQFLHVDQGXQLYHUVLWLHV
�+ROGZRUNVKRSV�RQGDWD�FROOHFWLRQDQG�VWDQGDUGHTXLSPHQW
�&RRSHUDWLYHO\FRPSLOH�DQDO\]H��DQGUHSRUWHQYLURQPHQWDOGDWD
�(VWDEOLVK�DVWDQGDUG,QGLFDWRU5HSRUW�&DUGWKDW�FDQ�EHVXEPLWWHG�WRORFDO�SXEOLFRIILFLDOV�DQGVWDWHUHSUHVHQWDWLYH
� )DFLOLWDWH�DQLQGLFDWRUQHZVOHWWHUGHYHORSHG�DQGPDLQWDLQHG�E\ORFDOPRQLWRULQJJURXSV
�3HULRGLFDOO\UHYLHZ�WKH�XVHDQGHIIHFWLYHQHVVRI�LQGLFDWRUUHSRUWV
�5HFUXLW�QHZSDUWLFLSDQWV
�2EWDLQIXQGLQJ�IRU�WKHFRRUGLQDWLRQDQG�VXSSRUW�RIILHOG�DFWLYLWLHV
,QFUHDVH�SXEOLF
DZDUHQHVV�RI
LQGLFDWRUV�DQG
HQYLURQPHQWDO
PRQLWRULQJ
,GHQWLI\
LQGLFDWRU�QHHGV
3URYLGH
JXLGDQFH�
FRRUGLQDWLRQ�
DQG�WUDLQLQJ
6KDUH�ILQGLQJV
DQG�LQGLFDWRU
LQIRUPDWLRQ
(YDOXDWH�DQG
LPSURYH
QHWZRUN
Figure 7
Steps in Establishing an Environmental IndicatorsNetwork for Citizens
○ ○ ○ ○ ○ ○ ○ ○ ○ ○ ○ ○ ○ ○ ○ ○ ○ ○ ○ ○ ○ ○ ○ ○ ○ ○ ○ ○ ○ ○ ○ ○ ○ ○ ○ ○ ○ ○ ○ ○ ○ ○ ○ ○ ○ ○ ○ ○ ○
○ ○ ○ ○ ○ ○ ○ ○ ○ ○ ○ ○ ○ ○ ○ ○ ○ ○ ○ ○ ○ ○ ○ ○ ○ ○ ○ ○ ○ ○ ○ ○ ○ ○ ○ ○ ○ ○ ○ ○ ○ ○ ○ ○ ○ ○ ○ ○ ○ ○
○ ○ ○ ○ ○ ○ ○ ○ ○ ○ ○ ○ ○ ○ ○ ○ ○ ○ ○ ○ ○ ○ ○ ○ ○ ○ ○ ○ ○ ○ ○ ○ ○ ○ ○ ○ ○ ○ ○ ○ ○ ○ ○ ○ ○ ○ ○ ○ ○