overview: disaggregated data from the smarter … · web viewdisaggregated data from the smarter...
TRANSCRIPT

DISAGGREGATED FIELD TEST DATABY DEMOGRAPHIC GROUP
Disaggregated Data from the Smarter Balanced Field Test
The Smarter Balanced assessments are a key part of implementing the Common Core State Standards and preparing all students for success in college and careers. A Field Test of the Smarter Balanced Assessment System took place from March to June 2014, culminating a three-year, multi-stage research and development process to ensure the assessments work properly. The Smarter Balanced Field Test was a practice run designed to help ensure that the assessments are accurate and fair for all students. The Field Test served several important purposes:
Quality Assurance: The Field Test evaluated the performance of more than 19,000 assessment items and performance tasks, as well as the performance of the online testing system.
Achievement Levels: Data from the Field Test allowed Smarter Balanced to set preliminary achievement levels in November 2014.
Test Administration: For member states, the Field Test provided an opportunity to make sure technology systems and administration logistics were ready for implementation of the assessment system in the 2014-15 school year.
While more than four million students participated in the Field Test, Smarter Balanced analyzed the performance of a representative sample of over 400,000 students from across the Consortium. The sample size was limited to allow for hand scoring of performance tasks and other open-ended questions prior to the achievement level setting. The Field Test provided item data that the Consortium used to create scale scores and threshold scores for achievement levels 2 through 4.Following the completion of achievement level setting activities in November, 2014, Smarter Balanced released the estimated percentage of students across member states who would have scored at each level based on data from the Consortium’s spring 2014 Field Test. This report provides additional disaggregated demographic data of the Smarter Balanced Field Test for key demographic groups. It is intended as a resource for states, educators, researchers, and others as they work to improve achievement for all students.The disaggregated data show achievement gaps between some demographic groups and the student population as a whole. Although these gaps are generally consistent with data collected from current state assessment programs, Smarter Balanced and its member states are committed to narrowing the gaps and to providing an assessment system that will improve instruction and help all students succeed.
1

DISAGGREGATED FIELD TEST DATABY DEMOGRAPHIC GROUP
For more information about the Consortium’s support for under-represented students, visit: http://www.smarterbalanced.org/parents-students/support-for-under-represented-students/
Student Characteristics Reported from the Demographic SampleThe tables below provide projections of student performance on the assessments based on the Field Test demographic sample by content area, grade level, and demographic group as defined by No Child Left Behind (NCLB).Under NCLB (PL 107-110), states and districts are required to report not just overall achievement but achievement by student subgroups, or demographic groups. The purpose of such reporting is to draw attention to historically underserved groups of students so that the original intent of the law is upheld. Students were selected to represent demographic characteristics of students across the entire Consortium rather than a particular state. As such, the representative sample of over 400,000 students were carefully selected to represent the consortium according to:
Gender Race/ethnicity Special program enrollment (English Language Learner, Section 504,
Individual Education Program, Economically Disadvantaged)
Projections of student results from the Field Test are valid only for the Consortium as a whole and cannot be interpreted on a state-by-state basis. Therefore, valid state-level projections are not available. Publishing individual state projections from the Field Test could create incorrect conclusions and would not be a responsible use of these data. States will have results for their student populations once the operational assessment is administered.
Comparison to National TrendsWhile there are differences among demographic groups in the 2014 Smarter Balanced field test results, those differences tend to be smaller than those found in other large-scale assessment programs. The tables below show comparisons of fourth- and eighth-grade results from the Smarter Balanced field test and the most recent results for fourth and eighth grade from the National Assessment of Educational Progress (NAEP), shown in terms of the number of standard deviations (SD) each group scored above or below the total group mean.
As can be seen in the two tables below, the Smarter Balanced results parallel those of NAEP, but in nearly every instance, the size of the difference is smaller. For example, fourth grade English language learners in the Smarter Balanced sample scored about three-fourths of a standard deviation below the total group of fourth graders. However, in the NAEP sample, fourth grade ELL students scored a full standard deviation below the total group of fourth graders. Other demographic group deviations from the total group mean show similar tendencies.
2

DISAGGREGATED FIELD TEST DATABY DEMOGRAPHIC GROUP
3

DISAGGREGATED FIELD TEST DATABY DEMOGRAPHIC GROUP
Smarter Balanced Field Test Demographic Subgroup Mean Differences from Total Group (Standard Deviations Above or Below Total Group Mean)
ELA MathGrade 4 Grade 8 Grade 4 Grade 8
Male -0.12 -0.18 0.02 0.00Female 0.13 0.19 -0.02 0.00American Indian/Alaskan Native -0.57 -0.50 -0.44 -0.42Asian 0.38 0.40 0.55 0.62Black/African American -0.42 -0.43 -0.61 -0.46Hispanic/Latino -0.35 -0.30 -0.40 -0.32Native Hawaiian/Other Pacific Islander -0.38 -0.34 -0.27 -0.32White/Caucasian 0.18 0.17 0.13 0.20Multi-ethnic/Multi-racial 0.05 0.12 0.08 0.11Individualized Education Program -0.71 -0.93 -0.83 -0.80Limited English Proficient/English Language Learner -0.75 -1.01 -0.69 -0.80Economically Disadvantaged -0.33 -0.30 -0.37 -0.30
NAEP 2013 Demographic Subgroup Mean Differences from Total Group (Standard Deviations Above or Below Total Group Mean)
ELA MathGrade 4 Grade 8 Grade 4 Grade 8
Male -0.08 -0.17 0.00 0.00Female 0.08 0.17 -0.03 -0.03American Indian/Alaskan Native -0.46 -0.57 -0.44 -0.43Asian 0.41 0.47 0.50 0.65Black/African American -0.43 -0.60 -0.53 -0.59Hispanic/Latino -0.41 -0.40 -0.32 -0.35Native Hawaiian/Other Pacific Islander -0.27 -0.30 -0.18 -0.27White/Caucasian 0.27 0.27 0.24 0.24Multi-ethnic/Multi-racial 0.14 0.10 0.09 0.08Individualized Education Program -1.03 -1.20 -0.71 -0.97Limited English Proficient/English Language Learner -0.95 -1.43 -0.68 -1.05Economically Disadvantaged -0.41 -0.47 -0.35 -0.41
LegendAbsolute difference less than .25 SDAbsolute difference between .25 SD and .49 SDAbsolute difference between .50 and .74 SDAbsolute difference .75 SD or greater
4

DISAGGREGATED FIELD TEST DATABY DEMOGRAPHIC GROUP
Achievement Levels: Initial Indicators of Student PerformanceTo create the achievement levels, Smarter Balanced organized an unprecedented level of educator and public input involving thousands of interested constituents. A diverse cross section of educators—including experts and specialists in English language learners and special education—helped ensure that the achievement levels are fair and appropriate for all students using a rigorous process known as the Bookmark Procedure. Achievement level setting panelists were able to see the impact of their recommended cut scores on student achievement for all students in a given grade as well as for students in each demographic group. The achievement levels will help teachers and parents understand student performance and needs for support. However, achievement levels should serve as a starting point for discussion about the performance of individual students and of groups of students. There are other measures that students, teachers, and parents can also use to help evaluate the academic progress of students and schools, such as scale scores, growth models, and portfolios of student work.
Opportunities for Additional InformationConsistent with state’s data privacy agreements with Smarter Balanced, additional information will be collected regarding student demographics. This will allow for deeper analysis of student achievement in the coming years. Moving forward, Smarter Balanced will carefully examine opportunities to help states report on other student demographic information, both in terms of score results from the summative assessment and, when possible, other evaluation studies of the assessment system, tools, and supports. Smarter Balanced will continue to work with its member states to report assessment results that will help educators and stakeholders support student growth and improve achievement, regardless of language, disability, or other demographic characteristics.
5

DISAGGREGATED FIELD TEST DATABY DEMOGRAPHIC GROUP
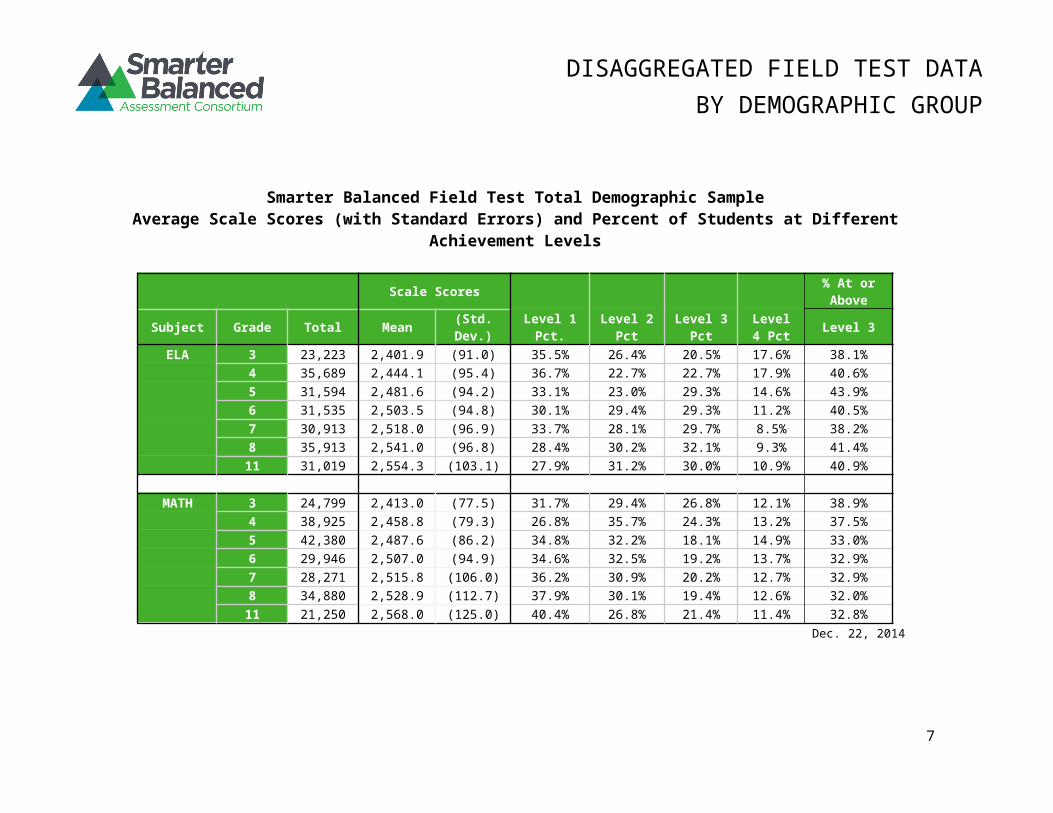
Smarter Balanced Field Test Total Demographic SampleAverage Scale Scores (with Standard Errors) and Percent of Students at Different
Achievement Levels
Scale Scores % At or Above
Subject Grade Total Mean (Std. Dev.)
Level 1 Pct.
Level 2 Pct
Level 3 Pct
Level 4 Pct Level 3
ELA 3 23,223 2,401.9 (91.0) 35.5% 26.4% 20.5% 17.6% 38.1%4 35,689 2,444.1 (95.4) 36.7% 22.7% 22.7% 17.9% 40.6%5 31,594 2,481.6 (94.2) 33.1% 23.0% 29.3% 14.6% 43.9%6 31,535 2,503.5 (94.8) 30.1% 29.4% 29.3% 11.2% 40.5%7 30,913 2,518.0 (96.9) 33.7% 28.1% 29.7% 8.5% 38.2%8 35,913 2,541.0 (96.8) 28.4% 30.2% 32.1% 9.3% 41.4%11 31,019 2,554.3 (103.1) 27.9% 31.2% 30.0% 10.9% 40.9%
MATH 3 24,799 2,413.0 (77.5) 31.7% 29.4% 26.8% 12.1% 38.9%4 38,925 2,458.8 (79.3) 26.8% 35.7% 24.3% 13.2% 37.5%5 42,380 2,487.6 (86.2) 34.8% 32.2% 18.1% 14.9% 33.0%6 29,946 2,507.0 (94.9) 34.6% 32.5% 19.2% 13.7% 32.9%7 28,271 2,515.8 (106.0) 36.2% 30.9% 20.2% 12.7% 32.9%8 34,880 2,528.9 (112.7) 37.9% 30.1% 19.4% 12.6% 32.0%11 21,250 2,568.0 (125.0) 40.4% 26.8% 21.4% 11.4% 32.8%
Dec. 22, 2014
6
DISAGGREGATED FIELD TEST DATABY DEMOGRAPHIC GROUP
Smarter Balanced Grade-level Field Test Demographic SampleAverage Scale Scores (with Standard Errors) and Percent of Students at Different
Achievement Levels
ELA Grade 3 Total Scale Scores
Level 1 Pct
Level 2 Pct
Level 3 Pct
Level 4 Pct
% At or Above
Sub Group N Pct Mean (Std. Dev.) Level 3
ALL 23,223
100.0
2,401.9 (91.0) 35.5% 26.4% 20.5% 17.6
% 38.1%
Male 11,851 51.0 2,393.
9 (90.4) 38.7% 26.4% 19.6% 15.3% 34.9%
Female 11,372 49.0 2,410.
2 (90.9) 32.1% 26.4% 21.4% 20.1% 41.5%
American Indian/Alaskan Native 404 1.7 2,363.4 (81.2) 55.2% 23.8% 13.8% 7.2% 21.0%
Asian 1,860 8.0 2,439.7 (92.7) 22.4% 21.5% 24.6% 31.5
% 56.1%
Black/African American 1,595 6.9 2,364.1 (86.7) 51.9% 26.3% 14.1% 7.7% 21.8%
Hispanic/Latino 7,411 31.9 2,371.2 (84.1) 48.5% 27.7% 15.6% 8.2% 23.8%
Native Hawaiian/Other Pacific Islander 703 3.0 2,378.7 (87.1) 45.9% 27.4% 16.5% 10.2
% 26.7%
White/Caucasian 10,914 47.0 2,422.
5 (87.4) 26.0% 26.4% 24.3% 23.3% 47.6%
Multi-ethnic/Multi-racial 1,055 4.5 2,408.8 (91.4) 34.3% 25.5% 20.5% 19.7
% 40.2%
Individualized Education Program 2,176 9.4 2,342.1 (89.1) 64.4% 19.8% 9.8% 6.0% 15.8%
Limited English Proficient/English Language Learner 4,356 18.8 2,348.
3 (78.0) 60.2% 26.2% 10.1% 3.5% 13.6%
Section 504 176 0.8 2,380.0 (84.0) 44.3% 28.4% 18.8% 8.5% 27.3%
7

DISAGGREGATED FIELD TEST DATABY DEMOGRAPHIC GROUP
Economically Disadvantaged 12,554 54.1 2,372.
4 (84.0) 47.8% 27.8% 16.0% 8.4% 24.4% Dec. 22, 2014
8

DISAGGREGATED FIELD TEST DATABY DEMOGRAPHIC GROUP
Smarter Balanced Grade-level Field Test Demographic SampleAverage Scale Scores (with Standard Errors) and Percent of Students at Different
Achievement Levels
ELA Grade 4 Total Scale Scores
Level 1 Pct
Level 2 Pct
Level 3 Pct
Level 4 Pct
% At or Above
Sub Group N Pct Mean (Std. Dev.) Level 3
ALL 35,689
100
2,444.1 (95.4) 36.7% 22.6% 22.7% 17.9% 40.6%
Male 18,372
51.5
2,432.2 (95.9) 41.6% 22.7% 21.0% 14.7% 35.7%
Female 17,317
48.5
2,456.7 (93.3) 31.6% 22.6% 24.4% 21.4% 45.8%
American Indian/Alaskan Native 1,158 3.2 2,389.8 (90.9) 60.4% 21.0% 13.9% 4.7% 18.6%
Asian 2,653 7.4 2,480.5 (94.1) 23.3% 19.3% 27.1% 30.3% 57.4%
Black/African American 2,493 7.0 2,404.1 (91.1) 54.5% 21.3% 17.2% 7.0% 24.2%
Hispanic/Latino 9,579 26.8
2,410.7 (90.7) 51.1% 23.7% 16.6% 8.6% 25.2%
Native Hawaiian/Other Pacific Islander 542 1.5 2,407.8 (97.0) 51.5% 22.9% 16.2% 9.4% 25.6%
White/Caucasian 19,905
55.8
2,461.3 (91.0) 29.2% 22.8% 25.7% 22.3% 48.0%
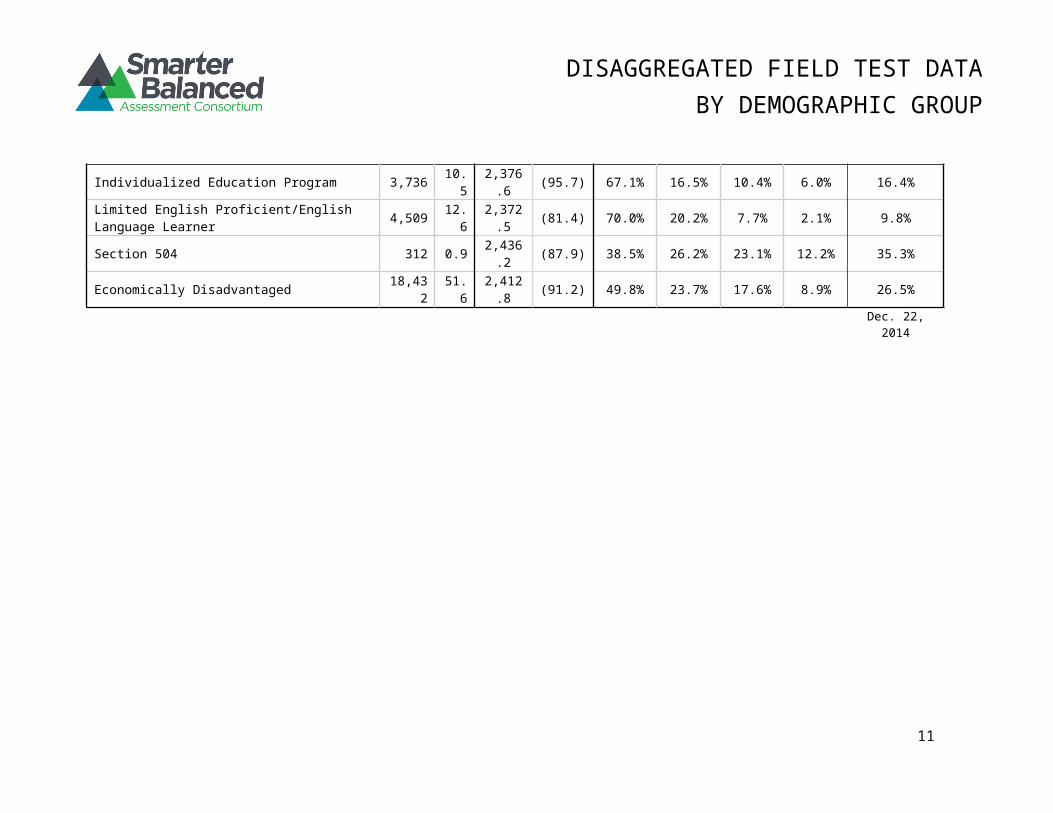
Multi-ethnic/Multi-racial 1,548 4.3 2,448.7 (94.4) 34.3% 23.4% 24.1% 18.2% 42.3%
Individualized Education Program 3,736 10.5
2,376.6 (95.7) 67.1% 16.5% 10.4% 6.0% 16.4%
Limited English Proficient/English Language Learner 4,509 12.
62,372.
5 (81.4) 70.0% 20.2% 7.7% 2.1% 9.8%
Section 504 312 0.9 2,436.2 (87.9) 38.5% 26.2% 23.1% 12.2% 35.3%
9

DISAGGREGATED FIELD TEST DATABY DEMOGRAPHIC GROUP
Economically Disadvantaged 18,432
51.6
2,412.8 (91.2) 49.8% 23.7% 17.6% 8.9% 26.5%
Dec. 22, 2014
10
DISAGGREGATED FIELD TEST DATABY DEMOGRAPHIC GROUP
Smarter Balanced Grade-level Field Test Demographic SampleAverage Scale Scores (with Standard Errors) and Percent of Students at Different
Achievement Levels
ELA Grade 5 Total Scale Scores
Level 1 Pct
Level 2 Pct
Level 3 Pct
Level 4 Pct
% At or Above
Sub Group N Pct Mean (Std. Dev.) Level 3
ALL 31,594
100
2,481.6
(94.2) 33.1% 23.0% 29.2% 14.6% 43.8%
Male 16,138
51.1
2,469.3 (94.0) 38.0% 23.4% 27.1% 11.5% 38.6%
Female 15,456
48.9
2,494.5 (92.7) 28.0% 22.6% 31.6% 17.8% 49.4%
American Indian/Alaskan Native 932 2.9 2,432.0 (93.6) 54.2% 23.3% 16.5% 6.0% 22.5%
Asian 2,289 7.2 2,515.4 (95.4) 22.2% 18.2% 34.0% 25.6% 59.6%
Black/African American 2,483 7.9 2,445.7 (89.4) 49.3% 23.2% 20.7% 6.8% 27.5%
Hispanic/Latino 8,909 28.2
2,447.2 (90.2) 47.0% 25.0% 21.2% 6.8% 28.0%
Native Hawaiian/Other Pacific Islander 517 1.6 2,453.8 (92.6) 44.5% 25.5% 21.7% 8.3% 30.0%
White/Caucasian 19,438
61.5
2,493.6 (91.7) 27.9% 22.7% 32.3% 17.1% 49.4%
Multi-ethnic/Multi-racial 1,289 4.1 2,483.0 (91.6) 33.4% 22.1% 30.1% 14.4% 44.5%
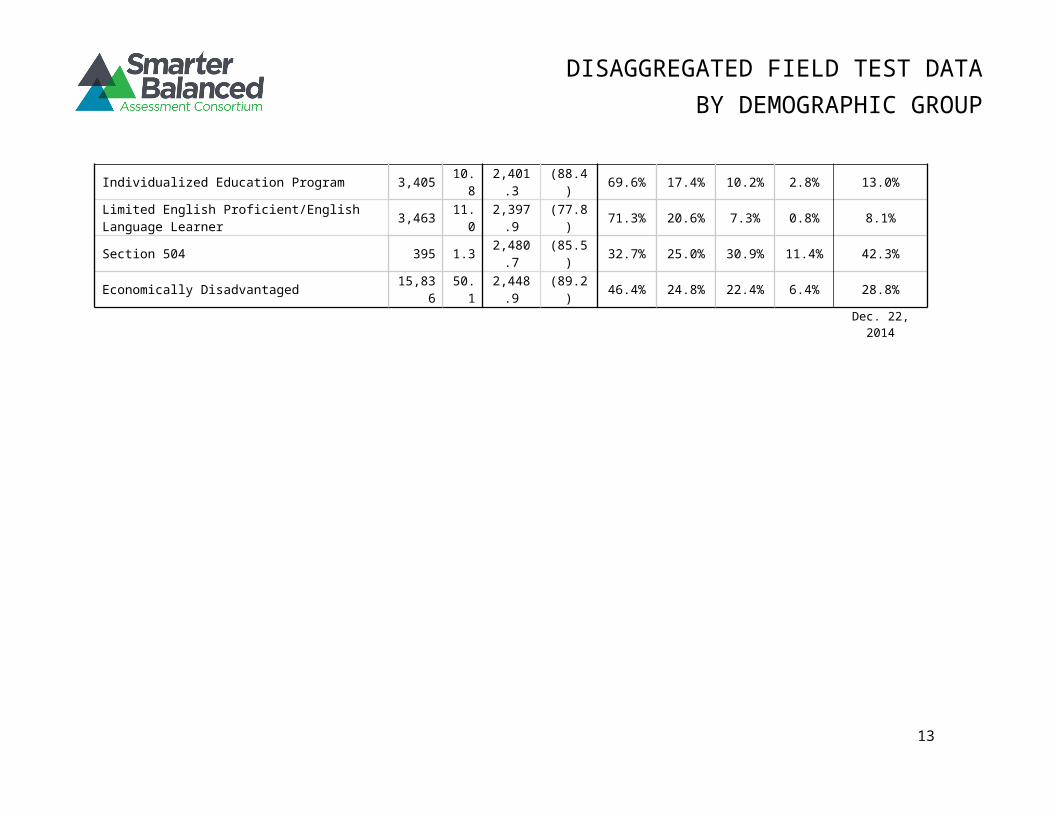
Individualized Education Program 3,405 10.8
2,401.3 (88.4) 69.6% 17.4% 10.2% 2.8% 13.0%
Limited English Proficient/English Language Learner 3,463 11.
02,397.
9 (77.8) 71.3% 20.6% 7.3% 0.8% 8.1%
Section 504 395 1.3 2,480.7 (85.5) 32.7% 25.0% 30.9% 11.4% 42.3%
11

DISAGGREGATED FIELD TEST DATABY DEMOGRAPHIC GROUP
Economically Disadvantaged 15,836
50.1
2,448.9 (89.2) 46.4% 24.8% 22.4% 6.4% 28.8%
Dec. 22, 2014
12
DISAGGREGATED FIELD TEST DATABY DEMOGRAPHIC GROUP
Smarter Balanced Grade-level Field Test Demographic SampleAverage Scale Scores (with Standard Errors) and Percent of Students at Different
Achievement Levels
ELA Grade 6 Total Scale Scores
Level 1 Pct
Level 2 Pct
Level 3 Pct
Level 4 Pct
% At or Above
Sub Group N Pct Mean (Std. Dev.) Level 3
ALL 31,535
100
2,503.5
(94.8) 30.1% 29.3% 29.3% 11.2% 40.5%
Male 16,101
51.1
2,490.7 (94.7) 34.8% 29.8% 26.9% 8.5% 35.4%
Female 15,434
48.9
2,516.9 (93.1) 25.3% 28.8% 31.8% 14.1% 45.9%
American Indian/Alaskan Native 906 2.9 2,463.6 (88.6) 46.4% 31.0% 18.4% 4.2% 22.6%
Asian 2,300 7.3 2,544.8 (95.8) 16.7% 23.6% 36.4% 23.3% 59.7%
Black/African American 2,158 6.8 2,465.2 (95.5) 45.5% 29.8% 19.1% 5.6% 24.7%
Hispanic/Latino 8,845 28.0
2,471.2 (89.0) 42.3% 31.9% 21.5% 4.3% 25.8%
Native Hawaiian/Other Pacific Islander 371 1.2 2,468.6 (95.6) 43.4% 29.4% 23.2% 4.0% 27.2%
White/Caucasian 17,335
55.0
2,520.0 (90.5) 23.4% 28.9% 33.9% 13.8% 47.7%
Multi-ethnic/Multi-racial 1,274 4.0 2,505.5 (95.8) 30.0% 28.8% 29.0% 12.2% 41.2%
Individualized Education Program 3,278 10.4
2,417.9 (87.5) 69.3% 20.8% 8.3% 1.6% 9.9%
Limited English Proficient/English Language Learner 3,058 9.7 2,414.
1 (75.0) 71.1% 24.3% 4.1% 0.5% 4.6%
13

DISAGGREGATED FIELD TEST DATABY DEMOGRAPHIC GROUP
Section 504 362 1.1 2,489.5 (85.5) 35.4% 32.3% 26.5% 5.8% 32.3%
Economically Disadvantaged 15,977
50.7
2,473.2 (90.6) 41.7% 31.3% 21.9% 5.1% 27.0%
Dec. 22, 2014
14

DISAGGREGATED FIELD TEST DATABY DEMOGRAPHIC GROUP
Smarter Balanced Grade-level Field Test Demographic SampleAverage Scale Scores (with Standard Errors) and Percent of Students at Different
Achievement Levels
ELA Grade 7 Total Scale ScoresLevel 1 Pct
Level 2 Pct
Level 3 Pct
Level 4 Pct
% At or Above
Sub Group N Pct Mean (Std. Dev.) Level 3
ALL 30,913 100 2,518
.0(96.9
)33.7
%28.2
%29.7
% 8.5% 38.2%
Male 15,812
51.2
2,501.9 (97.5) 40.1
%28.4
%25.2
% 6.3% 31.5%
Female 15,101
48.8
2,534.9 (93.2) 26.9
%28.0
%34.3
%10.8
% 45.1%
American Indian/Alaskan Native 526 1.7 2,486.4 (89.1) 43.0
%34.6
%20.1
% 2.3% 22.4%
Asian 2,904 9.4 2,568.2 (96.3) 17.5
%21.1
%40.8
%20.6
% 61.4%
Black/African American 1,582 5.1 2,479.3 (92.0) 49.7
%27.8
%19.4
% 3.1% 22.5%
Hispanic/Latino 13,040
42.2
2,488.9 (91.8) 44.7
%29.9
%21.7
% 3.7% 25.4%
Native Hawaiian/Other Pacific Islander 254 0.8 2,482.1
(102.5)
49.6%
24.4%
21.7% 4.3% 26.0%
White/Caucasian 12,537
40.6
2,540.9 (91.2) 24.4
%28.0
%36.3
%11.3
% 47.6%
Multi-ethnic/Multi-racial 867 2.8 2,538.6 (93.9) 25.6
%26.9
%35.7
%11.8
% 47.5%
Individualized Education Program 2,870 9.3 2,422.4 (86.0) 76.6
%16.1
% 6.4% 0.9% 7.3%Limited English Proficient/English Language Learner 3,818 12.
42,423.
5 (76.0) 77.7%
18.4% 3.7% 0.2% 3.9%
Section 504 299 1.0 2,522.6 (91.3) 33.4
%27.1
%31.1
% 8.4% 39.5%
15

DISAGGREGATED FIELD TEST DATABY DEMOGRAPHIC GROUP
Economically Disadvantaged 17,348
56.1
2,490.5 (92.6) 44.4
%29.5
%22.1
% 4.0% 26.1%Dec. 22,
2014
16

DISAGGREGATED FIELD TEST DATABY DEMOGRAPHIC GROUP
Smarter Balanced Grade-level Field Test Demographic SampleAverage Scale Scores (with Standard Errors) and Percent of Students at Different
Achievement Levels
ELA Grade 8 Total Scale Scores
Level 1 Pct
Level 2 Pct
Level 3 Pct
Level 4 Pct
% At or Above
Sub Group N Pct Mean (Std. Dev.) Level 3
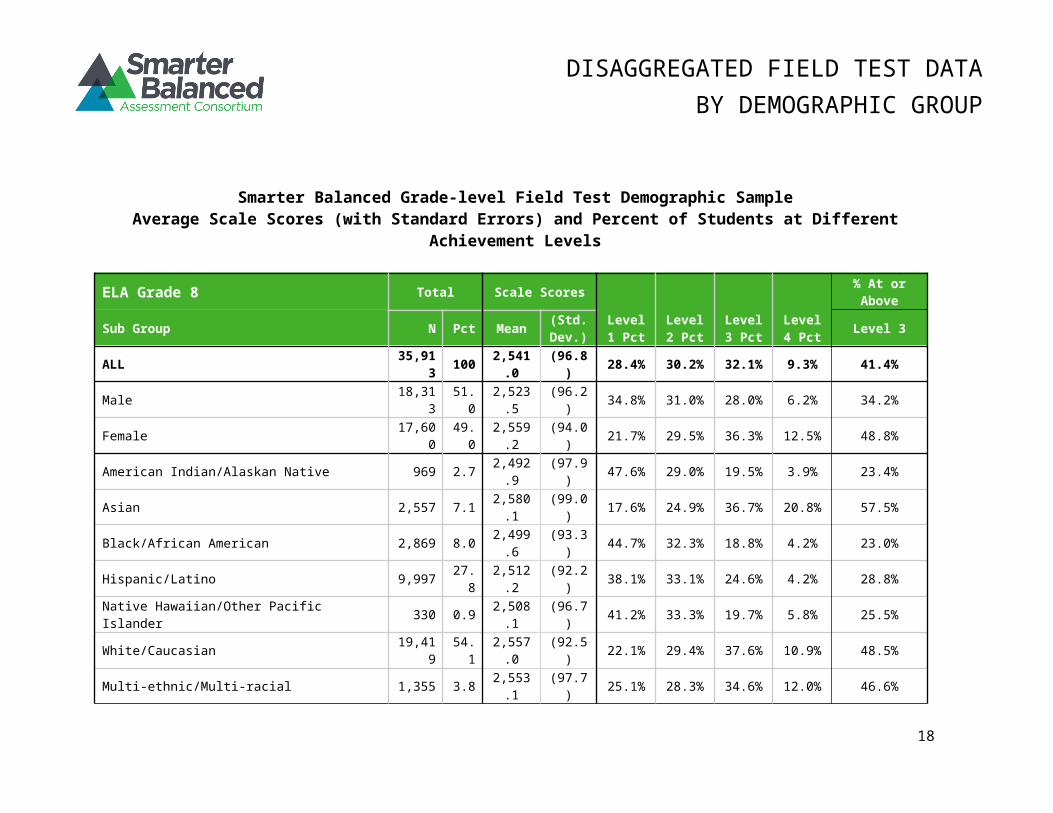
ALL 35,913
100
2,541.0
(96.8) 28.4% 30.2% 32.1% 9.3% 41.4%
Male 18,313
51.0
2,523.5 (96.2) 34.8% 31.0% 28.0% 6.2% 34.2%
Female 17,600
49.0
2,559.2 (94.0) 21.7% 29.5% 36.3% 12.5% 48.8%
American Indian/Alaskan Native 969 2.7 2,492.9 (97.9) 47.6% 29.0% 19.5% 3.9% 23.4%
Asian 2,557 7.1 2,580.1 (99.0) 17.6% 24.9% 36.7% 20.8% 57.5%
Black/African American 2,869 8.0 2,499.6 (93.3) 44.7% 32.3% 18.8% 4.2% 23.0%
Hispanic/Latino 9,997 27.8
2,512.2 (92.2) 38.1% 33.1% 24.6% 4.2% 28.8%
Native Hawaiian/Other Pacific Islander 330 0.9 2,508.1 (96.7) 41.2% 33.3% 19.7% 5.8% 25.5%
White/Caucasian 19,419
54.1
2,557.0 (92.5) 22.1% 29.4% 37.6% 10.9% 48.5%
Multi-ethnic/Multi-racial 1,355 3.8 2,553.1 (97.7) 25.1% 28.3% 34.6% 12.0% 46.6%
Individualized Education Program 3,338 9.3 2,450.7 (84.4) 67.7% 23.8% 7.6% 0.9% 8.5%
Limited English Proficient/English Language Learner 2,750 7.7 2,443.
4 (73.8) 72.0% 23.2% 4.6% 0.2% 4.8%
Section 504 444 1.2 2,539.4 (92.8) 28.4% 28.8% 34.9% 7.9% 42.8%
17
DISAGGREGATED FIELD TEST DATABY DEMOGRAPHIC GROUP
Economically Disadvantaged 17,525
48.8
2,512.0 (93.5) 38.7% 32.6% 24.1% 4.6% 28.7%
Dec. 22, 2014
18

DISAGGREGATED FIELD TEST DATABY DEMOGRAPHIC GROUP
Smarter Balanced Grade-level Field Test Demographic SampleAverage Scale Scores (with Standard Errors) and Percent of Students at Different
Achievement Levels
ELA Grade 11 Total Scale ScoresLevel 1 Pct
Level 2 Pct
Level 3 Pct
Level 4 Pct
% At or Above
Sub Group N Pct Mean (Std. Dev.) Level 3
ALL 31,019 100 2,554
.3(103.
1)27.9
%31.2
%30.0
%10.9
% 40.9%
Male 15,445
49.8
2,537.0
(104.1)
34.3%
30.9%
26.4% 8.4% 34.8%
Female 15,574
50.2
2,571.5 (99.2) 21.6
%31.4
%33.5
%13.5% 47.0%
American Indian/Alaskan Native 777 2.5 2,526.3 (92.8) 36.6
%36.8
%22.5
% 4.1% 26.6%
Asian 2,344 7.6 2,585.6
(108.9)
20.3%
25.6%
34.1%
20.0% 54.1%
Black/African American 2,552 8.2 2,503.4 (94.3) 46.9
%31.9
%17.6
% 3.6% 21.2%
Hispanic/Latino 10,041
32.4
2,533.8 (99.0) 33.7
%33.9
%26.0
% 6.4% 32.4%
Native Hawaiian/Other Pacific Islander 195 0.6 2,530.0
(102.7)
38.5%
28.7%
26.1% 6.7% 32.8%
White/Caucasian 16,020
51.6
2,567.1
(102.2)
23.8%
30.0%
32.9%
13.3% 46.2%
Multi-ethnic/Multi-racial 889 2.9 2,563.8
(103.6)
24.6%
30.3%
33.1%
12.0% 45.1%
Individualized Education Program 2,084 6.7 2,460.2 (89.5) 66.5
%24.5
% 7.6% 1.4% 9.0%Limited English Proficient/English Language Learner 1,767 5.7 2,451.
0 (82.3) 71.0%
23.3% 5.1% 0.6% 5.7%
Section 504 366 1.2 2,544.1
(102.6)
30.6%
33.3%
26.8% 9.3% 36.1%
19

DISAGGREGATED FIELD TEST DATABY DEMOGRAPHIC GROUP
Economically Disadvantaged 13,962
45.0
2,533.2
(100.7)
34.6%
32.8%
25.8% 6.8% 32.6%
Dec. 22, 2014
20

DISAGGREGATED FIELD TEST DATABY DEMOGRAPHIC GROUP
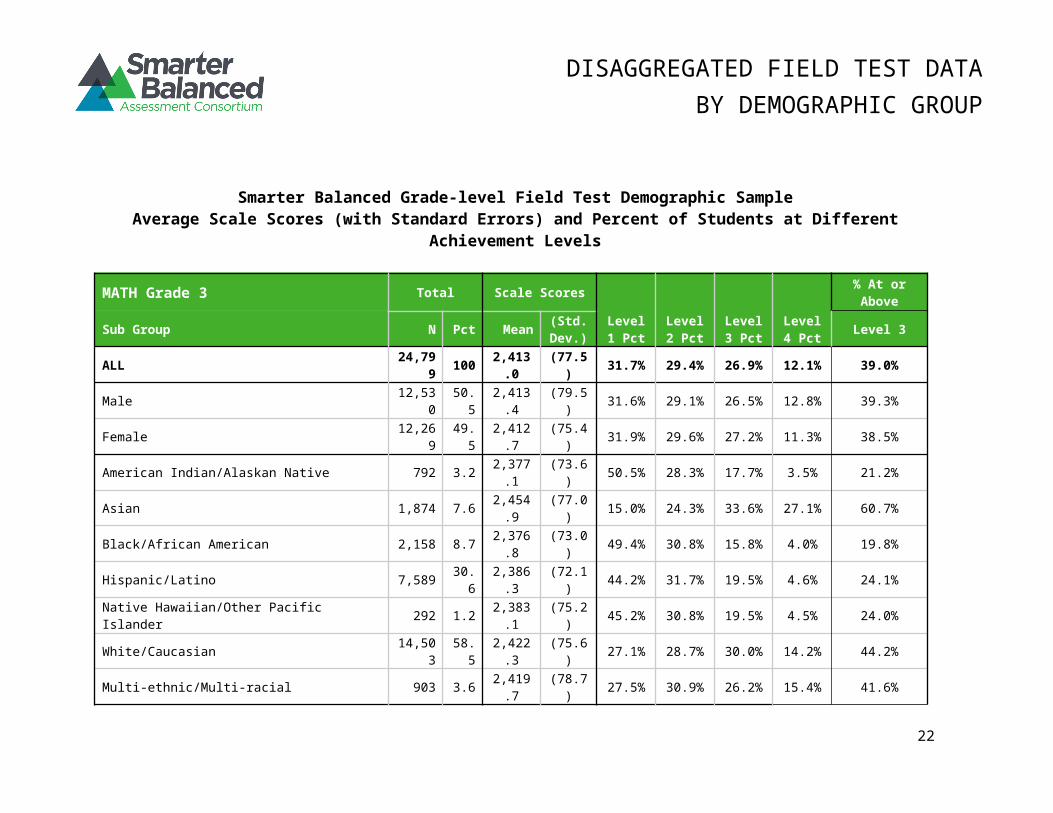
Smarter Balanced Grade-level Field Test Demographic SampleAverage Scale Scores (with Standard Errors) and Percent of Students at Different
Achievement Levels
MATH Grade 3 Total Scale Scores
Level 1 Pct
Level 2 Pct
Level 3 Pct
Level 4 Pct
% At or Above
Sub Group N Pct Mean (Std. Dev.) Level 3
ALL 24,799
100
2,413.0
(77.5) 31.7% 29.4% 26.9% 12.1% 39.0%
Male 12,530
50.5
2,413.4 (79.5) 31.6% 29.1% 26.5% 12.8% 39.3%
Female 12,269
49.5
2,412.7 (75.4) 31.9% 29.6% 27.2% 11.3% 38.5%
American Indian/Alaskan Native 792 3.2 2,377.1 (73.6) 50.5% 28.3% 17.7% 3.5% 21.2%
Asian 1,874 7.6 2,454.9 (77.0) 15.0% 24.3% 33.6% 27.1% 60.7%
Black/African American 2,158 8.7 2,376.8 (73.0) 49.4% 30.8% 15.8% 4.0% 19.8%
Hispanic/Latino 7,589 30.6
2,386.3 (72.1) 44.2% 31.7% 19.5% 4.6% 24.1%
Native Hawaiian/Other Pacific Islander 292 1.2 2,383.1 (75.2) 45.2% 30.8% 19.5% 4.5% 24.0%
White/Caucasian 14,503
58.5
2,422.3 (75.6) 27.1% 28.7% 30.0% 14.2% 44.2%
Multi-ethnic/Multi-racial 903 3.6 2,419.7 (78.7) 27.5% 30.9% 26.2% 15.4% 41.6%
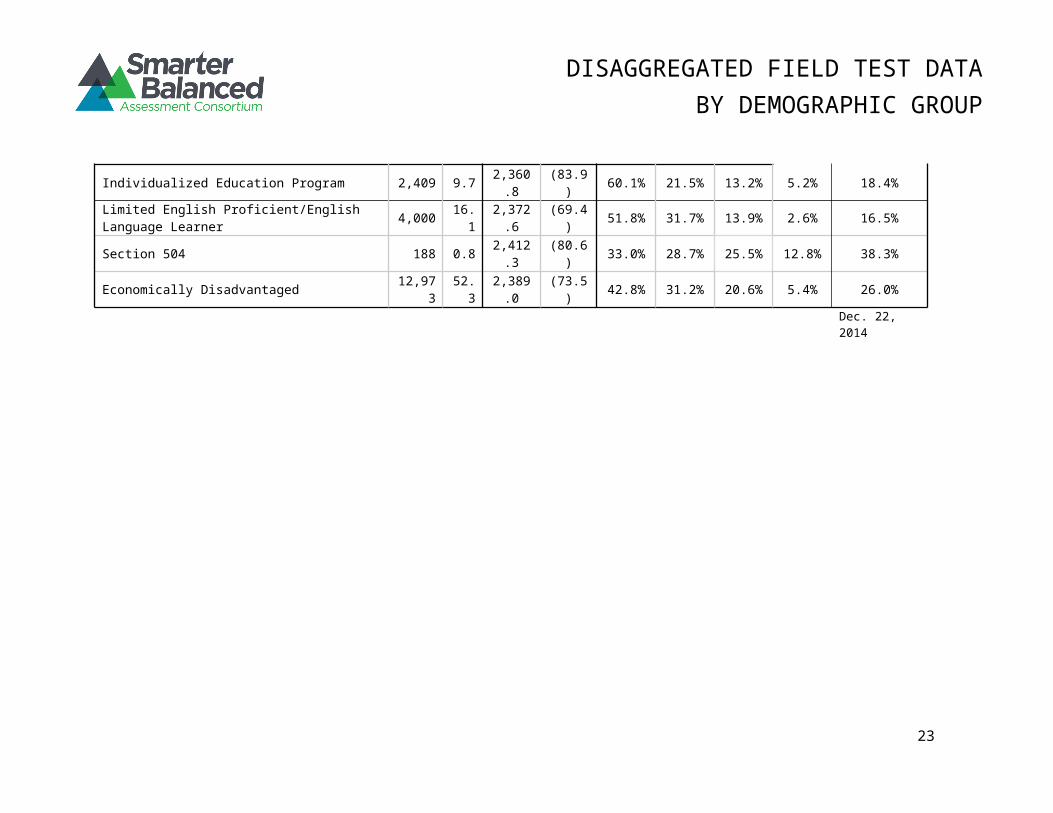
Individualized Education Program 2,409 9.7 2,360.8 (83.9) 60.1% 21.5% 13.2% 5.2% 18.4%
Limited English Proficient/English Language Learner 4,000 16.
12,372.
6 (69.4) 51.8% 31.7% 13.9% 2.6% 16.5%
Section 504 188 0.8 2,412.3 (80.6) 33.0% 28.7% 25.5% 12.8% 38.3%
21
DISAGGREGATED FIELD TEST DATABY DEMOGRAPHIC GROUP
Economically Disadvantaged 12,973
52.3
2,389.0 (73.5) 42.8% 31.2% 20.6% 5.4% 26.0%
Dec. 22, 2014
22
DISAGGREGATED FIELD TEST DATABY DEMOGRAPHIC GROUP
Smarter Balanced Grade-level Field Test Demographic SampleAverage Scale Scores (with Standard Errors) and Percent of Students at Different
Achievement Levels
MATH Grade 4 Total Scale Scores
Level 1 Pct
Level 2 Pct
Level 3 Pct
Level 4 Pct
% At or Above
Sub Group N Pct Mean (Std. Dev.) Level 3
ALL 38,925
100
2,458.8
(79.3)
26.8%
35.8%
24.3%
13.2% 37.5%
Male 19,954
51.3
2,460.3 (81.8) 26.8% 34.2% 24.4% 14.6% 39.0%
Female 18,971
48.7
2,457.2 (76.5) 26.7% 37.4% 24.1% 11.8% 35.9%
American Indian/Alaskan Native 1,563 4.0 2,424.2 (72.7) 42.6% 38.2% 14.1% 5.1% 19.2%
Asian 2,444 6.3 2,502.8 (81.1) 13.1% 27.8% 28.1% 31.0% 59.1%
Black/African American 4,137 10.6
2,410.3 (70.8) 50.1% 35.4% 11.8% 2.7% 14.5%
Hispanic/Latino 10,467
26.9
2,427.0 (71.9) 40.5% 38.8% 16.1% 4.6% 20.7%
Native Hawaiian/Other Pacific Islander 331 0.9 2,437.4 (77.6) 34.4% 38.4% 19.9% 7.3% 27.2%
White/Caucasian 25,697
66.0
2,469.0 (76.1) 21.5% 35.9% 27.6% 15.0% 42.6%
Multi-ethnic/Multi-racial 1,857 4.8 2,464.8 (77.1) 23.7% 36.8% 24.5% 15.0% 39.5%
Individualized Education Program 4,219 10.8
2,393.0 (79.7) 60.9% 26.2% 9.7% 3.2% 12.9%
Limited English Proficient/English Language Learner 4,374 11.
22,404.
2 (66.2) 53.7% 36.1% 8.4% 1.8% 10.2%
23

DISAGGREGATED FIELD TEST DATABY DEMOGRAPHIC GROUP
Section 504 406 1.0 2,471.1 (77.2) 21.7% 36.9% 25.4% 16.0% 41.4%
Economically Disadvantaged 19,774
50.8
2,429.6 (73.3) 39.5% 38.4% 16.7% 5.4% 22.1%
Dec. 22, 2014
24

DISAGGREGATED FIELD TEST DATABY DEMOGRAPHIC GROUP
Smarter Balanced Grade-level Field Test Demographic SampleAverage Scale Scores (with Standard Errors) and Percent of Students at Different
Achievement Levels
MATH Grade 5 Total Scale Scores
Level 1 Pct
Level 2 Pct
Level 3 Pct
Level 4 Pct
% At or Above
Sub Group N Pct Mean(Std
. Dev.
)Level 3
ALL 42,380 100 2,487
.6(86.2)
34.8%
32.2%
18.1%
14.9% 33.0%
Male 21,600
51.0
2,487.8
(89.9)
35.3%
30.5%
18.1%
16.1% 34.2%
Female 20,780
49.0
2,487.4
(82.3)
34.2%
34.0%
18.1%
13.7% 31.8%
American Indian/Alaskan Native 1,395 3.3 2,446.1
(80.2)
55.6%
29.2%
10.5% 4.7% 15.2%
Asian 2,779 6.6 2,535.9
(88.4)
18.0%
25.4%
23.1%
33.5% 56.6%
Black/African American 3,602 8.5 2,436.8
(80.5)
59.7%
27.5% 9.2% 3.6% 12.8%
Hispanic/Latino 10,065
23.7
2,451.6
(80.2)
52.0%
31.2%
11.3% 5.5% 16.8%
Native Hawaiian/Other Pacific Islander 395 0.9 2,462.2
(83.3)
48.6%
29.9%
13.9% 7.6% 21.5%
White/Caucasian 29,256
69.0
2,495.8
(82.8)
30.1%
33.5%
20.2%
16.2% 36.4%
Multi-ethnic/Multi-racial 2,127 5.0 2,491.9
(85.8)
32.6%
33.1%
18.6%
15.7% 34.3%
Individualized Education Program 4,671 11.0
2,412.5
(84.9)
72.3%
18.2% 5.7% 3.8% 9.5%
Limited English Proficient/English Language 3,666 8.7 2,416. (73. 71.0 22.8 4.6% 1.6% 6.2%
25

DISAGGREGATED FIELD TEST DATABY DEMOGRAPHIC GROUP
Learner 7 0) % %Section 504 564 1.3 2,487.
0(82.3)
35.1%
35.1%
16.1%
13.7% 29.8%
Economically Disadvantaged 20,393
48.1
2,456.1
(80.6)
49.2%
32.1%
12.4% 6.3% 18.7%
Dec. 22, 2014
26

DISAGGREGATED FIELD TEST DATABY DEMOGRAPHIC GROUP
Smarter Balanced Grade-level Field Test Demographic SampleAverage Scale Scores (with Standard Errors) and Percent of Students at Different
Achievement Levels
MATH Grade 6 Total Scale Scores
Level 1 Pct
Level 2 Pct
Level 3 Pct
Level 4 Pct
% At or Above
Sub Group N Pct Mean(Std
. Dev.
)Level 3
ALL 29,946 100 2,507
.0(94.9)
34.6%
32.5%
19.2%
13.7% 32.9%
Male 15,207 50.8 2,507.
3(97.1)
35.1%
31.3%
19.1%
14.5% 33.6%
Female 14,739 49.2 2,506.
8(92.6)
34.1%
33.6%
19.5%
12.8% 32.3%
American Indian/Alaskan Native 855 2.9 2,467.3
(91.0)
52.4%
29.1%
13.4% 5.1% 18.5%
Asian 1,918 6.4 2,558.4
(94.8)
18.3%
25.5%
25.0%
31.2% 56.2%
Black/African American 2,061 6.9 2,460.4
(90.3)
54.1%
30.6%
11.3% 4.0% 15.3%
Hispanic/Latino 7,013 23.4 2,473.1
(89.6)
48.6%
32.3%
13.5% 5.6% 19.1%
Native Hawaiian/Other Pacific Islander 264 0.9 2,489.1
(89.5)
41.7%
33.3%
17.4% 7.6% 25.0%
White/Caucasian 19,032 63.6 2,517.
5(91.5)
29.8%
33.6%
21.3%
15.3% 36.6%
Multi-ethnic/Multi-racial 1,383 4.6 2,511.1
(95.2)
33.8%
31.0%
19.7%
15.5% 35.2%
Individualized Education Program 2,808 9.4 2,432.7
(93.6)
67.7%
22.6% 6.6% 3.1% 9.7%
Limited English Proficient/English Language 2,010 6.7 2,427. (81. 71.9 22.9 3.7% 1.5% 5.2%
27

DISAGGREGATED FIELD TEST DATABY DEMOGRAPHIC GROUP
Learner 1 0) % %Section 504 437 1.5 2,501.
6(96.2)
38.7%
31.6%
15.7%
14.0% 29.7%
Economically Disadvantaged 13,562 45.3 2,475.
4(88.9)
47.6%
32.8%
13.7% 5.9% 19.6%
Dec. 22, 2014
28

DISAGGREGATED FIELD TEST DATABY DEMOGRAPHIC GROUP
Smarter Balanced Grade-level Field Test Demographic SampleAverage Scale Scores (with Standard Errors) and Percent of Students at Different
Achievement Levels
MATH Grade 7 Total Scale Scores
Level 1 Pct
Level 2 Pct
Level 3 Pct
Level 4 Pct
% At or Above
Sub Group N Pct Mean (Std. Dev.) Level 3
ALL 28,271 100 2,515.
8(106.
0)36.2
%30.9
%20.2
%12.7
% 32.9%Male 14,268 50.
52,515.
9(108.0
)36.5
%30.2
%20.0
% 13.3% 33.3%Female 14,003 49.
52,515.
6(104.1
)36.0
%31.6
%20.2
% 12.2% 32.4%American Indian/Alaskan Native 660 2.3 2,476.
2 (98.0) 51.1%
32.7%
10.7% 5.5% 16.2%
Asian 2,703 9.6 2,577.3
(105.7)
18.1%
23.8%
26.4% 31.7% 58.1%
Black/African American 1,602 5.7 2,466.7 (98.1) 55.2
%29.9
%11.2
% 3.7% 14.9%Hispanic/Latino 10,095 35.
72,477.
0 (97.6) 50.2%
32.3%
13.0% 4.5% 17.5%
Native Hawaiian/Other Pacific Islander 391 1.4 2,494.3 (99.4) 41.9
%35.3
%16.9
% 5.9% 22.8%White/Caucasian 12,776 45.
22,539.
8 (99.6) 26.5%
31.3%
25.9% 16.3% 42.2%
Multi-ethnic/Multi-racial 922 3.3 2,526.2
(106.2)
34.2%
30.6%
18.7% 16.5% 35.2%
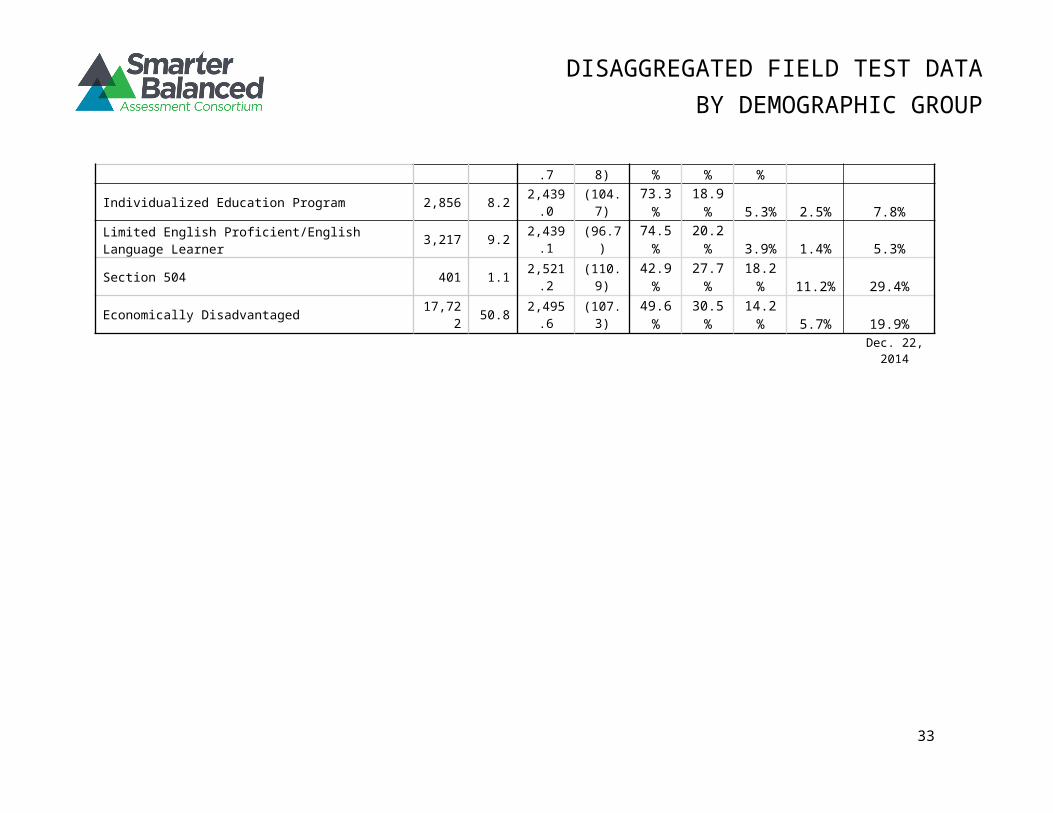
Individualized Education Program 2,469 8.7 2,429.2 (99.0) 72.1
%19.1
% 6.4% 2.4% 8.8%Limited English Proficient/English Language Learner 2,842 10.
12,426.
4 (91.7) 74.6%
19.5% 4.4% 1.5% 5.9%
Section 504 323 1.1 2,521. (104.9 35.9 31.0 20.1 13.0% 33.1%
29
DISAGGREGATED FIELD TEST DATABY DEMOGRAPHIC GROUP
7 ) % % %Economically Disadvantaged 14,592 51.
62,482.
0 (99.6) 48.5%
31.9%
14.2% 5.4% 19.6%
Dec. 22,2014
30

DISAGGREGATED FIELD TEST DATABY DEMOGRAPHIC GROUP
Smarter Balanced Grade-level Field Test Demographic SampleAverage Scale Scores (with Standard Errors) and Percent of Students at Different
Achievement Levels
MATH Grade 8 Total Scale Scores
Level 1 Pct
Level 2 Pct
Level 3 Pct
Level 4 Pct
% At or Above
Sub Group N Pct Mean (Std. Dev.) Level 3
ALL 34,880 100 2,528
.9(112.
7)37.9
%30.1
%19.4
%12.6
% 32.0%Male 17,57
5 50.4 2,528.4
(115.5)
38.5%
29.0%
19.2% 13.3% 32.5%
Female 17,305 49.6 2,529.
4(109.
8)37.3%
31.2%
19.5% 12.0% 31.5%
American Indian/Alaskan Native 595 1.7 2,481.6
(110.8)
55.8%
27.6%
10.7% 5.9% 16.6%
Asian 3,548 10.2 2,598.3
(110.4)
18.9%
22.9%
25.0% 33.2% 58.2%
Black/African American 1,934 5.5 2,477.4
(108.7)
56.8%
27.1%
11.2% 4.9% 16.1%
Hispanic/Latino 13,554 38.9 2,493.
1(105.
3)50.6%
30.8%
13.7% 4.9% 18.6%
Native Hawaiian/Other Pacific Islander 223 0.6 2,492.5
(104.7)
53.4%
26.0%
15.7% 4.9% 20.6%
White/Caucasian 14,846 42.6 2,551.
5(105.
8)28.4%
31.6%
24.3% 15.7% 40.0%
Multi-ethnic/Multi-racial 1,177 3.4 2,541.7
(111.8)
34.2%
29.9%
20.6% 15.3% 35.9%
Individualized Education Program 2,856 8.2 2,439.0
(104.7)
73.3%
18.9% 5.3% 2.5% 7.8%
Limited English Proficient/English Language Learner 3,217 9.2 2,439.
1 (96.7) 74.5%
20.2% 3.9% 1.4% 5.3%
31

DISAGGREGATED FIELD TEST DATABY DEMOGRAPHIC GROUP
Section 504 401 1.1 2,521.2
(110.9)
42.9%
27.7%
18.2% 11.2% 29.4%
Economically Disadvantaged 17,722 50.8 2,495.
6(107.
3)49.6%
30.5%
14.2% 5.7% 19.9%
Dec. 22, 2014
32
DISAGGREGATED FIELD TEST DATABY DEMOGRAPHIC GROUP
Smarter Balanced Grade-level Field Test Demographic SampleAverage Scale Scores (with Standard Errors) and Percent of Students at Different
Achievement Levels
MATH Grade 11 Total Scale Scores
Level 1 Pct
Level 2 Pct
Level 3 Pct
Level 4 Pct
% At or Above
Sub Group N Pct Mean (Std. Dev.) Level 3
ALL 21,250 100 2,568
.0(125.
0)40.4
%26.8
%21.4
%11.4
% 32.8%Male 10,518 49.
52,570.
5(128.
2)40.0
%25.9
%21.4
%12.7
% 34.1%Female 10,732 50.
52,565.
6(121.
8)40.8
%27.6
%21.4
%10.2
% 31.6%American Indian/Alaskan Native 187 0.9 2,531.
1(116.
6)55.1
%23.0
%16.0
% 5.9% 21.9%Asian 3,184 15.
02,643.
9(118.
1)18.8
%22.5
%30.8
%27.9
% 58.7%Black/African American 1,076 5.1 2,515.
1(118.
2)57.5
%25.0
%14.0
% 3.5% 17.5%Hispanic/Latino 9,637 45.
42,529.
9(115.
1)52.5
%27.6
%15.4
% 4.5% 19.9%Native Hawaiian/Other Pacific Islander 141 0.7 2,524.
6(113.
9)56.0
%25.6
%13.4
% 5.0% 18.4%White/Caucasian 6,772 31.
92,594.
0(119.
0)31.0
%27.9
%26.4
%14.7
% 41.1%Multi-ethnic/Multi-racial 472 2.2 2,583.
9(124.
4)34.7
%26.7
%25.9
%12.7
% 38.6%Individualized Education Program 1,158 5.4 2,462.
3(114.
3)75.6
%16.9
% 5.2% 2.3% 7.5%Limited English Proficient/English Language Learner 1,592 7.5 2,458.
2(105.
0)79.0
%15.3
% 4.5% 1.2% 5.7%
33

DISAGGREGATED FIELD TEST DATABY DEMOGRAPHIC GROUP
Section 504 261 1.2 2,573.0
(121.6)
36.0%
30.3%
22.6%
11.1% 33.7%
Economically Disadvantaged 11,064 52.1
2,537.9
(120.1)
49.9%
26.9%
16.9% 6.3% 23.2%
Dec. 22, 2014
34