overview - bi.go.id · and accelerated construction of infrastructure, will become increasingly...
TRANSCRIPT

Chapter 1
Overview

2
The year 2007 witnessed a remarkable achievement of the Indonesian economy most notably in key areas despite mounting external pressures. For the first time since the crisis, the economy grew at a rapid level of above 6%, with macroeconomic stability kept in check. The favorable performances were reflected in significant surplus of balance of payments, reinforcing the international reserves, exchange rate stability, strong credit expansion and inflation under controlled. Soaring international commodity prices, led by oil, and the unfolding of the subprime mortgage crisis figured prominently among the challenges confronting the Indonesian economy during the year. In the face of these multiple adversities, the Indonesian economy had appeared to show a higher level of resilience in support of economic growth.
Indonesia’s improved economic resilience has been built upon a combination of macroeconomic and sectoral policies. Monetary and fiscal policy coordination has been markedly strengthened. The Government and Bank Indonesia have been in close collaboration in the delivery of economic stimulus and safeguarding economic stability. In the monetary sector, the pursuit of prudent and consistent policies responses have contributed to keeping inflation on a medium to long-term downward trend. Fiscal sustainability has also been safeguarded through appropriate control over strategic commodity prices. The banking system has seen steady progress as reflected in a raise in the intermediary function and strengthened institutions, including the accelerated development of Sharia banking. At the sectoral level, the government has sought to improve the quality of economic growth through improvements in the investment climate, accelerated construction of infrastructure, empowerment of MSMEs and the financial sector reform.
On the external front, the Indonesian economy is expected to encounter onerous challenges arising from global economy turbulence. Accordingly, economic growth is predicted to slow down in 2008 compared to 2007. Inflation is higher than the established target, while the rupiah exchange rate is expected to remain stable. Looking ahead, the synergy in monetary and fiscal policy will become more essential to mitigate the prevailing of risks. In this regard, Bank Indonesia will continue the pursuit of a consistent monetary policy directed in containing inflation so as to support sustainable economic growth. In the banking sector, Bank Indonesia will focus on improvement of the banking intermediary function and the institutional strengthening of the banking system. At the same time, the strengthening of economic competitiveness, including improvements to the investment climate and accelerated construction of infrastructure, will become increasingly important in paving the way for higher levels of growth in a structurally more robust economy.
Chapter 1: Overview

3
The beginning of the year was marked by buoyant
public optimism over the economic outlook. As
Indonesia entered 2007, macroeconomic stability was
back on track following the oil prices shock at the end
of 2005, the impact of which prevail until mid-2006.
This optimism was underpinned by strengthening public
confidence in the management of macroeconomic
policy, supported by consistent alignment in monetary
and fiscal policies for achievement of the inflation
target and a strong commitment to fiscal sustainability.
Rising confidence in the credibility of macroeconomic
policy was accompanied by improving international
confidence in the Indonesian economy as reflected in
the upgrading of Indonesia’s sovereign credit rating and
easing of investment risk premiums.
In the second half of 2007, the Indonesian economy
faced renewed global economic challenges, including
the knock-on effects of the sub-prime mortgage crisis,
as well as high oil and other international commodity
prices. World oil prices hovering near $100 per barrel1,
prompted higher demand for foreign currency to pay
for imports and increased fiscal burden, mainly for
covering the mounting fuel subsidy. The unfolding
impact of the sub-prime mortgage crisis triggered
pessimism over the world economic outlook, prompting
global investors to pull out of perceived high-risk
assets in a flight to quality. Most affected were assets
in emerging markets, including Indonesia. This also
triggered a round of capital reversal on the domestic
financial market, with Bank Indonesia Certificate (SBI),
government securities and stocks most affected.
The global economic turmoil has in turn undermined
the foundation of Indonesia’s macroeconomic stability.
In the second half of 2007, the rupiah came under
pressure with the monthly average of Rp9,372 to the
US dollar in August 2007. To address these challenges,
the Government and Bank Indonesia have introduced
a series of measures to maintain macroeconomic
stability while sustaining the momentum for economic
growth. These macroeconomic policy actions have
been implemented in a prudent and consistent manner
so as to build public and business confidence in the
rupiah. In addition, the high yields on the domestic
financial market encouraged renewed capital inflows
into Indonesia at a time of excess liquidity in the global
financial markets.
1 Intraday WTI oil price, 20 November 2007.
Despite the temporary pressure on the exchange rate,
the rupiah exchange rate remained relatively stable.
Among the factors contributing to stability in 2007
were positive developments in domestic economic
fundamentals consistent with the achievement of
internal and external equilibrium. Foreign Exchange
(Forex) market interventions to contain exchange
rate volatility were conducted on a limited scale. This
policy was reinforced by more robust communications
and improved effectiveness in prudential regulation
and monitoring of foreign currency movements.
The exchange rate was also bolstered by the strong
performance in the balance of payments. In 2007,
the balance of payments recorded another surplus
of $12.5 billion. The current account surplus reached
$11.0 billion or 2.5% of GDP, up from $10.8 billion in
2006, driven mainly by rising non-oil and gas exports.
Despite a temporary capital reversal in Q3-2007, the
capital and financial account booked a $2.8 billion
surplus for 2007, consistent with the continued
attractiveness of rupiah investment yields. Reflecting
the strong performance in the balance of payments
was increasing accumulation of international reserves
at $56.9 billion, equivalent to 5.7 months of imports and
official debt repayments and well ahead of the end-
2006 position of $42.6 billion.
The stability of the exchange rate also contributed to
keeping CPI inflation within the target. The success in
reigning in inflation also benefited from the subdued
volatile foods prices and low inflation in administered
prices. In this regard, the government commitment
to refrain from increases in administered prices for
strategic commodities (oil-based fuels and electricity
billing rates) played a vital role. Other government
contribution to contain inflation was the control of prices
in traded goods including non oil and gas. Furthermore,
improved policy credibility also has a beneficial effect
on public expectations on inflation.
With stability in place, economic growth accelerated
reaching a record high of 6.32% in 2007. Much of
acceleration of the economic growth was accounted
for buoyant demand for both private consumption
and investment. Private consumption escalated on
the back of rising purchasing power. At the same
time, investment growth was supported by improved
investor perceptions, higher returns on investment
and adequate availability of financing from banks and
financial markets in general. Exports continued to forge
4
ahead amid the slowdown in global economic growth.
Key to this was the ongoing diversification of export
destinations to high-growth economies such as China
and India. Thereby outweighing a decline demand from
developed countries. The acceleration of aggregate
demand was met with rapid expansion in production
across almost all economic sectors, most notably
manufacturing, agriculture and trade.
Economic performance also improved at the regional
level during 2007, as reflected in the strong growth and
relatively stable inflation in some regions. Analyzed by
contribution, the economies in the Java, Bali and Nusa
Tenggara (Jabalnustra) region and the Jakarta-Banten
region provided the strongest driving force for national
economic growth. Concerning prices, national inflation
was kept stable due to relatively low levels of inflation in
some of the most important regions contributing to the
national inflation figure. Despite the improved economic
performance in some regions, considerable disparities
persisted among regions in their levels of growth and
inflation.
In view of the stable outlook for various economic
indicators with projected inflation within the targeted
range, Bank Indonesia gradually lowered the BI Rate
to 8%, representing a cumulative reduction of 175
basis points from the end of 2006. These rate cuts
were followed by downward movement in market
interest rates, including rates for deposit funds and
credit. Lending showed significant expansion of
25.5%, ahead of the 22.0% target at the beginning
of the year. On the stock and bond markets, the BI
Rate reductions contributed to stock index gains
with positive response from buyers of bonds, even
in spite of the negative sentiment bearing down on
regional and global markets. These trends were also
accompanied by increased net asset value (NAV) in
mutual fund investments, and particularly the NAV per
unit for fixed income funds. Nevertheless, the BI Rate
was kept on hold from August to November 2007 to
anticipate risks from escalating inflationary pressure
from external shocks.
On the fiscal front, the policy has been targeted at
maintaining price stability for energy and staple needs,
while also delivering an economic stimulus. Escalating
world oil prices in combination with below-target
lifting of domestic oil led to a considerable pressure
in the budget deficit. To address this challenge, the
government pursued a series of anticipatory measures
for budget revenues and expenditures. On the revenues
side, the government strengthened the collection of tax
revenues and increased the target of dividends from
State Owned Enterprises (SOEs). On the expenditures
side, the government maintained domestic fuel prices
at steady levels through subsidy payments, leading to
higher than targeted government spending. In budget
financing, issuance of government securities ahead of
schedule to secure deficit funding enabled the deficit
funding target to be met before the recent turmoil in the
financial sector.
Looking ahead, after a thorough assessment on
economic performance, opportunities and risks,
Bank Indonesia forecasts economic growth in 2008
to reach 6.2%, somewhat lower than in the preceding
year. This growth will be driven primarily by private
consumption and investment. Key to the brisk growth in
private consumption are the planned increases in civil
servant salaries and provincial minimum wage levels.
Also providing momentum for higher consumption
will be adequate availability of consumer financing
from banking sources and other financial institutions.
Investment growth is also predicted to gather pace
partly in response to a conducive investment climate,
but also from the construction of government and
private sector-funded infrastructure projects, including
toll roads and power plants. With the world economy
heading for a slowdown, export performance is
predicted to decline.
Indonesia’s economic performance will remain firmly
underpinned by macroeconomic and financial system
stability. The rupiah exchange rate is forecasted to
remain stable in 2008 in view of attractive investment
returns and availability of foreign exchange from export
earnings and capital inflows. However, strong upward
pressures are predicted for CPI inflation, mainly from
imported inflation. An added source of inflationary
pressure is predicted to come from mounting inflation
expectations. Taking into account to these factors,
inflation is estimated to reach 6.0%-6.5% overall,
with the probability of tailing towards the upper limit.
Accordingly, measures to maintain prices and exchange
rate stability will gain increasing importance given that
the economic expansion in 2008 will mainly rest on
domestic demand, most notably private consumption.

5
In sum, the economic outlook for 2008 will be
reinforced by Government consistency in taking
the envisaged anticipatory measures (Box: Nine
Actions for Securing Fiscal Outcomes, including Tax
Reductions for Food Commodities and Added Food
Subsidies). In addition to this, the economic outlook
is contingent on Bank Indonesia’s consistency in
safeguarding macroeconomic and financial system
stability, particularly in the exchange rate, and
on further strengthening of fiscal and monetary
policy coordination.
Evaluation of the Indonesian Economy
in 2007
Against the backdrop of external turbulence, the
Indonesian economy demonstrated improved
performance during 2007. Underscoring this were
the robust balance of payments, higher economic
growth and more equitable income distribution,
thereby reducing unemployment and poverty although
remaining at high level. Macroeconomic stability
in combination with an array of sectoral policies
contributed to the favorable economic performance
as reflected in the stable exchange rate, subdued
inflation and a containment of fiscal deficit. With stability
in check, perceptions among investors and market
agents impoved.
Indonesia’s economic performance in 2007 was
supported by a series of consistent policies in building
domestic economic resilience against external and
domestic shocks. This range of policies included the
pursuit of monetary policy geared towards achieving
inflation target, fiscal sustainability, prudential banking
policies and sectoral policies for promoting investment
and export market expansion.
Macroeconomic Conditions
Indonesia’s economic growth in 2007 reached 6.32%,
having climbed from the previous year’s level of
5.5%. Accelerated growth momentum in 2007 came
largely from the strong growth recorded in household
consumption and investment. On the supply side,
the main contributors to economic growth were the
manufacturing, trade and agriculture sectors. The
high rate of economic growth was accompanied
by improvement in public prosperity indicators.
The percentage of the population living below the
poverty line fell from 17.7% in 2006 to 16.6% in 2007,
a reduction of 1.9 million persons. Besides higher
economic growth and stable inflation, the improvement
in poverty indicators is also supported by the
implementation of various social programmes targeting
the poor, including disaster relief.
On the demand side, economic expansion was
driven by 5.0% growth in household consumption,
well ahead of the 3.2% increase recorded in the
previous year. The accelerated growth in household
consumption came on the strength of improved
public purchasing power and adequate availability
of consumer financing. The improvement in public
purchasing power was the combined result of subdued
inflation, pay increases for formal sector employees
and laborers and high levels of remittance transfers
from Indonesians working overseas. Most sections
of society, including low-income groups, saw their
income levels rise. Improvement in middle-class
incomes was indicated in the findings of a survey of
executive salaries and the 10%-15% salary increase
awarded to civil servants. Among low-income groups,
the improvement in purchasing power benefited mainly
farmers and workers employed in the formal industrial
sector. Purchasing power among low-income groups
was also bolstered by the high volume of remittances
from Indonesians working overseas, recorded at
US$6.0 billion or 1.4% of GDP.
Investment grew by 9.2% in 2007 buoyed by strong
domestic demand and improving business optimism
over the condition of the domestic economy reflected in
various survey findings pointing to buoyant confidence
in the growth outlook for the domestic economy. The
upswing in investment was also accompanied by
improvement in capital productivity, reflected in the
downward trend in the Incremental Capital Output
Ratio (ICOR). The higher productivity of capital is
an indication of improvement in investment return
and efficiency.
On the financing side, while investors tapped sources
of credit and the capital market, indications pointed to
an increase in self-financing. This was borne out in the
financial statements published by stock-exchange listed
companies indicating greater use of retained earnings in
support of business expansion. More potential sources
of investment financing became available, as indicated
by the increase in the savings ratio. In 2007, the savings
ratio reached 26.8%, up from the previous year’s level
of 23.7%. Even so, this financing potential has not

6
been fully tapped for physical investment, as reflected
in the prevailing considerable savings-investment gap
at 2.6% of GDP. Analyzed by contributing source, the
surplus of savings over investment was generated in
the private sector, in contrast to the increased deficit
in the government sector. This is an indication of the
predominance of sources of private sector savings in
investments in the financial sector.
Despite the resurgent investment growth, complacency
should be avoided as Indonesia’s business
competitiveness lags behind the neighboring countries
- in terms of operations, corporate strategy and quality
of the business environment. Confirming this is a survey
by the World Bank (October 2007), in which Indonesia’s
competitiveness rating is essentially unchanged (54th
out of 131 countries), despite some improvement in
efficiency indicators in terms of market size, efficiency
on the market for goods and efficiency on the labour
market. Some key indicators of concern include
infrastructure shortages, inefficiency in bureaucratic
processes and difficulties in access to finance. In
consequence, the investment to GDP ratio remained at
about 24.9%, below the pre-crisis ratio of about 29%
and levels reached in other ASEAN countries.
In the midst of the global economic slowdown, real
exports continued to grow at 8.0%. This is explained
not only by steadily climbing world prices, but also
by strong demand from developing countries like
China and India. Analyzed by commodity, robust
export growth was driven by keen demand for coal,
palm oil and rubber. The large volume of palm oil and
coal exports is related to the energy diversification
programmes under way in developed countries to find
alternative sources of energy in response to soaring oil
prices.
Economic expansion resulted in an upsurge in
imports with growth at 8.9%, ahead of the preceding
year. Import growth benefited not only from relative
stability in the exchange rate, but also strong domestic
demand for consumption and investment. Analyzed by
component, imports of consumer and capital goods
registered exceptionally high levels of growth at 42.4%
and 23.1%.
On the supply side, the main contributors to GDP
growth, remain unchanged, which were manufacturing
sector, trade, hotels and restaurant sector, and
agriculture sector. Manufacturing growth during 2007
reached 4.7%, up slightly from 4.6% in 2006. In a
similar trend, the trade sector saw growth climb from
6.1% in 2006 to 8.5%. The high growth rates in both
sectors were attributable to rising domestic demand
and improved business confidence in the condition
of the economy. The agricultural sector also recorded
more vigorous growth alongside increased productivity,
particularly in the food crops subsector, as well as
robust export demand for rubber and palm oil. The rice
crop also reached its highest level in the past five years.
The upsurge in economic growth during 2007 also
improved the welfare of the population. This was
indicated in per capita income that reached $1,946
in 2007, up about 17% over 2006. In addition,
the economic growth generated employment for
approximately 4.5 million new entrants to the workforce,
bringing open unemployment down from 10.3% in
August 2006 to 9.1% in August 2007. Analyzed by
educational level, unemployment among those with
academy and university qualifications continued to
rise. However, unemployment eased among low
income groups, partly due to the reinvigorated role of
agriculture in driving economic growth.
Poverty indicators also improved, as reflected in the
downward movement in total numbers of people living
in poverty, the poverty gap index and the poverty
severity index. The March 2007 report issued by BPS
(Statistics Indonesia) cited 37.2 million living in poverty,
a reduction from 39.3 million in previous year. The
decline in numbers of poor was more pronounced in
rural areas at 1.20 million, while numbers of urban poor
fell by 0.93 million. Analyzed by rural-urban population,
rural poverty predominated, with 65% of Indonesia’s
poor living in rural areas. Nevertheless, improvement
took place in the average expenditure gap for the
poor, as reflected in the poverty gap index and poverty
severity index. Alongside the reduction in poverty levels,
income disparities also eased in 2007, as indicated by a
drop in the Gini coefficient.
The reduction in poverty levels was also accompanied
by improvement in quality of life. In a World Bank
report published in November 2007, the percentage
of population living with less than $1 per day was
8.5%, well inside the targeted 10.3% in the Millennium
Development Goals (MDG) for 2015. Improvement also

7
took place in other MDG indicators, including number of
children entering primary school, child mortality under
5 years and public access to clean water. The World
Bank also noted that Indonesia’s MDG programmes
were on target in almost all areas. Among the eight
MDGs, Indonesia has made significant progress in the
poverty alleviation program.
Table 1.1
Selected Macroeconomic Indicators
percent
Descriptions 2003 2004 2005 2006 2007
GDP Growth 4.7 5.0 5.7 5.5 6.3
CPI Inflation 5.1 6.4 17.11 6.60 6.59
Core Inflation 6.9 6.7 9.75 6.03 6.29
Average Exchange Rate (Rp/$) 8.572 8.940 9.713 9.167 9.140
SBI (1 month)/BI Rate since July 2005 8.31 7.43 12.75 9.75 8.00
Current Account/GDP 3.4 0.6 0.1 2.9 2.5
GDP by Expenditure
Consumption 3.9 5.0 4.0 3.2 5.0
Gross Fixed Capital Formation 0.6 14.7 10.9 2.5 9.2
Exports of Goods and Services 5.9 13.5 16.6 9.4 8.0
Imports of Goods and Services 1.6 26.7 17.8 8.6 8.9
GDP by Sector
Agriculture 3.8 2.8 2.7 3.4 3.5
Mining and Quarrying -1.4 -4.5 3.2 1.7 2.0
Manufacturing 5.3 6.4 4.6 4.6 4.7
Electricity, Gas, and Water Supply 4.9 5.3 6.3 5.8 10.4
Construction 6.1 7.5 7.5 8.3 8.6
Trade, Hotels, and Restaurants 5.4 5.7 8.3 6.4 8.5
Transportation and Communication 12.2 13.4 12.8 14.4 14.4
Finance, Rental, and Business Services 6.7 7.7 6.7 5.5 8.0
Services 4.4 5.4 5.2 6.2 6.6
Unemployment Rate 9.5 9.4 10.8 10.3 9.1
Poverty Rate 17.4 16.7 16.0 17.7 16.6
Real GDP per Capita, thousands Rp 9,574 10,506 12,700 15,000 17,600
Real GDP per Capita, $ 1,116 1,167 1,321 1,663 1,947
Monetary Aggregate
M2 Growth, End of Period 8.12 8.14 16.42 14.87 18.89
M1 Growth, End of Period 16.60 13.41 11.07 28.08 27.63
Base Money Growth, End of Period (test date) 20.42 19.81 20.22 23.90 27.77
Interest Rate
Interbank Money Market (overnight) 8.18 6.86 10.03 5.97 6.50
1-Month Time Deposit 6.62 6.43 10.43 8.96 7.19
Working Capital Loan 15.07 13.41 15.18 15.07 13.00
Investment Loan 15.68 14.05 14.92 15.10 13.01
Balance of Payments
DSR (Debt to Service Ratio) 34.1 27.1 17.3 24.8 19.2
International Reserves, in months of imports and foreign debt repayment
7.1 5.5 4.3 4.5 5.7
Sources: BPS-Statistics Indonesia Bank Indonesia

8
At the regional level, economic performance improved
during 2007, as reflected in brisk growth and
relatively stable inflation in some regions. Analyzed
by contribution, the economies in the Java, Bali and
Nusa Tenggara region and the Jakarta-Banten region
provided the strongest driving force for national
economic growth. At the same time, buoyant economic
growth in the Kalimantan, Sulawesi, Maluku and Papua
(Kali-Sulampua) region elevated the contribution of
this region to national growth. Concerning prices,
national inflation was kept stable due to relatively low
levels of inflation in some of the most important regions
contributing to the national inflation figure. Despite
the improved economic performance in some areas,
considerable disparities persist among regions in
growth and inflation. This calls for a common effort for
reduction in interregional income disparities.
Fiscal sustainability came under pressure from the
global economic turmoil. World oil prices, which
reached an average of $72.3 per barrel, and the low
lifting of domestically produced crude oil (899 thousand
barrels per day) combined to escalate expenditure on
the fuel subsidy while simultaneously reducing state oil
revenues. The rising burden of the subsidy was also
related to the government commitment to maintain
stability in domestic fuel prices, even as world oil prices
continued to soar. To mitigate pressure from rapidly
escalating world oil prices, government spending on the
fuel and electricity subsidies mounted significantly to
151% and 102% of budget planning. Exacerbating the
burden of the fuel subsidy was higher than predicted
consumption of subsidized fuels at 38 million kiloliters
instead of the targeted 36 million kiloliters.
Faced with these external shocks, the Government
pursued a series of policy actions to curb the fiscal
deficit. On the revenues side, the Government sought
to increase budget receipts by boosting taxation
receipts, including export tax on CPO and higher
dividend payments by SOEs. Otherwise, the absorption
of some budget expenditure components progressed
slowly due to administrative hurdles, which also helped
restrain the fiscal deficit. Through these actions,
the fiscal deficit was managed within safe limits at
1.3% of GDP, below the targeted 1.5% of GDP. The
consistency of government actions for maintaining fiscal
sustainability was also reflected in the decline in the
debt to GDP ratio to 31.2% in 2007.
Improvement in the domestic economy also was
reflected in the robust performance on balance of
payments during 2007, reflected in a $12.5 billion
surplus. Despite worries over the potential for a world
economic slowdown triggered by the subprime
mortgage crisis and high oil prices, at $11.0 billion
the current account surplus was nevertheless ahead
of the $10.8 billion surplus in the preceding year. The
increased surplus was bolstered by stronger export
growth in response to robust world demand and rising
export commodity prices. Analyzed by commodity,
export growth was driven primarily by manufactured
products and mining commodities. Imports also grew
at a faster pace in keeping with increased domestic
demand and exports.
The capital and financial account still managed a $2.8
billion surplus even in spite of negative sentiment on
global financial markets that set off a round of capital
reversal. Key to this was attractive yield on rupiah
investments, macroeconomic stability and improving
investor perceptions of risk. The improved performance
in the capital account is also explained by foreign direct
investment (FDI) that reached $1.2 billion. Alongside
this, portfolio transactions generated an increased
surplus at $7.0 billion, buoyed by high levels of excess
liquidity on global markets and improving investor
perceptions of risk. In response to these developments,
international reserves mounted to $56.9 billion at the
end of 2007, equivalent to 5.7 months of imports and
servicing of official foreign debt.
The dynamics of the rupiah exchange rate were
marked by an appreciating trend in 2007 accompanied
by reduced volatility. Average value of the rupiah
came to Rp9,140 to the US dollar, a gain of 0.3%
appreciation over Rp9,167 per dollar in the preceding
year. Appreciation in the rupiah was bolstered by the
balance of payments surplus, improvement in risks
and continued attractiveness of yields on rupiah
investments. Foreign capital kept flowing in response
to the attraction of investing in domestic financial
market instruments, despite temporary capital reversal
prompted by external shocks in the second half of
2007. Brisk capital inflows on the domestic forex market
during the first half of 2007 contributed to a significant
strengthening of the rupiah. However, the second half
of the year saw an escalation of global risks, with the
domestic forex market reporting excess demand for the
year overall. Point to point, the rupiah weakened 4.2%

9
to end-2007 level of Rp9,393 to the US dollar. The
downturn in the rupiah occurred late in 2007 triggered
by the unfolding of subprime mortgage crisis and a
hike of oil prices. Averaged over the year, the rupiah
underwent appreciation with volatility down from 3.8%
in 2006 to 1.4%.
The stable, appreciating trend in the rupiah helped
to keep 2007 inflation within the targeted range. CPI
inflation for 2007 arrived at 6.59%, which was within
the government-set range of 6.0% ±1%. Inflation
during the year under review was influenced by
various fundamental and non-fundamental factors.
Fundamentals contributing to stable inflation included
subdued inflation expectations, stability in the exchange
rate and low inflationary pressure from the output
gap. Analyzed by non-fundamental factors, reduced
inflationary pressure in the CPI came from minimum
increases in administered prices and lower volatile
foods inflation.
Inflation expectations were relatively stable throughout
2007, as reflected in the findings of various surveys of
consumers, producers and financial markets. Stable
inflation expectations were largely attributable to a
combination of policy actions by Bank Indonesia and
the Government, particularly to fend off inflationary
pressures from high oil prices and the crisis on global
financial markets. Added to this, the absence of hikes
in administered prices for strategic commodities during
2007 also contributed to public expectations of stable,
low inflation. Externally, the stable movement in the
rupiah helped to mitigate rising imported inflation driven
by soaring international commodity prices. Through
these actions, core inflation for 2007 was held at
6.29%.
Volatile foods inflation reached 11.41%, well below the
15.27% recorded for the preceding year. Key to the
lower volatile foods inflation was reduced inflation in
rice due to adequate stocks and smooth distribution.
Increased rice production helped to keep rice stocks
at adequate levels, bolstered also by rice imported
by the National Logistics Agency (BULOG). Although
rice inflation eased, heightened inflation in other food
commodities from soaring international commodity
prices and natural disasters calls for vigilance. Among
the affected commodities are corn, cooking oil and
derivative products.
Inflationary pressure from administered prices was very
low, given the absence of price increases for strategic
goods such as subsidized fuels (gasoline, automotive
diesel, kerosene) and electricity billing rates. This
policy had a significant bearing on efforts to subdue
inflation during the year, given the sizeable weighting
of these items in the CPI basket and the considerable
magnitude of second round effects on other products.
Although considered low, inflation in administered
prices for the year under review mounted from 1.8%
(yoy) in the preceding year to 3.3% (yoy). This increase
is explained by decisions to raise the retail selling prices
for cigarettes by 7% in March 2007, the decision to
apply specific rates for cigarette excise as of 1 July
2007, water billing rate hikes in several cities, higher toll
road charges and increased prices for non-subsidized
fuels (Pertamax, Pertamax Plus and Pertamina Dex).
In view of the improving inflation outlook and relative
stability in macroeconomic conditions, Bank Indonesia
gradually lowered the BI Rate from 9.5% at the
beginning of 2007 to 8.25% in July 2007. In August,
the decision was made to keep the rate on hold
because of concerns over mounting future inflationary
pressure brought on by swelling world oil prices and
a wave of negative sentiment bearing down on the
exchange rate due to the subprime mortgage crisis
in the United States. However, in view of the lower
inflationary pressure and rising optimism in the future
of the economy, Bank Indonesia announced a 25 basis
point cut in the BI Rate in December. Thus at the end of
2007, the BI Rate reached a level of 8.0%.
The reductions in the BI Rate and accompanying
economic expansion also boosted performance on
the domestic financial market. Indonesia’s capital
market recorded an index gain of 52.1% in 2007 to
close at 2,745.8. Amid conditions of excess global
liquidity, mounting interest on investment on the stock
market was stimulated by the secure condition of
macro fundamentals, downward trend in the BI Rate
and improved micro-corporate performance reported
by stock exchange-listed companies in their financial
statements. Analyzed by sector, the index gains were
spurred most importantly by the mining, agriculture
and property sectors. Performance was also up on the
government securities and mutual funds markets. Yield
on government securities eased in response to growing
investor interest. On the mutual funds market, NAV
steadily mounted throughout the year to reach Rp92.2

10
trillion in December 2007, with growth driven mainly by
performance in equity-based and mixed funds.
The downward movement in the BI Rate was also
accompanied by improvement in the bank intermediary
function, with banks providing an increasingly
significant contribution to overall financing in the
economy. With the deposit rates declining, loan interest
rates began to ease although not to the same extent as
deposit rates. This change led to substantial expansion
in credit, surpassing the target set at the beginning
of the year. Total lending in 2007 mounted 25.5%
over the previous year to Rp1,045.7 trillion. Alongside
this, depositor funds widened by 17.4% to Rp1,510.7
trillion. The more robust expansion in credit compared
to depositor funds resulted in an improvement in the
banking system Loan to Deposit Ratio (LDR) to 69.2%,
the highest ever during the post-crisis period. Among
rural banks, this positive trend was also evident with
the LDR climbing to 109.7%. Micro Small Medium
Enterprises (MSMEs) lending widened to Rp502.8
trillion, an increase of 22.5% over the past year. Sharia
banks also achieved impressive performance, reflected
in expansion of service coverage, growth in depositor
funds and higher levels of financing compared to
past years.
The healthy performance in bank intermediation
was matched by improvement in risk management
capability. This was reflected in across the board
gains in various financial and operational performance
indicators, such as credit quality, earnings and capital.
Industry-wide non-performing loans (NPLs) were
lower, mainly in response to the restructuring of large
corporate loans at state-owned banks. Bank capital
held firm at a reassuring level, reflected in the bank
capital adequacy ratio (CAR) at a solid 19.2%.
Economic liquidity in 2007 was flush in comparison
to historical levels over the past 5 years. The narrow
measure of economic liquidity (M1) reached Rp460.8
trillion, representing growth of 27.6%. At the same
time, M2 widened by 18.9% to Rp1,643.2 trillion. This
movement in monetary aggregates is indicative of the
daunting challenge of managing economic liquidity.
Analyzed by influencing factors, the expansion in
liquidity is explained by a significant rise in lending
to the business sector, up Rp208.0 trillion or 26.4%
from the preceding year. Of this total, Rp154 trillion
comprised rupiah-denominated loans, while the
remaining Rp54 trillion, equivalent to $5 billion, was
extended in foreign currencies. Net Foreign Assets
(NFA) were also up 27.0% or Rp111.4 trillion over the
previous year’s position. This increase was dominated
by NFA at Bank Indonesia in line with the hefty rise
international reserves generated by increased oil and
gas revenues on the back of soaring world oil prices.
Despite this, the banking system reported a decline in
NFA, particularly in foreign assets held in call money
and demand deposits at overseas banks.
The improved economic performance in 2007 was also
reflected in mounting activity in the payment system.
Cash retained its place as a dominant instrument for
transactions, reflected in average volume of currency
in circulation at Rp174.8 trillion in 2007. At this level,
volume of currency in circulation was up 21.0%,
representing considerably higher growth than the
14.6% recorded in the preceding year. In non-cash
payments, average daily transaction volume in 2007
processed in the BI-RTGS system and the Bank
Indonesia National Clearing System (SKNBI) climbed
46.5% and 13.1% over the previous year. Alongside
this, there was considerable use of card-based
instruments, with volume dominated by account-based
cards at 77.6% and the remainder comprising credit
cards transactions. While part of this trend is explained
by economic growth, the increase is also the result of
financial market trading activity, changing preferences
in means of payment and technological innovations in
the payment system.
Macroeconomic and Sectoral Policy in 2007
The overall direction of Bank Indonesia policy in 2007,
covering monetary affairs, banking and the payment
system, focused on strengthening macroeconomic
stability as a basis for sustainable, quality economic
growth. The pursuit of prudent and consistent
monetary policy was directed at guiding inflation
expectations towards the established inflation target.
Banking policy was directed towards promoting
the bank role as an intermediary institution without
sacrificing prudential banking principles, in addition to
continuing the institutional strengthening of the banking
system. Payment system policy was directed at
supporting the effectiveness of monetary and banking
policies through the provision of a secure, fast, efficient
and reliable system for payments. On the government
11
side, fiscal policy was aimed at delivering a more
robust stimulus while maintaining fiscal sustainability,
while sectoral policy priorities targeted efforts to boost
productivity and economic growth in order to reduce
unemployment and poverty.
Monetary Policy
In monetary policy, Bank Indonesia (BI) again focused
on measures for achievement of low inflation in
the medium-term. To this end, Bank Indonesia has
consistently set the BI Rate, established as part of
the inflation targeting framework, on the basis of
inflation projections and comprehensive assessment
of macroeconomic conditions. At the implementation
level, the monetary policy stance in 2007 can be
divided into 2 periods, the period of decline in the
BI Rate (January-July 2007) and the period of flat
movement in the rate (August-November 2007). The
decision to lower the BI Rate was based primarily on
achievement of the inflation target and maintenance
of financial system stability. On the other hand, the
BI Rate was kept on hold in anticipation of potential
inflation risks brought about by the turbulence on global
financial markets beginning at the end of July 2007, as
well as the upward trend in world oil prices.
To strengthen monetary policy effectiveness, Bank
Indonesia has steadily improved the operating
framework for monetary policy, expanded the
range of monetary instruments and strengthened
communication and transparency in regard to monetary
policy. Improvements to the operating framework
include development of infrastructure to enhance the
effectiveness of open market operations through the
introduction of fixed rate tenders in the Bank Indonesia
Certificate auctions. Available monetary instruments
have been supplemented by the launching of fine tune
operations (FTOs) and progressive improvements in
liquidity projections and management. To strengthen
the credibility of monetary policy, Bank Indonesia
has revamped its monetary policy communications
and transparency with the use of press releases and
publication of monthly, quarterly and annual economic
reports, while also holding seminars and discussion
programmes (Box: Communications Strategy,
Monetary Policy and Central Bank Credibility).
In 2007, Bank Indonesia consistently applied a flexible
exchange rate policy, allowing the rupiah to move in
line with economic fundamentals. On one hand, this
alignment with fundamentals was aimed at sustaining
export competitiveness, while the management of
exchange rate volatility was also intended to safeguard
business certainty and minimize inflationary impact.
To manage volatility in the rupiah, Bank Indonesia
conducted forex market interventions on a limited scale.
Coordination of fiscal and monetary policy was
strengthened for further optimization of monetary
policy. The Inflation Control Team (TPI), consisting of
Bank Indonesia and relevant government agencies,
was made more effective in providing policy
recommendations for inflation control. Complementing
this, the Government also established the Staple Foods
Stabilization Coordinating Team tasked with stabilizing
prices for staple foods at affordable levels. This team
was made responsible for (i) planning and formulating
the stabilization policy for rice, sugar and cooking oil;
(ii) coordinating the operation of staple food stabilization
measures; and (iii) monitoring and evaluation of price
stability for staple food items.
Banking Policy
Banking policy in 2007 focused on improvement
in the intermediary function and the institutional
strengthening of the banking system, including
capacity building for the sharia banking industry. The
policy for strengthening the intermediary function was
implemented through changes in some regulations on
bank credit to promote lending to MSMEs and labor-
intensive sectors, without sacrificing prudential banking
principles. Measures for institutional strengthening of
the banking system included further action to promote
consolidation and an active role in the development of
financial markets and instruments aimed at building a
sound, robust financial sector in support of improved
economic resilience. In sharia banking, policy was
directed towards expanding the sharia banking role
in the economy through a more diversified offering
of sharia-compliant products and services and
strengthening the attractiveness of Islamic financial
instruments as an outlet for fund placements from
outside Indonesia.
The policy for further strengthening of bank
intermediation involves four key areas of action. First,
Bank Indonesia is actively engaged in providing the
data and information needed by banks and other
business actors. To do this, Bank Indonesia launched
the National Economic Database and Economic

12
Studies Information Centre on Bank Indonesia web
site and revitalized the roles and functions of Bank
Indonesia Regional Offices. Second is the revitalization
of the state bank role through strengthened
coordination and cooperation with the Government
in the restructuring of the national banking industry.
Third, amendments were made to series of regulations
to introduce revised procedures for assessment of
loan collectibility and other aspects of prudential
banking2. Fourth are efforts to strengthen the role and
contribution of rural banks in the MSME sector through
the linkage program. Reflecting progress made in these
four key actions was the launching of the Indonesia
Business Information Database (DIBI), establishment
of the Facilitation Team for Accelerated Economic
Empowerment of the Regions, operation of the linkage
program for commercial banks and rural banks, holding
of intermediation bazaars in various regions and efforts
to develop a more effective strategic partnership
with Regional Governments through a strengthened
advisory function at Bank Indonesia’s regional offices.
The policy for institutional strengthening of the banking
system is aimed at building the resilience of the national
banking system in the face of global competition. This
policy is divided into three key areas of action. First,
Bank Indonesia plays a facilitating role in the merger
process for the banking consolidation programme,
particularly for banks with potential to trigger instability
in the banking industry. Second, Bank Indonesia has
called on foreign banks to play a more optimum role in
the banking intermediation process as foreign banks
step up their lending to productive sectors. Third,
Bank Indonesia has taken on an increased role in the
development of financial markets and instruments
in order to create a sound, robust financial sector.
Reflecting the progress achieved in these three
areas is the strengthening of prudential regulations,
implementation of the Indonesian Banking Architecture
(API) and preparations for implementation of Basel II.
The launching of Basel II for the Indonesian banking
system is targeted for 2008.
In addition, Bank Indonesia has coordinated actions
with the Ministry of Finance and other agencies in the
development of an efficient and effective Financial
2 Bank Indonesia Regulation No. 9/6/PBI/2007 dated 30 March 2007 concerning Second Amendment to Bank Indonesia Regulation No. 8/2/PBI/2006 concerning Amendment to Bank Indonesia Regulation No. 7/2/PBI/2005 concerning Asset Quality Rating for Commercial Banks.
Sector Safety Net. To develop a comprehensive
framework for the financial sector, Bank Indonesia
worked in coordination with other relevant agencies to
develop the Indonesian Financial System Architecture
(ASKI) and lay the groundwork for the Financial Sector
Assessment Program (FSAP).
The policy for strengthening service capacity in the
sharia banking industry was aimed at accelerating the
growth of sharia banking. To this end, Bank Indonesia
formulated a plan for increasing service capacity in the
sharia banking industry, as envisaged in the Indonesian
sharia Banking Blue Print. This capacity expansion
was carried out simultaneously on the supply side and
demand side with the share of sharia banking targeted
to expand to 5% of total national banking volume by
end-2008. To provide the public with a wider range
of sharia banking services, the Codification of Sharia
Banking Products was prepared in 2007 to present
information on various Sharia banking products
available on the domestic market and as a reference
for sharia banks in expanding their range of financial
services.
Payment System Policy
The payment system policy is divided into policy for
currency circulation and policy for non-cash payments.
In 2007, currency circulation policy sought to improve
the security, reliability and efficiency of currency
circulation, quality of cash services and quality of the
currency itself. Alongside this, the policy for non-cash
payments is directed at mitigating payment system
risks, conducting oversight of the payment system,
reinforcing discipline in the use of cheques and
bilyet giro, regulating money remittances, efficiency
improvements in the management of government
accounts and promotion of non-cash payments.
The policy for secure, reliable and efficient circulation
of money was implemented through provision of cash
in adequate volume based on planned and realized
printing of currency, effectiveness and efficiency in
currency distribution, launching of large cash vaults at
13 Bank Indonesia regional offices and amendment of
regulations pertaining to the deposit and withdrawal of
rupiah currency by commercial banks in Indonesia.
Improvements in primary level cash services were
aimed at raising effectiveness and efficiency in
currency distribution to stakeholders. This policy

13
was implemented through measures that included
expanded areas for cooperation with PT Pos Indonesia
(Posindo) in provision of currency in border regions
and remote areas, further restrictions on bank cash
deposit and withdrawal transactions (or trial run for
bank deposits and withdrawals) and preparations for
outsourcing of currency sorting to third parties.
Efforts to improve the quality of currency in circulation
focused on reducing counterfeiting risks and
extending the lifetime of rupiah in circulation. At the
implementation level, practical actions included the
continuation of awareness campaigns and public
education programmes on the marks of authenticity
of the rupiah currency and development of the Bank
Indonesia-Counterfeit Analysis Center (BI-CAC).
Concerning the quality of materials used for currency,
Bank Indonesia conducted a study of the materials
used for production of the Rp1,000 denomination.
In the non-cash payment system, measures to mitigate
payment system risk include regular main system
and backup system testing to ensure the operational
reliability of the BI-Real Time Gross Settlement (BI-
RTGS) system. Similar testing was also conducted for
the Bank Indonesia National Clearing System (SKNBI),
including the introduction of the Failure to Settle (FtS)
mechanism designed to secure the clearing system
from potential credit risk by requiring all clearing
members to provide prefunding and securities through
the Bank Indonesia Scriptless Securities Settlement
System (BI-SSSS) as collateral for participation in
clearing throughout the day. Bank Indonesia also
revamped the infrastructure and regulation structure
for the payment system, in particular the use of Card-
Based Payment Instruments, provided facilitation for
launching of e-money and issued new regulations on
money remittances.
Oversight of the payment system also involves a
series of activities to test the operational quality of
the BI-RTGS system to ensure compliance with the
international quality standards established by the Bank
for International Settlements (BIS) in the Core Principles
on Systemically Important Payment Systems (CP
SIPS). Similarly, to mitigate settlement risk in securities
transactions, the Finality of Settlement principle
based on the recommendations of the International
Organization of Securities Commissions (IOSCO) has
been adopted for the BI-SSSS securities settlement
system. Under this principle, securities settlement is
final, and therefore does not accommodate unwinding
of settlements.
To reinforce discipline in the use of cheques and the
bilyet giro clearing payment orders, Bank Indonesia
issued a new regulation on the National Black List.
One fundamental difference with the former regulation
is self-assessment by banks of customers writing bad
cheques or bilyet giro, given that banks are better
informed as to whether a cheque or bilyet giro written
by customer is backed by sufficient funds.
As part of its effort to improve efficiency in the
management of Government accounts, Bank Indonesia
has developed the Bank Indonesia Government-
Electronic Banking (BIG-eB) application to simplify the
work of the Government in managing its accounts. In
the initial stage, the BIG-eB application will provide an
online, real time transaction information module. This
module will assist the Ministry of Finance in monitoring
transaction activity on an up to date and accurate
basis, thus expediting the process for preparation of
budget outcome reports.
Fiscal and Sectoral Policy
Fiscal policy in 2007 sought to deliver a more
robust economic stimulus while maintaining fiscal
sustainability. The heftier fiscal stimulus was reflected
in the increased budget deficit in comparison to the
preceding year, while fiscal sustainability was evident
from the steady decline in the ratio of official debt to
GDP and the surplus in the budget primary balance.
The economic stimulus was delivered not only through
government expenditures, but included a series
of limited tax incentives to stimulate activity in the
real sector3 in addition to continuation of social aid
programmes for the poor.
Confronted by the challenges of high oil prices and
low budget absorption, the government responded
with fiscal consolidation to curb the budget deficit
within the prescribed limit. On the revenues side, fiscal
consolidation involved revenue enhancement measures
through increases in dividend payments from SOEs
and tax on crude palm oil (CPO). On the expenditures
side, the consolidation involved economy measures
and efficiency improvements in government agency and
3 Government Regulation No. 1 of 2007 concerning Income Tax Facilities for Investment in Specified Business Lines and/or Specified Regions.

14
line ministry expenditures while retaining the policy for
payment of subsidies.
Sectoral policies aimed at enhancing the quality
of economic growth include improvements to the
investment climate, accelerated construction of
infrastructure, empowerment of MSMEs and the
strengthening and reform of the financial sector4. The
investment climate policy covers three main areas: (i)
institutional reforms aimed at reinforcing the institutional
basis for investment services and synchronizing the
regulations issued by central and regional governments,
(ii) smooth flows of exports and imports, including
improvements to cargo services and faster customs
processing, and (iii) tax reforms including revamped tax
administration and protection of taxpayer rights. The
primary objective of this package is to boost economic
growth beyond the 6% level by promoting investment
as a driving force for this growth.
The Financial Sector Reform Policy is a continuation
of the Financial Sector Policy launched in mid-2006
covering five main areas: (i) financial system stability,
including reinforcement of financial sector coordinating
mechanisms and strengthening of financial institutions,
(ii) banking institutions, including improved banking
policy coordination and facilitation for Sharia banking
expansion, (iii) non-bank financial institutions,
including development of export financing and laying
the groundwork for risk-based supervision of multi
finance companies, (iv) the capital market, including
improved efficiency and liquidity on the capital market
and more robust liquidity and stability on the bond
market (debt securities), and (v) other policies, including
diversification of development financing sources. The
main objectives of this package are to build financial
sector stability and diversify sources of business
funding, including sources from the banking system,
the capital market and other financial institutions.
To strengthen the quality of economic growth and
increase employment, the policy for accelerated
construction of infrastructure was continued during the
year under review. This policy covers three key areas:
(i) improvements to the legal and regulatory framework
with fast-tracked work on completion of infrastructure-
related regulations, (ii) institution building, including
4 Presidential Instruction (Inpres) Number 6 of 2007 concerning Policy for Accelerated Real Sector Growth and Empowerment of Micro, Small and Medium Enterprises (MSMEs) dated 12 June 2007.
capacity building for contracting agencies in projects
undertaken in private sector partnerships under
Presidential Instruction No. 67/2005 and division of
central and regional government powers and functions
in infrastructure development, and (iii) improvement
management of infrastructure construction, including
a process for accelerated land expropriation in the
public interest and preparation of standard operating
procedures for public-private partnership under
Presidential Instruction No.67/2005. This policy is
essentially a consolidation of coordinated strategic
measures designed to bring about reforms in the policy,
regulatory and institutional framework for provision of
infrastructure.
To reduce poverty levels, the policy for empowerment
of MSMEs aims to strengthen productivity and
effectiveness in programme implementation. The
MSME Empowerment Policy covers the four key
aspects of: (i) improved MSME access to financing
sources, (ii) development of entrepreneurship and
human capital, (iii) increased market opportunities for
MSME products and (iv) regulatory reform. The primary
target of this package is to raise MSME productivity
and strengthen the effectiveness of programmes and
activities related to empowerment of MSMEs. The
policy is also intended to send a more positive signal
of the importance of joint commitment in support of
measures for empowerment of MSMEs.
Economic Outlook and Policy Direction
in 2008
The Indonesian economy is predicted to face major
challenges in 2008 with heavy pressure from high
international commodity prices in tandem with the
risk of slumping world economic growth. On one
hand, economic growth is forecasted lower than the
preceding year. Slowing world economic expansion
will dampen export performance. Furthermore,
the Government policy emphasis on maintaining
macroeconomic stability to fend off external pressures
augurs for a reduced economic stimulus compared
to the previous year. External shocks will also stoke
inflationary pressure. CPI inflation is predicted at
the upper limit of the established inflation targeting
range. The economic outlook will remain daunted by
risks from external and domestic factors. To address
this, various policies will be pursued to bolster the
performance of the economy. Bank Indonesia policy in
2008 will be consistently directed towards safeguarding

15
macroeconomic stability in support of sustainable
national economic growth.
Global Economic Forecast
The global economy is predicted to grow by 4.1% in
2008, reflecting a slow down performance compared
to 4.9% in the preceding year. World economic
expansion in 2008 will be constrained by a range of
issues stemming largely from the spreading impact the
subprime mortgage crisis in the United States. Despite
repeated actions by the United States Federal Reserve
and the Bank of England, there is still a risk that the
problems currently besetting the financial sector are far
from over. The unfolding of the turmoil are predicted
to impact investment activity, consumer spending and
international trade. Global economic disturbances will
also be exacerbated by soaring world crude oil prices
predicted to hamper economic growth and inflation
control during the coming year. The combination of
these problems is expected to produce slowed growth
in developed countries. On the other hand, developing
countries are predicted to maintain reasonably high
growth buoyed by domestic demand despite the
inevitable negative impact from the world economic
slowdown.
Despite the expected slow down in world economic,
there is a downside risk of higher inflation. High
international commodity prices are expected to intensify
global inflationary pressures. The lack of adequate
growth in production capacity, continued high demand
from China and India, geopolitical conditions and
climatic disturbances are forecasted to keep oil prices
high throughout 2008. Upward pressure on oil prices
is also likely to originate from speculative actions by
financial market agents on commodity markets. On
the other hand, non-oil and gas commodity prices
are predicted to ease in comparison to the past year.
However, unrelentingly high oil prices will encourage
more intensive development of alternative energy
sources, which in turn will ensure continued high
demand for food commodities such as corn, crude
palm oil and sugar.
With the world economy forecasted to enter a
slowdown, developed nations are expected to follow
a loose bias monetary policy in 2008. Despite the
predicted rise in inflationary pressure, the potential for
more abrupt decline in global economic expansion will
prompt many central banks in developed economies
to adopt a loose bias policy stance. In contrast, central
banks in most emerging market countries are likely
to adopt a tight bias monetary policy to fend off high
inflationary pressures.
Capital inflows to emerging markets are predicted
to ease from the previous year’s levels. However,
the excess global liquidity and positive outlook for
economic fundamentals support the outlook for
emerging markets to continue benefiting from capital
inflows, most notably in the form of FDI and portfolio
investments. The improving economic outlook is key to
investor decisions to pour capital into FDI on emerging
markets. Portfolio capital inflows are also predicted to
rise, drawn by continued attractive investment returns
and subdued economic risks.
Economic Growth Forecast
Economic growth in 2008 is forecasted at 6.2%,
down slightly from the preceding year. The intensity
of external pressures is expected to slow economic
expansion. Export performance will weaken in
comparison to the preceding year due to the effect
of less vigorous world economic expansion. The
persistently high level of international commodity prices
has prompted the Government to make adjustments to
expenditure patterns in the Draft Revised 2008 Budget,
reflecting efficiency improvements in consumption and
investment spending, as well as increased subsidy
payments. These expenditure cutbacks designed to
free up funds for subsidies will in turn lead to reduced
government expenditures on consumption and
investment during 2008.
The driving force for economic growth in 2008 is
predicted to come mainly from private consumption
and investment. Rising public purchasing power
resulting among others from increases in provincial
minimum wages and civil servant salaries, combined
with price stabilization policies for staple goods,
will pave the way for increased public consumption.
Also providing added boost to consumption will be
consumer optimism in the outlook for improvement
in the economy, bolstered by availability of lower-cost
financing with interest rates at more attractive levels.
Optimism for the economic outlook will also provide
added momentum for investment. Construction
investment is predicted to rise with growing number of
infrastructure projects implemented by the government
and private sector. Government efforts to resolve

16
various roadblocks to infrastructure construction
are expected to provide an added boost to this
investment activity. Similar growth is also forecasted
for non-construction investment. Growing demand
and optimism for the economic outlook will stimulate
business interest in expanding economic capacity.
The launching of a range of investment policies will
also provide incentives for investment activity, as
also indicated by the surge in approvals for domestic
investment projects and FDI.
Export growth is forecasted to taper off in comparison
to the preceding year, a result of the world economic
slowdown. Accordingly, Indonesia has sought to
diversify export destinations with focus on China,
India and Eastern Europe, and therefore it is possible
to mitigate the adverse effects of softer demand
from developed nations caused by the economic
slowdown. At the same time, imports of goods and
services are expected to mount in keeping with rising
domestic demand.
This economic growth forecast also has support
from the fiscal stimulus, even though less than in the
previous year. In the Draft Revised 2008 Budget, the
Government targets a deficit at 2.0% of GDP, up from
the Revised 2007 Budget deficit at 1.3% of GDP.
The increased deficit in 2008 is largely explained by
the Government role in maintaining domestic price
stability. To protect public purchasing power amid
the forecasts of pressure from persistently high
international commodity prices, the Government has
decided to increase budget spending on the fuel and
electricity subsidies and on the price stabilization
program for strategic food commodities. Added to
this, fiscal policy in 2008 is still aimed at delivering
a stimulus for the economy. The Government plans
increases in both routine and capital expenditures,
although not to the same extent as in the past year.
Higher routine expenditures are partly explained by
the drive to improve the welfare of civil servants in a
planned increase in basic salaries of about 20%. At the
same time, government capital expenditures will flow
into infrastructure projects, such as roads, bridges and
irrigation channels. These Government policies will in
turn contribute to economic growth during 2008.
Analyzed by economic sector, the economic growth
forecast for 2008 relies heavily on performance in
manufacturing sector, trade, hotels and restaurants
sector and the transport and communications
sector. Rising demand will strengthen manufacturing
performance. Mounting public consumption will
stimulate increased growth in the food, beverages
and tobacco subsector and in the transportation
equipment manufacturing subsector. Furthermore,
infrastructure projects will strengthen performance
in the basic metals, iron and steel subsector, cement
industry subsector and non-metal quarrying subsector.
Manufacturing growth is set to improve not only from
growing demand, but also a series of Government
incentives designed to strengthen that sector, including
the rescinding of import duties on hot rolled steel and
reduction in luxury goods tax on electronic products.
Rising economic activity will in turn generate added
momentum in services sectors, such as transportation
and communications sector, as well as trade sector.
Investment financing in 2008 will be provided mainly
from equity, bank financing and government capital
expenditures. Sources of equity funds, include self-
financing and reinvestment of profits, are expected to
dominate investment financing with more than 50%
of the total. On the domestic front, the Government,
banking system and capital market are expected to
provide about 30% of needed investment financing. A
further 10% will be provided from external sources.
Balance of Payments Forecast
The balance of payments in 2008 is predicted to record
a $11.3 billion surplus, bringing international reserves
at end of year to $68.2 billion or equivalent to 6.2
months of imports and servicing of official foreign debt.
The forecasted balance of payments surplus is down
from the preceding year, with reduced surpluses in the
current account and the capital and financial account.
The current account in 2008 is predicted to chart a
respectable surplus, although not as high as before.
Amid the slowdown in world economic expansion,
export performance is predicted to decline. However,
a deeper slowdown can be avoided to some extent
by diversification of export destinations, with softer
demand from developed countries compensated by
robust demand from developing economies such as
China, India and Eastern European countries. Export
performance will also be bolstered by international
prices for oil and non-oil commodities, which is
predicted to remain strong. At the same time, the
upward trend in domestic economic activity will
continue to fuel brisk growth in imports.

17
The capital and financial account is predicted to register
a more modest surplus compared to the past year.
Nevertheless, performance will be supported by a rise
in long-term capital inflows in response to the improving
investment climate in Indonesia. FDI is predicted to
climb significantly over the previous year. Portfolio
capital inflows are also forecasted to be strong,
although not as high as before. Continued attractive
yields amid conditions of excess global liquidity will
stimulate keen investor interest in emerging market
countries. Increased capital inflows will be invested
primarily in government securities.
Exchange Rate Forecast
The rupiah exchange rate is expected to remain stable
during 2008. Stability in the rupiah will be reinforced
by improvements in fundamentals as reflected in the
continued high balance of payments surplus and
attractive yields on rupiah investments when compared
with the region. Demand for international reserves is
estimated to increase due to higher volume of non-oil
imports and higher prices of oil in international markets.
Nevertheless, the increased foreign currency demand
is expected to be offset by adequate supply. Hence
rupiah stability can be maintained.
Inflation Forecast
CPI inflation in 2008 is predicted at 6.0%-6.5%, above
the targeted range. Global economic conditions marked
by persistently high international commodity prices will
bring considerable pressure to bear, with CPI inflation
forecasted at the upper limit of the inflation targeting
range. Steep world commodity prices are expected
to boost imported inflation and fuel public inflation
expectations. These conditions will in turn drive up core
inflation. Nevertheless, these external factors can most
likely be mitigated by the stable exchange rate and
support from government policy support for domestic
price stability. Demand-side pressure is predicted to
be adequately balanced by higher investment in added
economic capacity. In the volatile foods category,
inflationary pressure will ease with the support of
government commitments to safeguard supplies of
food under the agricultural intensification programme
and greater flexibility for imports by the National
Logistics Agency (BULOG). In the administered prices
category, price increases are predicted to be minimal
in keeping with the government policy of not raising
administered prices for strategic goods.
Forecast for the Banking System
In 2008, bank lending growth in support of economic
expansion is forecasted to reach 22%-24% alongside
improvement in credit quality (NPLs gross below 5%)
and strengthening in the LDR to 72%. The continued
robust economic expansion in tandem with conducive
interest rate movements are expected to provide added
momentum to bank lending. The improving condition
of the banking system, reflected in the rising strength
of bank capital, will also contribute to the accelerated
lending growth. The more vigorous credit expansion will
be supported primarily by lending in the infrastructure
sector, which is expected to generate multiplier effects
in other economic sectors. Added support for credit
expansion will also come from growth in depositor
funds, forecasted at 16%-18%.
Sharia banking is also predicted to keep forging ahead,
with its share of the national banking system expanding
to 5% of total national banking assets in 2008. Growth
in sharia-compliant financing is predicted to outpace
credit growth in the conventional banking system.
This forecast is related to the potential for increased
mobilisation of depositor funds in the sharia banking
system in keeping with the buoyant outlook for the
economy and growing competitiveness of investment
products offered by sharia banks. On the financing
side, stronger economic expansion is expected to
generate increased demand for sharia bank financing.
The types of financing provided by sharia banks will be
dominated by sale-and-purchase based financing for
the services and trade sectors.
Risks to the Indonesian Economy in 2008
The economic forecast described above also entails
eminent downside risks that could potentially change
the projected outcomes. Higher than predicted
international prices for both oil and non-oil commodities
represent the most serious risk factor to be monitored.
Persistent strong demand, limited production capacity
and various sentiment factors, including geopolitical
issues, are expected to keep international oil prices
at high levels throughout 2008. On the other hand,
unabated high oil prices have prompted more
vigorous efforts to develop alternative energy sources.
International prices for foodstuff commodities such as
corn and soybeans are projected to soar in response
to biofuel production. In addition, climate change
caused by global warming will also notch up pressure
in food commodity prices due to crop failures. The high

18
commodity prices will benefit the balance of payments
of exporting countries, but on the other hand these
prices will have a significant bearing on economies
through increased inflationary pressure.
High world oil prices coupled with uncertainty over the
end of the global financial market turmoil brought on by
the spreading subprime mortgage crisis are predicted
to impact world economic performance. The economic
slowdown in developed countries, most importantly
the United States, is set to continue and thus erode
optimism for global economic expansion, which may
in turn hurt Indonesia’s exports. Uncertainty over the
global financial market turbulence could also derail
macroeconomic stability. Since the risk associated with
the reversal of capital inflows remain, given the share
of short term capital inflows and the shallowness of
domestic financial market.
In addition to international crude oil prices soaring
beyond the budget assumption, potential pressure
on the fiscal deficit will also come from increased
demand for domestic consumption of oil-based fuels
triggered by such factors as the price disparity between
subsidized and non-subsidized fuels and the failure to
achieve targeted levels of domestic oil production. Any
increase in the budget deficit could potentially derail
fiscal sustainability, which in turn may fuel negative
sentiment and impact the overall economic outlook.
This negative sentiment could set off another round
of portfolio capital reversal. This in turn would reduce
the balance of payments surplus and in so doing
undermine the strength of the rupiah.
Investment activity could potentially become hampered
by various hurdles preventing the completion of
infrastructure projects, including lack of clarity of
regulations on land expropriation and inadequate
synchronisation of central government and regional
government policies. Furthermore, the lack of
significant improvement in infrastructure and risks of
natural disasters could hamper the supply of goods,
which might give raise to inflationary pressure. Risk of
price increases may also arise from difficulties in the
kerosene to LPG conversion programme, which could
lead to shortages of these commodities and drive up
kerosene prices.
Policy Direction
In the monetary sector, Bank Indonesia policy will
directed at maintaining macroeconomic stability by
consistently containing inflation expectations towards
the established target. Monetary policy will continue to
emphasize consistency and commitment in managing
inflation in line with the government-set target for 2008.
This monetary policy stance not only requires support
from interest rate policy, but also policies restraining
volatility in the rupiah. In this regard, the maintenance
of safe levels of international reserves is consistent
with the safeguarding of macroeconomic stability.
Reinforcing this are standby measures established
through the ASEAN+3 cooperation under the Chiang
Mai Initiative, in which Bank Indonesia has concluded
bilateral swap arrangements with Japan, Korea and
China. These regional self-help measures are of
strategic importance in maintaining the future economic
and financial stability of the region.
This monetary policy will require support from an
improved operational framework. To this end, Bank
Indonesia will launch a series of tactical measures to
enhance the effectiveness of monetary instruments in
absorbing excess liquidity in the banking system. Open
Market Operations (OMOs) will use instruments with
a broader range of tenors to maintain stability in the
overnight (O/N) interbank market. Also enhancing the
use of OMOs will be fine tuning operations (FTOs), repo
transactions with underlying government securities
and Forex swaps. On the financial market, the strategy
for financial market deepening and expansion of
the financial instrument base will take on increasing
importance. The reactivation of existing instruments
and transactions is one measure for financial market
development that is expected to improve effectiveness
in the management of liquidity held by financial market
players.
To promote economic growth, the primary thrust
of banking policy in 2008 will be on quality lending,
improved MSME access to financing, expansion in the
direction of universal banking and further consolidation
of the banking system. Higher quality lending will involve
such actions as increased lending to productive sectors
and exploration of possibilities for reestablishment of a
policy bank concentrating on mobilisation of long-term
funds for financing infrastructure projects. To improve
MSME access to financing, Bank Indonesia is pressing
forward with expansion of the linkage program,

19
development of a loan guarantee scheme for MSMEs,
reduction in the risk-weighted asset calculation for
people’s business loans (KUR) and MSMEs credit,
and redefinition and redirection of the rural bank role in
local economic empowerment. Greater room has been
created for banks to expand operations into universal
banking as a response to the mounting demand for
innovative bank products integrated with other products
from the financial industry. The adoption of universal
banking within the banking system will not only help
ensure provision of needed financing, but also support
financial market deepening.
The drive to optimize the bank intermediary function
must be accompanied by measures for strengthening
the resilience of the banking industry, Bank Indonesia
will keep moving forward with bank consolidation,
including the launching of regulations pertaining to the
criteria for High Performing Banks and Anchor Banks,
as well as examining the effectiveness of the increase
of minimum bank capital to Rp80 billion. Preparations
for implementation of Basel II, primarily in relation to
the three pillars of capital adequacy, supervisory review
process and market discipline, will continue.
Banking policy will also focus on strengthening banking
transparency towards the public and the launching of
Banking Education Year. By mid-2008, all banks will
be expected be fully compliant with good corporate
governance (GCG) including disclosure of their GCG
in reports to the public. The Banking Education Year
in 2008 will mark the launching of a comprehensive,
integrated public education programme on banking
in coordination with all banking industry stakeholders.
This programme is envisaged as empowering the
public with greater ability to choose and make more
carefully planned, considered use of banking products
and services. The banking system is also expected to
play a community social role under the corporate social
responsibility (CSR) programme. The banking industry
CSR may focus on strategic efforts in education as a
contribution to the nation’s social and human capital.
To support economic activity and the effectiveness of
monetary and banking policy, the currency circulation
policy will continue to focus on improvements in
the security, reliability and efficiency in currency
circulation; improved primary level cash services; and
enhanced quality of currency. Existing policies will be
continued, including the strategy for secure, effective
and efficient currency distribution and measures to
combat the circulation of counterfeit currency through
the strengthening of infrastructure at Bank Indonesia
and enhanced anti-counterfeiting collaboration with
other agencies. Bank Indonesia will also launch the
pilot implementation of cash centres at the Bank
Indonesia Head Office and some Bank Indonesia
Regional Offices as part of the strategy for outsourcing
cash management to third parties. In addition, Bank
Indonesia plans to issue a new Rp20,000 denomination
in 2008 for reasons of cost efficiency and longer
retention in circulation.
Policy for non-cash payments is aimed at curbing
risks, raising efficiency, ensuring equitable access and
enhancing consumer protection. Actions to mitigate
risk in the payment system and thus support financial
system stability include the ongoing trials of disaster
recovery planning to safeguard the operational reliability
of the payment system (RTGS and national clearing
system) and a study exploring possibilities for operation
of a payment versus payment (PVP) mechanism for
foreign exchange transactions and development
of a risk mitigation model for funds transfers.
Efficiency improvements include the introduction of
interoperability in the card-based payment instrument
networks, while the principle of equitable access is set
out in the system operating regulations by emphasizing
Bank Indonesia’s position as regulator, operator and
member. Consumer protection will be strengthened
through the introduction of a regulation on e-money
and broader coverage of application of the rules on
money remittance activities.
To optimize policy effectiveness, Bank Indonesia
will continue to strengthen coordination with other
macroeconomic policies. The drive to safeguard
macroeconomic stability and promote more robust,
more healthily structured economic growth is integral
to overall economic policy. A key prerequisite is
greater competitiveness in the economy through
improvement in the investment climate and accelerated
construction of infrastructure. Work will continue on
the harmonization of a range of policies for these
objectives. Further strengthening will take place in the
coordination and synergy established between Bank
Indonesia and the Government. Policy coordination
for inflation control, in addition to the Inflation Control
Team (TPI) and Coordinating Team for Stabilization of
Food Staples, will also involve the Coordinating Forum

20
for Inflation Control coordinated by the Office of the
Coordinating Minister for the Economy. At the regional
level, the Bank Indonesia Regional Offices will take on
a strengthened role in local economic empowerment
and accelerated economic development, among others
through establishment of Regional Inflation Control
Teams for coordination between Bank Indonesia
Regional Offices and relevant agencies. In the payment
system, Bank Indonesia will launch the government
e-banking application (BIG-eB) to complement the
implementation of the Treasury Single Account. The
BIG-eB application will offer a range of modules for
conducting transactions and providing information on
Government financial transactions. In a further move
to safeguard and reinforce financial system stability,
coordination will be strengthened further in the Financial
System Stability Forum (FSSK) for collaboration
between the Ministry of Finance, Bank Indonesia and
the Indonesian Deposit Insurance Corporation (LPS)
under the auspices of the Coordinating Minister for the
Economy. In 2008, the FSSK plans to finalize the Crisis
Management Protocol and the Macro Early Warning
System while taking forward a series of programmes
under the Indonesian Financial System Architecture
initiative.

21
One interesting feature of Bank Indonesia in the past
several years is public transparency, particularly in
regard to monetary policy. In the past, monetary policy
decisions were made in closed sessions with outcomes
not announced to the general public. Now, the public
can easily access information on monetary policy and
the decisions adopted in the Board of Governors’
Meeting held at Bank Indonesia each month. Bank
Indonesia has also opened itself to members of
the public interested in learning and understanding
monetary policy. Other means of communications, such
as the web site, workshops, seminars, student visits
and formal and informal meetings have been organized
to improve public understanding of monetary policy and
the national economy. Bank Indonesia is now working to
bring itself closer to the public.
The drive to bring Bank Indonesia closer to the public
is integral to the monetary policy framework adopted
in 2005. The launching of the Inflation Targeting
Framework (ITF) as a working framework for monetary
policy in Indonesia has influenced the operation of
monetary policy itself. The ITF introduced the public to
a new logic in the policy actions taken by the central
bank. The ITF also brought structural change to the
communications approach previously followed by the
central bank1. Central bank policy is now consistently
steered towards achievement of a future inflation target,
established for the medium and long-term. To achieve
the target, communication represents the front line of
the drive to build the credibility of the central bank.
Central bankers now understand that credibility is one
of the most important elements in monetary policy
effectiveness. In the 1960’s and 1970’s, policy makers
1 Initial reference came from Leiderman and Svensson (1995) and basic thoughts came from Svensson (1999). Several general view could be found in Bernanke et al (1998), Loayza and Soto (2001), Mishkin and Schmidt-Hebble (2001) and Gjedrem (2001). Each country’s experiment had been evaluated by Kohn (2000) for England, Svensson (2001) for New Zealand, and Svensson et al (2002) for Norway.
did not yet fully understand the correlation between
determinants of credibility and policy outcomes.
However, in 1977, Finn Kydland and Edward Prescott
published their dissertation, “Rules Rather than
Discretion: The Inconsistency of Optimal Plans” (Kydland
and Prescott, 1977), which presents a cogent analysis
of the credibility of decision making authorities. Kydland
and Prescott specifically pointed out how economic
indicators in many situations will show better results if
policy makers are able to make credible statements or
promises on specific aspects of their envisaged policies.
“Credible” in this context means that the public believes
that policy makers will honour their promises even when
tempted to do otherwise.
Much has now been written on the relationship between
central bank communications and the operation of
the ITF. Early references are found in Leiderman and
Svensson (1995) and the basic line of thought in
Svensson (1999). General viewpoints are also found in
Bernanke et. al. (1998), Loayza and Soto (2001), Mishkin
and Schmidt-Hebbel (2001) and Gjedrem (2001).
Evaluations of individual country experiments have also
been prepared by Kohn (2000) for the United Kingdom,
Svensson (2001) for New Zealand and Svensson et. al.
(2002) for Norway.
More specifically, Kydland and Prescott cite examples
in which central banks will tend to announce or publicly
commit themselves to low inflation targets. If the public
trusts these statements (the central bank has credibility),
the public will place their confidence accordingly. As a
result, demands for wage increases and even prices
will moderate, adjusting to the expectations in place.
This public behavior will then ease the task of the
central bank in fulfilling its commitment to maintaining
low inflation. Conversely, if the public is sceptical of
the central bank commitment to low inflation (e.g., the
public believes that the central bank will be tempted
to take a more populist approach at the expense of
Communications Strategy, Monetary Policy and Central Bank Credibility

22
long-term objectives), public expectations of inflation
will mount. The public expectations of higher levels of
future inflation will in turn drive up prices and ultimately
increase the difficulty and expense for the central bank in
achieving and maintaining low, stable inflation. It is here
that the credibility of the central bank plays a major role in
achievement of the inflation target.
From a theoretical standpoint, the importance of central
bank credibility is supported by a number of views, such
as the school of new macroeconomics of monetary policy
with its new neoclassical synthesis (NNS) or the New
Keynesian Economics approach. The benchmarks of
the NNS approach include some features from classical
economics, such as the real business cycle (RBC),
intertemporal optimization and rational expectations.
The NNS approach also has Keynesian features such as
monopolistically competitive firms, a markup of price over
marginal cost and sticky prices (costly price adjustment).
The understanding of these theories has helped central
banks to grasp and to explain to the public how monetary
policy builds and maintains the credibility of a low inflation
outlook and why inflation targeting can achieve balanced
improvement in the stability of inflation and output.
In Indonesia, inflation is influenced by three main factors.
First is volatile foods, in which inflation is customarily
determined by the harvest season, tight supply,
distribution bottlenecks or even natural disasters. Second
are administered prices, such as fuel prices and electricity
billing rates. Third is the core inflation, comprising inflation
generated by the output gap, inflation from external
factors, such as the exchange rate and rising international
commodity prices, and public expectations of inflation.
Among these inflation determinants, one of the most
dominant factors in Indonesia is the persistently high level
of public inflation expectations.
Public expectations are shaped by two factors. The
first is adaptive or backward looking expectations, in
which inflation is determined by the subjective views
of economic actors based on past economic data and
events. This subjective view still predominates in the
expectations formed by the public in Indonesia. Second
are rational or forward-looking expectations in which
inflation is based on monetary scenarios projected by
the central bank, which in this case has an inflation
target. It is these forward monetary projections that are
envisaged for further development to guide the behavior
of economic actors. To achieve this, the credibility of the
central bank is essential, as well as mutual trust between
the central bank and the public.
It is here that a communication strategy is key to
strengthening the effectiveness of monetary policy. On
a structural level, monetary policy communications at
Bank Indonesia form part of the overall Bank Indonesia
communications strategy. This strategy is formulated
as a guide for Bank Indonesia in communicating with
the public, influencing expectations and ultimately
strengthening the credibility of the central bank. Various
monetary policy communications were put into place
beginning in 2005 and subsequently in 2007 were
incorporated permanently into the strategy for monetary
policy communications.
The monetary policy communications strategy has been
formulated down to the operational level. The strategy
sets out the main objectives, target groups (stakeholders)
and communication tools. Communications are conveyed
in a transparent, comprehensive and predictable manner.
Transparency in monetary policy communications is
upheld through timely provision of factual information.
Identification of stakeholders is a vital prerequisite to an
effective communications strategy. Bank Indonesia’s
communications or even the monetary policy education
itself is focused on the media, financial market and
banking system actors, economic analysts, industry
(business associations, Chamber of Commerce and
Industry, etc.), academics, students, politicians, members
of parliament, NGOs and the general public.
Looking ahead, monetary policy communications in
Indonesia remain daunted by formidable challenges.
These challenges are exacerbated by widely varying
levels of public understanding, public expectations
of future inflation and the economic outlook and the
struggling credibility of the central bank itself. Low,
stable inflation cannot be achieved in a simple, one-
off undertaking, but instead demands a long series of
complex measures. A key factor in this is the credibility of
the central bank. In the absence of credibility, low public
confidence will engender public behavior detrimental
of the economy. In this modern age, a key task for
central banks is the management of expectations. For
this reason, a common effort among all the constituent
elements of our society in maintaining the credibility of
the central bank is of strategic importance in building our
nation’s economic stability.

Chapter 2
Macroeconomic Conditions

24
During 2007, the Indonesian economy showed overall improvement. This was reflected in the highest economic growth rate achieved during the post-crisis period, underpinned by increasingly robust, carefully managed macroeconomic stability. On the demand side, accelerated growth was driven by vibrant public consumption and investment in keeping public purchasing power and economic prospects. Despite some slowing, export growth remained strong in the face of the threat of world economic slowdown. Demand-side expansion was also reflected in increased capacity utilisation across almost all economic sectors. Key sectors supporting overall economic growth, such as manufacturing, agriculture, and trade, as well as hotels and restaurants, forged ahead at a faster rate compared to the preceding year. Robust economic growth was also followed by higher employment levels, rising per capita income and reductions in poverty gap index and poverty severity index.
Chapter 2: Macroeconomic Conditions
Economic growth in 2007 surpassed that of 2006,
reaching its highest level since the outbreak of the
economic crisis. Overall, the economy emerged in
better condition despite challenges arising from global
and domestic issues. Indonesia was able to minimise
the impact of soaring oil prices and the subprime
mortgage crisis and in so doing maintain the stability
of the rupiah and inflation while safeguarding fiscal
sustainability. The achievement of macroeconomic
stability coupled with stronger public purchasing power
paved the way for reinvigorated economic growth
in 2007. After slipping to 5.5% (yoy) in 2006, growth
mounted significantly in 2007 to 6.3% (yoy) (Chart 2.1).
On the demand side, the impressive gain in economic
growth was reflected in surging domestic demand and
relatively strong exports. In the first half of 2007, public
purchasing power, which had weakened in 2006 after
fuel price hikes in 2005, managed a gradual recovery
to provide added stimulation for private consumption.
Investment began to show significant improvement
following a downturn brought on by slackened
domestic demand. Exports maintained their rapid
expansion at the beginning of the year, buoyed by world
demand and high international prices for resource-
based commodities. Imports also continued to expand
rapidly in keeping with strengthened domestic demand
and exports. In the second half, the recovery in public
purchasing power helped to stimulate rapid growth in
private consumption. Investment growth maintained
an upward trend, driven mainly by rising domestic
demand. Export growth began to taper off towards the
end of the year in response to slowing global demand.
However, import growth remained strong at year end
due to robust domestic demand.

25
All economic sectors reported higher levels of growth
compared to the preceding year. Leading growth
sectors were transport and communications, electricity,
gas and water supply sector, construction, financial
sector and trade, hotels and restaurants sector.
As alluded previously, manufacturing, trade and
transportation were the main sectors driving the growth
of the economy. However, the composition of major
economic sectors in the GDP, led by manufacturing,
agriculture and trade, as well as hotels and restaurants
sectors remained unchanged.
On the policy front, real sector policy was directed
at strengthening economic growth. To this end, the
Government launched a policy package for revamped
growth in the real sector and empowerment of
MSMEs. The policy package, which strengthens
existing cross-sectoral policies while introducing
new policies, is divided into the following key areas:
i) improvement of the investment climate; ii) reform
of financial system; iii) accelerated construction of
infrastructure; and iv) empowerment of MSMEs. As of
November 2007, the Government had achieved most
of the targets set out in the Presidential Instruction.
Policies were also introduced to improve welfare by
strengthening poverty alleviation under the Regional
Poverty Alleviation Coordinating Teams , continuing the
School Operational Assistance programme for aid to
underprivileged students and other actions.
Improved economic growth in 2007 was also
accompanied by a general reduction in numbers of
unemployed and the poor. The economic expansion
in 2007 succeeded in absorbing larger numbers of
workers than new entrants to the workforce. As a
result, open unemployment in 2007 fell to 10.5 million,
compared to the 11.1 million recorded in 2006. The
reduced unemployment in turn lowered the numbers
of people living in poverty from 39.30 million (17.8% of
the population) in 2006 to 37.17 million (16.6% of the
population) in 2007. This improvement in welfare had
a positive impact on some of the targeted indicators
in the 2015 Millennium Development Goals, most
importantly with reduction in poverty and hunger, lower
child mortality rate and more children receiving primary
and secondary education.
Aggregate Demand
On the demand side, improved public purchasing
power and robust world demand for Indonesian export
products were key factors driving economic growth
in 2007. In the first half of 2007, stronger purchasing
power fuelled by consumer confidence in rising
incomes resulted in significantly increased growth in
Table 2.1
GDP Growth and Distribution by Expenditures
percent
Items 2004 2005 2006*2007**
2007**I II III IV
Total Consumption 4.9 4.3 3.9 4.6 4.6 5.3 5.1 4.9
Private Consumption 5.0 4.0 3.2 4.7 4.7 5.1 5.6 5.0
Government Consumption 4.0 6.6 9.6 3.7 3.8 6.5 2.0 4.0
Investment1 14.2 10.8 2.9 7.0 6.9 10.4 12.1 9.1
Domestic Demand 9.1 5.3 3.3 -0.8 3.4 4.4 9.6 4.2
Net Export -23.1 13.6 15.6 6.8 25.0 6.7 -14.2 6.1
Exports of Goods and Services 11.1 16.4 9.2 8.1 9.8 6.9 7.3 8.0
Imports of Goods and Services 25.2 17.1 7.6 8.5 6.5 7.0 13.6 8.9
GDP 4.9 5.7 5.5 6.1 6.4 6.5 6.3 6.3
Distribution of GDP (%)
Total Consumption 68.2 67.3 66.3 64.4 65.2 63.8 68.2 65.4
Private Consumption 60.6 59.6 58.3 57.8 57.3 56.3 58.9 57.6
Government Consumption 7.6 7.7 8.0 6.5 7.9 7.4 9.3 7.8
Investment1 21.4 22.5 21.9 21.5 22.0 22.5 23.6 22.4
Exports of Goods and Services 41.1 45.2 46.8 47.0 48.0 46.9 49.1 47.8
Imports of Goods and Services 32.8 36.3 37.0 36.8 38.2 38.8 40.2 38.5
Sources: BPS-Statistics Indonesia1 Gross Fixed Capital Formation.

26
private consumption. Exports, buoyed by strong world
demand for agricultural and mining commodities,
continued to come to the fore. Investment showed an
upward growth trend, consistent with more vigorous
private consumption. Imports, comprising mainly
consumer goods and raw materials, also grew at a high
rate alongside rising domestic demand and exports.
During the second half of the year, vigorous expansion
in domestic demand continued to provide the main
driving force for growth. However, export-driven growth
began to taper off as the slowdown took greater hold
in the world economy. This period was also marked by
surging import growth.
Private consumption expanded at the rate of 5.0% in
2007 on the back of renewed public purchasing power.
Public purchasing power mounted a gradual recovery
during the year, following a period of weakened
purchasing power in 2006 brought on by earlier fuel
price hikes. Reflecting this was the sustained upward
trend with private consumption growth reaching 5.0%
(yoy) in 2007, well ahead of the previous year’s growth
at 3.2% (yoy). This recovery in purchasing power was
experienced at almost all levels of society. Middle and
upper income employees in the formal sector saw their
salaries rise by an average of 13% (yoy) during 2007
(Table 2.2). At the same time, wages for informal sector
workers, representative of purchasing power among
lower income groups, improved further albeit on a
modest scale (Chart 2.2 and 2.3).
Analyzed by component, growth in both food and
non-food consumption mounted higher in comparison
to 2006 (Chart 2.4). Non-food consumption climbed
5.8%, well ahead of the 4.1% recorded in 2006.
Increased non-food consumption was reflected in
the significant rise in sales of durable goods, such as
motor vehicles and electronic products. Motor vehicle
sales were up 36.3% in 2007, a vast improvement
over the negative 40.2% growth in the previous year
(Chart 2.5). Alongside this, the previous negative
12.8% growth in motorcycle sales improved to 5.8%.
Purchases of electronic items, including televisions and
washing machines, advanced by 21.3% and 33.3% in
2007 (Table 2.3). Also reflecting the escalating trend
in consumption was the accelerated real growth in M1
during 2007 (Chart 2.6).
Table 2.2
Salary Increase by Management Levelpercent
Management LevelAverage Increase
2005 2006 2007*
Blue Collars 9.9 12.3 12.7
Clerk 9.8 13.1 13.8
Junior Management 9.8 13 13.7
Middle Management 9.6 12.8 13.9
Senior Management 9.4 12.8 13.6
All Level 9.7 13 13.8Source: SWA, February 2007* projection

27
Consumer confidence in the condition of the economy
also bolstered private consumption. Consumer
confidence indicators showed steady improvement
from the beginning of 2007, as borne out in the Bank
Indonesia Consumer Survey, which shows an upward
trend from early in the year. The consumer confidence
index components in the BI Consumer Survey have
registered steady gains (Chart 2.7). This improvement
is mainly attributable to a number of factors, including
current income levels, economic conditions and
availability of employment. Income expectations
identified in the Consumer Tendency Survey by the
Central Statistics Agency (BPS) were also upbeat, due
largely to improved forecasts for household incomes
(Chart 2.8). In addition, the downward movement in
loan interest rates to the middle of the year is also
believed to have boosted private consumption.
From the financing side, support for accelerated growth
in private consumption came from consumption credit
and non-bank financing. Consumption credit and
non-bank financing expanded at a faster rate with
interest rates in decline. Disbursements of consumption
credit mounted 17.5% in 2007, ahead of the previous
year’s growth of 16.8%. Average growth in consumer
financing during 2007 also surpassed the average
expansion recorded in preceding years (Chart 2.9 and
Chart 2.10).
Unlike private consumption, government consumption
manifested a slowing growth trend. Growth in
government consumption reached 4.0%, down from
Table 2.3
Electronic Products Sales Growth
percent
Product 2005 2006 2007
Television -4.10 -3.77 21.26
Refrigerator 21.07 -11.76 23.27
AC 26.03 -13.48 34.85
Washing Machine 16.71 4.24 33.34
Source: Electronic Marketing Club.

28
the 9.6% recorded in the previous year in keeping with
reduced budget expenditure outcomes. Analyzed by
component, the slowdown in expenditures took place
mainly in personnel expenditures and the General
Allocation Funds and Special Allocation Funds for the
regions. On the other hand, miscellaneous expenditures
and the Profit Sharing Fund recorded negative growth.
Investment responded to rising demand with more
robust expansion compared to the preceding year.
In 2007, investment expanded by 9.2% (yoy), a
considerable improvement over the 2.5% growth
in 2006. Driving this performance was escalating
domestic and external demand in the first half of
2007 and rapid expansion in private consumption to
the end of the year. Investment growth was recorded
in both construction and non-construction sectors.
Also contributing to investment performance was
improved efficiency in use of capital as more investment
flowed into technology-intensive sectors. In 2007,
the Incremental Capital Output Ratio (ICOR) eased
reflecting improvement to 3.8, down when compared
to 4.2 in 2006 (Chart 2.11) and the average for the past
4 (four) years1. Accordingly, the ratio of investment to
real GDP edged slowly upwards to 22.4%, albeit still
below the all-time 29% high during the pre-crisis period
(Chart 2.12).
1 ICOR is the ratio of the incremental increase in capital to incremental increase in output, or the level of investment required to generate one unit of output.
Disaggregated by component, accelerated investment
growth was driven mainly by the 10.1% rise in non-
construction investment (Chart 2.13). The surge in
non-construction investment was reflected in renewed
growth trend in heavy equipment sales in 2007
(Chart 2.17). In contrast, construction investment was
stable with growth at 8.6% (yoy). At this level, growth
in construction investment was on par with the stable
trend in cement sales during 2007 (Chart 2.15).

29
Rising investment bolstered expansion in economic
capacity, as reflected in the upward trend in capital
accumulation. Progress was achieved in the resolution
of various infrastructure-related problems affecting
production in keeping with the gradual improving
trend in capital accumulation (Chart 2.16). Stronger
investment growth is also expected to boost economic
capacity and thus minimise inflationary pressure from
the output gap.
Also fuelling renewed investment growth was an upbeat
trend in business sentiment over the condition of the
economy. The BPS survey points to improvement in
business sentiment over future economic conditions,
especially in relation to domestic demand and demand
for input goods (Chart 2.17). Consistent with the BPS
survey, the BI Business Survey, which is related to
realized investment levels, indicated a gain in realized
investment value in the second half of 2007 compared
to the first half (Chart 2.18).

30
The upward investment trend was reflected in the
savings-investment gap. With investment growing at a
faster rate, the savings-investment gap narrowed from
2.7% in 2006 to 2.5% in 2007. However, the reduced
surplus in the savings-investment gap was attributable
more to the widening of the fiscal deficit from -0.9%
to -1.2%. At the same time, the private sector surplus
climbed from 3.6% to 3.8% despite more robust
expansion in private investment.
Despite this, investment activity was still hampered
by an inadequately conducive investment climate
compared to competing countries. This is explained
by several reasons, among others lack of infrastructure
and problems with investment-related regulations. In
the Doing Business 2008 survey by the International
Finance Corporation, Indonesia’s competitiveness
rating improved from the 133rd to the 123rd spot in
2007 (Table 2.5), while still lagged behind neighboring
countries such as Thailand, Malaysia and even Vietnam.
Aside from this survey, Indonesia’s rating by the World

31
The buoyant export growth was driven by exports of
mining extraction commodities such as coal and nickel
(Chart 2.20) and agricultural commodities, notably
palm oil and rubber (Chart 2.21). At the same time,
the leading manufactured exports were chemicals and
rubber products (Chart 2.22). World demand for coal
and palm oil mounted sharply in 2007 due to the effect
of energy diversification spurred by soaring oil prices.
With economic activity gathering pace, imports of
goods and services also grew more vigorously than
in 2006. The 8.9% (yoy) growth in these imports was
attributable largely to robust expansion in imports of
consumer goods and raw materials (Chart 2.23). The
Economic Forum was also unchanged. Compared to
neighboring countries, Indonesia’s competitiveness
ranked ahead only of that of Vietnam and the
Philippines (Table 2.6).
Exports of goods and services forged ahead, driven
by high world demand. Export registered strong 8.0%
growth (yoy) in 2007, despite some slowing compared
to the preceding year. The major factor fuelling export
growth was robust world demand in the first half of
2007 (Chart 2.19). Towards the end of 2007, external
conditions began to deteriorate global demand from
the effects of the ongoing US subprime mortgage
crisis. However, at this point, the crisis had brought no
significantly impact on export growth.
Table 2.4
Saving – Investment Gap
2005 2006 2007
Ratio to GDP (%)
Government
Saving 2.4 2.2 2.2
Investment 2.9 3.1 3.4
Deficit/Surplus -0.5 -0.9 -1.3
Private
Saving 21.3 24.6 25.2
Investment 20.7 21.0 21.5
Deficit/Surplus 0.6 3.6 3.8
Total
Saving 23.7 26.8 27.4
Investment 23.6 24.1 24.9
Deficit/Surplus 0.1 2.9 2.5
Note:
GDP (Trillion Rp), base year 2000 2,774.3 3,339.5 3,957.4
Current Account (Millions of $) 278 10,836 11,009
Average Exchange Rate (Rp/$) 9,713 9,167 9,140Source: BPS-Statistics Indonesia, Ministry of Finance
Table 2.5
Indonesia’s Rating - Investment Climate Survey
Countries
Ease of Doing Business
Starting a Business
Dealing with Licenses
Employing Workers
Registering Property
Enforcing Contract
Closing a Business
2006 2007 2006 2007 2006 2007 2006 2007 2006 2007 2006 2007 2006 2007
Indonesia 133 123 163 168 117 99 154 153 49 51 142 141 137 136
Malaysia 21 24 74 74 102 105 43 43 4 4 14 63 53 54
Vietnam 94 91 90 97 62 63 82 84 175 165 41 40 119 121
Thailand 17 15 27 36 11 12 49 49 32 33 26 26 41 44
China 92 83 128 135 175 175 86 86 81 83 20 20 76 57
Philippines 130 133 135 144 75 77 122 122 141 141 113 113 147 147
Singapore 1 1 11 9 5 5 1 1 2 2 5 4 0.8 2Source: International Finance Cooperation

32
upsurge in consumer goods imports came in response
to invigorated private consumption fuelled by rising
purchasing power. Imports of raw materials and capital
goods also mounted higher in support of rising levels of
production and investment (Chart 2.24). Import growth
was especially strong during the second half of 2007, in
line with the upward trend in domestic demand.
Aggregate Supply
On the supply side, almost all sectors reported
improved growth over 2006. Supporting this were
indicators of increased capacity utilisation in nearly
all sectors (Chart 2.25). The leading growth sectors
in 2007 were all non-tradable, i.e. transport and
communications, the electricity, gas and water
supply sector, construction and the trade, hotels and
restaurants sector. At the same time, manufacturing
and agriculture, the major pillars of the economy,
reported improved growth compared to 2006.
Rising domestic demand and strong exports stimulated
renewed growth in manufacturing. Manufacturing
growth in 2007 reached 4.7% (yoy), slightly ahead
of the 4.6% growth (yoy) recorded in 2006. Key to
this growth was performance in the transportation
equipment, machinery and tools subsector and the
food, beverages and tobacco subsector. Stronger
manufacturing growth was reflected in the upward
Table 2.6
Rank of Competitiveness
Countries2007-2008
(131 countries)2006-2007
(122 countries)
Indonesia 54 54
Malaysia 21 19
Vietnam 68 64
Thailand 28 28
China 34 35
Philippines 71 75
Singapore 7 8
Source: WEF

33
In 2007, the heavy equipment, machinery and machine
tools manufacturing subsector grew 9.7%, outstripping
the 7.6% growth of 2006. This performance was driven
primarily by rising domestic demand from private
consumption and growing investment as demonstrated
by the rise in motor vehicle and electronics production
during 2007 (Chart 2.28 and 2.29). Car production
reached 411.6 thousand units in 2007, an increase
of 98.4% (yoy) over only 207.5 thousand units in the
previous year. At the same time, total electronics
sales (televisions, refrigerators, AC units and washing
movement in the annual manufacturing production
indices released by Bank Indonesia and BPS, which
gathered pace since the beginning of the year (Chart
2.26 and 2.27). Nevertheless, it is important to note the
slowing trend in quarterly manufacturing growth near
the end of the year, with flagging growth reported in
some subsectors.
Manufacturing sector growth was strengthened
by continued high growth in the heavy equipment,
machinery and machine tools manufacturing subsector.
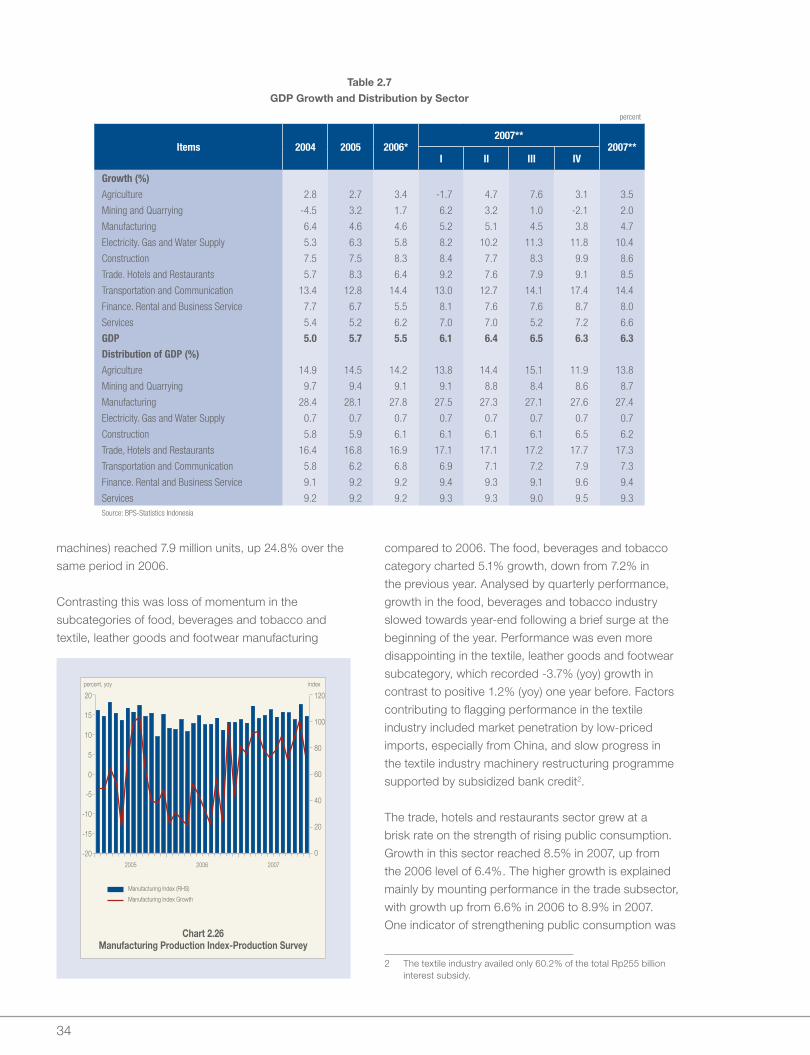
34
machines) reached 7.9 million units, up 24.8% over the
same period in 2006.
Contrasting this was loss of momentum in the
subcategories of food, beverages and tobacco and
textile, leather goods and footwear manufacturing
compared to 2006. The food, beverages and tobacco
category charted 5.1% growth, down from 7.2% in
the previous year. Analysed by quarterly performance,
growth in the food, beverages and tobacco industry
slowed towards year-end following a brief surge at the
beginning of the year. Performance was even more
disappointing in the textile, leather goods and footwear
subcategory, which recorded -3.7% (yoy) growth in
contrast to positive 1.2% (yoy) one year before. Factors
contributing to flagging performance in the textile
industry included market penetration by low-priced
imports, especially from China, and slow progress in
the textile industry machinery restructuring programme
supported by subsidized bank credit2.
The trade, hotels and restaurants sector grew at a
brisk rate on the strength of rising public consumption.
Growth in this sector reached 8.5% in 2007, up from
the 2006 level of 6.4%. The higher growth is explained
mainly by mounting performance in the trade subsector,
with growth up from 6.6% in 2006 to 8.9% in 2007.
One indicator of strengthening public consumption was
2 The textile industry availed only 60.2% of the total Rp255 billion interest subsidy.
Table 2.7
GDP Growth and Distribution by Sector
percent
Items 2004 2005 2006*2007**
2007**I II III IV
Growth (%)
Agriculture 2.8 2.7 3.4 -1.7 4.7 7.6 3.1 3.5
Mining and Quarrying -4.5 3.2 1.7 6.2 3.2 1.0 -2.1 2.0
Manufacturing 6.4 4.6 4.6 5.2 5.1 4.5 3.8 4.7
Electricity. Gas and Water Supply 5.3 6.3 5.8 8.2 10.2 11.3 11.8 10.4
Construction 7.5 7.5 8.3 8.4 7.7 8.3 9.9 8.6
Trade. Hotels and Restaurants 5.7 8.3 6.4 9.2 7.6 7.9 9.1 8.5
Transportation and Communication 13.4 12.8 14.4 13.0 12.7 14.1 17.4 14.4
Finance. Rental and Business Service 7.7 6.7 5.5 8.1 7.6 7.6 8.7 8.0
Services 5.4 5.2 6.2 7.0 7.0 5.2 7.2 6.6
GDP 5.0 5.7 5.5 6.1 6.4 6.5 6.3 6.3
Distribution of GDP (%)
Agriculture 14.9 14.5 14.2 13.8 14.4 15.1 11.9 13.8
Mining and Quarrying 9.7 9.4 9.1 9.1 8.8 8.4 8.6 8.7
Manufacturing 28.4 28.1 27.8 27.5 27.3 27.1 27.6 27.4
Electricity. Gas and Water Supply 0.7 0.7 0.7 0.7 0.7 0.7 0.7 0.7
Construction 5.8 5.9 6.1 6.1 6.1 6.1 6.5 6.2
Trade, Hotels and Restaurants 16.4 16.8 16.9 17.1 17.1 17.2 17.7 17.3
Transportation and Communication 5.8 6.2 6.8 6.9 7.1 7.2 7.9 7.3
Finance. Rental and Business Service 9.1 9.2 9.2 9.4 9.3 9.1 9.6 9.4
Services 9.2 9.2 9.2 9.3 9.3 9.0 9.5 9.3Source: BPS-Statistics Indonesia

35
In 2007, agricultural sector growth reached 3.5%, up
slightly from the 2006 growth of 3.4%. This upturn
came largely from stronger performance in the food
crops subsector, and especially the paddy crop, a
major factor in agricultural sector growth (Table 2.8).
Paddy production was up in response to improved
productivity in Java and expansion of agricultural land
outside Java. Increased rubber and oil palm production,
on the other hand, came in response to robust export
demand during 2007 (Chart 2.34).
the upswing in trading activity reported in the Bank
Indonesia retail survey (Chart 2.30). Added to this,
loading and unloading data for the four major ports
(Belawan, Tanjung Priok, Tanjung Perak and Makassar)
pointed to increased activity (Chart 2.31). The hotels
and restaurants subsector also forged ahead with
growth reflected in higher hotel occupancy rates and
foreign tourist arrivals (Chart 2.32 and 2.33).
Increased production and rising export demand
provided added momentum for the agricultural sector.

36
The mining and quarrying sector registered increased
growth at 2.0% in 2007, mainly on the strength of the
non-oil and gas sector. The major growth commodities
in this subsector were coal and nickel ore (Chart 2.35).
In the oil and gas subsector, growth was negative due
to low levels of investment, falling productivity and
closure of some oil wells.
The transport and communications sector grew by a
robust 14.4%, as in the preceding year. Growth in the
communications subsector was again strong, providing
the main driving force as competition mounted among
telephone operators. This has led to more aggressive
innovation and business expansion that has in turn
fuelled growth in numbers of telephone subscribers,
with cellular telephones in the lead. At end-2007, the
number of cellular telephone subscribers in Indonesia
reached 80 million (Chart 2.36). The transportation
subsector, however, underwent more subdued growth
because of the spate of accidents involving various
modes of transportation at the beginning of the year
(Chart 2.37).
Growth was also up in the construction sector. With
construction investment on the rise, the construction
sector take the lead at 8.6% (yoy), up from 8.3%
(yoy) in 2006. Key to the resurgent construction was
investor confidence in rising public purchasing power
and the various measures taken by the Government
for implementation of infrastructure projects. Renewed
expansion in the construction sector was reflected
in high growth in commercial properties, including
shopping centres, apartments and condominiums
(Table 2.9).
Labor
The upswing in economic growth during 2007 was
accompanied by increased absorption of labor that
produced some reduction in unemployment. In the
latest BPS data, Indonesia’s workforce in August
2007 stood at 109.9 million, up 3.6 million compared
to August 2006 (Chart 2.38). This expansion in the
workforce was accompanied by higher numbers of
workers in employment. In August 2007, the total
employed population mounted by 4.5 million compared
to August 2006. Of this working population, 69.1%
were employed in the informal sector and the remainder
in the formal sector (Chart 2.39). The steeper increase
in numbers of employed compared to the workforce
contributed to a downward trend in the percentage of
open unemployment to 9.1% in August 2007 compared
to 10.3% in August 2006.
Table 2.8
Paddy Harvested Area and Production
Harvested Area (Ha)
Harvest/Ha(Ku/Ha)
Product (ton)
2005 11,839,060 45,74 54,151,097
2006 11,786,430 46,20 54,454,937
2007* 12,124,827 47,05 57,051,679Source: BPS-Statistics Indonesia* Provisional figures

37
are employed in agriculture, trade and industry at
41.0%, 20.6% and 12.4% respectively (Table 2.10).
As in the past, the prevailing low educational levels
in the workforce affected productivity. Over 35%
of Indonesian workers have only primary school
education, followed by workers with junior high
school, senior high school and no school education
at all (Chart 2.40). As a result, unemployment fell
among the lesser educated, in contrast to the upward
unemployment trend among more highly educated
The composition of the Indonesian workforce remained
unchanged, with agriculture providing the largest
source of employment. During 2007, the labour-
intensive sectors of agriculture, trade and industry
were able to absorb new workers at the rate of 2.7%,
7.0% and 4.0%. At the same time, higher employment
levels in high-growth sectors, such as transport and
communications, financial and business services
and the construction sector were insufficient to bring
about a change in the composition of the workforce in
Indonesia. The largest numbers of workers, like before,

38
members of the workforce (Table 2.11). The relatively
unchanged proportion of workers by educational
background has affected worker productivity, which
has shown no significant improvement since 2000.
Measured by GDP output (millions of rupiahs) per
worker, labour productivity has changed little, edging
up by a thin margin from Rp19.4 million per worker in
2006 to Rp19.6 million in 2007 (Chart 2.41).
Welfare
The number of Indonesians living in poverty fell in
2007 as unemployment eased. Measured annually,
the total population living below the poverty line fell to
37.2 million (16.6%) from 39.3 million (17.8%) in 2006,
representing an improvement of 2.1 million (Table 2.12).
The reduction in poverty was more pronounced in
rural areas at 1.2 million, while numbers of urban poor
fell by 0.9 million. This improvement is closely linked
to the robust growth in the agricultural sector during
the year under review, which generated increased
employment for rural workers and thus contributed to
poverty reduction in rural communities. Despite this,
the ratio of rural poor to total impoverished citizens
in Indonesia remained high at 63.4%. In percentage
terms, the proportion of urban poor and rural poor
eased to 12.5% and 20.4% from 13.4% and 21.9% in
the preceding year.
The poverty gap index3 and poverty severity4 index
eased in 2007 despite a surge in 2006 due to the effect
of the fuel price hike in October 2005. The poverty gap
index showed an improving trend over the 1999-2005
period with a narrowing in the average gap between
spending by impoverished citizens and the poverty
line. Alongside this, the poverty severity index, which
mounted in 2006, pointed to a prevailing increase in
3 This is a measure of the average gap in spending by the poor compared to the poverty line.
4 The higher the poverty index, the greater the spending disparities among the poor.
expenditure disparities among the poor. The year 2007
saw a lessening in both the poverty gap index and
poverty severity index, with the poverty gap index falling
to 3.0 and poverty severity index to 0.8 (Table 2.13
and Table 2.14).
Analyzed by distribution, the poverty gap and poverty
severity indices were more pronounced in rural rather
than urban areas. On a more detailed level, the
magnitude of poverty gap in rural areas was more
pronounced than in urban areas, a condition that saw
little change from 1999 to 2007. This indicates that
average spending by the rural poor is still markedly
below the rural poverty line. A similar condition was
also evident in the higher poverty severity index for rural
areas compared to urban centres. This indicates that
spending disparities among the rural poor are far more
severe than for the urban poor.
Table 2.9
Growth of Commercial Property
Property TypesCumulative by Quarter II-2005
Cumulative by Quarter II-2006
Cumulative by Quarter II-2007
Yearly Growth on Quarter II-2006 (%)
Yearly Growth on Quarter II-2007 (%)
Office (million m2) 5.15 5.19 5.41 0.78 4.24
Shopping Center (million m2) 2.00 2.43 2.56 21.50 5.35
Apartment (unit) 16,304 19,601 28,371 20.22 44.74
Condominium (unit) 36,694 44,204 54,284 20.47 22.80
Industry (ha) 7,166 7,246 7,304 1.12 0.80Source: Procon Indah Research, Q2-2007.

39
Per capita income mounted in 2007, consistent with
the improvement in welfare indicators. During the year,
per capita income reached US$1,947.1, a rise of 15%
over 2006 (Table 2.15). The stronger per capita income
was closely tied to rapid economic growth in nominal
terms during 2007 alongside moderate population
growth. Despite this, income distribution showed little
improvement. Based on BPS calculations, the Gini
coefficient in 2007, which measures income disparities,
mounted slightly compared to 2006 (Table 2.16). This
is indicative of a worsening trend in income disparities,
marked by rising incomes in high income brackets in
contrast to a deteriorating trend for middle and low
income earners.
The improved welfare in 2007 contributed significantly
to the progress achieved towards the Millennium
Development Goals (MDGs) for 2015. The World
Bank in its MDGs report for 2007/2008 lists Indonesia
as having reached most of the targets set out in
the 8 MDGs. In the area of poverty and hunger, the
proportion of population living on US$1 per day has
been reduced to 7.5%, below the targeted 10%.
Despite this, the World Bank noted lack of significant
improvement in other poverty indicators, such as
poverty depth and the proportion of consumption by
the poor. Other indicators of progress are the drop
Table 2.10
Growth of Labor Force and Labor Force by Sector
Sector
2005 2006 2007 Growth of Labor Force
February November February August February August2005-2006 2006-2007
Nominal (%) Nominal (%)
Agriculture 41,814.2 41,309.8 42,323.2 40,136.2 42,608.8 41,206.5 -1,173.6 -2.84 1,070.2 2.67
Mining 808.8 904.2 947.1 923.6 1,020.8 994.6 19.4 2.14 71.0 7.69
Manufacturing 11,652.4 11,953.0 11,578.1 11,890.2 12,094.1 12,368.7 -62.8 -0.53 478.6 4.02
Electricity, Gas and Water
Supply
186.8 194.6 207.1 228.0 247.1 174.9 33.4 17.17 -53.1 -23.30
Construction 4,417.1 4,565.5 4,374.0 4,697.4 4,397.1 5,252.6 131.9 2.89 555.2 11.82
Trade 18,896.9 17,909.1 18,555.1 19,215.7 19,425.3 20,554.7 1,306.6 7.30 1,339.0 6.97
Transportation 5,552.5 5,652.8 5,467.3 5,664.0 5,575.5 5,958.8 11.2 0.20 294.9 5.21
Finance 1,042.8 1,141.9 1,153.3 1,346.0 1,252.2 1,399.5 204.1 17.88 53.4 3.97
Services 10,576.6 10,327.5 10,572.0 11,355.9 10,962.4 12,020.0 1,028.4 9.96 664.1 5.85
Total 94,948.1 93,958.4 95,177.1 95,456.9 97,583.1 99,930.2 1,498.5 1.59 4,473.3 4.69
Source: BPS-Statistics Indonesia

40
in the child mortality rate and the increased numbers
of children enrolled in primary and junior high school
education.
Pro-Growth Policies
In 2007, real sector policy implemented through an
integrated combination of policies was focused on
accelerating economic growth in pursuit of the 6%
average economic growth target envisaged in the
2004-2009 Medium Term Development Plan (RPJMN).
The importance of achieving higher, sustainable
economic growth has prompted the Government to
redouble its commitment and effort in the planning and
implementation of each policy. In 2007, the Government
launched Presidential Instruction (Inpres) No. 6 of 2007,
a policy package for accelerated real sector expansion
and empowerment of MSMEs. This package builds
on previous intersectoral policies by accelerating
the implementation of past policies5 and introducing
some new measures. The policy package consists
of 141 individual policies grouped by: i) improvement
of the investment climate; ii) financial system reform;
iii) accelerated construction of infrastructure; and iv)
empowerment of MSMEs. As of November 2007, the
Government achieved most of the targets laid down in
the Inpres while work on 47 further policy actions was
ongoing (Table 2.17).
The Government has launched a range of initiatives to
promote more vigorous investment growth. To address
the combination of a lack of comprehensive resolution
of domestic problems and mounting competition with
neighboring countries, improvements to the investment
climate became one of the main priorities in policy
implementation throughout 2007. Government actions
5 Mainly Inpres No. 3 of 3006 concerning Improvement of the Investment Climate.
for improvement of the investment climate covered
3 main areas: institutional provisions, expeditious
movement of goods and customs processing and
tax administration reform. From the institutional
side, one effort to promote investment involved the
promulgation of Act No. 25 of 2007 concerning
Investment. Important breakthroughs in the law aimed
at promoting investment include expansion in the
scope of investment categories, investor criteria, lines
of business and licensing. Concerning the expeditious
movement of goods and customs processing, the
Table 2.11
Unemployment by Education
(percentage of total unemployment)
Education August 2006 August 2007
Not Attending Formal Education 1.6 0.9
Not Finished Elementary School 5.6 4.4
Elementary 23.7 21.8
Junior High School 25.0 22.6
High School 38.0 40.7
Diploma 2.5 4.0
University 3.6 5.7
Total 100 100Source: BPS-Statistics Indonesia

41
Government issued several regulations that essentially
slashed import tariffs on several commodities used in
investment and development of productive sectors.
In addition, the Government has streamlined customs
clearance procedures, reducing average processing
time to 30 minutes in the green channel and 3 days
for the red channel. In the area of tax reform, new
regulations provide income tax and VAT relief for
investment-related activities.
In 2007, the Government also emphasized financial
sector reform with the strengthening of financial system
stability covering the full range of banks, non-bank
financial institutions and the capital market. Policy
actions included strengthening of the coordinating
mechanism for financial institution authorities and
preparation of the financial system safety net. Added
to this, the Government successfully accomplished
the resolution of bad debt at some state banks, a
move expected to boost public confidence in banking
institutions and in so doing bolster overall financial
system stability.
Empowerment of MSMEs is another measure designed
to promote higher economic growth and reinforce the
structure of the economy. During 2007, empowerment
of MSMEs included actions for improved MSME access
to financing, entrepreneurship and human resources
development, market expansion for MSME products
and regulatory reform. To ensure greater access to
financing, the Government issued 13,000 land titles in
various regions for use as collateral in MSME loans.
The Government also completed the initial stage of
recapitalizing the MSME loan guarantee institution and
issuing regulations on the operation of the warehouse
receipt system as an instrument for MSME financing.
Table 2.12
Poverty Line and Number of People Living in Poverty
Area/Year
Poverty Line (Rp/capita/month) People Living in Poverty
(millions of people)
Percentage Food Non-Food Total
Town
2005 103,992 46,807 150,799 12.40 11.37
2006 126,527 48,797 175,324 14.29 13.36
2007 132,258 55,683 187,942 13.56 12.52
Village
2005 84,014 33,245 117,259 22.70 19.51
2006 103,180 28,076 131,256 24.76 21.9
2007 116,265 30,572 146,837 23.61 20.37
Town + Village
2005 91,072 38,036 129,108 35.10 15.97
2006 114,619 38,228 152,847 39.05 17.75
2007 123,992 42,704 166,697 37.17 16.58Source: BPS-Statistics Indonesia, Susenas Panel Data on February 2005, March 2006 and 2007.
Table 2.13
Poverty Depth Index
Year Town Village Town + Village
1999 3.52 4.84 4.33
2000 1.89 4.68 3.51
2001 1.74 4.68 3.42
2002 2.59 3.34 3.01
2003 2.55 3.53 3.13
2004 2.18 3.43 2.89
2005 2.05 3.34 2.78
2006 2.61 4.22 3.43
2007 2.15 3.78 2.99Source: BPS-Statistics Indonesia, February 2007
Table 2.14
Poverty Severity Index
Year Town Village Town + Village
1999 0.98 1.39 1.23
2000 0.51 1.39 1.02
2001 0.45 1.36 0.97
2002 0.71 0.85 0.79
2003 0.74 0.93 0.85
2004 0.58 0.9 0.78
2005 0.6 0.89 0.76
2006 0.77 1.22 1
2007 0.57 1.09 0.84Source: BPS-Statistics Indonesia, February 2007

42
obstacles hampering construction of infrastructure are
difficulties with land expropriation. To resolve this, the
Government has issued a regulation providing clarity on
land expropriation in the public interest. A related action
for institutional strengthening was the establishment
of a Rp2 trillion guarantee fund in the 2007 budget
dedicated for land expropriation and infrastructure
project loan guarantees. At the same time, ten pilot
projects commenced in 2006 were approaching the
stage for actual construction.
The policy for accelerated economic growth is
also supported by measures to strengthen public
purchasing power, particularly among low-income
groups. In 2007, the Government continued the
provision of direct and indirect subsidies and transfers
to low-income groups. Although no longer providing
direct cash transfers, the Government operates other
aid schemes such as school operational assistance,
educational bursaries and food subsidies for poor
families.
Table 2.17
Inpres No. 6/2007 Target Achievement
Program Planning Realization
Investment Climate Repair 49 40
Financial Sector Reformation 36 28
Infrastructure Development Acceleration
40 13
MSMEs Empowerment 34 28Source: Office of Coordinating Minister for the Economy
Table 2.16
Gini Ratio
Category of Citizen
2002 2003 2004 2005 2006 2007
40% lowest 20.92 20.57 20.80 18.81 19.75 19.10
40% middle 38.89 37.10 37.13 36.40 38.10 36.11
20% highest 42.19 42.33 42.07 44.78 42.15 44.79
Gini ratio 0.33 0.32 0.32 0.36 0.33 0.37Source: BPS-Statistics Indonesia
Table 2.15
Income per Capita
GDP Nominal(billions of $)
GDP per Capita($/person)
2000 165.6 807.2
2001 164.5 791.2
2002 198.9 944.0
2003 237.3 1115.7
2004 256.7 1116.6
2005 288.4 1256.6
2006 369.4 1662.6
2007 438.1 1947.1Source: BPS-Statistics Indonesia
A conducive investment climate also depends on
adequate quality and quantity of infrastructure, and
for this reason, the Government pursued a series
of actions in 2007 to accelerate the construction of
infrastructure. To this end, new policies were issued to
improve regulatory framework, reinforce institutional
structures and strengthen management. Among the

43
Contrary to the prevailing opinion that a loose, expansive
monetary policy is the right choice for promoting
economic growth and rescuing the poor, research1
indicates that a prudent monetary policy targeting low
inflation and stable macroeconomic conditions in fact
will bring down poverty levels in the long run. Using a
regional database covering 26 provinces in Indonesia for
the 1984-2005 period, this study offers empirical proof
that prudent monetary policy is pro-poor.
In theoretical terms, a relaxed monetary policy will
reduce unemployment and boost output and inflation
in the short-term. However, the benefits of such a
policy are short-lived because of the existence of
business cycle and the aversion to high inflation, and
therefore a loose monetary policy cannot produce
a permanent boom. On the contrary, a prudent,
consistent and credible monetary policy is able to
maintain low inflation over the long-term and stabilize
fluctuations in aggregate demand. Low inflation in the
long run and macroeconomic stability both represent
positive conditions that encourage investment, and
can therefore be relied on to generate higher levels
of economic growth. Higher economic growth can
in turn bring permanent improvement in the welfare
of the poor. A study by Easterly and Fischer (2001)
demonstrates a correlation between poverty reduction
and lower inflation. Subsequently, Romer and Romer
(2002) successfully disaggregated the short run and
long run effects of inflation on poverty. In the short
run, there is no guarantee that high inflation will have
a positive effect poverty reduction, but in the long run,
this inflation will inevitably have a negative bearing on
poverty. In regard to macroeconomic stability, Agenor
(2004) demonstrates that policy-driven improvement
in macroeconomic stability tends to increase savings
and investment and is therefore conducive to economic
growth and poverty reduction.
1 Munandar, Kurniawan, and Santoso (2007), Working Paper “In Search of a Pro-Poor Monetary Policy: Study Using Regional Data from Indonesia”.
Short Run Analysis
The research draws on annual national and regional
data for Indonesia over the past two decades (1984-
2005). Monetary policy performance is measured by the
unemployment rate and short-term inflation (measured
with the annual GDP deflator). The short-term regression
specifications are built on the belief that the annual
change in poverty levels is correlated to the dynamics of
unemployment or the level of inflation during that year. In
more formal terms, the specifications of the short-term
regression model are as follows:
∆yt=a1+b1∆x1t+∑djdj+e1t
∆yt=a2+b2∆x2t+∑djdj+e2t
∆yt=a3+b3∆x1t+b4∆x2t+∑djdj+e3t
in which:
∆yt=yt–yt-1 : change in poverty level during year t,
∆x1t=x1t–x1,t-1 : dynamics of unemployment levels
in year t,
∆x2t=x2t–x2,t-1 : Inflation during year t,
dj : dummy variable for sub-sample j.
The estimates show that in the short run (1 year),
change in the unemployment rate is significantly
correlated (0.992) with change in the poverty level
(Table 1). At the same time, a negative correlation
was observed between inflation and the poverty level
(-0.130). Rising inflation brought about by a loose
monetary policy will stimulate aggregate demand and
in turn have a positive effect in reducing poverty. The
second finding above confirms the widely accepted
theory in which an expansive (contractive) monetary
policy will stimulate (depress) economic activity.
In Search of a Pro-Poor Monetary Policy

44
Long Run Analysis
The long run analysis uses cross-sectional data from
provinces in 2005 in conjunction with panel data for all
provinces for the 1984-2004 period. Long-term inflation
is calculated using average annual inflation (GDP
deflator) over that period. Macroeconomic instability is
determined in using a standard deviation from nominal
GDP growth during 1984-2004. The poverty level is
determined by the proportion of a specified population
(national or regional) living in poverty2. Monetary policy
performance uses an approach involving long-term
inflation and macroeconomic instability. The model
used is as described below, in which the independent
variables refer to a specific reference year (2005), while
explanatory variables are formed from long-term data
(20 years) over the preceding period (1984-2004):
y1=r1+g1x1i+∑fjdj+x1i
y2=r2+g2x2i+∑fjdj+x2i
y1=r3+g3x1i+g4x2t+∑fjdj+x3i
in which: y1 – poverty level in province i during 2005.
2 Data obtained from the Central Statistics Agency (BPS).
x1i – long-term inflation rate in province i
(calculated from average inflation in
1984-2004)
x2i – macroeconomic instability in province
i (standard deviation in nominal GDP
growth, 1984-2004).
The regression (Table 2) indicates that long-term high
inflation and unstable macroeconomic conditions are
positively correlated with poverty (with coefficients of
3.132 and 1.295 respectively). The two correlations are
statistically significant, except when both variables are
included together. Alongside this, dummy variables
are used for provinces with different characteristics
(outliers). These provinces are Aceh and Maluku, both
regions of past or present conflict. Added to these are
the provinces of Jakarta, East Kalimantan and East
Nusa Tenggara, which are differentiated from other
regions by endowment. Jakarta and East Kalimantan
are blessed with an abundance of natural resources,
while resources in East Nusa Tenggara are scarce. The
Table 1
Short Term Regression
Changes of Poverty Rate and Macroeconomics
Model 1 Model 2 Model 3
C -0.922 -0.551 -0.808
-3.024 -1.896 -2.494
0.009 0.077 0.026
Changes of Poverty Rate 0.992** 0.744
2.378 1.545
0.031 0.145
“Changes of Inflation” -0.130* -0.074
-1.99 -1.021
0.065 0.325
1997 5.117** 4.815** 5.235**
4.144 3.813 4.227
0.001 0.002 0.001
1998 2.602* 12.803** 7.918
1.954 2.818 1.474
0.07 0.013 0.163
1999 -0.036 -10.302* -5.759
-0.031 -2.005 -1.005
0.976 0.063 0.332
R2 0.666 0.636 0.689
S.E.E 1.141 1.191 1.139Note: ** Significant at level 5% * Significant at level10%Dependent variable is poverty rate.Three numbers on each variables is estimated coefficient, absolute value of t-statistic and p-value.
Table 2
Long Term Regression
Poverty Rate and Macroeconomics
Model 1 Model 2 Model 3
C -0.205 0.009 -0.174
-1.166 0.213 -1.239
0.258 0.833 0.231
Long Term Inflation 3.132** 1.691
2.139 1.36
0.046 0.191
Macroeconomics Instability 1.295** 1.141**
4.039 3.426
0.001 0.003
NAD 0.153** 0.136** 0.155**
2.177 2.441 2.75
0.042 0.025 0.013
Maluku 0.200** 0.190** 0.209**
2.823 3.386 3.689
0.011 0.003 0.002
DKI Jakarta -0.180** -0.120* -0.153**
-2.442 -2.163 -2.573
0.025 0.044 0.019
East Kalimantan -0.071 -0.116** -0.122**
-1.029 -1.985 -2.127
0.317 0.062 0.048
NTT 0.198** 0.226** 0.253**
2.602 3.705 4.023
0.018 0.002 0.001
R2 0.511 0.674 0.704
Adj. R2 0.357 0.57 0.589
S.E.E. 0.066 0.054 0.053

45
coefficient estimates of dummy variables confirm the
view that conflict zones and poorly endowed regions
tend to have higher levels of poverty than regions with
more robust economic capacity.
The conclusion from these findings is that in the long
run, monetary policy that safeguards macroeconomic
stability and consistently maintains low inflation over
the long-term will have significant impact in reducing
poverty levels.
Policy Implications
An expansive monetary policy may achieve poverty
reduction in the short run. However, business cycle
fluctuations and aversion to high inflation mean that any
positive effect is only temporary. In the long run, low
inflation and macroeconomic stability are significantly
correlated with lower poverty levels. A prudent monetary
policy (maintaining stable prices and macroeconomic
conditions) has a permanent positive effect in reducing
poverty. The findings in this research support the
conclusion that a prudent monetary policy is a pro-poor
monetary policy.

46
Halaman ini sengaja dikosongkan
46

Chapter 3
Regional Economic Developments

48
At the regional level, economic conditions improved during 2007 with adequately strong growth and relatively stable inflation in some regions. Analyzed by contribution, the economies in the Java, Bali and Nusa Tenggara (Jabalnustra) region and the Jakarta-Banten region provided the strongest driving force for national economic growth. At the same time, brisk economic growth in Kalimantan, Sulawesi, Maluku and Papua (Kali-Sulampua) strengthened that region’s contribution to national growth. On the demand side, regional economic growth was generated by vigorous expansion in consumption and exports. Investment growth also gathered momentum, particularly in the mining and plantations sectors. Concerning prices, national inflation was kept stable due to relatively low levels of inflation in some of the most important regions in the national inflation figure. While some regions have made considerable strides in economic performance, substantial disparities in growth and inflation remain. This calls for a common effort for reduction of interregional income disparities.
Chapter 3: Regional Economic Developments
Economic Performance at the Regional Level
Regional economies demonstrated improved trends
in 2007, reflected in high economic growth and
stable inflation in a number of regions. Analysed
by contribution, the most important regions for
national economic growth were Jakarta-Banten
and Jabalnustra. With growth at 6.4% and 6.2%,
respectively Jakarta-Banten and Jabalnustra
contributed 4.0% of national economic growth. At the
same time, the Kali-Sulampua and Sumatera regions
took on an expanded role in the growth of the national
economy. Kali-Sulampua contributed 1.0% to national
growth, following the brisk 6.8% economic growth
in that region. Similarly, the Sumatera contribution to
national economic growth widened to 1.3%.
On the demand side, consumption again provided the
main driving force for growth in all regions. Expanding
consumption was fuelled by more robust purchasing
power in line with the increase in real incomes.
Also key to the high regional growth were mounting
exports, particularly in the Kali-Sulampua, Jabalnustra
and Jakarta-Banten regions. In Sumatera and Kali-
Sulampua, economic growth was also driven by
resurgent investment activity.
On the supply side, the major contributing sectors to
regional economic growth were trade, manufacturing
and agriculture. Growth in the trade and industry
sectors was especially strong in Jabalnustra. Further
impetus for economic expansion in Jabalnustra,
Sumatera and Kali-Sulampua came from growth in
the agricultural sector. Despite this, agriculture growth
did not fully reflect a fundamental improvement in
that sector, given ongoing problems related to the
diminishing area of arable land and limited productivity
(Box: Agricultural Sector Role in Decline). National
economic growth was also supported by robust
expansion in the non-oil and gas mining subsector in
the Kali-Sulampua region and the communications
subsector in Sumatera.
The stable national inflation during 2007 owes much
to the low levels of inflation in key contributing regions,
most importantly Jakarta-Banten and Jabalnustra. In
both regions, low foodstuffs inflation in the absence
of distribution problems helped keep overall inflation
down. However, some cities registered above national
inflation levels. In 2007, inflation surpassed the national
average in 25 cities, up from 23 cities in the previous
year. Banda Aceh reported the highest inflation for any
city (10.44%), while inflation was lowest in Pangkal
Pinang (2.60%). The widely varying level of inflation
among different cities is explained mainly by differences
in foodstuffs and housing inflation. Strong deviation
in the two inflation categories is partly the result of
supply shocks involving shortages and distribution
bottlenecks.

49
The improving trend in regional economic growth and
inflation had a positive impact on prosperity indicators.
Unemployment fell in all regions, while per capita
incomes increased. The relatively stable inflation,
declining unemployment and higher nominal wage
levels in some regions produced an overall increase in
public purchasing power. Further support for improved
purchasing power came from strong price increases for
plantation commodities, particularly in regions where
the plantations subsector plays a predominant role in
the local economy.
Regional economic performance was again marked
by growth disparities. The main growth centres have
historically been concentrated in Java, with the largest
growth contribution generated in Jakarta, followed
by West Java and East Java provinces. Economic
growth in some provinces lagged behind others, with
average growth above 5.95%. These provinces include
Aceh, East Kalimantan, West Nusa Tenggara, Bangka
Belitung and Riau, where growth was recorded at
0.04%, 2.5%, 3.1%, 3.5% and 4.3%, respectively.
Compared to the previous year, the deviation in
provincial economic growth widened from 1.7% to
1.8%. One factor explaining the low growth rates in
these provinces is limited infrastructure.
Inflation in some regions was again relatively still high,
above the national level. In these regions, inflation
was spurred by escalating prices in the foodstuffs,
processed foods and housing categories caused by
supply shocks. Disparities in welfare were also evident
with varying per capita income among provinces,
particularly between the Jakarta-Banten and Kali-
Sulampua regions due to significantly different
economic growth levels in provinces.
Sumatera
Economic growth in the Sumatera region reached
5.5% in 2007, up from the previous year’s growth at
4.6%. On the demand side, consumption was the main
driving force for growth in this region. Sumatera also
recorded significantly increased investment activity,
making it a leading region in investment growth. On the
supply side, the most important contribution to growth
came from the agriculture, trade and construction
sectors. Key to this performance was expanding role
of bank financing in line with bank credit expansion.
Concerning prices, inflation showed a declining trend,
despite relatively high inflation in some cities. Lower
inflation in Sumatera was the result of falling inflation in
the foodstuffs category.
The resurgent economic growth in Sumatera was
propelled by higher growth rates in most provinces
with growth forging ahead particularly in the southern
and central zones of the island (Table 3.1). Analyzed by
administrative region, the provinces of North Sumatera,
West Sumatera and South Sumatera were the leading
contributors to the improved economic performance
in the Sumatera region. Higher growth was generated
mainly by buoyant performance in the plantations

50
subsector, which represents one of the primary
growth engines in the two provinces. Other provinces,
notably Aceh and Riau, recorded only low growth
due to sluggish performance in the mining sector and
specifically in the oil and natural gas subsector, the
main source of growth in both provinces. At the same
time, Aceh has received only limited stimulus for the
local economy from the post-tsunami rehabilitation and
reconstruction. There, the ongoing rehabilitation and
reconstruction programme has not fully functioned as a
force for turning the wheels of the local economy.
On the demand side, more vibrant economic growth
in the Sumatera region was driven by consumption
and investment (Table 3.2). Consumption mounted
considerably during 2007. Increased household
consumption followed improvement in farmer terms
of trade and real increases in the provincial minimum
wage in most provinces (Chart 3.1 and 3.2). Gross fixed
capital formation advanced at a brisk pace in Sumatera.
Key to investment growth was improvement in
infrastructure, such as the construction and repair work
to the eastern Sumatera highway, as well as redoubled
investment in plantations. Sumatera also reported more
robust export growth during 2007 on the strength of
mounting demand for plantation commodities, such
as crude palm oil (CPO) and derivative products, in
addition to rubber and rubber products (Chart 3.3).
Disaggregated by sector, the most important
contribution to growth in Sumatera came from the
agriculture, trade and construction sectors. Agriculture
sector growth forged ahead at a brisk clip during 2007,
driven by robust growth in the plantation subsector
(rubber and palm oil). One factor boosting rubber
and palm oil production was the expansion of land
under cultivation for estate crops. In addition, soaring
world rubber and CPO prices spurred efforts to boost
output of palm oil and rubber. In the trade sector,
higher growth was closely linked to more vigorous
consumption and growth in trade-related sectors,
including construction and industry. Among factors
prompting renewed construction growth was the post-
tsunami reconstruction programme and expansion of
land under cultivation for oil palm estates.
Table 3.1
Regional GDP Growth in Sumaterapercent
2005 2006 2007
Sumatera Zone 4.8 4.6 5.5
North Sumatera 4.9 5.7 5.2
Central Sumatera 4.7 4.1 5.4
South Sumatera 4.6 4.5 5.7Source: Regional BPS-Statistics Indonesia.
Table 3.2
Regional GDP Growth by Expenditure in Sumaterapercent
2005 2006 2007
Sumatera Zone
Consumption 4.9 5.1 6.0
Gross Fixed Capital Formation 6.3 6.1 8.2
Net Exports 4.6 4.1 5.1Source: Regional BPS-Statistics Indonesia.

51
Opportunity for economic advancement in the
Sumatera region has come with the enactment of the
Act on the Batam-Bintan-Karimun Free Trade Zone
(FTZ-BBK) in October 2007. Under this act, the islands
of Batam, Rembang and Galang are designated free
trade zones in their entirety, while Bintan and Karimun
are designated as enclave zones. With the Free Trade
Zone in force, accelerated economic activity and
employment will not benefit only the Riau Islands
province, but also nearby areas through multiplier
effects leveraging the economic interdependencies
among these regions. Another factor supporting
economic advancement in Sumatera is financing.
Banks operating in the Sumatera region have steadily
improved their performance with depositor funds
reaching Rp203.2 trillion, up 19.6% from the preceding
year. Depositor funds are almost evenly divided among
demand deposits, saving deposits and time deposits.
Loan disbursements are also on the rise. Lending in
2007 climbed to Rp127.2 trillion, representing 28.6%
expansion over the year before. The steep rise in credit
compared to depositor funds has strengthened bank
performance, reflected in improvement in the Loan to
Deposit Ratio (LDR) (Table 3.4).
In regional fiscal management, the absorption rate in
regional budgets in the Sumatera region remains on
the lower end of the scale. In Aceh province, budget
absorption reached Rp1.4 trillion, or 35.4% of the
Rp4.0 trillion budget ceiling1. In the provinces of South
Sumatera, Bangka Belitung and Lampung, locally-
generated revenues and regional expenditure realization
averaged more than 70%. The low absorption rate is
explained by several different factors, including the
delay of launching of Regional Government projects in
the year.
Inflation in the Sumatera region reached 6.95% in 2007,
lower than in the preceding year. The falling inflation in
Sumatera is explained by a drop in foodstuffs inflation.
However, in regions such as North Sumatera and South
Sumatera (Chart 3.5 and 3.6), inflationary pressures
persisted as a result of supply shocks, which were
reflected in high volatile foods inflation. Inflation in
Sumatera, as in previous years, surpassed the national
average. Seven out of 14 cities in the Sumatera region
recorded above national levels of inflation. In the city of
Banda Aceh, inflation reached 10.44%, the highest level
for any city in Indonesia. Sumatera is heavily dependent
on goods supplied from outside the island and
between provinces on Sumatera itself, and the island
is highly susceptible to price shocks because of lack of
improvement in infrastructure.
Jakarta-Banten Region
In 2007, the Jakarta-Banten region charted 6.4%
economic growth, unchanged from the previous year.
On the demand side, consumption played a role as
1 November 2007.

52
the main driving force for growth in this region. On the
supply side, the most important contributions to growth
came from trade, financial services and construction.
In regard to financing, economic performance was
underpinned by more rapid bank credit expansion
alongside relatively high realization of regional
budget. Inflation in the Jakarta-Banten region eased
in comparison to 2006. Additionally, Jakarta-Banten
inflation was below the national average. Lower inflation
was recorded in almost all categories of goods and
services.
On the demand side, economic growth in Jakarta-
Banten was supported by rising consumption and
investment (Table 3.5). Factors spurring increased
consumption were improvement in public purchasing
power, particularly for middle and upper income
earners, and public expectations of improvement in
the economy. Investment recorded increased growth
with brisk construction of property and transportation
infrastructure in Jakarta and nearby areas.
On the supply side, economic growth in the Jakarta-
Banten region was driven by trade, financial services
Table 3.4
Banking Indicators in Sumatera
2004 2005 2006 2007
Depositor Funds
Position (Rp Trillions) 118.1 135.5 173.2 203.2
Growth (%) 15.7 19.9 21.9 19.6
Demand Deposits (Rp Trillions)
28.1 40.2 56.5 62.6
Savings Deposits (Rp Trillions)
52.6 50.9 61.7 74.8
Time Deposits (Rp Trillions)
37.5 44.4 55.0 65.8
Credit (total)
Position (Rp Trillions)** 68.5 84.8 100.9 127.2
Growth (%) 29.2 25.9 17.4 28.6
Working Capital (Rp Trillions)
30.9 39.7 47.6 61.3
Investment (Rp Trillions) 16.8 19.2 22.6 26.0
Consumption (Rp Trillions) 20.8 25.9 30.7 39.9
MSMEs (Rp Trillions)*** 44.2 57.3 69.0 86.0
Loan to Deposit Ratio 57.6 60.5 58.2 62.6
Non Performing Loan Ratio 2.4 6.8 5.8 4.7
** based on distributor bank location*** based on project location
Table 3.3
Regional GDP Growth by Sector in Sumatera
percent
2005 2006 2007
Sumatera Zone
Agriculture 2.4 2.2 4.3
Mining & Quarrying 1.6 1.6 1.5
Manufacturing 4.6 4.0 4.4
Electricity, Gas & Water 5.9 5.8 3.3
Construction 8.3 7.0 7.3
Trade, Hotels, & Restaurants 6.8 9.0 7.1
Transportation & Communication 9.7 9.7 10.2
Finance, Rental 7.0 7.7 8.2
Services 4.7 5.0 8.7Source: Regional BPS-Statistics Indonesia

53
and construction. Growth in the trade sector was
consistent with mounting consumption. Reflecting
the stronger performance in trade was the volume
of loading and unloading at the ports of Tanjung
Priok, Banten and Sunda Kelapa. In the financial
sector, resurgent growth in credit and depositor
funds improved bank performance. Vibrant growth in
the construction sector was fuelled by property and
transport infrastructure development.
In the Jakarta-Banten region, bank performance
reached new heights in 2007. Depositor funds mounted
to Rp725.7 trillion, an increase of 13.6% over the
preceding year. Time deposits comprised the largest
share of bank funding at Rp401.8 trillion, or 55.4% of
total depositor funds. Loan disbursements were also
up 26.4%, bringing total credit outstanding to Rp503.8
trillion. Improved banking performance in 2007 was
also reflected in the stronger LDR and falling NPLs
(Table 3.7).
Regional fiscal management in 2007 was marked
by quite high realization rates in regional budgets for
Jakarta and Banten provinces. In Jakarta, realized
capital expenditures at the end of 2007 stood at 81.7%
of budget allocations, significantly improved from the
outcome one year before. Nevertheless, the largest
share of realized budget expenditures was recorded
in recurrent expenditures at 87.4%. In the province of
Banten, realized capital expenditures in 2007 reached
87.8% of budget, down from the 2006 outcome.
Inflation in Jakarta-Banten eased to 6.05% for 2007
from the 2006 level of 6.15% in response to falling
inflation in the foodstuffs and housing categories. One
factor contributing to reduced inflation was the plentiful
supply of goods to Jakarta, including rice and cooking
oil. Inflation in the Jakarta-Banten region was below the
national inflation rate.
Java-Bali-Nusa Tenggara (Jabalnustra)
Economic growth in the Java, Bali and Nusa Tenggara
(Jabalnustra) region reached 6.2% in 2007, well ahead
of the previous year’s growth of 5.4%. Demand-
side growth was fuelled mainly by consumption.
On the supply side, growth impetus came from
the heavyweight sectors of trade, agriculture
and manufacturing. Availability of financing in the
Jabalnustra region improved through bank credit
expansion that arrived at 20.9%, while regional budget
realization in some provinces also improved over the
preceding year. Inflation in Jabalnustra was down
in comparison to 2006 and also below the national
inflation rate. The downward trend is a result of
Table 3.5
Regional GDP Growth by Expenditure in Jakarta-Banten
percent
2005 2006 2007
Consumption 6.5 6.7 7.2
Gross Fixed Capital Formation 5.2 4.4 5.6
Exports 8.6 9.4 5.6
Imports 5.6 4.2 11.4Source: Regional BPS-Statistics Indonesia
Table 3.6
Regional GDP Growth by Sector in Jakarta-Banten
percent
2005 2006 2007
Jakarta-Banten Zone
Agriculture 2.3 2.4 1.2
Mining & Quarrying 1.6 0.4 2.2
Manufacturing 5.8 5.5 4.3
Electricity, Gas & Water 5.6 5.1 2.4
Construction 6.0 7.6 8.1
Trade, Hotels & Restaurants 7.1 6.3 7.9
Transportation & Communication 11.2 12.7 14.1
Finance, Rental 4.7 4.3 5.4
Services 5.6 5.2 6.6Source: Regional BPS-Statistics Indonesia
Table 3.7
Banking Indicators in Jakarta-Banten
2004 2005 2006 2007
Depositor Funds
Position (Rp Trillions) 529.8 582.5 628.7 725.7
Growth (%) 8.2 16.9 5.0 13.6
Demand Deposits (Rp Trillions)
146.8 160.1 175.9 200.6
Savings Deposits (Rp Trillions)
95.6 85.9 99.2 123.3
Time Deposits (Rp Trillions) 287.4 336.4 353.5 401.8
Credit (total)
Position (Rp Trillions)** 299.7 356.1 409.5 503.8
Growth (%) 26.4 24.0 8.1 26.4
Working Capital (Rp Trillions)
158.0 190.0 225.8 275.6
Investment (Rp Trillions) 74.7 83.0 93.4 114.1
Consumptions (Rp Trillions) 67.0 83.1 90.4 114.2
MSMEs (trillions Rp)*** 63.5 85.2 97.8 131.7
Loan to Deposit Ratio 57.2 60.6 62.4 69.4
Non Performing Loan Ratio 6.0 8.7 6.8 4.9
** based on distributor bank location*** based on project location

54
declining inflation in almost all categories of goods and
services.
The accelerated growth in Jabalnustra is powered
mainly by West Java province, which enjoys the highest
growth rate and is also the most important contributor
to growth in Jabalnustra overall. The East Java zone
ranked second as an engine of growth, followed by
the Central Java zone. The robust growth in the three
zones of Java is an indication that flooding on the island
has not significantly impacted economic growth in the
Jabalnustra region.
On the demand side, household consumption
and exports again provided the economic growth
momentum in the Jabalnustra region. Increased
consumption came on the back of rising purchasing
power commensurate with the real increase in the
provincial minimum wage in all provinces (Chart 3.9)
and stronger farmer terms of trade in Central Java,
East Java, Bali and West Nusa Tenggara provinces
(Chart 3.10). Exports forged ahead in West Java, led
by textiles and textile products profiting from sharply
ascending foreign demand.
Disaggregated by sector, the primary sources of
economic growth in the Jabalnustra region are trade,
Table 3.8
Development and Realization of Regional State Budget in Jakarta-BantenRp billions
DescriptionsBudget 2006
Realization up to Q4-
2006%
Budget 2007
Realization up to Q4-
2007%
DKI Jakarta
Locally - Generated Revenues 8,666.7 7,771.8 89.7 10,084.3 8,819.8 87.5
Primary Balance 6,661.0 6,459.9 97.0 7,572.1 7,445.9 98.3
Administration & Operational Expenditures 11,974.8 10,993.4 91.8 13,929.1 12,171.8 87.4
Capital Expenditures 5,828.2 4,348.6 74.6 6,142.7 5,019.3 81.7
Banten
Locally - Generated Revenues 1,126.4 1,118.0 99.3 1,306.9 1,306.2 99.9
Primary Balance 480.1 465.4 96.9 590.7 574.3 97.2
Administration & Operational Expenditures 7,021.5 651.5 92.9 828.6 626.8 75.6
Capital Expenditures 396.7 390.1 98.3 443.2 389.2 87.8

55
the back of increased output at the Cilacap refinery and
a number of oil drilling blocks.
Bank performance in the Jabalnustra region showed
steady improvement in 2007. Depositor funds reached
Rp373.1 trillion at end-2007, an increase of 13%. At
Rp149.8 trillion, time deposits represented the most
important component of bank funding (40.1% of the
total). Similarly, loan disbursements came to Rp245.7
trillion, following 20.9% expansion, with working capital
credit accounting for the largest share. Improved bank
performance was also evident in the more robust LDR
and falling NPLs ratio in the Jabalnustra region.
agriculture and manufacturing. Growth picked up in
the trade sector in line with rising consumption. One
indication of performance in this sector was the heavier
volume of goods transported out of the Jabalnustra
region. In agriculture, growth resulted from higher
production of rice and corn, both leading agricultural
commodities in this region (Table 3.10), as a result of
improved productivity. Climate change and flooding had
little effect on agricultural performance in Jabalnustra.
Alongside this, stronger performance was reported
in manufacturing, also one of the mainstay sectors of
Jabalnustra. In the West Java zone, manufacturing
growth was bolstered by strong performance in the
transportation equipment, machinery and textiles and
textile products subsectors. In the East Java zone,
manufacturing growth was recorded mainly in the
food, beverages and tobacco subsector, as well as the
paper and printed goods subsector. In the Central Java
zone, manufacturing sector performance was driven by
vigorous growth in the oil and gas refining subsector on
Table 3.10
Paddy and Corn Production in Java and Non-Java
2005 2006 2007Growth
2007 (%)
PADDY
Production (thousands ton)
Java 29,767.0 29,961.0 30,628.7 2.2
Non Java 24,389.6 24,495.6 26,413.9 7.8
Indonesia 54,156.5 54,456.6 57,042.6 4.7
CORN
Production (thousands ton)
Java 7,455.0 6,689.0 7,457.4 11.5
Non Java 5,068.7 4,921.3 5,822.0 18.3
Indonesia 12,523.7 11,610.3 13,279.4 14.4Source: BPS-Statistics Indonesia* ARAM III
Table 3.9
Regional GDP Growth in Jabalnustra
percent
2005 2006 2007
Jabalnustra Zone 5.6 5.4 6.2
West Java Zone 5.6 6.0 6.4
Central Java Zone 5.3 5.2 5.5
East Java Zone 6.0 5.8 6.0Source: Regional BPS-Statistics Indonesia.

56
Regional fiscal management in Jabalnustra was
marked by generally improved realization in 2007
regional budgets compared to the previous year. In
the province of West Java, realized direct expenditure
components reached more than 90% of budget
allocations. This high rate of realized expenditure is
explained by implementation of development projects
mainly for improvement of local government offices and
infrastructure. In Central Java, spending was dominated
by personnel expenditures at 51.9%, while capital
expenditures for public services accounted for only
10.9% of the total (Table 3.12).
The Jabalnustra region was also marked by falling
inflation, below even the national inflation figure. The
decline in inflation came in response to lower prices for
rice and other foodstuffs. Adequate supply and smooth
distribution of staple needs in the region were among
the key factors easing foodstuff inflation.
Kalimantan, Sulawesi, Maluku and Papua
(Kali-Sulampua)
The year 2007 saw brisk economic growth in the
Kalimantan, Sulawesi, Maluku and Papua (Kali-
Sulampua) region, albeit with strong inflation. Growth
in Kali-Sulampua reached 6.8%, ahead of other
regions. On the demand side, growth was driven by
consumption, exports and investment. Analysed by
sector, the largest contributions to growth came from
trade and agriculture. On the other hand, the Kali-
Sulampua region sustained a high rate of inflation at
7.77%, significantly higher than the national inflation
Table 3.12
State Expenditures Realization in Central Java
Rp billions
Description2007
Quarter I Quarter II Quarter III Quarter IV
1 Personnel Expenditures 2,123.92 2,407.30 2,501.19 2,658.47
2 Material Expenditures 423.81 706.49 720.59 724.56
3 Official Travel Expenditures 64.95 100.81 104.75 104.75
4 Maintenance Expenditures 141.31 242.75 252.22 235.49
5 Other Expenditures 1.27 1.27 1.30 1.40
6 Capital Expenditures 149.75 296.26 444.39 546.24
7 Profit Sharing and Financial Assistance Expenditure 217.49 683.54 615.19 724.68
8 Unexpected Expenditures 0.00 133.04 140.89 128.80
Total 3,122.51 4,571.44 4,780.50 5,124.3
Distribution (percentage)
1 Personnel Expenditures 68.02 52.66 52.32 51.88
2 Material Expenditures 13.57 15.45 15.07 14.14
3 Official Travel Expenditures 2.08 2.21 2.19 2.04
4 Maintenance Expenditures 4.53 5.31 5.28 4.60
5 Other Expenditures 0.04 0.03 0.03 0.03
6 Capital Expenditures 4.80 6.48 9.30 10.66
7 Profit Sharing and Financial Assistance Expenditure 6.97 14.95 12.87 14.14
8 Unexpected Expenditures 0.00 2.91 2.95 2.51
Total 100.00 100.00 100.00 100.00
Table 3.11
Banking Indicators in Jabalnustra
2004 2005 2006 2007
Depositor Funds
Position (Rp Trillions) 265.1 278.7 324.5 373.1
Growth (%) 3.4 15.1 13.8 13.0
Demand Deposits (Rp Trillions)
54.2 57.6 68.0 78.9
Savings Deposits (Rp Trillions)
109.8 105.4 123.9 144.4
Time Deposits (Rp Trillions)
101.0 115.7 132.5 149.8
Credit (total)
Position (Rp Trillions) ** 150.8 185.9 207.0 245.7
Growth (%) 24.1 25.1 10.3 20.9
Working Capital (Rp Trillions)
80.8 99.4 113.0 131.5
Investment (Rp Trillions) 17.8 20.1 21.9 25.7
Consumption (Rp Trillions) 52.2 66.5 72.1 88.5
MSMEs (Rp Trillions)*** 128.9 168.1 191.4 206.1
Loan to Deposit Ratio 58.4 63.5 61.6 65.9
Non Performing Loan Ratio 2.9 4.6 5.0 4.3
** based on distributor bank location*** based on project location

57
and international market. Alongside this, investment
gathered momentum particularly in the plantations
and mining sectors and in construction of rail links for
transporting coal.
Analysed by sector, the main sources of growth
were trade and agriculture, while mining, one of
the primary sectors in Kali-Sulampua, contributed
relatively little. Growth in trade was spurred by rising
consumption and performance in trade-linked sectors.
Agriculture sector performance improved, buoyed by
increased production in the foodcrops and plantations
subsectors. Key to this was expansion of cultivated
land and improved productivity levels. At the same time,
the mining and quarrying sector reported higher growth
compared to the previous year. Mining sector growth
picked up in the Sulawesi zone with higher levels of
nickel ore and gold production following the expansion
in underground mining operations by Papua’s largest
mining company.
Banks charted performance gains in the Kali-Sulampua
region. Bank funds mobilisation reached Rp132.9
trillion, with savings deposits comprising the largest
share at Rp55.4 trillion or 41.7% of total depositor
funds. At the same time, loan disbursements reached
Rp77.5 trillion, dominated by consumption credit.
Improved banking performance was reflected in the
steady rise in the LDR. Added to this, NPLs recorded
rate. This inflation was driven by escalating prices for
consumer goods, with foodstuffs and housing prices
most affected.
The economy in Kali-Sulampua recorded significant
growth in 2007. Driving this performance was robust
economic growth in the Sulampua region at 11.1%. In
contrast, Kalimantan recorded only moderate growth
at 3.8%. Most provinces in the Sulampua zone were
high growth performers, with the exception of North
Maluku and Maluku provinces where growth reached
5.2% and 5.1%, respectively. In the provinces of South
Kalimantan and East Kalimantan in the Kalimantan
zone, growth was similarly low at 5.3% and 2.5%,
respectively. The modest growth in East Kalimantan
and South Kalimantan is explained by slowing
performance in the mining sector.
On the expenditure side, household consumption,
exports and investment were the main growth factors
in the Kali-Sulampua region. Growth in household
consumption was buoyed by strengthened public
purchasing power, reflected in the increased provincial
minimum wage levels and farmer terms of trade in
some provinces (Chart 3.13 and 3.14). Farmer terms of
trade in Kali-Sulampua improved in response to rising
plantation commodity prices. Exports in the region
also mounted higher in line with the upward trend in
exports of primary commodities, such as coal, rubber
and CPO, fuelled by vibrant demand on the domestic

58
decline, although the NPLs ratio in the Kali-Sulampua
region was the highest compared to other regions
(Table 3.14).
Regional fiscal management was marked by strong
performance in local government budget realization.
In East Kalimantan province, realized local government
budgets at end of year reached 80%. In Central
Kalimantan, regional budget realization were at 64% of
2007 budgets. Budget administration and excessively
long tendering processes are two factors hampering
budget realization.
Inflation mounted significantly in the Kali-Sulampua
region in 2007, climbing above the national inflation
rate. Rising inflation was spurred by price movements in
the foodstuffs, housing and transportation categories.
Inflation in 12 out of the 14 cities in the Kali-Sulampua
region surpassed the national inflation rate. The high
rate of inflation is explained by supply shortages in
parts of the Kali-Sulampua region due to difficulties
with distribution and dependence on supply from
other regions and especially from Java. Reflecting
this were high rates of volatile foods inflation in some
cities, including Banjarmasin (Chart 3.15) and Manado
(Chart 3.16).
Regional Demographics
Stronger economic growth and stable inflation in
most regions helped bring gradual improvement
in the prosperity of the local population. Regional
unemployment levels eased alongside improvement
in per capita income. Welfare also improved in
response to a series of Government programmes,
including the Askeskin health insurance scheme for
impoverished families and operational assistance for
schools (BOS). Despite this, the regions have not
undergone a significant improvement in welfare, as
evident in the relatively small drop in unemployment
and poverty levels and the continued income disparities
among regions.
Labor conditions in the regions saw improvement
during 2007. Labor intake was up in all regions in line
with economic growth at the local level. The highest
increase in employed workers was recorded in the
Sumatera region, followed by Java and Sulawesi
(Table 3.15). However, the higher numbers of workers
entering employment was not followed by significant
reductions in unemployment, with intake of workers
insufficient to offset the growth in the workforce.
In Jakarta-Banten, Java, Sumatera and Sulawesi,
unemployment remains high. However, unemployment
levels are low in Bali, Nusa Tenggara, Kalimantan,
Maluku, Papua and Sumatera, and also below the
national average.
With stronger regional economic growth and low
population growth2, per capital incomes have improved.
Per capita income was up in all regions, with highest
levels recorded in Jakarta and East Kalimantan
(Chart 3.17). However, this improvement was still
marred by regional income disparities, particularly
between Jakarta-Banten and Kali-Sulampua.
These disparities are the result of several factors,
including different rates of economic growth and
population growth.
2 Source: Key Socio-Economic Indicators for Indonesia, March 2007, BPS.
Table 3.14
Banking Indicator in Kali-Sulampua Zone
2004 2005 2006 2007
Depositor Funds
Position (Rp Trillions) 75.6 85.4 111.0 132.9
Growth (%) 16.3 20.6 25.7 20.7
Demand Deposits (Rp Trillions)
16.8 23.0 36.7 42.2
Savings Deposits (Rp Trillions)
39.5 39.2 49.1 55.4
Time Deposits (Rp Trillions)
19.3 23.2 25.3 35.3
Credit (total)
Position (Rp Trillions) ** 43.4 52.6 62.0 77.5
Growth (%) 39.2 24.0 16.4 27.5
Working Capital (Rp Trillions)
17.2 20.5 24.9 31.6
Investment (Rp Trillions) 8.2 9.8 11.2 12.7
Consumption (Rp Trillions)
18.0 22.3 25.9 33.2
MSMEs (Rp Trillions)*** 33.9 43.3 51.3 64.5
Loan to Deposit Ratio 58.0 59.7 55.2 58.3
Non Performing Loan Ratio 2.7 7.1 6.1 6.0
** based on distributor bank location*** based on project location
Table 3.13
Regional GDP Growth in Kali-Sulampua Zone
percent
2005 2006 2007
Kali-Sulampua Zone 5.5 6.2 6.8
Kalimantan Zone 3.9 3.7 3.8
Sulawesi Zone 8.1 9.9 11.1Source: Regional BPS-Statistics Indonesia

59
Regional Economic Issues
Regional economies continue to be daunted by various
problems, including regional disparities in economic
growth and the growing number of cities reporting
inflation above the national average. These two
problems have led to disparities in quality improvement
in regional economies. Nevertheless, these issues
will be gradually addressed through improvements to
infrastructure and inter-agency coordination.
Higher rates of economic growth and greater
employment have helped ease poverty levels. In 2007,
the number of population living in poverty was down
in all regions compared to 2006. The steepest fall
in numbers of poor was recorded in the Sumatera
region (8.1%), followed by Jakarta-Banten (6.0%)
(Chart 3.18). However, this reduction carried less
significance, as indicated by the relatively unchanged
proportion of population in poverty to the populations of
individual regions.

60
The national economy is overwhelmed by disparities
in regional economic growth, with the steepest
differences occurring in the Kali-Sulampua and
Sumatera regions. GDP growth in some of these
provinces is well below the national growth rate.
Even in some resource-rich regions, notably Aceh,
Riau, Papua and East Kalimantan, growth is below
the national average. Compared to the previous year,
the deviation in economic growth among provinces
widened from 1.7% to 1.8%. Reasons for the sluggish
growth performance in some regions include limited
infrastructure, regional regulations that discourage
investment and overwhelming dependence of the local
economy on one particular primary sector (mining).
Inflation in most cities in Indonesia is above the national
inflation rate. According to observations over the
past 4 years, 34 cities recorded inflation above the
national rate. In these cities, inflation is fuelled mainly
by escalating inflation in the foodstuffs, processed
foods and housing categories. One underlying cause of
high inflation in these regions is the problem of supply
shocks on the market for goods (Box: Inflation Control
in the Regions). These supply shocks are caused by
such problems as supply shortages, poor infrastructure
for distribution, long span of distribution, hoarding,
charging of illegal levies and seasonal influence.
Table 3.15
Employment and Unemployment Rate by Region
Labor (millions of people)
Employment (millions of people)
Unemployment Rate (%)
August 2006 August 2007 August 2006 August 2007 August 2006 August 2007
Sumatera 21.08 21.66 18.95 19.73 10.10 8.91
Jabalnustra 61.72 64.15 55.74 58.61 9.69 8.64
Java (non Jakarta-Banten) 55.59 57.91 49.99 52.67 10.07 9.05
Bali and Nusa Tenggara 6.13 6.24 5.75 5.94 6.20 4.81
Jakarta-Banten 8.29 8.42 7.05 7.22 14.96 14.25
Kali-Sulampua 15.26 15.72 13.71 14.36 10.16 8.65
Kalimantan 6.10 6.13 5.53 5.67 9.34 7.50
Sulawesi 7.00 7.35 6.21 6.62 11.29 9.93
Papua and Maluku 2.16 2.24 1.97 2.07 8.80 7.59
Indonesia 106.39 109.94 95.46 99.93 10.28 9.11Source: BPS-Statistics Indonesia

61
Low, stable inflation is a prerequisite for sustainable
economic growth. When inflation is low and stable,
economic agents are able to engage in economic
activity on a more carefully measured basis. Producers
can set more affordable selling prices, while consumers
are able to obtain needed goods appropriate to the
purchasing power. Stable inflation and the sustainable
economic growth that it supports also help to boost
prosperity levels in the long-term, as indicated in more
robust public purchasing power, greater absorption
of manpower and stronger private incomes. These
conditions also help to improve the quality of life for
the local population, as envisaged in the mission
for regional governments in the Medium-Term
Development Plan.
National CPI inflation represents the aggregate
movement in prices of goods and services in 45 cities
across Indonesia. Analysed by weighting on a per city
basis, Jakarta is the largest contributor to national
inflation. However, if analysed by region, all regions
have a sizeable weighting in the national inflation rate
(Table 1).
Urban inflation figures for the past 4 years show that
34 cities almost consistently report inflation above the
national CPI inflation rate. The high rate of inflation in
these cities is fuelled mainly by escalating inflation in the
foodstuffs, processed foods and housing categories.
Analysis of causative factors reveals a consistent
pattern in urban inflation, with the main source of
inflationary pressure coming from fundamentals
(exchange rate pressure, high expectations and output
gap) and administered prices. However, the behavior
of price movements in the regions can be specifically
differentiated by supply and distribution of goods,
which can give rise to different levels of supply shocks
in individual areas. Shocks are attributable to various
causes, including supply shortages, poor distribution
infrastructure, long distribution lines, hoarding, illegal
levies and seasonal influence.
Table 1
Inflation Weight by Cities
Sumatera Jakarta-Banten Jabalnustra Kali-Sulampua
Lhokseumawe 0.25 Jakarta 27.66 Tasikmalaya 0.7 Pontianak 1.36
Banda Aceh 0.66 Serang/Cilegon 2.18 Bandung 6.76 Sampit 0.26
Padang Sidempuan 0.31 Cirebon 0.87 Palangkaraya 0.52
Sibolga 0.24 Purwokerto 0.69 Banjarmasin 1.93
Pematang Siantar 0.68 Surakarta 1.58 Balikpapan 1.31
Medan 5.98 Semarang 4.36 Samarinda 1.55
Padang 2.07 Tegal 0.83 Manado 1.27
Pekanbaru 1.95 Yogyakarta 1.22 Palu 0.68
Batam 1.72 Jember 0.92 Makassar 3.06
Jambi 1.31 Kediri 0.86 Kendari 0.5
Palembang 3.98 Malang 2.05 Gorontalo 0.46
Bengkulu 0.76 Surabaya 8.9 Ternate 0.32
Bandar Lampung 2.25 Denpasar 1.94 Ambon 0.58
Pangkal Pinang 0.44 Mataram 1.07 Jayapura 0.4
Kupang 0.61
Total 22.6 Total 29.84 Total 33.36 Total 14.2
Regional Inflation: Issues and Control Measures

62
The creation of stable CPI inflation is the task
and responsibility of Bank Indonesia. To fulfil this
responsibility, Bank Indonesia formulates monetary
policy on the basis of the inflation targeting framework.
Within this framework, the central bank influences
inflation on the fundamentals side, particularly in
order to shape public expectations. However, on the
non-fundamentals side, Bank Indonesia is unable to
influence inflation given that administered prices are
the competence of the Government and supply shocks
are determined by availability of supply and smooth
distribution. In the post-regional autonomy era, regional
governments play a central role in issues related to
supply and distribution. For this reason, control of
supply shocks demands close attention from Bank
Indonesia through efforts to strengthen cooperation
between the Government and regional institutions
concerned with addressing problems in the production
and distribution of goods and policy formulation.
Inflation control in the regions involves collaborative
action with local stakeholders using multiple
approaches as follows: a. Reinforcement of institutional
linkages between Bank Indonesia at the regional level
and local governments, most importantly for building
a common commitment among the relevant parties
to curbing inflation in the region, given the common
need for low, stable inflation; b. identification of reasons
for shortages of staple needs in the region, with the
strategic goal of ensuring the smooth distribution of
staple goods, shortening distribution lines, improving
regional infrastructure and eradicating hoarding
practices and illegal levies; c. holding dissemination
activities to build public awareness among the local
population of the condition and outlook for the
economy and risks of inflationary pressure.
On the institutional side, Bank Indonesia will
work for more effective cooperation with regional
governments through the BI Regional Offices. Two
forms of cooperation will be developed and put into
action in 2008 through optimization of Focus Group
Discussions (FGDs) and establishment of the Regional
Inflation Control Teams (TPID). The objective of the
strengthened institutional arrangements is to convey
concerns over inflationary pressure in individual
regions and communicate actions for mitigating
these pressures. The focus of inflation control at
the regional level is three-fold: (i) ensuring adequate
supply; (ii) minimizing price shocks arising from regional
regulations (user charges and taxes); and (iii) building
understanding of the condition and outlook of the
economy and the risks of inflationary pressure at the
regional level.

63
Over the past 20 years, the role of agriculture as an
engine for the economy has been in declining trend.
This is borne out in the diminishing share of agriculture
in the national economy, down from about 20% in
1990 to only about 15% (Chart 1). The declining role is
explained by the more modest growth of the agricultural
sector, with the slowdown most apparent in the food
crops subsector. Commodities in the food crops
subsector include rice, corn, wheat and potatoes.
Within this subsector, the most important crop is rice.
Growth in paddy production has tapered off during
the past 20 years (Chart 2). This slowing growth
is explained by rice production in Java, which has
fallen behind production growth in other areas. Java
is the most important centre for paddy cultivation
in Indonesia, accounting for 57.6% of the national
crop, followed by Sumatera and Sulawesi at 22% and
9%, respectively.
Two factors are responsible for slow rate of growth
in paddy cultivation: low productivity and loss of
arable land. The low productivity has several causes,
ranging from the deteriorating condition of agricultural
infrastructure to the still limited use of seed technology
and poor procurement and distribution of fertilizers
and agricultural chemicals. Agricultural infrastructure
networks have deteriorated significantly with 17.5%
of networks damaged or unusable (Table 1). The
most serious damage has been sustained in irrigation
networks and water reservoirs. The distribution system
for labelled seeds is unable to guarantee quality control
and crops yields are therefore below optimum levels
despite farmer attempts to cultivate crops with the
use of these labelled seeds. Fertiliser shortages have
emerged because of limited domestic production
caused by decline in capacity (Chart 3). Indonesia also
suffers from loss of land used for paddy cultivation,
particularly in Java due to conversion of rice paddies to
other use (Chart 4).
The diminishing role of agriculture portends a decline in
the supply of foodstuffs and employment. Indonesia’s
growing population and limited rice production
Agricultural Sector Role in Decline

64
Table 1
Condition of Irrigation Infrastructure
Infrastructure Constructed Quantity UnitsCondition Water Supply Reliability
Heavy Damage Light Damage Reservoir Non-Reservoir
Irrigation Network 6,771.83 km341.33 1,178.55 719.17 6,052.65
(0.05%) (17.4%) (10.62) (89.38)
Dam 1,154 location1
– – –(0.24%)
Reservoir 273 location14 5
– –(5.1%) (1.8)
Source: Ministry of Agriculture
underscores the necessity of rice imports to secure
food supplies (Table 2). Indonesia has imported rice
every year except for a brief period of self-sufficient
rice production in 1993. Concerning employment, the
low rate of growth in agriculture also means a low rate
of absorption of workers in this sector. This is very
unfortunate, given that agriculture is a very important
source of employment for the population.

Chapter 4
Exchange Rate

66
Chapter 4: Exchange Rate
During the past year of 2007, the rupiah exchange rate on average remained stable and strengthened, compared to the previous year bolstered by improving domestic macroeconomic fundamentals amidst volatility in the global economy and turbulent financial markets. The subprime mortgages crisis in the United States, which expanded globally, coupled with the soaring oil price during the second half of 2007 triggered depreciatory pressures on the rupiah exchange rate. However, the adoption of consistent and prudent monetary and fiscal policies, along with currency stabilization policy measures, had minimized such pressures and accordingly maintained exchange rate stability.
The rupiah exchange rate during 2007, in general,
was stable with decreasing volatility. On average the
rupiah strengthened against the US dollar by 0.3%
from Rp9,167/$ in 2006 to Rp9,140/$ (Chart 4.1). The
rupiah exchange rate stability was further reflected by
decreasing volatility from 3.9% in 2006 to 1.4%1 (Chart
4.2). However, in terms of point to point, the rupiah
depreciated by 4.2% from Rp8,995/$ at the end of
2006 to Rp9,393/$ by the end of 2007, in particular as
a result of external pressures during the second half
of 2007. Rupiah exchange rate stability was supported
by greater public confidence, amid a sluggish global
economy and inauspicious money markets, both
domestically and internationally, in the Indonesian
economy and the high yielding domestic financial
market. Pressures on the rupiah exchange rate during
the second half of 2007 stemmed primarily from the
subprime mortgage debacle in the US that expanded
globally (Box: Impacts of the Subprime Mortgage Crisis
on Indonesian Financial Markets) and the dramatic hike
in the global oil price. However, prudent and consistent
monetary and fiscal policies as well as measures taken
by Bank Indonesia to stabilize the currency were able to
mitigate a further rupiah exchange rate slide.
In the first semester of 2007, the rupiah tended to
appreciate as foreign portfolio capital inflows to
the domestic financial market increase. This was
1 Rupiah volatility is an indicator to measure rupiah fluctuations by calculating the deviation of daily rupiah exchange rate from the annual average (250-day moving average).
buttressed by improving macroeconomic fundamentals
as reflected by the balance of payments which ran an
increasing surplus, lower inflation, robust economic
growth and well-controlled fiscal sustainability. Such
developments are inextricably linked to the prudent
and consistent macroeconomic policy management
pursued to boost public confidence, both domestically
and internationally, in the rupiah. In addition, amid
burgeoning liquidity excess in the global financial
system, the high yielding domestic financial market also
played a role in attracting such foreign portfolio capital
inflows. Against this propitious backdrop, the rupiah
appreciated, peaking in May 2007 at a monthly average
of Rp8,838/$.
However, global risk increased and put pressure on
the rupiah exchange rate during the second semester
of 2007. The subprime mortgage crisis in the USA
triggered volatility in the global financial market,
encouraging global investors to avoid assets regarded
as high risk, including emerging market assets. The
crisis also precipitated capital reversal in the domestic
financial market which sparked pressures on the
rupiah. Meanwhile, the soaring global oil price raised
the need for foreign exchange to import oil. As a
result the rupiah began to depreciate in the second
half of 2007, reaching its lowest in August 2007 with
a monthly average of Rp9,372/$. Thus, the rupiah
dynamically strengthened during the first half of 2007

67
but subsequently fluctuated in the second semester
(Chart 4.2).
Factors Affecting the Exchange Rate
Domestic Factors
Domestic macroeconomic fundamentals remained
conducive to support rupiah exchange rate stability.
Sustainable domestic economic growth during
2007, relatively well-controlled inflation in line with its
specified target, as well as consistent and prudent
macroeconomic policies all helped boost market
confidence in the rupiah. In the midst of a series of
external shocks, economic growth in 2007 reached
6.3% with inflation at 6.59%, while fiscal conditions
remained sustainable. Furthermore, the current account
and the overall balance of payments ran a sufficiently
large surplus in 2007 and foreign exchange reserves
increased significantly. Well-maintained economic
fundamentals preserved foreign investor confidence
in domestic economic conditions as well as in the
economic outlook in the midst of external turbulence.
This, combined with the relatively high yield on rupiah
investments, ensured that the global portfolio capital
inflows during 2007 remained high, despite limited
capital reversal due to several external shocks.
Solid balance of payment performance increased the
potential supply of foreign exchange and reserves,
which underpinned rupiah exchange rate stability. In
2007, the current account balance recorded an $11-
billion surplus, exceeding that of 2006 which totaled
$10.8 billion. The large surplus played as a buffer in
balancing the decline in capital account surplus, which
was principally due to capital reversal mainly in the
third quarter of 2007. Still, as a whole the balance
of portfolio investment transactions had managed
to record a $10-billion surplus in 2007. Such a solid
balance of payments was also reflected by the increase
in foreign exchange reserves and net foreign assets.
Foreign exchange reserves swelled from $42.6 billion in
2006 to $56.9 billion in 2007. Whereas, the net foreign
assets –as an indicator of potential foreign exchange
supply in the domestic foreign exchange market–
increased from $45.9 billion in 2006 to $55.71 billion in
2007 (Chart 4.3).
Investment risk in Indonesia improved in line with
preserved economic fundamentals. Investment risk
on rupiah financial assets reduced, owing to this
strong economic fundamentals. Several risk indicators
improved in 2007, reflected by the elevated Indonesian
sovereign credit rating as well as improved Country
Risk Index. Favorable economic fundamentals coupled
with consistent and prudent macroeconomic policy
management were considered in the awarding of
Indonesia’s sovereign credit rating by Moody’s, Rating
and Investment Information (R & I) and Japan Credit
Rating Agency (JCRA). Moody’s raised Indonesia’s
rating from ‘B1’ to ‘B1+’ on 1st August 2007, and again

68
to ‘Ba3’ on 18th October 2007. As well, R&I raised
Indonesia’s rating from ‘BB’ to ‘BB+’ on 31st October
2007 while JCRA moved the rating up from ‘BB-‘
to ‘BB’ on 6 September 2007. Indonesia’s rating is
currently approaching ‘investment-grade’ and nearing
that of the pre-crisis level.
In addition to the credit rating, other risk indicators such
as the Country Risk Index issued by the International
Country Risk Guide also indicated a gradual
improvement from 68 in 2006 to 70.5 in October 2007
(Chart 4.4). Yield spread between Indonesian global
bonds and US T-notes also showed an upsurge.
However, the increase was due more to a decline in
US T-note yield stemming from an increase in global
investment funds to this instrument as a result of the
subprime mortgage fiasco in the US (Chart 4.5).
The investment yield on rupiah assets throughout 2007
was still attractive. Despite the decline in BI Rate from
the end of 2005 to November 2007, the Indonesian
interest rate continued to remain competitive regionally.
The yield of rupiah investments tended to decline, both
measured by the uncovered interest rate parity (UIP)2
as well as the covered interest rate parity (CIP) which
incorporated risk factor, that is the UIP minus the yield
spread between the Indonesian global bonds and the
US T-notes. UIP decreased dramatically from 4.16%
at the end of 2006 to 2.70% (Chart 4.6). The decrease
was attributable to the 175-bps drop in the BI Rate
in 2007. Conversely, CIP decreased to 0.45% by the
end of 2007, which was far below the previous year’s
2.94%. Despite its declining trend, the domestic interest
rate remained relatively higher than that of several
countries in the region. This implies that investments in
rupiah assets were still more profitable. Investments in
rupiah bonds also offered attractive yield, as reflected
by the highest yield spread between domestic bonds
2 The domestic interest rate is calculated using the 1-month Jakarta Inter Bank Offered Rate (JIBOR) denominated in rupiah and the foreign interest rate applies the 1-month Singapore Inter Bank Offered Rate (SIBOR) denominated in US dollars.

69
and US T-notes in the region (Chart 4.7). The high
yield on rupiah investments guaranteed the Indonesian
money market as an attractive destination for global
portfolio inflows.
International factors
In the first half of 2007, the global financial market was
marked by excess liquidity and US dollar depreciation
as part of the adjustment process for ongoing global
economic imbalances. Such conditions boosted
carry trade transactions, particularly in emerging
market countries, including Indonesia. Risk taking by
global investors in the financial markets of emerging
market countries also arose in line with improving
macroeconomic fundamentals in these countries.
This was reflected by the narrowing of emerging
market bonds yield to that of US government bonds
as a measure of the risk appetite of global investors
(Chart 4.8).
Global risks intensified during the second half of 2007,
undermined by the subprime mortgage crisis. The
crisis triggered volatility in the global financial market
commencing at the end of July 2007 and forced global
investors to reprice risk on investment in emerging
market assets. Such developments provoked capital
outflows from emerging market assets (flight to quality),
including rupiah assets. Further pressures emanated
from the soaring oil price that peaked at $98.9 per
barrel3 in the second semester of 2007. Despite the
greater demand for foreign exchange to pay for imports
due to the rising oil price, the resultant pressure on
the rupiah was minimal. Oil price pressure against
the rupiah was transmitted through of limited foreign
portfolio adjustments in the SUN market as uncertainty
intensified due to inflationary pressures. Against such
an ominous backdrop, the rupiah tended to depreciate
against other hard currencies during the second half of
2007 (Chart 4.9 and Chart 4.10).
3 WTI oil price as of 20th November 2007.

70
Transactions in Foreign Exchange Market
Foreign capital inflows drove the performance of the
foreign exchange market, and balanced the supply and
demand for foreign exchange. The developments of
domestic foreign exchange market was characterized
by the increasing volume of transactions as recorded
in the spot, forward and swap markets. Total volume
of foreign exchange transaction in the spot market for
2007 arrived at $561 billion, 43.5% higher than the
$391 billion reported in 2006 (Chart 4.11). Meanwhile,
the volume of foreign exchange transactions in both
the forward and swap markets in 2007 increased
by 19.1% and 45.1% respectively to $28 billion and
$192 billion. The spot market structure remained
relatively unchanged. Spot transactions continued to
be dominated by exchanges between US dollars and
rupiah as has occurred in previous years.
The volume of spot transactions became more
dominant vis-à-vis forward and swap transactions, as
indicated by the increasing share of spot transactions
(y-o-y) (Chart 4.12). The surging share of spot
transactions was partly attributable to the restrictions
applied on derivatives transactions from July 20054.
This reduced speculative transactions, which, in
general, supported the rupiah exchange rate.
4 Through PBI no 7/14/PBI/2005 on the Restrictions on Rupiah Transaction and Extension of Foreign Exchange Credit by Banks
Most foreign funds were invested at the beginning of
the year prior to the subprime mortgage crisis in USA,
which began at end of July 2007. Despite significant
foreign capital inflow, excess demand for foreign
exchange persisted. Throughout 2007, net foreign
capital inflow to the domestic foreign exchange market
reached $4.0 billion, slightly below the net inflows
of 2006, which topped $4.3 billion. On the other
hand, the demand for foreign exchange by domestic
players totaled $4.4 billion, higher than the $4.2
billion demanded in 2006. Hence, in 2007, the foreign

71
exchange inter-bank market experienced excess
demand of $372 million, contradictory to the previous
year which recorded an excess of supply amounting
to $181 million (Chart 4.13). This evidences greater
pressure on the rupiah, leading to depreciation against
US dollar on a point to point basis, albeit appreciating
in terms of annual average.
Foreign capital inflows in 2007 were placed in several
rupiah assets, namely stocks, government bonds (SUN)
and Bank Indonesia Certificates (SBI). Placement in
stocks dominated foreign capital inflows amounting
to Rp32.6 trillion ($3.6 billion). Stock placements
became investors’ preference amid declining interest
rate trend and narrowing bond yield spread. Still, the
yield spread of Indonesian bonds remained relatively
higher than that found in other countries. Meanwhile,
placements in SUN reached Rp23.2 trillion ($2.6 billion)
for the year; the second largest after stocks. As such,
foreign entitlement on SUN increased with a total value
of Rp78.2 trillion ($8.4 billion), whereas the foreign
placements in SBI rose by Rp9.9 trillion ($1.2 billion).
Consequently, the total value of foreign entitlement in
SBI moved up to Rp28 trillion or $3 billion (Chart 4.14).
Policies Taken
Rupiah stability in 2007 was buoyed by the exchange
rate management policy undertaken, which was
directed to achieve equilibrium between the economy’s
internal and external balance. In this regard, a
measured policy of intervention in the foreign exchange
market was continuously pursued in order to control
exchange rate volatility. As such, rupiah volatility eased
from 3.9% in 2006 to 1.4% in 2007. In addition to the
intervention policy, Bank Indonesia also strengthened
their communications strategy, enhanced the
effectiveness of prudential regulations and monitored
the flows of foreign exchange.

72
Chronology of the Subprime Mortgage Crisis
The low interest rate in the US from 2000 to 2004,
loosened requirements for mortgages, coupled with
competition among lenders had increased loans
to borrowers with low creditworthiness (subprime
borrowers). The extension of subprime mortgages to
subprime customers totaling just $213 billion in 2002
had sky-rocketed to $665 billion in 2005. In addition,
securitization based on subprime mortgage collateral
continued to elevate through financial engineering
in the form of Asset Backed Securities (ABS) and
Collateralized Debt Obligation (CDO).
The magnitude of potential profit obtainable through
subprime mortgage securitization encouraged a
number of major financial institutions to enter this
business segment including Bear & Sterns, HSBC and
Citigroup. The CDO product became more attractive
as it received high ratings from ratings agencies like
Standard and Poor’s as well as Moody’s. High yields
also attracted investors from numerous countries
to purchase CDO. From 2003-2007, issuances of
ABS and CDO collateralized by subprime mortgages
increased sharply reaching over $450 billion in 2006.
Why did the subprime mortgage related businesses
quickly develop into a global crisis? Most mortgages
were Adjustable Rate Mortgages (ARM), for which the
interest rate was fixed during the first few years but
subsequently followed market interest rates. Due to the
high risk inherent with subprime mortgage borrowers,
the interest rate imposed was ARM plus a specified
margin.
In line with the rising interest rate trend since mid 2004,
the burden of repayment installments by subprime
borrowers became heavier, rendering them unable to
repay their loans and leading to increased cases of
defaults (Figure 1). Almost simultaneously, property
sector prices plummeted. As a result, subprime
mortgage lenders suffered catastrophic losses, several
even came to closure. In the middle of 2007, the
accumulation of non-performing loan in the US housing
sector peaked and ultimately triggered turbulence in the
global financial markets. Surging non-performing loans
forced investors to reconsider their investments in CDO
due to the falling collateral value of the securities. The
price of CDO plunged. Whereas, the series of losses
endured by subprime mortgage lenders resulted in a
dramatic slide in share prices in the US, which quickly
spread to all shares in the financial sector, particularly
banks.
The drop in share prices in the US quickly spread on a
global scale, particularly to the share prices of financial
institutions outside the USA with exposure, be it direct
or indirect, to CDO. Global investors who realized
their exposure to CDO simultaneously reconsidered
their investment risk (repricing of risk). As a result,
a significant shift from high risk financial assets to
relatively safe assets occurred, for example to US
government bonds (flight to quality).
Impacts of the Subprime Mortgage Crisis on Indonesian Financial Markets

73
The crisis of confidence in CDO continued to
propagate, causing greater difficulties for subprime
mortgage lenders and issuers of Asset Backed
Commercial Papers (ABCP) to obtain funds in the
credit market. This happened because most investors
refused to extend their investment funds in ABCP.
Consequently, the banking sector, as the guarantor of
ABCP, was forced to resume control of the supply of
funds to subprime mortgage lenders, which burdened
the bank balance sheet. Such developments resulted in
a tight inter-bank money market, particularly of 3-month
tenures. The actions taken by the Federal Reserve to
cut its interest rate in August 2007 and inject huge
amounts of liquidity through coordination with a number
of other central banks could only temporarily cool
financial market volatility.
The continuing drop in property prices, financial market
instability and tight mortgage lending standards,
pressurized public consumption in the US. In addition,
the manufacturing sector also began to feel the impacts
of weaker consumption, which triggered a wave of
layoffs. On the other hand, a number of financial
institutions, including prominent US investment banks,
reported significant losses from the CDO business,
which at the end of 2007 had went beyond $100 billion.
Approaching year end 2007, the US economy fell under
the shadow of recession, therefore, pressures on global
financial markets continued.
Volatility in the global financial market due to the
second-round effects of the subprime mortgage
crisis compelled global investors to reprice risk on
their investments. The withdrawal of funds from
their investments in the financial markets of ‘risky’
developing countries intensified pressures on most
of the countries’ currencies. The withdrawal of global
investors’ funds was, in itself, an effort to cover their
losses from the bearish financial markets in developed
countries.
Impacts on the Domestic Financial Market
Financial institutions in Indonesia were identified
as having no exposure to the commercial papers
collateralized by subprime mortgages. Nevertheless,
volatility in the global financial markets triggered by
the subprime mortgage turmoil raised volatility and
uncertainty domestically, which encouraged capital
outflows from rupiah investment instruments. In a
turbulent global financial market, investors tend to save
their money by avoiding risky investment instruments
(risk aversion), including instruments issued in emerging
markets like Indonesia.
During the subprime mortgage crisis, the risk appetite
of global investors for emerging market assets went
down, as reflected by the widening spread of Emerging
Market Bond Index Global (EMBIG) against US Treasury
Bonds. Risk appetite was also highly correlated to
the rupiah exchange rate. This was reflected by the
broadening spread of EMBIG followed by depreciatory
pressure on the rupiah (Chart 2).
Foreign capital outflows escalated from June 2007
until August 2007; which exacerbated pressures on

74
the rupiah exchange rate (Chart 3). The withdrawal
of foreign investments from the Indonesian financial
market originated in part from Bank Indonesia
Certificates (SBI) and government bonds. However,
foreign investment in the stock market continued to flow
in (Chart 4). Subsequently, capital outflows diminished
and inflows even began to resurge significantly following
The Fed’s decision to discount its Fed Fund Rate by 50
bps on 18th September 2007.
The subprime mortgage turmoil has become
deeper and wider than most experts predicted. In
November 2007, the financial market again suffered
from turbulence since the housing sector crisis had
developed into liquidity and credit crises that pushed
the US economy closer towards a recession, and
a series of losses was reported by major financial
institutions. Coupled with the soaring world crude
oil price, which approached $100 per barrel, foreign
capital outflows began once again. As a result, the
rupiah exchange rate refaced immense pressure, albeit
fading towards the end of 2007.
Although Indonesian financial markets suffered from
the fall out created by the US subprime mortgage
crisis, the impacts were, however, well minimized.
Economic fundamentals, duly supported by improved
macroeconomic policy management, have rendered
the Indonesian economy better resilience to external
shocks. Such conditions were absent a few years ago
when external shocks triggered prolonged volatility
necessitating Bank Indonesia to raise its BI Rate
significantly and the government to reduce its fuel
subsidies.
The improvement in Indonesian economic
fundamentals was reflected by a number of key
indicators, including among others, the large surplus
in the balance of payments, the well controlled inflation
rate to year end 2007 and sustainable economic
growth. In addition, rupiah investment instruments
continue to promise attractive yields; the highest in
Southeast Asia. Against this opportune backdrop,
Indonesian financial markets remain an attractive global
investment destination.
Chapter 5
Inflation

76
Chapter 5: Inflation
The Consumer Price Index (CPI) touched 6.59% in 2007, in line with the target of 6.0%±1.0% set by the Government. Stable exchange rate, adequate supply of food, and modest increases in administered prices contributed to the relatively stable inflation in 2007 compared to the previous year, when the CPI reached 6.60%. This achievement also stemmed from the support of the Government in controlling factors that influenced inflation, especially those which originated from increases in the prices of commodities in international markets. This condition, in turn, increased policy credibility, thereby giving a positive contribution toward efforts to keep the public’s inflationary expectations in line with the inflation target.
Inflation Developments
In general, prices of goods and services at the
consumer level were relatively under control in 2007.
The reasonably stable inflation was the result of the
fairly low inflation in the first half of 2007. The CPI in the
calendar year up to June 2007 was recorded at 2.08%
(ytd), including deflation of 0.16% (mtm) in April. The
inflation rate in the first half of 2007 was lower than in
the corresponding period of the previous year of 2.87%
(ytd). A breakdown of inflation by component1 showed
that nearly all components of the CPI experienced lower
inflation compared to the previous year with the biggest
decline occurring in the foodstuffs component, edging
down from 5.16 % (ytd) in the first half of 2006 to 2.45%
(ytd) in the same period of 2007. Moving into the second
half of 2007 (July-December), however, inflationary
pressures elevated fairly substantially. Increases in the
prices of international commodities, such as crude oil,
crude palm oil (CPO), wheat, and gold, combined with
the weakening rupiah, were behind the higher inflation in
the second half of 2007.
In addition, seasonal factors such as religious festivities,
the start of the new academic year, and the year-end
1 According to the COICOP (Classification Of Individual Consumption by Purpose), 744 CPI commodities are grouped by the BPS into 7 groups of goods and services. They are (1) the foodstuffs group, (2) the processed foods, drinks, cigarettes, and tobacco group, (3) the housing, electricity, water, gas, and fuels group, (4) the clothing group, (5) the health group, (6) the education, recreation, and sports group, along with the (7) transportation, communications, dan financial services group.
holidays resulted in further inflationary pressures. With
such developments, CPI inflation climbed in the second
half of the year to around 4.51%. The higher inflation
rate reflected price increases in nearly all types of goods,
especially foodstuffs. Overall in 2007, CPI inflation
retained its stability at 6.59% compared to 6.60% in the
previous year.
Factors Affecting Inflation
Based on the influencing factors2, the relatively stable
inflation in 2007 was mainly attributable to improvements
in non-fundamental factors, with inflation from
fundamental factors being reasonably controllable. From
the non-fundamental side, lower volatile food inflation3
coupled with government policy in leaving administered
prices unchanged4 for strategic goods, such as
subsidized fuel and electricity tariffs, were the two main
reasons for the improved inflation conditions. From the
fundamental side, the fairly stable core inflation5 was
mainly attributable to inflationary expectations remaining
2 Based on the characteristics of developments in commodity prices, CPI inflation can be grouped into volatile food inflation, administered prices inflation, and core inflation.
3 Volatile food inflation is inflation in the group of food commodities whose prices are highly fluctuates because of certain factors such as the time of the harvesting season, distribution bottlenecks, natural disasters, and plagues.
4 Administered prices inflation is inflation in the group of commodities whose prices are set by the government.
5 Core inflation is commodity inflation whose movements are influenced by economic developments in general (fundamental factors such as inflation expectations, the exchange rate, and aggregate demand and supply balances) which will have an impact on price changes in general and which tend to be permanent in nature.

77
in-check and the minimal pressures from the interaction
between aggregate demand and supply. Meanwhile,
amidst a pick-up in imported inflation, pressure from the
external side remained subdued as the average rupiah
exchange rate strengthened in 2007 (Chart 5.3).
These inflation dynamics indicated that the role of
lower volatile food inflation was reasonably important in
safeguarding the stability of CPI inflation in 2007. The
lower volatile food inflation meant that its contribution
in forming inflation experienced a decline from 2.75%
in 2006 to 2.09% in 2007. The lower inflation from the
volatile food group was able to offset the increased
inflation contribution coming from core inflation and
administered prices such that, overall, the yearly inflation
was relatively stable (Table 5.1).
Non-fundamental Factors (Shocks)
Volatile Food
The year 2007 witnessed a drop in volatile food inflation
to 11.41% from 15.27% in 2006. The decline was mainly
attributable to the fall in the prices of rice , underpinned
by adequate supply and smooth distribution. Aside from
increased production, efforts to safeguard sufficient
supplies of rice were also achieved through imports
conducted by the State Logistics Agency (Bulog). The
Inflation of rice commodity, which has the largest weigh
in calculating the CPI, fell sharply from 32.0% in 2006
to 8.49% in 2007. This decline started to be apparent in
April after the government allowed Bulog to import rice,
as part of the efforts to safeguard stocks of rice. Overall,
the contribution of rice toward the overall inflation moved
down from 1.58% in 2006 to 0.52% in 2007 (Table 5.2).
Although, in general, volatile food inflation in 2007
experienced a decline, inflation of a number of
commodities in this group increased due to rising prices
of a number of commodities in international markets
and the occurrence of some natural disasters. The
surging prices of CPO in global markets had a significant
impact on volatile food inflation through higher prices of
cooking oil which rose 41.40% (Table 5.2). The upsurge
in cooking oil inflation was followed by increases in prices
of products made from CPO such as margarine and
butter which mounted 14.28% and 29.81%, respectively
(Table 5.4).
Meanwhile, the soaring price of corn in international
markets which were accompanied by surges in the
prices of livestock feed pushed up the prices of chicken
meat and eggs by 12.30% and 19.04%, respectively.
The occurrence of flood also put pressures on volatile
food inflation, as reflected in higher inflation of red
onions, hiking sharply to 124.50%, or far higher than
in 2006 when deflation of 18.8% was recorded (Table
5.2). Seen from its contribution to inflation, rice gave the
largest contribution amounting to0.52%. Meanwhile,
cooking oil and red onions – which both experienced
high inflation – also contributed quite significantly

78
toward volatile food inflation, that is 0.49% and 0.47%
respectively (Table 5.2).
Administered Prices
During 2007, pressures from administered prices inflation
was relatively minimal given that the government did
not raise the price of strategic administered goods such
as subsidized fuel (premium, diesel, and kerosene)
and electricity tariffs. The impact of this policy was
reasonably significant in efforts to safeguard the stability
of inflation this year considering the fairly large weighting
of administered goods in the CPI basket of goods, and
given that the knock-on impact on other commodities is
quite high.
Although relatively subdued, inflation of administered
goods in 2007 experienced a slight increase compared
to 2006, from 1.84% to 3.30%. This rise was mainly due
to policies taken in regard to a number of non-strategic
goods (Table 5.3), among others the 7% increase in
the retail selling prices of cigarettes in March 2007, the
adoption of specific excise taxes on cigarettes on 1 July
20076, increases in drinking water tariffs in a number
of cities, toll road tariff hikes, and upsurges in the prices
of non-subsidized fuel (Pertamax, Pertamax Plus, and
Pertamina Dex).
In addition to that, administered prices inflation was
also influenced by supply shortages of kerosene and
Liquefied Petroleum Gas (LPG) although the government
did not make adjustments (at the agents’ level). The price
of kerosene saw increases at the retail level, especially
in the third quarter of 2007. This occurred as a result
of problems in the implementation of the government’s
program to get consumers to convert from kerosene
to LPG sold in 3 kg canisters. Under such conditions,
kerosene inflation in 2007 rose to 2.7% and contributed
6 Based on Minister of Finance (PMK) Decree Number 118/PMK.04/2006 concerning Fiscal Policy, the government imposed two Policies in relation to cigarette excise taxes, that is increases in the retail selling prices (HJE) and the imposition of specific excise taxes on group I cigarettes of Rp7/stick, group II by Rp5/stick, and group III by Rp3/stick.
0.07% to inflation. Besides kerosene, the price of LPG
also climbed as a result of a scarcity of supplies in a
number of regions due to distribution difficulties. LPG
inflation was recorded at 2.1%, contributing 0.01%
toward inflation (Table 5.3).
Fundamental Factors
Core Inflation
From the fundamental side, developments in core
inflation were still relatively under control although
core inflation showed an increase compared to the
previous year. Core inflation was recorded at 6.29%, or
higher than the previous year’s 6.03%. The higher rate
of core inflation stemmed from escalating pressures
from imported inflation as the prices of a number of
international commodities such as crude oil, CPO, gold,
and wheat moved up.
Nonetheless, these imported inflation pressures
were mitigated somewhat by the relatively stable
rupiah exchange rate. At the same time, other factors
Table 5.1
Core and Non-Core Inflation and Its Contribution
percent
YearCore Volatile Foods Administered Prices
CPI InflationInflation Contribution Inflation Contribution Inflation Contribution
2006 6.03 3.48 15.27 2.75 1.84 0.37 6.602007 6.29 3.75 11.41 2.09 3.30 0.75 6.59
Source: BPS-Statistics Indonesia
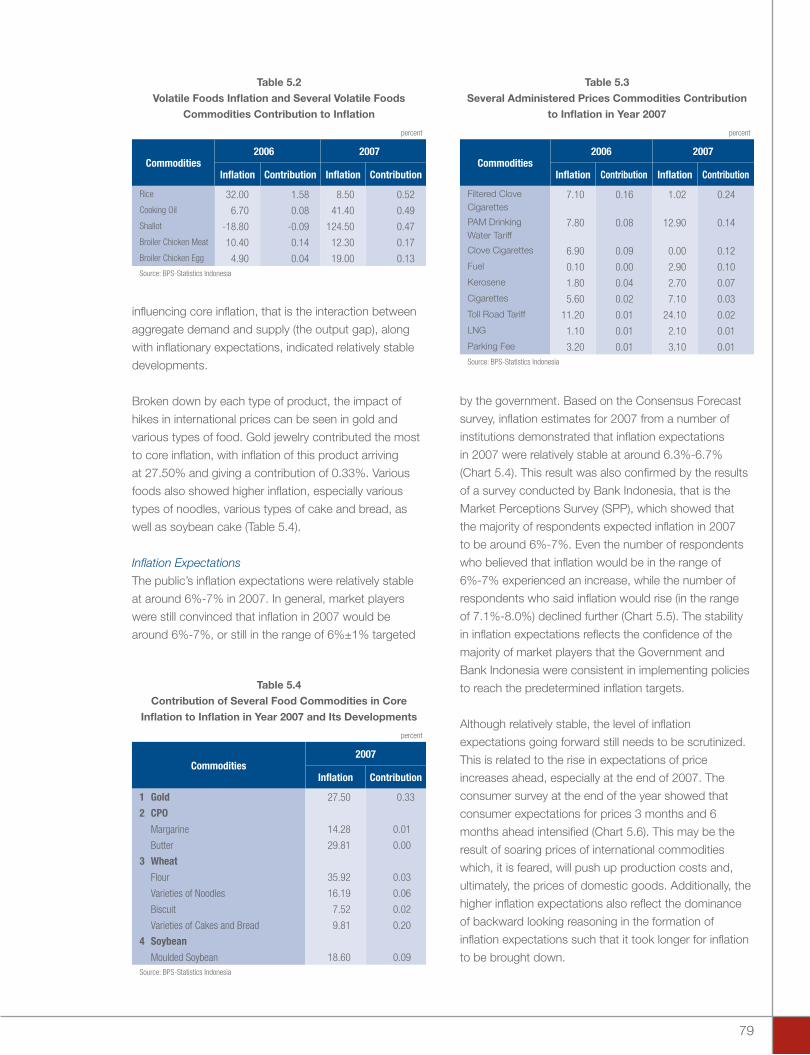
79
influencing core inflation, that is the interaction between
aggregate demand and supply (the output gap), along
with inflationary expectations, indicated relatively stable
developments.
Broken down by each type of product, the impact of
hikes in international prices can be seen in gold and
various types of food. Gold jewelry contributed the most
to core inflation, with inflation of this product arriving
at 27.50% and giving a contribution of 0.33%. Various
foods also showed higher inflation, especially various
types of noodles, various types of cake and bread, as
well as soybean cake (Table 5.4).
Inflation Expectations
The public’s inflation expectations were relatively stable
at around 6%-7% in 2007. In general, market players
were still convinced that inflation in 2007 would be
around 6%-7%, or still in the range of 6%±1% targeted
by the government. Based on the Consensus Forecast
survey, inflation estimates for 2007 from a number of
institutions demonstrated that inflation expectations
in 2007 were relatively stable at around 6.3%-6.7%
(Chart 5.4). This result was also confirmed by the results
of a survey conducted by Bank Indonesia, that is the
Market Perceptions Survey (SPP), which showed that
the majority of respondents expected inflation in 2007
to be around 6%-7%. Even the number of respondents
who believed that inflation would be in the range of
6%-7% experienced an increase, while the number of
respondents who said inflation would rise (in the range
of 7.1%-8.0%) declined further (Chart 5.5). The stability
in inflation expectations reflects the confidence of the
majority of market players that the Government and
Bank Indonesia were consistent in implementing policies
to reach the predetermined inflation targets.
Although relatively stable, the level of inflation
expectations going forward still needs to be scrutinized.
This is related to the rise in expectations of price
increases ahead, especially at the end of 2007. The
consumer survey at the end of the year showed that
consumer expectations for prices 3 months and 6
months ahead intensified (Chart 5.6). This may be the
result of soaring prices of international commodities
which, it is feared, will push up production costs and,
ultimately, the prices of domestic goods. Additionally, the
higher inflation expectations also reflect the dominance
of backward looking reasoning in the formation of
inflation expectations such that it took longer for inflation
to be brought down.
Table 5.2
Volatile Foods Inflation and Several Volatile Foods
Commodities Contribution to Inflation
percent
Commodities2006 2007
Inflation Contribution Inflation Contribution
Rice 32.00 1.58 8.50 0.52Cooking Oil 6.70 0.08 41.40 0.49Shallot -18.80 -0.09 124.50 0.47Broiler Chicken Meat 10.40 0.14 12.30 0.17Broiler Chicken Egg 4.90 0.04 19.00 0.13Source: BPS-Statistics Indonesia
Table 5.3
Several Administered Prices Commodities Contribution
to Inflation in Year 2007
percent
Commodities2006 2007
Inflation Contribution Inflation Contribution
Filtered Clove Cigarettes
7.10 0.16 1.02 0.24
PAM Drinking Water Tariff
7.80 0.08 12.90 0.14
Clove Cigarettes 6.90 0.09 0.00 0.12Fuel 0.10 0.00 2.90 0.10Kerosene 1.80 0.04 2.70 0.07Cigarettes 5.60 0.02 7.10 0.03Toll Road Tariff 11.20 0.01 24.10 0.02LNG 1.10 0.01 2.10 0.01Parking Fee 3.20 0.01 3.10 0.01Source: BPS-Statistics Indonesia
Table 5.4
Contribution of Several Food Commodities in Core
Inflation to Inflation in Year 2007 and Its Developments
percent
Commodities2007
Inflation Contribution
1 Gold 27.50 0.33
2 CPO
Margarine 14.28 0.01
Butter 29.81 0.00
3 Wheat
Flour 35.92 0.03
Varieties of Noodles 16.19 0.06
Biscuit 7.52 0.02
Varieties of Cakes and Bread 9.81 0.20
4 Soybean
Moulded Soybean 18.60 0.09Source: BPS-Statistics Indonesia
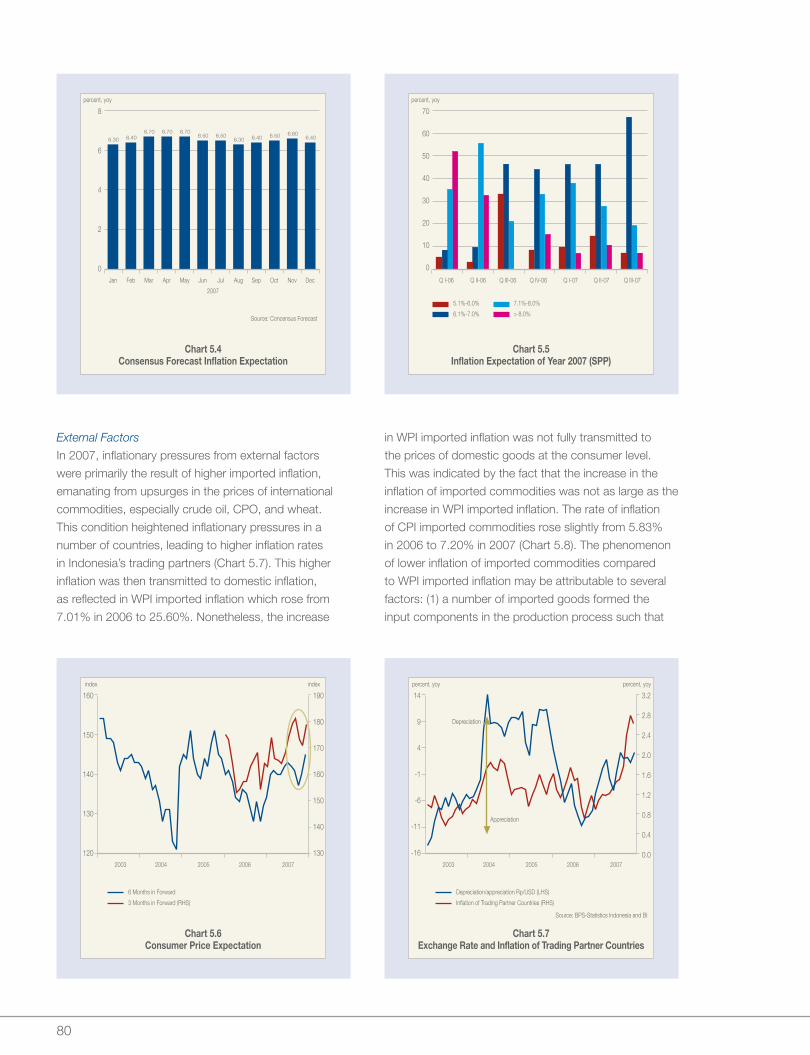
80
External Factors
In 2007, inflationary pressures from external factors
were primarily the result of higher imported inflation,
emanating from upsurges in the prices of international
commodities, especially crude oil, CPO, and wheat.
This condition heightened inflationary pressures in a
number of countries, leading to higher inflation rates
in Indonesia’s trading partners (Chart 5.7). This higher
inflation was then transmitted to domestic inflation,
as reflected in WPI imported inflation which rose from
7.01% in 2006 to 25.60%. Nonetheless, the increase
in WPI imported inflation was not fully transmitted to
the prices of domestic goods at the consumer level.
This was indicated by the fact that the increase in the
inflation of imported commodities was not as large as the
increase in WPI imported inflation. The rate of inflation
of CPI imported commodities rose slightly from 5.83%
in 2006 to 7.20% in 2007 (Chart 5.8). The phenomenon
of lower inflation of imported commodities compared
to WPI imported inflation may be attributable to several
factors: (1) a number of imported goods formed the
input components in the production process such that

81
the proportion in the increase in the final price of goods
will be lower than the proportion in the increase in the
price of imported goods; (2) there were indications
that producers tried not to pass on all the increases of
prices in input goods onto consumers after considering
conditions related to consumer demand and business
competition.
On the other front, the relatively stable exchange rate
lessened pressures arising from imported inflation. On
average, the rupiah stood at Rp9,140 per dollar in 2007
although it did for a time come under pressure due to the
US sub-prime mortgage crisis.
Interaction between Aggregate Demand and Aggregate
Supply (Output Gap)
Inflationary pressures from the interaction of demand
and supply was still minimal, as reflected negative output
gap. The supply side to turned out to be able to meet
the higher level of demand. The response on the supply
side is reflected in the elevated the production index
in the production survey carried out by the Statistics
Indonesia. The production index climbed from 116.9%
on average in 2006 to 123.12%. In addition, SKDU in the
fourth quarter of 2007 demonstrated capacity usage of
73.26%, indicating that most industries still had room to
raise production if demand increased.
Evaluation of Realized Inflation
In 2007, the Government set the CPI inflation target
at 6% with a deviation of ±1%7. The target was set
based on assumptions at the beginning of the year in
regard to fundamental and non-fundamental factors
(shocks) causing inflationary pressures (Table 5.5).
With regard to the fundamental factors, inflation was
expected to originate from external factors in terms of
the weakening of rupiah. As to other external factors, it
was assumed that the price of crude oil in international
markets was US$60/barrel. With pressures from the
output gap anticipated to be minimal and inflationary
expectations expected to remain stable, the core inflation
was estimated to arrive at around 6.3%. As regard the
non-fundamental factors, volatile food inflation was
expected to remain high, although experience a decline.
Meanwhile, administered prices inflation was anticipated
to have a minimal impact on CPI inflation given the
government’s commitment to neither hike fuel prices nor
electricity tariffs.
In reality, the factors which influenced inflation, either
fundamental or non-fundamental, were actually similar
to the original expectations, such that CPI inflation in
2007 was in the range of the predetermined inflation
target. This achievement was the result of improving
coordination between Bank Indonesia and the
Government. Consistency in monetary policy to ensure
7 This was decided in a coordinating meeting on macroeconomics at the Office of the Coordinating Minister for the Economy on 17 March 2006. The inflation target revised the inflation target as set by the government at 5.0% with a deviation of 1%, which is stated in Ministry of Finance decision No. 399/KMK.011/2004 dated 6 September 2004.
Table 5.5
Comparison of Assumption and Realization of Inflation
Target in Year 2007
Variable2007
Inflation Target Realization
Assumption • ExchangeRate(Rp/$)
9,300 9,140
• OilPrice($/barrel) 60 72.3Projection • GDP(%) 6.0 6.3
• CoreInflation(%) 6.30 6.29
• CPIInflation(%) 6.60 6.59Influencing Factors
• ExchangeRate slightly weaken relative stable
• InflationExpectation
stable but remain high
stable but remain high
• OutputGap Low Low
• AdministeredPrices
Low Low
• VolatileFoods high, rice import limitation
high, no rice import limitation
CPI Inflation Target 6.0%±1%

82
the predetermined inflation targets were met and the
ability of the Government to control price shocks through
various sectorial policy packages were key to the 2007
inflation target being fulfilled. With these developments,
core inflation – which portrayed developments in
fundamental factors – hit a level of 6.29%. This shows
that there was still an adequate response from the side of
aggregate supply toward increasing aggregate demand
along with inflationary expectations that were relatively
stable. Nonetheless, in terms of external factors, the
oil price in fact soared sharply to US$72.3 per barrel,
resulting in greater pressures on imported inflation.
Nonetheless, the relatively stable rupiah exchange rate
helped to lessen the pressures of imported inflation
toward domestic inflation.
On the non-fundamental factors, the government’s
commitment to refrain from elevating the prices of
strategic administered goods led to low administered
goods inflation. Meanwhile, volatile food inflation was
still at a high level although sliding slightly. The decline
in volatile food inflation stemmed from lower inflation of
the rice commodity which has a large weight in the CPI
basket of consumer goods.
Policy Initiatives to Control Inflation
The achievement of the 2007 inflation target reflected
the enhanced coordination between Bank Indonesia and
the Government in controlling factors which influence
inflation, as well as in the pursuing macroeconomic and
financial system stability. In regard to Bank Indonesia,
its consistent monetary policy in 2007 was conducted
to ensure that the inflation target could be met. This
was achieved through the management of liquidity
which was in line with the needs of the economy and
the safeguarding of rupiah stability amidst unfavorable
developments on the external front.
In keeping the public’s inflationary expectations at
the level targeted, Bank Indonesia also continued to
strengthen its communication strategy. Other than
through regular press announcements and press
conferences which revealed the decisions made at
the Governors’ Board Meeting and the publication of
Monetary Policy Reports, better communication strategy
was carried out through the program to disseminate
monetary policy to all stakeholders, such as academics,
the business community, journalists, and financial
players, which was conducted either centrally or at
the regional level. The dissemination explained overall
Bank Indonesia’s assessments concerning the latest
developments on the macroeconomic front, inflation
and monetary conditions, along with estimates of
inflation going forward and the monetary policy response
needed to bring inflation down to the targeted level. By
strengthening such communications, the behavior of
inflation expectations in Indonesia is directed toward
the inflation target already set by the government
(forward looking).
On the other hand, the government has tried to
maintain fiscal sustainability while, at the same time,
also safeguarding the supply of goods especially those
of basic needs. These efforts were undertaken through
various sectorial policies such as the abolishment
of Value Added Tax (VAT) and subsidies on food
commodities (such as cooking oil) which are susceptible
toward shocks. In addition, the Government was
committed to safeguarding the supply and distribution
of goods so that their prices did not move sharply (such
goods include rice, kerosene, and sugar). In accordance
with its original commitment, the Government did not
opt to hike the prices of administered goods deemed
strategic (fuel and electricity tariffs).
The government’s commitment was strengthened
through the formation of the Coordinating Team to
Stabilize Basic Foodstuff Prices which comprises
technical departments involved with a number of duties
including: the planning and formulating of policies to
stabilize the prices of basic foodstuffs (rice, sugar, and
cooking oil), and coordinating the realization of these
plans, along with the monitoring and evaluation of such
stabilization policies. Additionally, the Government also
issued Presidential Instruction No. 6/2007 which, among
other things, contains policies to accelerate development
of the real sector as well as to empower SMMEs which
include policies to improve the investor climate and
policies to encourage infrastructure development. To
strengthen policy coordination, Bank Indonesia and the
Government improved further their coordination in the
Inflation Control Team which was assigned to formulate
policies needed to tackle the problem of rising inflationary
pressures. The Team also discussed and formulated
proposals for the inflation targets in the years 2008-2010
(Box: Inflation Targets for the Years 2008-2010). This
policy coordination are very much needed, given that
the permanent component of inflation in Indonesia is still
quite high (Box: Efforts to Comprehend the Behavior
of Inflation in Indonesia: The Permanent Component of
Inflation and the Persistency of Inflation).
83
Efforts to Comprehend the Behavior of Inflation in Indonesia: The Permanent Component of Inflation and the Persistency of Inflation
Efforts to control inflation demand deep understanding
and knowledge regarding the behavior of that inflation.
Two aspects of inflationary behavior which have for
some time been a challenge in efforts to lower or
even control inflation in Indonesia are the difficulty in
lowering the pace of inflation to a lower level1 and the
high persistency of inflation. The difficulty of bringing
the rate of inflation down raises the question of whether
there really is one inherent inflation level for Indonesia.
Comprehension on this matter is very useful - for
example in determining a certain inflation target in a
realistic manner. The establishment of an unrealistic
target will force the central bank to adopt monetary
policy which is too extreme, such that there will be a
large cost for the economy. Meanwhile, the matter of
persistency is related to how quickly inflation will return to
equilibrium after experiencing a shock. Persistent inflation
means that when a shock occurs, the rate of inflation
will tend to take some time to return to its level prior to
the shock. The condition of persistent inflation will also
hamper efforts to bring the rate of inflation to a lower
level. Therefore, the understanding of the persistency of
inflation is also very important as it will determine how
preemptive Bank Indonesia should be in responding to
economic shocks that affect price stability.
Studies show, however, that Indonesia’s inflation has
the characteristic of being rather stubborn in returning
to a lower level (sticky inflation). By calculating average
inflation, the long-term inflation trend for the period
1980-2007 was 9.8%, while for the period 2000-2007
the long-term inflation trend is 8.8%. The high level of
Indonesia’s long-term inflation trend raises the question
whether there is one level of permanent component in
forming inflation in Indonesia. An econometrics approach
proposes the technique of decomposing inflation into
permanent and transitory components2. The permanent
1 The lowest level of inflation was around 5%. This was seen in 1992, 1996, and 2003.
2 Affandi, Yoga (2007): “A Small Monetary System for Indonesia”. Bank Indonesia Working Paper.
inflation component is split into the two elements, that
is the deterministic trend and the stochastic trend. The
deterministic trend is represented by a long-term trend
which is linear. The stochastic trend is the accumulation
of shocks that are permanent in nature which will affect
inflation3. It can be said that the stochastic trend has a
correlation to inflation which tends to have a high level of
persistency.
The results of the calculation of data for the permanent
inflation component show that the lowest level which
can be reached is around 5.3%, occurring in the post
crisis period, during the second quarter of 2003 until the
first quarter of 2004. In the pre crisis period permanent
inflation tended to be above its long-term trend (Chart 1),
while in the post crisis period permanent inflation tended
to be below the long-term trend (Chart 2). This signals
that the stochastic trend is lower in the post crisis period.
This result is in line with research findings which indicate
that the degree of persistent inflation in Indonesia is
declining further. Studies carried out using the simple
auto-regression model have found that in the period
1990-2006 the level of persistency in Indonesia actually
experienced a change from over time4. The study shows
a decline in the degree of persistent CPI inflation, from
0.27 in the pre crisis period to 0.12 after the crisis. The
change in the degree of persistent inflation was also
confirmed by the results of estimating rolling regression
of the persistency coefficient.
Lower persistent inflation implies that if there are
economic shocks, inflation will return more quickly to its
average level. From the aspect of controlling inflation, the
lower persistent inflation will also make it easier to reduce
inflation, because the people’s tendency to anchor
inflationary expectations to the past will lessen.
The results of the research which confirm that a
3 A shock which is transitory in nature in cumulative terms will disappear.
4 Yanuarti, Tri (2007), “Has Inflation Persistence in Indonesia Changed?,” Bank Indonesia Working Paper.

84
permanent inflation component in Indonesia is still fairly
high remains as an obstacle in efforts to reduce inflation
to a lower level. The continuing high level of permanent
inflation component indicates the presence of more
fundamental problems in regard to the phenomenon
of inflation in Indonesia, especially matters that are
related to productivity, efficiency, and the structure of
the economy. The close connection between inflation
and economic productivity and efficiency implies that
dis-inflationary policy needs to always be adopted
in consideration of the principals of gradualism and
balance. Monetary policy which is excessively tight
when economic productivity and efficiency is low can
contribute toward the recession. In contrast, monetary
policy which is too loose, will only lead to inflator and
not pro-poor economy. The close connection between
inflation and structural aspects also implies that for a
credible process of deflation then good coordination
between the government and Bank Indonesia is deemed
important.

85
Inflation Targets for the Years 2008-2010
Low and stable inflation is a precondition for increased
prosperity and the basis for balanced economic growth.
In line with Act No. 23/1999 concerning Bank Indonesia
which was being superseded by Act No 3/2004, Bank
Indonesia is tasked with achieve and maintain the
stability of rupiah exchange rate. Based on the Acts
(explanation of article 10 clause 1a), the inflation target
is determined by the Government after coordinating with
Bank Indonesia. In turn, the inflation target is used by
Bank Indonesia as the basis in formulating and carrying
out monetary policy by taking into account the stability of
the financial system and the overall economy.
Based on the decision by the Minister of Finance No.
399/ KMK.011/2004 dated 6 September 2004, the
inflation targeting period is fixed for 3 years, while the
type of inflation targeting used is the yearly CPI. In this
decision the inflation target for the years 2005-2007 was
also agreed, which was 6%±1% for 2005, 5.5%±1% for
2006, and 5.0%±1% for 2007. Later, the government
and Bank Indonesia agreed to revise the target on 17
March 2006. The inflation target for 2006-2008 was
agreed at 8.0%, 6.0%, and 5.0%, respectively, with
a deviation of ±1%. Subsequently, at the beginning
of 2008, the government set the new inflation targets
for the period 2008-2010, that is of 5.0%, 4.5%, and
4.0%, respectively, with deviation of ±1% through
the decision of the Finance Minister No.1 year 2008
(Chart 3). In general, the inflation target is set by taking
into consideration the inflation projection and the policies
which need to be taken such that the inflation target is
realistic.
The determination of inflation target is needed as a
reference for each player in the economy in taking
economic decisions, including for the government and
Bank Indonesia in formulating the appropriate policies.
The setting of a lower inflation target demonstrates the
government’s commitment to continue the disinflation
process on a gradual basis such that domestic inflation
will be relatively similar to inflation rates in other countries
in the region. The inflation target is also expected to
become anchor in the formation of inflation expectations
of each economic player (forward looking). This is
seen to be important given the role that inflationary
expectations have in forming inflation.
The Government is well aware that such a goal requires
commitment and hard work from various parties taking
into account Indonesia’s historically high inflation on
average. Based on historical data over the last 30 years,
the lowest inflation on average occurred in the post-
crisis period – edging down at 7.12%, a level of inflation
which was still fairly high (Chart 4). Nonetheless, the
achievement of lower inflation than the historical average
is not impossible given that in the years of 1992, 1996,
and 2003, inflation had reached around 5%. In each of
those three years, the achievement of low inflation was
underpinned by the fact that non-fundamental factors
were under control – that is volatile food inflation (Chart
3) and administered prices. Aware of the various factors
that affect inflation, which not only cover monetary policy

86
yet also cover policies on production and distribution,
the government has decided to form the Coordinating
Forum to Control Inflation aside from strengthening of the
existing teams such as the Inflation Control Team and the
Coordinating Team to Stabilize Basic Foodstuff Prices.
PeriodDevaluation(1979-1984)
Before Crisis(1985-1997)
Crisis(1998-1999)
After Crisis(2000-2007)
Mean(%,yoy) 14.49 7.94 41.02 8.81 7.12*
* Increasing Fuel Price Impact
It is expected that these forums will be able to monitor
the undertaking of activities involved with controlling
inflation. This forum is directly chaired by the Minister for
the Economy, with the permanent members being the
Finance Minister, the Governor of Bank Indonesia, and
the Minister of Trade.

Chapter 6
Monetary Developments

88
Monetary policy in 2007 faced challenges from the considerable impact of the global economic turmoil and excess liquidity on the domestic money market. Bank Indonesia announced a series of cuts in the BI Rate before a pause in rate cuts that lasted until close to end of year. In operational side, monetary policy was conducted by adjusting money market liquidity through open market operations. The BI Rate cuts were effectively transmitted to the financial market and raised real sector economic agents confidence. This circumstances was supported by adequate liquidity in the economy, despite the continued buildup of excess liquidity on the money market. Overall, monetary policy with the support of fiscal policy was able to balance the dual goals of achieving the inflation target and promoting economic growth.
Chapter 6: Monetary Developments
In early 2007, considering the confidence in
macroeconomic stability, progress towards the
inflation target and financial system resilience, Bank
Indonesia embarked on a series of measured cuts
in the reference rate before pausing rate movement
until close to end of year. As Indonesia entered 2007,
domestic economic conditions increasingly pointed to
recovery in the wake of the fuel price hikes of 2005.
This improvement was reinforced by macroeconomic
stability reflected in the stable exchange rate and
downward trend in inflation. After assessing these
conditions, Bank Indonesia resumed the loose bias
monetary policy stance first launched in May 2006.
However, early in the second half of 2007, the domestic
economy came under pressure triggered by the impact
of the subprime mortgage crisis in the United States.
The resulting turmoil stirred negative sentiment across
global financial markets, with subsequent implications
for weakening in the exchange rate. Exacerbating the
shocks were surging world oil prices that carried the
risk of heightened inflation. In response to these risks,
Bank Indonesia kept the BI Rate on hold from August
until November 2007. At year end, BI announced a
new rate cut to 8% following the signal of declining
future inflationary pressure and to support for renewed
economic expansion.
In monetary policy, consistency and commitment in
curbing inflation was reinforced by policy transparency
and improved coordination with the Government.
Transparency was implemented through a revamped
strategy and intense communication and dissemination
of monetary policy through a range of media and to
stakeholders at the central government and regional
levels. Through these communications, stakeholder
perceptions would be brought into line with Bank
Indonesia’s intentions for implementing monetary policy.
In addition, policy transparency would encourage a
shift from the prevailing backward-looking formation of
public inflation expectations towards greater alignment
with the future inflation target. In related moves, the
closer monetary-fiscal coordination has created a level
of macroeconomic stability conducive for sustainable
economic expansion. This policy coordination operates,
among others, through regular meetings between Bank
Indonesia, the Government and relevant agencies in
a coordination forum and within the Inflation Control
Team.
This monetary policy met with positive response from
the financial market and strengthened the optimism
of economic agents in the real sector. Response
from financial market players was manifested in the
continued rise in stock market activity accompanied
by accelerated gains in the Indonesian Composite
Index. Activity was also brisk on the government
securities market, bolstered by attractive yields. Banks
continued to lower their deposit and lending rates, in

89
turn providing added momentum to economic activity
in the real sector and encouraging alternative forms of
financing through stock and bond issues. In the real
sector, positive response was reflected in relatively
stable inflation expectations among economic agents
and rising consumer and business confidence in the
domestic economy. This represents an important signal
bolstering the performance of the economy.
Domestic economic expansion was matched by
accelerated growth in economic liquidity particularly
in lending to the private sector. However, the banking
system still carried high levels of excess liquidity, a
condition that must be carefully monitored in regard to
implications for macroeconomic and financial market
stability.
Monetary Policy Implementation
The monetary policy strategy involving the setting of the
BI Rate is directed towards achieving the Government-
set inflation target. The strategy is pursued through
measured, prudent actions with careful consideration
the state of the economy including future inflation
pressure, latest dynamics in the economy and
financial system stability. Under these conditions, the
safeguarding of macroeconomic stability continued
alongside lowering of the BI Rate from 9.5% to 8.25%
in a series of rate cuts from January to July 2007. In
March 2007, about midway during this period, issues
over subprime mortgages began to surface, but
without significantly impacting economic stability.
In the second half of 2007, the subprime mortgage
problem took a more serious turn with spreading
impact that also affected Bank Indonesia in determining
the BI Rate. In August, investors began reassessing
their investment risks and adjusting portfolio holdings
in a flight to quality. This in turn impacted the rupiah
exchange rate, as well as exchange rates in other
emerging market countries. Conditions took a further
turn for the worse with soaring oil prices that put
added pressure on both the exchange rate and future
inflation. Responding to this, Bank Indonesia halted
the downward movement in interest rates from July
to November 2007. The BI Rate was held at 8.25%
to fend off accelerated inflation expectations and
ease pressure on the financial market. At the end of
2007, in view of the safe level inflation expectations,
adequate production capacity and renewed equilibrium
in financial markets, BI lowered the rate to 8%. This
policy sent a positive signal for the ongoing economic
expansion while nevertheless prioritizing achievement
of the inflation target.
This policy strategy was implemented through liquidity
management in Open Market Operations (OMO) and
other instruments. Following the reductions in the BI
Rate, all instruments directly linked to the BI Rate were
automatically lowered by the same margin. At the end
of 2007, the overnight Bank Indonesia Short-Term
Deposit Facility (FASBI O/N), customarily used as the
floor for overnight rate movements on the interbank
market, stood at 3% (down from 4.75% at end-2006).
Likewise, the SBI repo rate, which marks the ceiling
on overnight interbank rate movements, eased to 11%
(from 12.75% at end-2006). OMOs were held primarily
to absorb excess liquidity and ensure availability of
interbank liquidity. The regular OMOs relied mainly
on the weekly auction of 1-month SBIs in a fixed rate
tender at the level of the BI Rate. However, the non-
regular Fine Tune Operations (FTOs) were implemented
on a limited scale and with varying pricing, adjusted to
the conditions on the money market. Complementing
these monetary instruments on the rupiah market was
forex intervention used to curb excessive exchange rate
volatility.
Response to BI Rate by Financial Market and
Economic Agents
Financial Market Response
Changes in the BI Rate were followed by
commensurate movement in money market rates.
During 2007, the overnight rupiah interbank rate
showed greater average decline than the BI Rate, as
could be expected with the over liquid condition of
the money market. Volatility, however, was relatively
unchanged from 2006 (Table 6.1). These interest
rate movements were strongly influenced by the
microstructural condition of the money market and
the effect of movement in autonomous factors, most
importantly government financial operations. On
a day-to-day basis, this condition was reflected in
the fluctuating movement in the overnight interbank
rate, which varied considerably against the BI Rate
(Chart 6.1).
Movement in the BI Rate met with strong response in
bank deposit rates. The magnitude of this response
also reflected the excess liquidity and was consistent

90
with movement in the rupiah deposit guarantee rate
(Chart 6.2). Bank deposit rates averaged over all tenors
fell by 2.3%, more than the cumulative reduction in the
BI Rate over the same period (1.75%). The steepest rate
cuts took place in the 12 and 6 month tenors (Chart
6.3). Leading in rate cuts on deposit funds were state-
owned banks, while foreign and joint venture banks
registered the slowest decline compared to the banking
system as a whole. In September 2007, the downward
movement in deposit rates began levelling off in all
tenors, with the 1-month deposit rate even edging up
slightly from October 2007. This appears to be related
to bank efforts to retain customers by ensuring that
depositors would continue to receive positive and
competitive real interest rate.
On the other hand, lending rates were slower to
respond. The sluggishness of the response was
indicated by the variation in variables affecting the
pricing of lending rate, including overhead costs, profit
margins and risks, not all of which can be influenced
Table 6.1
Rupiah Interbank Money Market O/N Interest Rate and
its Volatility
Period
Weighted Average Interbank Money Market O/N (%)
Volatility O/N (%)
Morning Afternoon Morning Afternoon
2006 9.2 8.7 2.2 2.1
January 5.0 4.9 0.1 0.1
February 5.2 5.1 1.2 0.9
March 7.5 7.3 5.1 3.7
May 8.5 7.9 3.8 3.5
June 6.9 6.3 3.1 2.9
July 5.6 5.3 2.3 1.9
September 5.2 4.8 1.8 1.2
October 4.9 4.8 2.0 2.0
November 6.8 6.7 3.3 3.0
January 5.1 4.7 3.7 3.4
February 6.5 6.4 3.0 3.0
March 4.3 4.2 1.4 1.4
2007 6.0 5.8 2.6 2.2

91
by monetary policy. In December 2007, the steepest
drop in lending rates was recorded in working capital
and investment credit, in contrast to the thin decline in
rates for consumption credit and especially unsecured
loans and credit cards (Chart 6.4). However, when
overall average lending rates are compared by category
of bank, regional development banks were the most
reluctant to lower their lending rates, while private
national banks in fact cut their loan rates by more
than the banking industry average. Since September
2007, lending rates for various uses have been
marked by slowing decline understood to be linked
to the achievement of bank business plans, renewed
increases in deposit rates and bank caution regarding
the future of the economy.
Banks responded to the movement in the BI Rate
by switching to shorter-term funding structures. At
end-2007, growth in depositor funds reached 17.4%,
ahead of 14.1% at the end of 2006 (Chart 6.5),
providing banks with ample liquidity. This increase was
dominated by savings deposits, which now command

92
a larger share than demand deposits (Chart 6.6). Time
deposits, on the other hand, saw growth taper off,
particularly in the case of 24 and 12 month deposits
in response to the steep interest rate decline for these
tenors. As a result, deposit funds became increasingly
concentrated in the 1-month tenor (Chart 6.7). At
the same time, the upward trend in foreign currency
deposits led by time deposits, which appears to be
generally linked to falling returns on rupiah deposits,
heightened perceptions of depreciation and inflation
expectations over a certain period.
The strong response to the BI rate was also evident in
accelerated credit expansion. Credit expansion at end-
2007 was recorded at 25.5%, having climbed sharply
from only 14.1% at the end of 2006 (Chart 6.5). More
robust credit expansion was particularly noticeable
during the second half of 2007, when the economy
gained momentum. As a result, credit expansion for
the banking industry as a whole surpassed the initial
forecast early in the year (22%). Accelerated credit
expansion was reported for all categories of use, with
working capital credit in the lead (Chart 6.8). This credit
was channelled into a wide range of economic sectors,
with credit growth advancing most rapidly in mining,
business services, transportation and construction.
The year 2007 also recorded brisk growth in foreign
currency lending, which surpassed the overall rate of
credit expansion. This strong growth in foreign currency
lending was channelled mainly for working capital
and investment in traded sectors, including mining,
and non-traded sectors such as trade, construction
and business services. The surge in foreign currency
loans appears to be related to attractive interest rates
for these loans in the 6.9%-10.4% range and the
confidence demonstrated by some business actors
in Bank Indonesia’s commitment to exchange rate
stability.
On the stock market, response to the BI Rate was
evident in the bullish market trend. Stock index
movement varied considerably during 2007, while
maintaining an upward trend. At end of year, the IDX

93
Composite Index closed at 2,745 points or 52.1%
up from the end of 2006 (Chart 6.9). With this index
growth, the Indonesian Stock Exchange (IDX) ranked
the second best-performing market in 2007 after
China. This achievement was underpinned by a range
of domestic and global factors. Domestic factors
included macroeconomic stability, represented by
movement in the BI Rate, rising purchasing power
and the sound condition of the micro fundamentals
of some listed companies. At the same time, global
factors included positive perceptions among foreign
investors and sustained high world commodity prices.
The irrepressible rise in the IDX index also stimulated
market liquidity, with average turnover reaching Rp4.3
trillion per day compared to the previous year’s average
of only Rp1.8 trillion per day.
The government bonds market responded to the BI
Rate with a renewed surge in trading activity despite
relatively stable yields. Trading in government securities
maintained an overall upward trend, reflected in rising
volume and frequency of transactions. Government
bonds trading in 2007 averaged Rp5.8 trillion per
day, up significantly from the preceding year (Rp3.3
trillion per day). Average frequency of trading mounted
to 253.4 transactions per day, also representing a
significant climb in comparison to 146.7 per day in
2006 (Chart 6.11). At the end of 2007, average yield on
government bonds in various tenors eased by a thin 17
bps from one year earlier. The modest decline in yield is
explained most importantly by strong global sentiment
over the subprime mortgage crisis and soaring world
crude oil prices in the second half of 2007 (Chart 6.10).
Before this, yield had been in steady decline in keeping
with stable macroeconomic conditions.
The BI Rate was one factor that encouraged steady
growth in mutual fund Net Asset Value (NAV). At
end-2007, NAV in mutual funds reached Rp92.2
trillion, representing growth of 78.6% over the end
of 2006 (Chart 6.12). The steep rise in NAV resulted
largely from price appreciation, particularly in equity
funds. Total net subscriptions/new cash flow mounted
Rp20.2 trillion, also dominated by equity funds. While
conducive macroeconomic conditions played a role,
these gains were also bolstered by growing investor
knowledge following the aggressive public education
and promotion campaign launched by mutual fund
sales agents, as well as support from a more robust
legal framework. As a result, mutual funds have not
only expanded in NAV, but also in diversity of offerings.
At end-2007, mutual funds represented a total of 473
products, up from 403 products one year earlier.
The adjustments in the BI Rate met with positive
response in more vigorous financing of economic
activity from outside the banking sector. The ongoing
economic expansion amid macroeconomic stability and
a bullish stockmarket trend prompted greater demand
for corporate financing. In 2007, corporate financing
from the capital market reached Rp78.3 trillion, a
remarkable increase of 236.1% over the end of 2006

94
(Rp23.3 trillion). Of this total, Rp47.0 trillion originated
from initial public offering (IPOs) and right issues and
the remainder was raised through bond issues. IPOs
were held by 21 companies for a total value of Rp17.2
trillion, with rights issues mobilizing a further Rp29.8
trillion used primarily for business expansion. Forty-
three companies issued bonds, with proceeds used
mostly for refinancing.
Real Sector Response
The lowering of the BI Rate was regarded as adequate
to boost optimism for doing business in Indonesia.
Confirming this were the findings in the business
tendencies survey by the Central Statistics Agency
(BPS). This survey pointed to an improving trend in
business tendencies in keeping with the prudently
managed macroeconomic conditions and outlook
for continued economic expansion (Chart 6.13).
Consumers also developed positive perceptions of
monetary policy, reflected in the upswing in aggregate
consumer expectations for economic outlook, incomes
and availability of employment (Chart 6.14).

95
chart credibility gains, which has paid off in addressing
the challenges for achievement of the inflation target in
the coming years.
Liquidity
Base Money and Excess Banking Liquidity
Base money underwent expansion in line with the pace
of economic activity. At end-2007, base money reached
Rp379.6 trillion with growth at 27.8% (Table 6.2). This is
The monetary policy stance also eased inflation
expectations among economic agents. In 2007, the
commitment and consistency upheld in monetary
policy for inflation control proved adequately effective
in influencing the inflation expectations of real sector
agents (Chart 6.15) and financial market analysts
(Chart 6.16). This points to steady improvement in
policy transparency, reflected in the growing ability
among stakeholders to understand the Bank Indonesia
monetary policy. This has enabled Bank Indonesia to
Table 6.2
Developments in Base Money
billions Rp
2005 2006 2007
Base Money 239,781 297,080 379,582
I Currency in Circulation 144,869 178,572 220,785
1. Currency Outside Banks 124,316 151,009 183,419
2. Cash in Banks Vaults 20,553 27,563 37,366
II Commercial Bank Transferable Deposits at BI 94,531 118,417 158,452
III Private Sector Transferable Deposits 381 91 345
Net Foreign Assets 173,806 274,694 356,883
Net Domestic Assets 65,976 22,386 22,700
I Net Claims on Central Government 39,357 49,865 49,458
II Claims on Banks 233,398 243,220 227,555
III Other Claims 19,984 19,919 8,407
IV Open Market Operation (121,325) (242,001) (281,163)
1. SBI (74,632) (208,762) (247,687)
2. BI Deposits Facility (57,212) (41,568) (48,933)
3. Government Bonds 10,519 8,330 15,457
V Net Other Items -105,438 -48,618 18,444

96
explained mainly a steep rise in currency in circulation
consistent with the ongoing economic expansion in
the real sector. However, statutory reserves held by
banks grew at a more moderate rate. The Loan to
Deposit Ratio (LDR) incentive resulted in a reduction
of Rp1.0 trillion in the statutory reserve requirement.
Besides statutory reserves, bank excess reserves were
up significantly over the previous year. This occurred
during the closing days of 2007, a result of realized
government expenditures at the end of the year.
Average 2006 2007C/PDB 3,9 3,9M1/PDB 10,0 10,4M2/PDB 40,2 39,4
Base money expansion was driven primarily by activity
on the part of the Government and Bank Indonesia.
The Rp82.5 trillion surge in demand for base money
over the previous year was adequately offset by
expansionary Government rupiah transactions and
activity by Bank Indonesia (Chart 6.17). Net liquidity
expansion from Government account at Bank Indonesia
reached Rp66.9 trillion, down significantly from 2006
(Rp115.1 trillion). With the fiscal deficit widening from
0.9% of GDP in 2006 to about 1.3% of GDP in 2007,
this decline was reportedly related to the switch in the

97
Rp39.2 trillion to Rp281.2 trillion. The rise in the OMO
position reflects the steady increase in excess liquidity
on the money market that could not be optimally
absorbed into economic activities in the real sector
(Chart 6.18). This will be addressed through a range
of actions, including financial deepening, and further
strengthening of commitment and consistency on the
part of Bank Indonesia in its monetary operations on
the money market. Added to this, various policies in the
real sector will be reinforced to accelerate economic
growth and create greater capacity to absorb excess
liquidity on a permanent basis.
Government financing strategy to renewed emphasis
on domestic issuance of government bonds rather than
making use of the account at Bank Indonesia. At the
same time, Bank Indonesia activity boosted liquidity
from the costs of monetary management. This was
consistent with the Bank Indonesia commitment for
maintaining rupiah stability in support of sustainable
macroeconomic stability.
With mounting excess liquidity on the money market,
Bank Indonesia took action in OMOs to absorb liquidity.
During 2007, the aggregate OMO position widened by
Table 6.3
Monetary Aggregates
2006 2007 2006 2007
Billions Rp Growth (percent)
Broad Money (M2) 1,382,074 1,643,203 14.87 18.89
M2 Rupiah 1,198,141 1,427,296 18.13 19.13
Narrow Money (M1) 361,073 460,842 28.08 27.63
– Currency Outside Banks 151,009 183,419 21.47 21.46
– Demand Deposits 210,064 277,423 33.30 32.07
Quasi Money 1,021,001 1,182,361 10.82 15.80
– Deposits in Rupiah 837,068 966,454 14.30 15.46
= Time Deposits 506,565 533,376 11.94 5.29
= Saving Deposits 330,503 433,078 18.10 31.04
– Deposits in Foreign Currencies 183,933 215,907 (2.65) 17.38
(billions $) 20,392 22,922 6.09 12.41
Net Foreign Assets 413,265 524,703 32.00 26.97
Bank Indonesia: 377,936 530,913 51.09 40.48
– Foreign Assets 385,820 538,775 12.19 39.64
– Foreign Liabilities 7,884 7,862 (91.59) (0.28)
Commercial Banks: 35,329 -6,210 (43.87) (117.58)
– Foreign Assets 93,924 70,907 (20.89) (24.51)
– Foreign Liabilities 58,595 77,117 5.03 31.61
Net Domestic Assets 968,809 1,118,500 8.84 15.45
1. Net Claims on Central Government 506,488 497,478 1.52 (1.78)
– Bank Indonesia 265,919 249,069 11.19 (6.34)
– Commercial Banks 240,569 248,409 (7.39) 3.26
2. Net Claims to IBRA 0 0
3. Claims to Enterprises 837,072 1,040,996 13.29 24.36
– Loans to Private Sector 787,136 995,111 14.13 26.42
Loans to Private Sector (billions $) 87,27 105,65 24.38 21.07
= Loans in Rupiah 639,152 793,186 12.84 24.10
= Loans in Foreign Currency 147,984 201,925 20.09 36.45
Loans in Foreign Currency (billions $) 16,41 21,44 30.88 30.67
– Other Claims 49,936 45,885 1.55 (8.11)
4. Net Other Items -374,751 -419,974 7.81 12.07

98
The BI Rate has a strong bearing on movement in the
components of economic liquidity. The downward
movement in the BI Rate influenced economic liquidity
components by producing a shift in public liquidity
preferences, as evident in the accelerated growth in
savings deposits relative to time deposits. This was
followed by mounting activity in privately-held demand
deposits in line with bullish activity on the stock
market. Activity in privately-held demand deposits was
dominated by insurance companies, pension funds and
other private business (including securities companies
and investment managers). As shown in Chart 6.23, the
stock index has demonstrated a markedly increased
correlation with this category of demand deposits since
2005. This augurs for the possibility of an expanded
institutional investor role on the domestic stock market.
The expansion in economic liquidity was dominated
by domestic factors. Claims on business sector had
a leading influence over levels of economic liquidity.
Growth in claims on business sector reached 26.4% in
December 2007, representing an increase of Rp208.0
trillion over the end of 2006. Of this total, Rp154.0
trillion comprised credit extended in rupiahs, while
the remaining Rp54 trillion, equivalent to US$5 billion,
was loans extended in foreign currencies. External
factors bearing on economic liquidity were reflected
in the overall 27.0% expansion in net foreign assets
(NFA), representing an increase of Rp111.4 trillion. This
increase took place in NFA held by Bank Indonesia in
line with the hefty rise international reserves from the
windfall in oil and gas revenues generated by soaring
oil world oil prices. Despite this, the banking system
reported a decline in NFA, particularly in foreign assets
held in call money and demand deposits at overseas
banks.
Economic Liquidity
Economic liquidity, reflected in M1 and M2, expanded
considerably during 2007. At the end of December, the
narrow money (M1) widened 27.6%, to Rp460.8 trillion.
The broad money (M2) grew 18.9% to reach Rp1,643.2
trillion. This growth in economic liquidity is markedly
high compared to the historical condition over the past
five years, despite relative stability in terms of ratio to
GDP compare to the previous year (Chart 6.20). The
rapid expansion in economic liquidity is an indication of
potential for future inflationary pressure1 (Chart 6.21).
As a result of this nominal expansion, real M1 and M22
growth reached 21.0% and 12.3% (Chart 6.22).
1 In the chart, M1 growth is a leading indicator for inflation 18 months forward.
2 Calculated by CPI inflation.