overlapping species boundaries and hybridization within
TRANSCRIPT

q 2004 The Paleontological Society. All rights reserved. 0094-8373/04/3003-0004/$1.00
Paleobiology, 30(3), 2004, pp. 396–425
Overlapping species boundaries and hybridization within theMontastraea ‘‘annularis’’ reef coral complex in the Pleistocene ofthe Bahama Islands
Ann F. Budd and John M. Pandolfi
Abstract.—Recent molecular analyses indicate that many reef coral species belong to hybridizingspecies complexes or ‘‘syngameons.’’ Such complexes consist of numerous genetically distinct spe-cies or lineages, which periodically split and/or fuse as they extend through time. During splittingand fusion, morphologic intermediates form and species overlap. Here we focus on processes as-sociated with lineage fusion, specifically introgressive hybridization, and the recognition of suchhybridization in the fossil record. Our approach involves comparing patterns of ecologic and mor-phologic overlap in genetically characterized modern species with fossil representatives of thesame or closely related species. We similarly consider the long-term consequences of past hybrid-ization on the structure of modern-day species boundaries.
Our study involves the species complex Montastraea annularis s.l. and is based in the Bahamas,where, unlike other Caribbean locations, two of the three members of the complex today are notgenetically distinct. We measured and collected colonies along linear transects across Pleistocenereef terraces of last interglacial age (approximately 125 Ka) on the islands of San Salvador, Andros,and Great Inagua. We performed quantitative ecologic and morphologic analyses of the fossil data,and compared patterns of overlap among species with data from modern localities where speciesare and are not genetically distinct.
Ecologic and morphologic analyses reveal ‘‘moderate’’ overlap (.10%, but statistically signifi-cant differences) and sometimes ‘‘high’’ overlap (no statistically significant differences) amongPleistocene growth forms (5 ‘‘species’’). Ecologic analyses show that three species (massive, col-umn, organ-pipe) co-occurred. Although organ-pipes had higher abundances in patch reef envi-ronments, columnar and massive species exhibited broad, completely overlapping distributionsand had abundances that were not related to reef environment. For morphometric analyses, weused multivariate discriminant analysis on landmark data and linear measurements. The resultsshow that columnar species overlap ‘‘moderately’’ with organ-pipe and massive species. Compar-isons with genetically characterized colonies from Panama show that the Pleistocene Bahamas spe-cies have intermediate morphologies, and that the observed ‘‘moderate’’ overlap differs from themorphologic separation among the three modern species. In contrast, massive and columnar spe-cies from the Pleistocene of the Dominican Republic comprise distinct morphologic clusters, similarto the modern species; organ-pipe species exhibit ‘‘low’’ overlap (,10%, only at species margins)with columnar and massive species.
Assuming that ‘‘moderate’’ overlap implies hybridization and ‘‘high’’ overlap implies more com-plete lineage fusion, these results support the hypothesis of hybridization among species withinthe complex in the Bahamas during the Pleistocene. Hybridization involved introgression of threedistinct evolutionary lineages, in association with Pleistocene sea level and temperature fluctua-tions, and appears to have been limited geographically primarily to the Bahamas and the northernCaribbean. Thus, not only does the structure of species boundaries within the complex vary geo-graphically, but these geographic differences may have persisted since the Pleistocene.
Ann F. Budd. Department of Geoscience, University of Iowa, Iowa City, Iowa 52242. E-mail: [email protected]
John M. Pandolfi.* Department of Paleobiology, MRC 121, National Museum of Natural History, Smith-sonian Institution, Washington D.C. 20560-0121. E-mail: [email protected]
*Present address: Centre for Marine Studies and Department of Earth Sciences, University of Queensland,Brisbane, Queensland 4072, Australia
Accepted: 14 January 2004
IntroductionUnderstanding how species boundaries
form and maintain their integrity over geolog-ic time is fundamental to understanding thehigh biodiversity of tropical coral reef ecosys-tems. This is particularly true of reef-building
corals, many of which live sympatrically andare broadcast spawners, thereby increasingthe potential for interspecific hybridizationand reticulate evolution (Veron 1995). For ex-ample, in Caribbean Acropora, Van Oppen etal. (2000) and Vollmer and Palumbi (2002)

397OVERLAPPING SPECIES BOUNDARIES IN REEF CORALS
have recently discovered that one ‘‘species’’(A. prolifera), which possesses a unique colonymorphology, is actually a hybrid, thus addingto short-term estimates of reef diversity. How-ever, A. prolifera is sterile, reproducing only byfragmentation. It therefore has no evolution-ary potential and contributes little geneticallyto the long-term development and mainte-nance of reef diversity.
In contrast, similar molecular analyses ofIndo-Pacific Acropora (Odorico and Miller1997; Hatta et al. 1999; van Oppen et al. 2001,2002) suggest that many species of the genusbelong to hybridizing species complexes or‘‘syngameons,’’ in which introgressive hy-bridization has enhanced additive genetic var-iation and contributed to the generation of ex-traordinary species diversity. Although syn-gameons are composed of genetically distinctlineages (Marquez et al. 2002), morphologic‘‘species’’ do not always correspond with ge-netic units; instead, differences in spawningtimes are responsible for reproductive barri-ers. Still other studies have shown that hy-bridization has led to homogenization of genepools, reducing diversity in certain geograph-ic areas. Two examples are Platygyra (Millerand Benzie 1997) and the Montastraea ‘‘annu-laris’’ complex (Szmant et al. 1997; Fukami etal. 2004). The latter results, in addition tothose of Rodriguez-Lanetty and Hoegh-Guld-berg (2002) on Plesiastrea versipora, suggestthat geography plays an important role in thecohesiveness of species and the structure ofspecies boundaries. Species complexes may bestructured differently in different geographicareas, because genetic variability results fromthe accumulation of historical events overthousands of years (Benzie 1999).
One important, yet unexplored avenue inthis research involves the study of speciesboundaries over tens to hundreds of thou-sands of years, and how they change throughspace and time. In this paper, we characterizespecies boundaries within one syngameonand test for hybridization in the fossil record.In our analyses, we follow Harrison’s (1990)definition of hybridization as interbreeding ofindividuals from populations that are distin-guishable on the basis of one or more heritablecharacters. We focus in particular on intro-
gressive hybridization, which results in incor-poration of genes from one species into thegene pool of another. To recognize such hy-bridization in the fossil record, we comparepatterns of morphologic overlap and distinc-tiveness in fossil species with those in relatedmodern species, in which there is genetic ev-idence for hybridization (polymorphism). Asrevealed by comparisons of molecular andmorphologic data in modern species (Fukamiet al. 2004), non-hybrid (pure) populationsform distinct morphologic clusters in sympat-ry, which do not overlap and are usually sep-arated by gaps. Hybridizing populations aremorphologically intermediate between theirparent species (which are distinct, as definedabove) and may overlap with parent or otherrelated hybrid populations in one or moremorphologic characters. In contrast, in morecomplete lineage fusion, parent populationshave no distinguishing characteristics.
Our analyses focus on the Montastraea ‘‘an-nularis’’ complex in the late Pleistocene of theBahama Islands. The complex ecologicallydominates many modern, shallow-water reefswithin the Caribbean region, and has done sosince Plio-Pleistocene faunal turnover at ap-proximately 2–1.5 Ma (Knowlton and Budd2001). By combining rigorous sampling andmorphometric analyses with quantitative eco-logic surveys, we address the following ques-tions:
1. How many species exist within the com-plex in the Bahamas region during the latePleistocene (last interglacial age, about 125Ka)? Do these species represent distinctmorphologic clusters separated by well-de-fined gaps, or is there evidence for speciesoverlap and intermediates, suggesting hy-bridization?
2. Are patterns of morphologic variationwithin or among species related to local en-vironmental factors (and thus adaptive) orto geography?
3. Do local environmental or geographic dis-tributions differ among species, indicatingniche differentiation?
4. Are the Pleistocene Bahamian species thesame as the modern species? Are they thesame as species at other Pleistocene Carib-

398 ANN F. BUDD AND JOHN M. PANDOLFI
bean locations? How does the nature ofspecies boundaries vary in space and intime?
5. What criteria can be used to recognize hy-bridization in the fossil record and trace itthrough geologic time?
Specifically we test the recently proposedhypothesis of Fukami et al. (2004) based onmolecular data that hybridization may haveoccurred within the complex in the Bahamasin the geologic past and an ancestral poly-morphism may have been maintained withinspecies of the complex over the past 125 Kyr.We focus in particular on recognition of hy-bridization in the fossil record. In our analy-ses, we do not attempt to quantify amounts ofobserved overlap because of unequal samplesizes. However, we do categorize overlap as(1) ‘‘low’’ (occurring only at species margins,indicating little or no hybridization), (2)‘‘moderate’’ (.10%, with the overlappingpopulations being statistically significantlydifferent, indicating hybridization but incom-plete lineage fusion), and (3) ‘‘high’’ (popu-lations are not statistically significantly differ-ent, indicating complete lineage fusion).
Our results show that species within thecomplex overlap at a ‘‘moderate’’ to ‘‘high’’level in morphology and ecology in the latePleistocene of the Bahamas. The degree ofoverlap is notably higher than in older Plio-Pleistocene sites in Costa Rica and Panama(Budd and Klaus 2001) and contemporaneouslate Pleistocene terraces in Barbados (Pandolfiet al. 2002) and in the southern Dominican Re-public (Klaus and Budd 2003), where specieswithin the complex co-occur but remain mor-phologically distinct or exhibit only ‘‘low’’overlap at species margins. These results sup-port the findings of recent molecular analyses,in which the lack of genetic distinctiveness ob-served among modern members of the com-plex is interpreted as having been caused byhybridization in the geologic past (Fukami etal. 2004). They contrast with the results of sim-ilar analyses in other geographic regions (Pan-dolfi et al. 2001, 2002), in which character dis-placement (morphologic distinctiveness) driv-en by competition is interpreted among co-oc-curring species within the complex. Taken
together, studies of the species complex todate support the notion of geographical dif-ferentiation in species boundaries, which ex-isted under different environmental condi-tions during the Pleistocene and persist untiltoday.
After reviewing relevant background infor-mation in the section entitled ‘‘The Montastraea‘‘annularis’’ species complex,’’ this paper is or-ganized into sections entitled ‘‘Material andMethods,’’ ‘‘Results,’’ and ‘‘Discussion.’’ Eachof these three main sections first contains asubsection on ecology (environments and spa-tial distributions) followed by a subsection onmorphology (morphometric analyses). In ad-dition, the methods section begins with a sub-section on ‘‘Localities and Sampling.’’ The re-sults section ends with a subsection on ‘‘Com-parisons in Time and Space,’’ and the discus-sion section ends with inferences concerning‘‘Hybridization and Reticulate Evolution.’’
The Montastraea ‘‘annularis’’ SpeciesComplex
Genetics. The Montastraea annularis speciescomplex was first recognized by Knowlton etal. (1992) and Weil and Knowlton (1994), whoproposed that the widely known generalist M.‘‘annularis’’ was actually a complex of at leastthree sympatric and morphologically similarspecies in shallow to mid depths of Panama:(1) M. annularis sensu stricto (Ellis and Solan-der 1786), which forms smooth columns withsenescent edges; (2) M. faveolata (Ellis and So-lander 1786), which forms smooth moundsand plates with non-senescent edges; and (3)M. franksi (Gregory 1895), which formsbumpy mounds and plates with non-senes-cent edges. The original evidence for the com-plex was based on covariation between colonymorphology and a number of traits includingallozymes, aggressive behavior, ecology, lifehistory, symbiont distribution, and corallitemorphometrics (Tomascik 1990; Knowlton etal. 1992; Van Veghel and Bak 1993; Rowan andKnowlton 1995).
Initial analyses of allozymes sampled fromthese populations showed that M. faveolata isdistinguished by a nearly fixed difference atone locus as well as frequency differences atothers (Knowlton et al. 1992; Van Veghel and

399OVERLAPPING SPECIES BOUNDARIES IN REEF CORALS
Bak 1993; Weil and Knowlton 1994). Subse-quent study of three amplified fragmentlength polymorphism (AFLP) loci and thenoncoding region of the mitochondrial ge-nome has revealed that M. faveolata is stronglydifferentiated from M. annularis s.s. and M.franksi (Lopez and Knowlton 1997; Lopez etal. 1999; Fukami et al. 2004). Although nofixed or nearly fixed differences have yet beendiscovered between M. annularis s.s. and M.franksi, analyses at one AFLP locus and in thenoncoding region of the mitochondrial ge-nome have revealed quantitative differences.
The potential for hybridization is supportedby the fact that the three species cross-fertilizein the lab (Knowlton et al. 1997). However,spawning times in M. annularis s.s. and M.franksi characteristically differ by one to twohours, a sufficient time period to prohibit nat-ural fertilization. Although spawning times inM. annularis s.s. and M. faveolata are the same,rates of interspecific fertilization are low be-tween M. faveolata and the other two species.
Morphology. The Montastraea ‘‘annularis’’complex was not discovered prior to the allo-zyme work of Knowlton et al. (1992), becausetraditional morphologic characters do notprovide enough resolution to make fine dis-tinctions among species. Species of Montas-traea have traditionally been distinguished onthe basis of corallite diameter, number of sep-tal cycles, the relative development of differ-ent septal cycles, and the distance betweencorallites (Vaughan 1919). Although corallitediameter (2–3.5 mm) and number of septal cy-cles (three cycles or 24 septa per corallite) areeffective at distinguishing the complex as awhole, initial analyses of these ‘‘characters’’revealed no single diagnostic differenceamong species within the complex (Knowltonet al. 1992; Weil and Knowlton 1994). Analysesof variance and canonical discriminant anal-ysis using these characters revealed statisti-cally significant differences among species inPanama (Weil and Knowlton 1994) and Cu-racao (van Veghel and Bak 1993); however, thedata distributions of these characters over-lapped ‘‘moderately’’ among species.
Recent analyses using nontraditional cor-allite architectural characters (Knowlton andBudd 2001; Budd and Klaus 2001; Pandolfi et
al. 2002) revealed that the three species arediscrete and do not overlap. These charactersinclude the size and shape of the costosepta(septa 5 radiating partitions within corallites;costae 5 extensions of the septal partitions be-yond the wall; costoseptum 5 a septum 1 itscostal extension) and the structure of the cor-allite wall, and are best revealed in three di-mensions on colony surfaces. Morphometricanalyses showed that costae are thicker andbetter developed in M. franksi, intermediate inM. annularis s.s., and short and thin in M. fav-eolata. Septal relief is high in M. faveolata, in-termediate in M. annularis s.s., and low in M.franksi; and tertiary septa are least developedin M. faveolata (Knowlton and Budd 2001;Budd and Klaus 2001). Cluster analysis usingthese characters showed distinct clusters ofcolonies, which closely match the results of ge-netic analyses performed on the same material(Budd and Klaus 2001: Fig.1).
Calical surfaces are often worn in fossil ma-terial, making 3-D measurements unfeasible.Comparisons between 3-D measurementsmade on colony surfaces and 2-D measure-ments made on transverse thin-sections usingthe same modern colonies (Knowlton andBudd 2001; Budd and Klaus 2001) indicatedthat 2-D measurements also reveal no overlapamong species within the complex. However,2-D measurements are less effective at inter-preting relationships among species. In these2-D analyses, cluster analysis dendrogramsshowed that 100% of 30 genetically character-ized colonies (ten M. annularis s.s., ten M. fav-eolata, and ten M. franksi from the San Blas Is-lands of Panama) were correctly assigned tospecies (Budd and Klaus 2001: Fig.4). In ad-dition to differences in the length and widthof the costae and tertiary septa, the corallitewall is formed primarily by dissepiments(parathecal) in M. faveolata, and by septalthickening (septothecal) in M. annularis s.s.and M. franksi (Fig. 1).
In addition to corallite characters, severalnontraditional colony-level characters havebeen found to differ among species (Holcombet al. 2004). They consist of linear distancesand angles measured on X-radiographs oflongitudinal slabs cut through colony growthaxes, and are related to upward colony growth

400 ANN F. BUDD AND JOHN M. PANDOLFI
FIGURE 1. Transverse thin-sections of representativecorallites of the three living species within the Montas-traea ‘‘annularis’’ complex. Although corallites in thethree species are similar in diameter and numbers ofsepta, distinct differences appear in wall structure. Cor-allites of M. annularis s.s. (A) have walls formed by sep-tal thickening (septothecal), and well-developed exten-sions of costae beyond the wall. Corallites of M. faveolata(B) have very thin walls that are partially formed by dis-sepiments (parathecal); extensions of costae beyond thewall are reduced. Corallites of M. franksi (C) have thickseptothecal walls, formed by coalesced costosepta. CL,
←
columella; CN, coenosteum; PCS, primary costoseptum;TCS, tertiary costoseptum; W, wall. A, M. annularis s.s.(SUI 95206, a95-39); B, M. faveolata (SUI 95214, f95-16);C, M. franksi (SUI 95228, k97-1).
(extension rates), corallite budding angles,and colony curvature.
Geographic Variation and Hybridization. Fur-ther study of living members of the complexin the Bahamas shows that the distinct bound-aries among species are blurred near thenorthern extent of their distribution. M. an-nularis s.s. and M. franksi cannot be geneticallydistinguished in the Bahamas, and some M.faveolata colonies have an M. annularis s.s.-likegenome (Fukami et al. 2004). Colony mor-phologies of the three species intergrade(Szmant et al. 1997). For example, M. annulariss.s. does not exhibit a consistent columnarmorphology; its colonies range from columnsto massives to plates (N. Knowlton personalobservation 2000). Moreover, morphometricanalyses showed corallite morphologies of M.annularis s.s. (columns) and M. franksi (plates)converge on that of M. faveolata (massives). Asa result, the three modern species overlap andhave intermediate morphologies (Fig. 2). Theresults of genetic analyses suggested that theobserved overlap may have been caused by anancestral polymorphism resulting from hy-bridization in the geologic past (Fukami et al.2004). The ancestral polymorphism has beenmaintained in Bahamian M. annularis s.s., butlost in the other two modern species withinthe complex. No genetic evidence has beenfound for modern-day gene introgression orhybridization (Fukami et al. 2004), as has beenobserved in Pacific Acropora and is believed re-sponsible for explosive species diversificationwithin Acropora since the Pleistocene (Odoricoand Miller 1997; Hatta et al. 1999). As indicat-ed previously, here we examine patterns ofoverlap in the fossil record to test for the hy-pothesized hybridization in the geologic past.
Occurrences in the Fossil Record. Morpho-metric analyses of Plio-Pleistocene fossil se-quences in Costa Rica and Panama using 2-Dtransverse thin-section data indicated that thethree modern members of the M. ‘‘annularis’’complex originated during Plio-Pleistocene

401OVERLAPPING SPECIES BOUNDARIES IN REEF CORALS
FIGURE 2. Canonical discriminant analysis of three-di-mensional landmark data on genetically characterizedsamples of the three modern species from Panama (Bo-cas, San Blas) and from the Bahamas (after Fukami et al.2004: Fig. 5). Each point on the plot represents one col-ony. Solid polygons enclose colonies of the same speciesfrom Panama; dotted polygons enclose colonies of thesame species from the Bahamas. The first three discrim-inant functions in the analysis were statistically signif-icant; functions one and three maximize the differencesbetween the Panamanian species. Relative developmentof major vs. minor costae and septum height are strong-ly correlated with function one; costa length, minor sep-tum length, and wall thickness are inversely correlatedwith function three.
FIGURE 3. Cladogram (A) and phylogenetic tree (B)constructed for species within the M. ‘‘annularis’’ spe-cies complex (after Pandolfi et al. 2002: Fig. 1). Thick ver-tical lines for each species represent documented strati-graphic ranges; dotted lines represent relationships in-ferred from the cladistic analysis. Numbers refer to fos-sil Costa Rican and Panamanian species distinguishedin Budd and Klaus 2001; CL and OP refer to fossil Bar-bados species in Pandolfi et al. 2002; ANN, modern Pan-amanian M. annularis s.s.; FRA, modern Panamanian M.franksi; FAV, modern Panamanian M. faveolata. See Pan-dolfi et al. 2002 for analytical details.
turnover before the high extinction peak inCaribbean corals 2–1.5 million years ago (Fig.3) (Budd and Johnson 1999; Budd and Klaus2001). Two of the three modern species (M.franksi, M. faveolata) first appeared in the fossilrecord 3–4 million years ago and have beenmorphologically distinct in the central andsouthern Caribbean throughout their dura-tion. Two to three undescribed fossil specieswere closely related to each of the two modernspecies, suggesting that the modern speciesare survivors of previously more diverseclades. The most likely ancestor of the twoclades occurred in the Dominican Republic4.5–5.5 million years ago and was morpholog-ically similar to M. franksi (Budd and Klaus2001). The third modern species (M. annulariss.s.) does not appear in the fossil record untilabout 500 Ka, and it is more closely related toM. franksi than to M. faveolata (Pandolfi et al.2002).
Studies of coastal terraces in Barbados (Pan-dolfi et al. 2002), Curacao (Pandolfi and Jack-son 2001), and the southern Dominican Re-public (Klaus and Budd 2003) indicated thatthe three modern species within the complex
coexisted with one another and at least oneother species (organ-pipe Montastraea, de-scribed in Pandolfi et al. 2001) at scattered Ca-ribbean locations during late Pleistocene time.Although the local ecologic distributions ofthe four species overlapped, different specieswithin the complex had peak abundances indifferent reef environments in Curacao (Pan-dolfi and Jackson 2001) and Barbados (Pan-dolfi et al. 2001, 2002). Colony and corallitemorphologies were distinct in the four speciesat each geographic location, and variationwithin species was constrained in sympatry(Pandolfi et al. 2002). After extinction of theorgan-pipe species in the latest Pleistocene toearly Holocene, the colony morphology of M.annularis s.s. shifted from thick to thin col-

402 ANN F. BUDD AND JOHN M. PANDOLFI
TABLE 1. Summary of transects used in collecting samples and environmental and ecologic data. Statistical com-parisons among islands and environments were performed with the Kruskal-Wallis H-test. For environments, 1 5reef crest, 2 5 patch reef, 3 5 forereef.
Transect
Envi-ron-ment Island Location
Collections
Total no.analyzedcolonies
Col-umn Mound
Organ-pipe
BP99-3w, 4mBP99-5w, 6mBP99-7w, 8mBP99-9w, 10mBP99-11w, 12mBP99-13w, 14m
222233
San SalvadorSan SalvadorSan SalvadorSan SalvadorAndrosAndros
Sue Point-noSue Point-soCockburn Town-soCockburn Town-noRat CayNicholls Town
422
1133
011422
200001
211710
BP99-15w, 16mBP99-17w, 18mBP99-19w, 20mBP99-21w, 22mBP99-23w, 24mBP99-25w, 26m
121112
Great InaguaGreat InaguaGreat InaguaGreat InaguaGreat InaguaGreat Inagua
north Devil’s Pointnorth Devil’s Pointnorth Devil’s Pointnorth Devil’s Pointwest Devil’s Pointwest Devil’s Point
1614
4131222
106398
11
410123
271328
TOTAL 106 57 14 35
Comparisons among islands Chi-squaredfp-value
umns, indicating character release followingremoval of ecologically similar species andcorresponding to change in ecologic domi-nance patterns within the complex (Pandolfiet al. 2001, 2002).
Material and Methods
Localities and Sampling. A total of 106 col-onies of M. ‘‘annularis’’-like corals (Appendix1) were collected and morphometrically ana-lyzed along 12 transects across well-preservedlate Pleistocene terrace exposures on three Ba-hama Islands: (1) San Salvador, four transects,19 colonies; (2) Andros, two transects, 6 col-onies; (3) Great Inagua, six transects, 81 col-onies (Table 1, Fig. 4). Uranium-thorium dat-ing has indicated that exposures at all three lo-cations were deposited between 132 and 118Ka during the Sangamon sea-level highstand(White 1989; Chen et al. 1991). The three is-lands contain exposures of two leeward (SanSalvador, Great Inagua) reef systems and onewindward (Andros) reef system, which occuron widely separated and discrete carbonateplatforms across the island complex. The se-quences at San Salvador (Curran and White1984, 1985; White 1989) and Great Inagua(White and Curran 1995) have been mappedand interpreted as shallowing-upward facies,
terminated by burial during sea regression(White and Curran 1987; Chen et al. 1991).
On San Salvador, two 40-m transects weremeasured along the terrace surface at SuePoint (White 1989), and two 40-m transectswere measured at Cockburn Town (Curranand White 1984, 1985; Chen et al. 1991). At SuePoint, White (1989) has described and inter-preted the exposure as representing ‘‘Montas-traea-Diploria-Porites’’ patch reefs and as gen-erally containing less Acropora palmata than atCockburn Town. The entire exposure is inter-preted as stratigraphically younger (about 122Ka) than the brief sea-level lowstand at ap-proximately 125 ka or substage 5e (Chen et al.1991; White et al. 1998). One of our Sue Pointtransects was located on the north side of thepreviously mapped exposure (Map 1 of White1989), and the other was measured on thesouth side (Map 2 of White 1989); both weremeasured within 5–10 m of the present shore-line.
At Cockburn Town on San Salvador, the twotransects were located at the southeast end ofthe outcrop (i.e., southeast of ‘‘OphiomorphaBay’’) in coral rubblestone stratigraphicallybelow and older (about 127–128 Ka) than theerosional surface interpreted as a brief sea-level lowstand at roughly 125 Ka (Chen et al.

403OVERLAPPING SPECIES BOUNDARIES IN REEF CORALS
TABLE 1. Extended.
Transects
No. of speciesA. palmata
%A. cervicornis
%
M. annularis%
complex
Total no. ofcolonies along
transect% Upright
colonies% Wholecolonies
51010
977
23.813.440.501.400.000.00
0.004.53
16.3820.5671.9980.97
54.5765.0771.0070.5018.10
5.44
373333695450
67.5762.5083.8755.8848.1534.00
75.6871.8883.8758.8250.0038.00
1113
79
125
15.2117.0334.4662.8122.93
0.00
20.5714.55
2.232.89
38.500.36
15.1846.6320.0315.8523.1595.00
98112
48877430
40.8237.2339.5839.0231.0893.10
40.8229.7943.7543.9028.3893.10
1.478 4.479 4.647 5.436 2.605 4.205 4.1542 2 2 2 2 2 2
0.477 0.106 0.098 0.066 0.272 0.122 0.125
1991; White et al. 1998; Wilson et al. 1998).One transect was measured on the limited ex-posure south of the old town public dock, andthe second immediately north of the dock. Themain part of the Cockburn Town reef has beencharacterized as ‘‘bank/barrier reef,’’ or morespecifically ‘‘fossil reef crest zone, [which]consists of near in situ Acropora palmata andsubordinate A. cervicornis’’ (Curran and White1984: 71). However, the portion that we tran-sected has been interpreted as representing‘‘Montastraea-Diploria-Porites’’ patch reefs(Curran and White 1984, 1985) similar tothose at Sue Point.
On Andros, one 40-m transect was mea-sured at Rat Cay, and a second was measuredalong the old dock on the southeast shorelineat Nicholls Town. The Nicholls Town exposureis dated as approximately 120–128 Ka (Neu-mann and Moore 1975), and it is composed ofwell-preserved, in situ colonies of A. cervicor-nis, Diploria, Montastraea, and Porites (Tomb1995). No previous work has been publishedon the exposures at Rat Cay, but the facies andtheir geologic age are believed to be similar tothose at Nicholls Town (M. Boardman person-al observation 1999).
On Great Inagua, four 40-m transects weremeasured on the north side of Devil’s Point
(Chen et al. 1991: Fig. 3a), and two were mea-sured on the west side of Devil’s Point (Chenet al. 1991: Fig. 3b). The transects were locatedstratigraphically above and in sedimentsyounger (about 124 Ka north side and 122 Kawest side) than the brief lowstand erosion sur-face at roughly 125 Ka, and within 5–10 m ofthe present shoreline in deposits indicated as‘‘reef 2’’ by Chen et al. (1991). The north-sidetransects were placed in ‘‘coral rubblestone’’containing well-preserved, in situ colonies ofthe genera Acropora, Diploria, Montastraea, andPorites and interpreted as ‘‘bank/barrier reef’’by White and Curran (1987, 1995). The west-side transects were placed in the ‘‘in situ patchreef,’’ composed of Porites and Montastraea(Chen et al. 1991).
Each of the twelve 40-m transects was laidparallel to the shoreline through a well-pre-served portion of each exposure. We collectedfist-sized samples (106 total; Appendix 1)from representative well-preserved coloniesalong each transect for detailed morphometricanalysis. The samples were shipped to Iowa,and one transverse thin-section and one 7-mm-thick vertical slab were prepared fromeach sample. The samples will be deposited atthe National Museum of Natural History (Ap-pendix 1).

404 ANN F. BUDD AND JOHN M. PANDOLFI
FIGURE 4. Maps showing locations of the 12 transects (Table 1). All transects were laid across late Pleistocene coast-al terraces, dating between 132 and 118 Ka. A, San Salvador, transects 3w, 5w, 7w, 9w; B, Andros, transects 11w,13w; C, Great Inagua, transects 15w, 17w, 19w, 21w, 23w, 25w.
Environments and Spatial Distributions. Twodifferent types of data were recorded alongeach transect (Appendix 2): (1) whole-com-munity data (odd-numbered transects withthe suffix ‘‘w’’), used in environmental inter-pretations, and (2) Montastraea-only data(even-numbered transects with the suffix‘‘m’’), used in characterizing the spatial dis-tributions of different growth forms withinthe complex.
(1) Whole-community data: Using the meth-ods of Pandolfi (2001) and Pandolfi and Jack-son (2001), we recorded the intercept lengthsof all corals that crossed each transect line. In-dividual colonies were distinguished andidentified to species (19 total, including the M.‘‘annularis’’ complex as a single species; Ap-pendix 2). Following the approach of Knowl-ton et al. (1992), Weil and Knowlton (1994),and Pandolfi et al. (2001), we identified mem-

405OVERLAPPING SPECIES BOUNDARIES IN REEF CORALS
FIGURE 5. Field photos showing different growth forms of the M. ‘‘annularis’’ complex. Columns are circled inwhite. A, Columnar form, transect 15w, North Devil’s Point, Great Inagua. B, Columnar form, transect 9w, CockburnTown (north), San Salvador. C, Massive form, transect 9w, Cockburn Town (north), San Salvador. D, Massive form,transect 5w, Sue Point (south), San Salvador. E, Organ-pipe form, transect 19w, North Devil’s Point, Great Inagua.F, Organ-pipe form, transect 3w, Sue Point (south), San Salvador.
bers of the M. ‘‘annularis’’ complex in the fieldby growth form (organ-pipe, column, massive,plate). Organ-pipe colonies were qualitativelydefined as composed of numerous elongateskeletal pipes whose diameters were usuallyless than 10 cm thick; columnar colonies ascomposed of multiple skeletal columns (high-er than wide) with diameters usually 10–35cm thick; massive colonies as composed of ausually single mound-shaped skeletal mass
with a diameter .35 cm thick (Fig. 5) (Pan-dolfi et al. 2001); and platy colonies as com-posed of elongate, thin plates (,25 cm high).Orientation (upright vs. overturned) andbreakage (whole vs. fragment) were also re-corded for each colony.
(2) Montastraea-only data: We recorded everyM. ‘‘annularis’’-like colony that occurred with-in 0.5 m of the transect line, and its diameter,orientation, and breakage. The colonies were

406 ANN F. BUDD AND JOHN M. PANDOLFI
FIGURE 6. A, B, Transverse thin-sections. Two-dimensional Cartesian coordinates collected for 27 landmarks; onlyextremal landmarks are shown. The landmarks consist of spatially homologous points designed to reflect the struc-ture of the corallite wall and costal extensions beyond the wall. Points 1 and 14 and points 1 and 12 served asbaselines in calculating shape coordinates. C, Longitudinal slabs. Five linear distances were measured: cd, corallitediameter; cl, columella width; td, vertical distance between columella threads; tt, thickness of columella thread;ens, distance between endothecal dissepiments; exs, distance between exothecal dissepiments. Five measures weremade per corallite; three corallites were measured per colony.
identified by growth form (organ-pipe, col-umn, massive, plate) as defined above.
Data on the species richness, dominant cor-al species (% Acropora palmata, % A. cervicornis,% M. ‘‘annularis’’ complex), and coral orien-tation and breakage are summarized for eachtransect in Table 1. For preliminary compari-sons of these data among islands and amonginterpreted reef environments, we used non-parametric tests comparing independent sam-ples (Kruskal-Wallis H; SPSS 11.0).
We performed multidimensional scalinganalysis of the whole community data, inwhich growth forms of the M. ‘‘annularis’’complex were lumped into one taxon. Usingthe same procedures we analyzed the Montas-traea-only transect data to characterize thespatial distributions of the three Pleistocenegrowth forms. In these analyses, we used theBray-Curtis dissimilarity coefficient (Bray andCurtis 1957) to compare taxonomic composi-tion among all possible pairs of transects. Dis-similarity values range from 0 (for a pair ofsamples with identical taxonomic composi-tion) to 1 (for a pair of samples with no taxain common). Abundance data were trans-formed to their square roots before the cal-culation to reduce the influence of occasionallarge abundance values for some taxa (Field etal. 1982). The transformed abundance valuesfor each taxon were standardized by the max-imum attained by that taxon. This standardi-
zation equalizes the potential contributions oftaxa to the overall dissimilarity in composi-tion. Without standardization by taxon, theBray-Curtis values are dominated by thosetaxa that attain high abundances (Faith et al.1987). We used global non-metric multidimen-sional scaling as an ordination technique toprovide a visual summary of the pattern ofBray-Curtis values among the samples. Cal-culation of dissimilarity matrices and ordi-nations were performed with the PRIMERsoftware package. Details of these methodscan be found in the studies by Pandolfi andMinchin (1995), Pandolfi (1996), Jackson et al.(1996), Pandolfi (2001), and Pandolfi and Jack-son (2001).
Morphometric Analyses. Data were collect-ed on transverse thin-sections and longitudi-nal slabs within each of the 106 colonies. Weused the 2-D approach on transverse thin-sec-tions (described above) in our study becausecolony surfaces were weathered, making the3-D approach unfeasible. We obtained Carte-sian coordinates (x–y) for 27 landmarks on sixcorallites in transverse thin-sections (Fig. 6,Appendix 3). This same approach has beenapplied in studies of the complex in the latePleistocene of Barbados (Pandolfi et al. 2002),the Plio-Pleistocene of Costa Rica and Panama(Budd and Klaus 2001), and the late Mioceneand late Pleistocene of the Dominican Repub-lic (Klaus and Budd 2003).

407OVERLAPPING SPECIES BOUNDARIES IN REEF CORALS
TABLE 2. List of transverse and longitudinal characters analyzed. Shape coordinates (x1. . .x25, y11. . .y22) wereselected, if they defined single morphologic structures and did not combine several different structures into onevariable. Numbers for Tukey’s test refer to Pleistocene Bahamian growth forms (1 5 columnar, 2 5 massive, 3 5organ-pipe) and modern Panamanian members of the M. ‘‘annularis’’ complex (4 5 M. annularis s.s., 5 5 M. faveolata,6 5 M. franksi). Species may belong to two groups (5 homogeneous sets of means, in brackets) if there is partialoverlap among groups. ns 5 not significant.
Shape coordinates,centroid size, and linear
measurements Character definitionTukey’s HSD multiple
comparisons test
Transversex18, baseline 5 1,12 extension of primary
costa[65(352)] , [(352)5(155)] , [(155)54]
x2, baseline 5 1,12 extension of secondarycosta
[653] , [35(25154)] , [(25154)55]
x10, baseline 5 1,12 extension of tertiarycosta
[65(253)] , [(253)5(155)] , [35(155)54]
x25, baseline 5 1,14 length of primary sep-tum
*ns
x9, baseline 5 1,14 length of secondary sep-tum
*ns
x17, baseline 5 1,14 length of tertiary sep-tum
*ns
x14, baseline 5 1,12 wall thickness [6] , [3515452] , [5]x21, baseline 5 1,12 wall thickness [6] , [3515452] , [5]y19, baseline 5 1,12 outer length of wall dis-
sepiment[653555(154)] , [(154)52]
y21, baseline 5 1,14 inner length of wall dis-sepiment
[65(355)] , [(355)5(154)] , [55(154)52]
y11, baseline 5 1,12 outer width of tertiarywall costoseptum
[6] , [351545552]
y22, baseline 5 1,14 inner width of primarywall costoseptum(plus dissepiment)
*ns
x16, baseline 5 1,14 width of tertiary sep-tum
[256535(451)] , [(451)55]
LENGTH, baseline 5 1,14 corallite diameter [45(35156)] , [(35156)5552]CSIZE centroid size (all 27
landmarks)[45(551)] , [(551)5352,6]
Longitudinalcd corallite diameter *[351] , [152]cl columella thickness *nstd vertical distance be-
tween columellathreads
*ns
tt thickness of columellathreads
*ns
ens distance between en-dothecal dissepiments
*[153] , [2]
exs distance between en-dothecal dissepiments
*ns
* Pleistocene only.
In an effort to improve resolution in distin-guishing species, we added measurements re-lated to colony growth to the transverse thin-section data set. This step was not taken inprevious work. Colony growth within thecomplex involves three different growth pro-cesses: (1) upward skeletal extension, (2) cal-cification or skeletal thickening, and (3) bud-
ding of new corallites within colonies (Grausand Macintyre 1982). Morphologic features re-sulting from these processes are best observedin longitudinal slabs and thin-sections. Wemeasured six features on longitudinal slabsthat were cut along the growth axis of eachcolony (Table 2, Fig. 6).
Size and shape coordinates (Bookstein

408 ANN F. BUDD AND JOHN M. PANDOLFI
1991) were calculated for landmark data byusing the computer program GRF-ND (gen-eralized rotational fitting of n-dimensionallandmark data, 1994, written by Dennis E.Slice available at http://life.bio.sunysb.edu/morph/). Centroid size was calculated by sum-ming the squared distances from each of the27 landmarks to a common centroid. To cal-culate shape coordinates we used triplets ofthe 27 points. Different sets of shape coordi-nates were calculated separately by using twobaselines: (1) points 1 to 14 and (2) points 1 to12. To facilitate morphologic interpretation,we selected 13 shape coordinates associatedwith the structure and development of the cor-allite wall and costosepta (Table 2) for use instatistical analyses.
To test whether the Pleistocene column,massive, and organ-pipe growth forms rep-resented different species, we performed ca-nonical discriminant analyses [SPSS 11.0] us-ing the 15 transverse and six longitudinalcharacters as variables (Table 2) and the threegrowth forms as groups (the platy form wasnot sampled). To test whether the coloniesfrom different environments within the threegrowth forms differed in morphology, we per-formed canonical discriminant analyses usingthe same 15 transverse and 6 longitudinalcharacters as variables (Table 2). We also per-formed univariate comparisons of meansamong growth forms and among environ-ments within each growth form using multi-ple comparisons tests (Tukey’s HSD).
To test whether the three Pleistocene Ba-hamian growth forms are the same as themodern members of the M. ‘‘annularis’’ com-plex, we compared them with data collectedin the same manner on transverse thin-sec-tions of 30 genetically characterized moderncolonies, consisting of ten M. annularis s.s.(columns), ten M. faveolata (massives), and tenM. franksi (plates) from a shallow forereef en-vironment in the San Blas Islands of Panama.This modern data set is described in detail byBudd and Klaus (2001) and Fukami etal.(2004). In addition to multivariate analyses,we also performed univariate comparisons ofmeans, using multiple comparisons tests (Tu-key’s HSD) to compare the three growth forms
with the modern species, and we used box-plots to examine the results.
To test whether the three Pleistocene Ba-hamian growth forms are the same as similar-aged growth forms of the M. ‘‘annularis’’ com-plex from the central Caribbean, we comparedthem with data collected in the same manneron transverse thin-sections of colonies from alate Pleistocene terrace (about 125 Ka) alongthe southern coast of the Dominican Republic.This data set is described by Klaus and Budd(2003).
Results
Environments and Spatial Distributions
Environments. Examination of the wholecommunity data (Table 1) shows that speciesrichness ranged from 5–13 per transect (me-dian 5 9 species). There are no significant dif-ferences among islands in numbers of speciesper transect, numbers of colonies per transect,taxonomic composition, or percent upright orwhole colonies per transect (Table 1). Multi-dimensional scaling ordination of whole com-munity data (Fig. 7) groups the transects intothree assemblages: (1) transects 15w, 19w,21w, 23w on Great Inagua (abundant A. pal-mata); (2) transects 3w, 5w, 7w, 9w on San Sal-vador, and transects 17w and 25w on Great In-agua (abundant M. ‘‘annularis’’ complex); and(3) transects 11w and 13w on Andros (abun-dant A. cervicornis). These groups agree withprevious findings by Curran and White (1984,1985), White and Curran (1987), and White(1989), who interpreted the three types of ex-posures as respectively representing reefcrest, patch reef, and forereef environments.These three ‘‘environments’’ form the basis ofsubsequent analyses of morphology and spa-tial distributions of growth forms within theM. ‘‘annularis’’ complex.
Spatial Distributions. Montastraea-only anal-yses treated only data recorded on San Sal-vador and Great Inagua, because of the lownumbers of Montastraea recorded on Andros.The results of multidimensional scaling anal-yses using Montastraea-only data (Fig. 8) in-dicate the following:
1. Massive, columnar, and organ-pipe growth

409OVERLAPPING SPECIES BOUNDARIES IN REEF CORALS
FIGURE 7. Global nonmetric multidimensional scaling(GNMDS) ordination of whole community transect data(Appendix 1) for all 12 transects. Study of plots of thefirst two dimensions, combined with relative abundanc-es of A. palmate, A. cervicornis, and M. ‘‘annularis’’ sensulato, suggests that the transects can be grouped intothree assemblages corresponding with reef crest, patchreef, and forereef environments. S, San Salvador; A, An-dros; G, Great Inagua.
forms co-occur in all three environments,on all two islands.
2. Organ-pipes are most abundant in thepatch reef environment (lower energy),where the entire M. ‘‘annularis’’ complex isgenerally most abundant (Fig. 7); the abun-dance of organ-pipes in patch reef environ-ments is higher than the abundances of ei-ther columns or massives.
3. The abundances of columns and massiveforms are highly variable, and not relatedto environment or to the abundance of oth-er growth forms; columnar forms havehigher abundances than organ-pipes on thereef crest.
4. Within growth forms, differences in abun-dances are not related to geography, sug-gesting that factors limiting abundance donot vary across the Bahamian platform.
Morphology
Variation among Growth Forms. To testwhether the three growth forms representeddifferent species, we performed canonical dis-criminant analyses using 21 variables (Table 2)and the three growth forms as groups. Be-cause of previously observed high ecopheno-typic plasticity within the complex (Foster1979; Graus and Macintyre 1982; Budd 1993),we first performed the discriminant analysesseparately on colonies from the reef crest (en-vironment #1, n 5 45 colonies) and patch reef(environment #2, n 5 55 colonies) environ-ments. These two environments had highersample sizes than the forereef (environment#3), and each growth form consisted of at leastsix colonies (Table 1). The results of the ca-nonical discriminant analyses (Fig. 9) showthat, although the three growth forms havestatistically significant differences in corallitemorphology, the columnar form overlaps‘‘moderately’’ with both the organ-pipe andmassive growth forms. In both analyses, mul-tiple comparisons tests (Tukey’s HSD) indi-cate that differences between the three growthforms are statistically significant on the firstdiscriminant function, and that the massiveform differs significantly from the organ-pipeand columnar forms on the second function.

410 ANN F. BUDD AND JOHN M. PANDOLFI
FIGURE 8. Global nonmetric multidimensional scaling(GNMDS) ordination of Montastraea transect data (Ap-pendix 1) for ten transects (excluding the two transectsin Andros). Study of plots of the first two dimensions,combined with relative abundances of the three growthforms, suggests that the three growth forms co-occur inreef crest and patch reef environments on both San Sal-vador and Great Inagua. Organ-pipes have higher abun-dances in patch reef environments; the abundances ofcolumns and massives are variable. Montastraea-onlyanalyses focused only on San Salvador and Great Ina-gua, because of the low numbers of Montastraea record-ed on Andros; S, San Salvador; G, Great Inagua.
FIGURE 9. Plots of scores in canonical discriminantanalyses comparing the Pleistocene growth forms. Eachpoint on the plots represents one colony; polygons en-close growth forms. A, Analysis for environment #1(reef crest), 93.9% correctly classified; Tukey’s HSD test(using p , 0.05) shows that columnar , massive , or-gan-pipe for function 1, and massive , columnar 5 or-gan-pipe for function 2. B, Analysis for environment #2 (patch reef), 83.6% correctly classified; Tukey’s HSDtest (using p , 0.05) shows that organ-pipe , columnar, massive for function 1, and massive , organ-pipe ,columnar for function 2. C, Analysis for all three envi-ronments combined, 68.9% correctly classified; Tukey’sHSD test (using p , 0.05) shows that massive , organ-pipe , columnar for function 1, and organ-pipe , co-lumnar 5 massive for function 2. Length of costal ex-tensions (x2, x18, x10, csize), septum width (x16), anddissepiment spacing (ens) are strongly correlated withthe first function in the reef crest (A) and combinedanalyses (C), and with the second function in the anal-ysis of the patch reef (B). Wall thickness (x14, x21) anddevelopment of wall dissepiment (y21, y19) are stronglycorrelated with the second function in the reef crest (A)and combined (C) analyses, and with the first functionin the patch reef (B) analysis (Appendix 4).
Moreover, massive and organ-pipe forms areclearly separated (Fig. 9A,B).
Next, using colonies from all three environ-ments we performed an all-inclusive canoni-cal discriminant analysis comparing the three

411OVERLAPPING SPECIES BOUNDARIES IN REEF CORALS
growth forms (n 5 106 colonies). The resultsreveal significant differences, but even moreoverlap. Although the columnar form over-laps ‘‘moderately’’ with the massive and or-gan-pipe forms (Fig. 9C), multiple compari-sons tests (Tukey’s HSD) show that differenc-es between it and the other two forms are sta-tistically significant on the first discriminantfunction, but that differences between the co-lumnar and massive forms are not signifi-cantly different on the second function. Mas-sive and organ-pipe forms also overlapped‘‘moderately’’ but to a lesser degree; they dif-fered significantly on both the first and secondfunctions (Fig. 9C).
As indicated by the correlation table be-tween individual variables and canonical dis-criminant functions in the all-inclusive anal-ysis (Appendix 4), the massive form is distin-guished by high values along function 2 andlow values along function 1, which are corre-lated respectively with well-developed dis-sepiments (y19, y21), thinner walls (x14, x21),and larger corallites (cd) (function 2), andwith shorter, narrower costae (x10, x16) andwidely spaced endothecal dissepiments (ens)(function 1). The organ-pipe form is distin-guished by low values along function 2, whichare correlated with thick wall (x14, x21) andpoorly developed dissepiments (y19, y21).The columnar form encompasses the range ofvariation along function 2 but has higher val-ues along function 1, indicating longer, widercostae (x10, x16). These differences are illus-trated in Figure 10 and are further confirmedby multiple comparisons tests (Tukey’s HSD)(Table 2).
Variation within Growth Forms. To testwhether the colonies from different environ-ments within the three growth forms differedin morphology, we used the same 21 variables(Table 2) to perform canonical discriminantanalyses comparing reef crest and patch reefenvironments (the two environments with ad-equate numbers of colonies per growth formfor statistical analysis, see Table 1). Canonicaldiscriminant analyses within massive and or-gan-pipe growth forms indicate that corallitemorphology differs markedly between reefcrest and patch reef environments; only in thecolumnar form do colonies from these envi-
ronments overlap in corallite morphology(Fig. 11). Moreover, multiple comparisonstests (Tukey’s HSD test) show that differencesbetween environments within all threegrowth forms are statistically significant.
Species diagnostic characters such as costalextensions (x2, x10, x18) and wall structure(y19) are correlated with the discriminantfunction in the organ-pipe growth form,which has longer costae and well-developeddissepiments in the patch reef. However, incolumns and in massives different sets of var-iables, many of which were not important indistinguishing species (Table 2), are correlatedwith the function (Appendix 5). In these twocases, length of the tertiary septum (x17), ex-othecal dissepiment spacing (exs), and colu-mella thickness (cl) are most strongly corre-lated with the function. In columns, the tertia-ry septa are better developed in environment#2 (patch reef). In massives, the columella isthicker and exothecal dissepiments are morenarrowly spaced in environment #2 (patchreef). As shown in Figure 10, costal extensionsare short, walls are thick, and wall dissepi-ment is less developed in environment #3(forereef).
Comparisons in Time and Space
Comparison with Modern Species in the Com-plex. To test whether the three PleistoceneBahamian growth forms are the same as themodern members of the M. ‘‘annularis’’ com-plex, we performed a canonical discriminantanalysis comparing the three Bahamian Pleis-tocene species with samples of the three mod-ern species from the San Blas Islands of Pan-ama. To minimize the effects of fossilization(diagenesis, breakage) on these comparisons,we first performed t-tests comparing each ofthe 15 transverse thin-section variables be-tween all fossil and all modern colonies, andused the results to select 11 of the 15 variableswith insignificant differences for inclusion inthe discriminant analysis. The four variablesthat were removed (x9, x25, x17, y22) consistof measures of septal length and width, whichwere only weakly correlated with the previousdiscriminant functions distinguishing fossilspecies (Appendices 4, 5).
The results indicate that the modern species

412 ANN F. BUDD AND JOHN M. PANDOLFI
FIGURE 10. Transverse thin-sections of representative corallites of the three growth forms of the M. ‘‘annularis’’complex collected in three different reef environments in the Pleistocene of the Bahamas. The massive form (B, E,H) is distinguished by well-developed dissepiments, thinner walls, larger corallites, and shorter, narrower costae(x10, x16); the organ-pipe form (C, F, I) is distinguished by its thick corallite wall and poorly developed dissepi-ments. The columnar form (A, D, G) is highly variable and has longer, wider costae. Within growth forms, costalextensions are short and corallite walls are thick in environment #3 or forereef (G, I). In columns, the tertiary septaare better developed in environment #2. In massives, the columella is thicker and exothecal dissepiments are morenarrowly spaced in environment #2. In the organ-pipes, the corallite wall is distinctively septothecal in environment#1, and costal extensions are short (F). A–C. Environment #1 (reef crest). A, Columnar growth form, BPK10221. B,Massive growth form, BPK10258. C, Organ-pipe growth form, BPK10159. D–F. Environment #2 (patch reef). D, Co-lumnar growth form, BPK10422. E, Massive growth form, BPK10151. F, Organ-pipe growth form, BPK10310. G–I.Environment #3 (forereef). G, Columnar growth form, BPK10022. H, Massive growth form, BPK10057. I, Organ-pipe growth form, BPK10045.
are widely separated and collectively occupymore morphospace than the Pleistocene spe-cies (Fig. 12). In contrast, the three Pleistocenespecies show ‘‘moderate’’ to ‘‘high’’ overlap.Study of patterns of overlap among the sixgroups using Mahalanobis distances showsthat only the Pleistocene columns and M. an-nularis s.s. (columns) are not statistically sig-nificantly different (F 5 1.302, p 5 0.274), andoverlap is ‘‘high.’’ All other pairwise compar-isons reveal significant differences. Of the
three modern species, Pleistocene massivesand organ-pipes are both most similar to M.annularis s.s. (columns) and exhibit ‘‘moder-ate’’ overlap. The distance between M. annu-laris s.s. and Pleistocene massives is small, butsignificant (F 5 2.698, p 5 0.028); the distancebetween M. annularis s.s. and Pleistocene or-gan-pipes is greater (F 5 6.836, p , 0.001).
These results indicate that, although thePleistocene Bahamas and Recent Panama col-umns (5 M. annularis s.s.) have similar cor-

413OVERLAPPING SPECIES BOUNDARIES IN REEF CORALS
FIGURE 11. Plots of scores in canonical discriminantanalysis comparing environments #1 (reef crest) and #2(patch reef) within the Pleistocene species. A, Columnargrowth form; B, Massive growth forms. C, Organ-pipegrowth form.
FIGURE 12. Plot of scores in a canonical discriminantanalysis comparing the three Pleistocene Bahamasgrowth forms and the three modern species. Each pointon the plot represents one colony; polygons enclose eachof the six groups. C 5 Pleistocene columns, M 5 Pleis-tocene massive colonies, OP5 Pleistocene organ-pipes.Wall thickness (x14, x21) is most strongly correlatedwith the first function; corallite size (csize, LENGTH),in combination with wall structure (y21, y19), is moststrongly correlated with the second function. These re-sults and the results of Tukey’s HSD test (Table 2) in-dicate that in the Pleistocene columns and M. annulariss.s., corallites are small (LENGTH), costal extensions(x18, x2, x10) are long, wall thickness (x14, x21) is in-termediate, and wall dissepiment (y21, y19) is poorlydeveloped. The Pleistocene organ-pipes differ from thelatter two species in their short costal extensions. ThePleistocene massive forms are similar to M. faveolata(massives) in their large corallite diameter (LENGTH)and intermediate costal extensions (x18, x2, x10); how-ever, M. faveolata has a distinctive thin wall (x14, x21),thin tertiary septa (x16), and less well developed walldissepiments (y21, y19). M. franksi (plates) is distin-guished by its short costae (x18, x2, x10), thick wall (x14,x21), and the presence of wall dissepiment (y21, y19).
allite morphologies and appear to representthe same species, the Pleistocene Bahamasand Recent Panama massive forms do not(Fig. 12). In fact, the Pleistocene Bahamas mas-sives have corallite morphologies closer to thePleistocene Bahamas columns and RecentPanama columns (5 M. annularis s.s.), thanthey do to the Recent Panama massives (5 M.faveolata).
The observed similarities and ‘‘high’’ over-lap between the Pleistocene columns and M.
annularis s.s. (columns), the ‘‘moderate’’ over-lap among the Pleistocene species, and thedistinctiveness of the three modern speciesare confirmed in analyses of single variablesusing pairwise comparisons of means (Tu-key’s HSD test) (Table 2, Fig. 13).
Comparison with Pleistocene Species of the Do-minican Republic. In the final analysis, wecompared the three Pleistocene Bahamiangrowth forms with similar-aged growth formsof the M. ‘‘annularis’’ complex from the Do-minican Republic. We used data collected inthe same manner on transverse thin-sectionsof 114 colonies, consisting of 43 columns, 14

414 ANN F. BUDD AND JOHN M. PANDOLFI
FIGURE 13. Boxplots of size and shape coordinates based on the median, quartiles, and extreme values. The selectedvariables represent four different patterns of morphologic variation observed among species. The box representsthe interquartile range containing 50% of the values. The whiskers represent the highest and lowest values, ex-cluding outliers. The line across each box represents the median. 1 5 Pleistocene columns (n 5 57), 25 Pleistocenemassive colonies (n 5 14), 3 5 Pleistocene organ-pipes (n 5 35), 4 5 modern M. annularis s.s. (n 5 10); 5 5 modernM. faveolata (n 5 10); 6 5 modern M. franksi (n 5 10). Species may belong to two groups (5 homogeneous sets ofmeans), if there is partial overlap among groups. A, Baseline (1–14) length (corallite diameter), Tukey’s HSD testusing p , 0.05 (Table 2): [4 5 (3 5 1 5 6)] , [(3 5 1 5 6) 5 5 5 2]. B, x21 (wall thickness), Tukey’s HSD test: [6], [3 5 1 5 4 5 2] , [5] (x14 has the same pattern). C, x18 (extension of primary costa), Tukey’s HSD test: [6 5 (35 2)] , [(3 5 2) 5 (1 5 5)] , [(1 5 5) 5 4] (x10, x2 have similar patterns; csize has an inverse pattern). D, y21 (innerlength of wall dissepiment), Tukey’s HSD test: [6 5 (3 5 5)] , [(3 5 5) 5 (1 5 4)] , [5 5 (1 5 4) 5 2] (y19 has asimilar pattern). In y11 (outer width of tertiary wall costoseptum), M. franksi (6) is wider than the other five groups.In x16 (width of tertiary septum), M. faveolata (5) is thinner than the other five groups.
massives, 5 plates, and 52 organ-pipes, from arange of back reef, reef crest, and reef front en-vironments (Klaus and Budd 2003). We per-formed two canonical discriminant analyses:(1) comparing the four growth forms of theDominican Republic, leaving the three growthforms of the Bahamas ‘‘unclassified’’ (i.e., notassigning them to an a priori group) (Fig.14A), and (2) comparing the three modernspecies, leaving the Dominican Republicgrowth forms unclassified (Fig. 14B). All 15variables were used in the first analysis; the 11variables in the modern analyses (describedabove) were used in the second analysis.
The results of the discriminant analysescomparing growth forms in the DominicanRepublic indicate that three of the four Do-
minican Republic growth forms exhibit over-lap at species margins; overlap is ‘‘moderate’’or greater between the Dominican Republiccolumnar and organ-pipe forms, and is ‘‘low’’between organ-pipe and massive forms (Fig.14A). In comparisons between Dominican Re-public and Bahamas growth forms, the Do-minican Republic growth forms form clusters(5 concentrations of specimens), albeit with‘‘low’’ to ‘‘moderate’’ overlap. The Bahamasgrowth forms appear haphazardly scatteredand do even not form clusters (Fig. 14A); over-lap is ‘‘high.’’ Unlike the Bahamas, the Do-minican Republic massives and columns donot overlap, indicating that patterns of mor-phologic variation are distinctively different atthe two locations.

415OVERLAPPING SPECIES BOUNDARIES IN REEF CORALS
FIGURE 14. Plots of scores in canonical discriminant analyses comparing the four Pleistocene Dominican Republicgrowth forms with the Pleistocene Bahamas growth forms (A) and the three modern species (B). Each point on theplots represents one colony; polygons enclose growth forms or species. C 5 columns, M 5 massive colonies, OP 5organ-pipes, P 5 platy. In both canonical discriminant analyses, wall thickness (x14, x21) is most strongly correlatedwith the first function; corallite size (csize, LENGTH), in combination with wall structure (y21, y19), is most strong-ly correlated with the second function. ‘‘Unclassified’’ means that these colonies were not assigned to a priorigroups when performing the discriminant analyses.
In comparisons with the three modern spe-cies (Fig. 14B), the Pleistocene Dominican Re-public growth forms more closely match thethree Recent Panama species than the Pleis-tocene Bahamas growth forms do (Fig. 12).Dominican Republic plates overlap and arenot statistically significantly different from M.franksi (‘‘high’’ overlap), Dominican Republicmassives overlap and are not statistically sig-nificantly different from M. faveolata (‘‘high’’overlap), and Dominican Republic columnsoverlap and are not statistically significantlydifferent from M. annularis s.s. (‘‘high’’ over-lap; see also Klaus and Budd 2003). Domini-can Republic organ-pipes overlap and are notstatistically significantly different from M. an-nularis (‘‘high’’ overlap), but they also overlap‘‘moderately’’ with M. faveolata (Fig. 14B). Incontrast, the three Bahamas growth formshave more morphologies intermediate be-tween the three modern species (Fig. 12). Inparticular, the match observed between Do-minican Republic massives and M. faveolatacontrasts with the differences observed be-tween Bahamas massives and M. faveolata.
Discussion
Ecology. The reduction in morphologicdistinctiveness observed among species in thePleistocene of the Bahamas and their high
morphologic variability suggest that ecologicfactors, such as competition, may be less ef-fective in maintaining species boundaries inthe Bahamas than in the southern Caribbean(described in Pandolfi et al. 2002). Indeed, notonly does morphology overlap less amongspecies, but also local distributions overlapless in the southern Caribbean, both today andin the Pleistocene, than in the Pleistocene ofthe Bahamas. This reduced overlap suggestsgreater niche differentiation in the southernCaribbean.
Today in Panama, local distributions of thethree species within the complex overlap(Knowlton et al. 1992; Weil and Knowlton1994), but the three species (especially M.franksi) differ in the reef zone in which theyare most abundant. On protected reefs, thedistributions of M. annularis s.s. and M. fav-eolata range from 0 to 12 m, with M. faveolatabeing most abundant at 0–3 m and M. annu-laris s.s. being most abundant at 3–6 m. How-ever, on exposed reefs, the distribution of M.faveolata extends down to 15 m, with its peakabundance at 3–6 m, as in M. annularis s.s. Onprotected and exposed reefs, M. franksi ex-tends from 3 to 24 m and its peak abundanceis at 12–15 m. In Curacao (van Veghel and Bak1993; van Veghel 1994), the differences in dis-tribution among species are even more pro-

416 ANN F. BUDD AND JOHN M. PANDOLFI
nounced. M. annularis s.s. ranges from 3 to 15m (peak at 6 m), M. faveolata from 3 to 25 m(peak at 9 m), and M. franksi from 15 to 25 m(peak at 20 m). In the Pleistocene of Curacao(Pandolfi and Jackson 2001) and Barbados(Pandolfi et al. 2001), species abundances alsodiffer among environments. In the Pleistoceneof Curacao (Pandolfi and Jackson 2001), or-gan-pipes are most abundant in high- to in-termediate-energy environments, columns (5M. annularis s.s.) are most abundant in inter-mediate- to low-energy environments, andmassives (5 M. faveolata) are most abundant inlow-energy environments where the other twospecies were rare or absent. In the Pleistoceneof Barbados (Pandolfi et al. 2001), organ-pipesare most abundant in the shallow forereef,and they increase in abundance through geo-logic time as abundances of columns (M. an-nularis s.s.) decrease. Taken together, thesedistributions support niche differentiation inthe species complex in the southern Caribbean.
In contrast, in the Pleistocene of the Baha-mas (this study), species with columnargrowth forms are widespread, and differencesin local distributions among species are lesswell defined. In general, organ-pipes preferpatch reef environments and are more abun-dant there than on the reef crest. Massiveshave patchy distributions, which appear un-related to the environment (Fig. 8). This pat-tern is similar to that observed in the Pleisto-cene of the Dominican Republic (Klaus andBudd 2003). Although columns are moreabundant than other growth forms in all threeenvironments, differentiation among growthforms still occurs, with columns having thehighest abundance in the back-reef (low en-ergy), and organ-pipes have highest abun-dances in the reef front (high energy), in a pat-tern more like that of the southern Caribbean.Thus, the Bahamas appear unique in the highdegree of ecologic overlap and reduced nichedifferentiation among species.
Morphology. The observed differences incolony and corallite morphology (Fig. 9) sug-gest that the three Pleistocene Bahamasgrowth forms represent species (5 distinctevolutionary units), albeit ‘‘moderately’’ over-lapping. The observed overlap and fuzzy spe-cies boundaries contrast markedly with thestructures of species boundaries observed
among modern members of the complex to-day in Panama (Knowlton et al. 1992; Weil andKnowlton 1994; Budd and Johnson 1996; Buddand Klaus 2001; Knowlton and Budd 2001)and in Curacao (van Veghel and Bak 1993). Atboth of these two southern Caribbean loca-tions, morphologies of species are distinct andseparated from one another by gaps. Instead,the Pleistocene Bahamian species boundariesmore closely resemble those observed today inthe Bahamas (Fig. 2).
Our results further suggest that environ-mental variation alone is not responsible forthe morphologic overlap observed amongspecies. Within both columnar and massiveforms, much of the difference among reef crestand patch reef environments involves charac-ters that do not differ among species; charac-ters that best distinguish species exhibit littleor no environmental variation (Fig. 11, Ap-pendix 5). Thus species overlap primarily in-volves characters that do not exhibit environ-mental variation, and appears to have somegenetic basis.
Comparisons in space and time suggest thatthe amount of morphologic overlap amongPleistocene species varies geographicallyacross the Caribbean in much the same way asit does today, with overlap being higher in theBahamas than in other regions of the Carib-bean. However, although less pronounced,morphologic overlap among species does oc-cur at other locations in the Caribbean Pleis-tocene. For example, even though growthforms in the Pleistocene of the Dominican Re-public form more distinct clusters than in thePleistocene of the Bahamas (Fig. 14), overlapis observed between columns and organ-pipes(instead of between massives and columns asin the Bahamas). Patterns similar to the Do-minican Republic are observed in the Pleis-tocene of Barbados, where corallite morphol-ogies of columns and organ-pipes are distinctand organ-pipes are more similar to modernPanama M. annularis s.s. (Pandolfi et al. 2002:Fig. 5).
Hybridization and Reticulate Evolution. Theabove comparisons indicate that the observedecologic and morphologic overlap among spe-cies was geographically limited and may havepersisted for more than 100,000 years. Ourecologic and morphologic analyses indicate

417OVERLAPPING SPECIES BOUNDARIES IN REEF CORALS
reduced niche differentiation and ‘‘moderate’’to ‘‘high’’ morphologic overlap among Pleis-tocene species, which corroborate the hypoth-esis of past hybridization and reticulate evo-lution within the M. ‘‘annularis’’ complex.Moreover they indicate that hybridization mayhave occurred in the Bahamas prior to or dur-ing the late Pleistocene, in association with sealevel and climatic fluctuations that repeatedlydrained and flooded the Bahamas platform.
The observed morphologic intermediacyand lack of distinctiveness of the BahamasPleistocene species suggests that hybridiza-tion homogenized gene pools and morpholo-gies within the complex (introgressive hybrid-ization), rather than creating morphologicallydistinct new hybrid species and evolutionarynovelties. Previous analyses of Pliocene to Re-cent occurrences at other locations (Fig. 3) in-dicate that hybridization involved well-estab-lished, preexisting lineages (e.g., M. annulariss.s. and M. faveolata), which were more speci-ose prior to high extinction during Plio-Pleis-tocene time (Budd and Klaus 2001), and re-sulted in ecologic and morphologic overlapthat has persisted until today. Hybridizationappears to have resulted in partial lineage fu-sion; some lineages appear to have merged,whereas others have maintained their differ-ences through time despite overlap. M. franksiand M. annularis s.s. are genetically indistin-guishable today in the Bahamas, and some M.faveolata individuals have M. annularis s.s.-likegenotypes (Fukami et al. 2004).
The observed long-term persistence of over-lapping species boundaries and their geo-graphic restriction supports the notion thathistorical factors, associated with past dis-persal events and Pleistocene climate change,have played an important role in shaping thestructure of species boundaries on modern-day coral reefs (Pandolfi 1992; Veron 1995;Benzie 1999). Our results differ from those ofVollmer and Palumbi (2002), in which Carib-bean-wide hybridization in Acropora is inter-preted as enhancing morphologic diversitybut having little long-term evolutionary influ-ence. In the present case, hybridization wasgeographically limited and resulted in over-lapping, intermediate morphologies and par-tial lineage fusion. Although the degree ofevolutionary influence is not yet known, its ef-
fects appear to have persisted through geolog-ic time. Moreover, our study indicates that thehistory of hybridization in the complex istraceable in the fossil record by using mor-phologic data; indeed, in this case, morphol-ogy does appear to be linked with the varia-tion in the genotype (but see Miller and Benzie1997; van Oppen et al. 2001). To further eval-uate the hypothesis of persistence, more anal-yses need to be performed on fossil and livingmembers of the complex in the Bahamas, pos-sibly over a continuous sequence of time in-tervals extending from Pleistocene to Recentusing material in drill cores.
Conclusions
In sum, our study indicates the followingabout the M. ‘‘annularis’’ species complex inthe Pleistocene of the Bahama Islands:
1. The local distributions of Pleistocene Ba-hamian species are broad, extending acrossreef environments; only organ-pipes exhib-it habitat preferences as revealed by higherabundances in patch reef environments.However, these preferences are not as welldefined as those observed elsewhere in theCaribbean.
2. Growth forms distinguished in the field(i.e., column, massive, organ-pipe) differ incorallite morphology. Walls are generallythin and septothecal in organ-pipe forms,and costae are short; wall dissepiment andcostae are better developed in massiveforms. Columnar forms have intermediatewall thicknesses and longer costae. Despitethese differences, corallite morphologies ofthe three growth forms overlap ‘‘moderate-ly.’’ Moreover, spatial distributions of thethree growth forms overlap both locallyacross reef environments and geographi-cally across the Bahamas platform, indicat-ing that the observed morphologic differ-ences are not simply the result of environ-mental or geographic variation. These re-sults suggest that at least three overlappingspecies existed within the complex in thePleistocene of the Bahamas.
3. Analyses of morphologic variation withinthe Pleistocene Bahamian species indicatethat many of the morphologic charactersthat vary within species do not vary among

418 ANN F. BUDD AND JOHN M. PANDOLFI
species. The differences among species arenot caused by environmental variation.
4. Corallite morphologies of all three Pleisto-cene Bahamas species (column, massive,organ-pipe) are most similar to modernPanama M. annularis s.s. Relative to thethree modern Panama species, the Pleisto-cene species overlap ‘‘moderately’’ and oc-cupy morphospace intermediate betweenthe modern species. In contrast, corallitemorphologies of three Pleistocene Domin-ican Republic species better match theirgrowth form counterparts today in Pana-ma, and exhibit less overlap.
5. The observed ‘‘moderate’’ species overlapand intermediacy are interpreted as havingbeen caused by past hybridization, whichoccurred among preexisting lineages in theBahamas most likely in association withPleistocene sea level and climate fluctua-tions. The overlap is important in its lim-ited geographic distribution and apparentlong duration in geologic time. Historicalfactors and past dispersal barriers have hada long-term influence on the morphologicand ecologic distinctiveness as well as thegenetic structure of modern-day Bahamianspecies.
Acknowledgments
We thank N. Knowlton for discussions; B.White, A. Curran, B. Greenstein, C. Carney, M.Boardman, R. Ginsburg, and W. Ausich for lo-cality information; J. Dawson and J. Klaus forassistance in collecting transect data; S. Wal-lace, J. Wingerath, M. Holcomb, and J. Bean formorphologic measurements; K. Saville and D.Dean for thin-section preparation. We are alsograteful to K. Buchan and the Bahamian FieldStation (San Salvador), the Forfar Station (An-dros), and N. Sealey for assistance with fieldlogistics. This research was supported by agrant from the National Science Foundation(NSF EAR 97-25273) to A.F.B.
Literature CitedBenzie, J. A. H. 1999. Genetic structure of coral reef organisms:
ghosts of dispersal past. American Zoologist 39:131–145.Bookstein, F. L. 1991. Morphometric tools for landmark data.
Cambridge University Press, Cambridge.Bray, J. R., and J. T. Curtis. 1957. An ordination of the upland
forest communities of southern Wisconsin. Ecological Mono-graphs 27:325–349.
Budd, A. F. 1993. Variation within and among morphospecies ofMontastraea. Courier Forschungsinstitut Senckenberg 164:241–254.
Budd, A. F., and K. G. Johnson. 1996. Recognizing species ofLate Cenozoic Scleractinia and their evolutionary patterns.Paleontological Society Papers 1:59–79.
———. 1999. Origination preceding extinction during Late Ce-nozoic turnover of Caribbean reefs. Paleobiology 25:188–200.
Budd, A. F., and J. S. Klaus. 2001. The origin and early evolutionof the Montastraea ‘‘annularis’’ species complex (Anthozoa:Scleractinia). Journal of Paleontology 75:527–545.
Chen, J. H., H. A. Curran, B. White, and G. J. Wasserburg. 1991.Precise chronology of the last interglacial period: 234U–230Th data from fossil coral reefs in the Bahamas. GeologicalSociety of America Bulletin 103:82–97.
Curran, H. A., and B. White. 1984. Field guide to the CockburnTown fossil coral reef. Pp. 71–96 in J. W. Teeter, ed. Proceed-ings of the second symposium on the geology of the Bahamas.CCFL Bahamian Field Station, San Salvador, Bahamas.
———. 1985. The Cockburn Town fossil coral reef. Pp. 95–120 inH. A. Curran, ed. Pleistocene and Holocene carbonate envi-ronments on San Salvador Island, Bahamas. Guidebook forfield trip 2, the Geological Society of America annual meeting,Orlando, Florida. Geological Society of America, Boulder,Colo.
Faith, D. P., P. R. Minchin, and L. Belbin. 1987. Compositionaldissimilarity as a robust measure of ecological distance. Ve-getatio 69:57–68.
Field, J. G., K. R. Clarke, and D. R. M. Warwick. 1982. A practicalstrategy for analyzing multispecies distribution patterns. Ma-rine Ecology Progress Series 8:37–52.
Foster, A. B. 1979. Phenotypic plasticity in the reef corals Mon-tastraea annularis (Ellis and Solander) and Siderastrea siderea(Ellis and Solander). Journal of Experimental Marine Biologyand Ecology 39:25–54.
Fukami, H., A. F. Budd, D. R. Levitan, J. Jara, R. Kersanach, andN. Knowlton. 2004. Geographical differences in speciesboundaries among members of the Montastraea annularis com-plex based on molecular and morphological markers. Evolu-tion 58:308–323.
Graus, R. R., and I. G. Macintyre. 1982. Variation in growthforms of the reef coral Montastrea annularis (Ellis and Solan-der): a quantitative evaluation of growth response to light dis-tribution using computer simulation. In K. Rutzler and I. G.Macintyre, eds. The Atlantic Barrier Reef Ecosystem at CarrieBow Cay, Belize, Smithsonian Contributions to the MarineSciences 12:441–464.
Harrison, R. G. 1990. Hybrid zones: windows on evolutionaryprocess. Oxford Surveys in Evolutionary Biology 7:69–128.
Hatta, M., H. Fukami, W. Wang, M. Omori, K. Shimoike, T. Hay-ashibara, Y. Ina, and T. Sugiyama. 1999. Reproductive and ge-netic evidence for a reticulate evolutionary history of massspawning corals. Molecular Biology and Evolution 16:1607–1613.
Holcomb, M., J. M. Pandolfi, I. G. Macintyre, and A. F. Budd. Inpress. Use of X-radiographs to distinguish members of theMontastraea ‘‘annularis’’ reef coral species complex. In D. G.Fautin, J. A. Westfall, P. Cartwright, M. Daly, and C. R. Wyt-tenbach, eds. Coelenterate biology 2003: trends in research onCnidaria and Ctenophora. Hydrobiologia.
Jackson, J.B.C., A. F. Budd, and J. M. Pandolfi. 1996. The shiftingbalance of natural communities? Pp. 89–122. in D. Jablonski,D. H. Erwin, and J. H. Lipps, eds. Evolutionary paleobiology:essays in honor of James W. Valentine. University of ChicagoPress, Chicago.
Klaus, J. S., and A. F. Budd. 2003. Comparison of Caribbean cor-al reef communities before and after Plio-Pleistocene faunalturnover: analyses of two Dominican Republic reef sequenc-es. Palaios 18:3–21.

419OVERLAPPING SPECIES BOUNDARIES IN REEF CORALS
Knowlton, N., and A. F. Budd. 2001. Recognizing coral speciespast and present. Pp.97–119 in J. B. C. Jackson, S. Lidgard, andF. K. McKinney, eds. Evolutionary patterns: growth, form, andtempo in the fossil record. University of Chicago Press, Chi-cago.
Knowlton, N., E. Weil, L. A. Weigt, and H. M. Guzman. 1992.Sibling species in Montastraea annularis, coral bleaching, andthe coral climate record. Science 255:330–333.
Knowlton, N., J. L. Mate, H. M. Guzman, R. Rowan, and J. Jara.1997. Direct evidence for reproductive isolation among thethree species of the Montastraea annularis complex in CentralAmerica (Panama and Honduras). Marine Biology 127:705–711.
Lopez, J. V., and N. Knowlton. 1997. Discrimination of siblingspecies in the Montastraea annularis complex using multiplegenetic loci. Proceedings of the Eighth International CoralReef Symposium 2:1613–1618.
Lopez, J. V., R. Kersanach, S. A. Rehner, and N. Knowlton. 1999.Molecular determination of species boundaries in corals: ge-netic analysis of the Montastraea annularis complex using am-plified fragment length polymorphism and a microsatellitemarker. Biological Bulletin 196:80–89.
Marquez, L. M., M. J. H. van Oppen, B. L. Willis, A. Reyes, andD. J. Miller. 2002. The highly cross-fertile coral species, Acro-pora hyacinthus and Acropora cytherea, constitute statisticallydistinguishable lineages. Molecular Ecology 11:1339–1349.
Miller, K. J., and J. A. H. Benzie. 1997. No clear genetic distinc-tion between morphological species within the coral genusPlatygyra. Bulletin of Marine Science 61:907–917.
Neumann, A. C., and W. S. Moore. 1975. Sea level events andPleistocene coral ages in the northern Bahamas. QuaternaryResearch 5:215–224.
Odorico, D. and D. J. Miller. 1997. Variation in the ribosomal in-ternal transcribed spacers and 5.8S rDNA among five speciesof Acropora (Cnidaria; Scleractinia): patterns of variation con-sistent with reticulate evolution. Molecular Biology and Evo-lution 14:465–473.
Pandolfi, J. M. 1996. Limited membership in Pleistocene reefcoral assemblages from the Huon Peninsula, Papua NewGuinea: constancy during global change. Paleobiology 22:152–176.
———. 2001. Numerical and taxonomic scale of analysis in pa-leoecological data sets: Examples from Neo-tropical Pleisto-cene reef coral communities. Journal of Paleontology 75:546–563.
Pandolfi, J. M., and J. B. C. Jackson. 2001. Community structureof Pleistocene coral reefs of Curacao, Netherlands Antilles.Ecological Monographs 71:49–67.
Pandolfi, J. M., and P. R. Minchin. 1995. A comparison of taxo-nomic composition and diversity between reef coral life anddead assemblages in Madang Lagoon, Papua New Guinea:Palaeogeography, Palaeoclimatology, Palaeoecology 119:321–341.
Pandolfi, J. M., J. B. C. Jackson, and J. Geister. 2001. Geologicallysudden extinction of two widespread late Pleistocene Carib-bean reef corals. Pp.120–158 in J. B. C. Jackson, S. Lidgard, andF. K. McKinney, eds. Evolutionary patterns: growth, form, andtempo in the fossil record. University of Chicago Press, Chi-cago.
Pandolfi, J. M., C. E. Lovelock, and A. F. Budd. 2002. Characterrelease following extinction in a Caribbean reef coral speciescomplex. Evolution 56:479–501.
Rodriguez-Lanetty, M., and O. Hoegh-Guldberg. 2002. The phy-logeography and connectivity of the latitudinally widespreadscleractinian coral Plesiastrea versipora in the western Pacific.Molecular Ecology 11:1177–1189.
Rowan, R., and N. Knowlton. 1995. Intraspecific diversity and
ecological zonation in coral algal symbiosis. Proceedings ofthe National Academy of Sciences USA 92:2850–2853.
Szmant, A. M., E. Weil, M. W. Miller, and D. E. Colon. 1997. Hy-bridization within the species complex of the scleractiniancoral Montastraea annularis. Marine Biology 129:561–572.
Tomascik, T. 1990. Growth rates of two morphotypes of Mon-tastraea annularis along a eutrophication gradient, Barbados,W.I. Marine Pollution Bulletin 21:376–380.
Tomb, J. M. 1995. Description and depositional interpretation ofa Pleistocene coral reef, Nichollstown, Andros Island, Baha-mas. Unpublished senior thesis. Wright State University, Day-ton, Ohio.
van Oppen, M. J. H., B. L. Willis, J. A. Van Vugt, and D. J. Miller.2000. Examination of species boundaries in the Acropora cer-vicornis group (Scleractinia, Cnidaria) using nuclear DNA se-quence analyses. Molecular Ecology 9:1363–1373.
van Oppen, M. J. H., B. J. McDonald, B. L. Willis, and D. J. Miller.2001. The evolutionary history of the coral genus Acropora(Scleractinia, Cnidaria) based on a mitochondrial and a nu-clear marker: reticulation, incomplete lineage sorting, or mor-phological convergence? Molecular Biology and Evolution 18:1315–1329.
van Oppen, M. J. H., B. L. Willis, T. van Rheede, and D. J. Miller.2002. Spawning times, reproductive compatibilities and ge-netic structuring in the Acropora aspera group: evidence fornatural hybridization and semi-permeable species boundariesin corals. Molecular Ecology 11:1363–1376.
van Veghel, M. L. J. 1994. Reproductive characteristics of thepolymorphic Caribbean reef building coral, Montastraea an-nularis: genetic, behavioral, and morphometric aspects. Ma-rine Ecology Progress Series 109:209–219.
van Veghel, M. L. J., and R. P. M. Bak. 1993. Intraspecific vari-ation of a dominant Caribbean reef building coral, Montastraeaannularis: genetic, behavioral and morphometric aspects. Ma-rine Ecology Progress Series 92:255–265.
Vaughan, T. W. 1919. Fossil corals from Central America, Cuba,and Porto Rico with an account of the American Tertiary,Pleistocene, and Recent coral reefs. U.S. National MuseumBulletin 103:189–524.
Veron, J. E. N. 1995. Corals in space and time. UNSW Press, Syd-ney.
Vollmer, S. V., and S. R. Palumbi. 2002. Hybridization and theevolution of reef coral diversity. Science 296:2023–2025.
Weil, E., and N. Knowlton. 1994. A multi-character analysis ofthe Caribbean coral Montastraea annularis (Ellis and Solander,1786), and its two sibling species, M. faveolata (Ellis and So-lander, 1786) and M. franksi (Gregory, 1895). Bulletin of Ma-rine Science 55:151–175.
White, B. 1989. Field guide to the Sue Point fossil coral reef, SanSalvador Island, Bahamas. Pp. 353–365. in J. E. Mylroie, ed.Proceedings of the fourth symposium on the geology of theBahamas. CCFL Bahamian Field Station, San Salvador, Ba-hamas.
White, B., and H. A. Curran. 1987. Coral reef to eolianite tran-sition in the Pleistocene rocks of Great Inagua Island. Pp. 165–179 in H. A. Curran, ed. Proceedings of the third symposiumon the geology of the Bahamas. CCFL Bahamian Field Station,San Salvador, Bahamas.
———. 1995. Entombment and preservation of Sangamoniancoral reefs during glacioeustatic sea-level fall, Great InaguaIsland, Bahamas. In H. A. Curran and B. White, eds. Terres-trial and shallow marine geology of the Bahamas and Ber-muda. Geological Society of America Special Paper 300:51–61.
White, B. and M. A. Wilson. 1998. Bahamian coral reefs yieldevidence of a brief sea-level lowstand during the last inter-glacial. Carbonates and Evaporites 13:10–22.
Wilson, M. A., H. A. Curran, and B. White. 1998. Paleontologicalevidence of a brief global sea-level event during the last in-terglacial. Lethaia 31:241–250.

420 ANN F. BUDD AND JOHN M. PANDOLFI
Appendix 1List of specimens analyzed. Environments (based on GNMDS, Figure 7): 1 5 reef crest, 2 5 patch reef, 3 5 for-
ereef. Growth form (based on criteria given in ‘‘transects and sampling’’); C 5 columnar, M 5 massive, OP 5 organ-pipe.
Environment Specimen BPK no. Sample no. IslandGrowth
form (field)
33333322
1002210045100501005410057100611010410115
BP99-11WBP99-11WBP99-14MBP99-12MBP99-13WBP99-13WBP99-05WBP99-05W
AndrosAndrosAndrosAndrosAndrosAndrosSan SalvadorSan Salvador
COPCCMCOPC
21122222
1014110142101481014910151101521015310154
BP99-25WBP99-15/16MBP99-15/16MBP99-26MBP99-25WBP99-25WBP99-25WBP99-26M
Gt. InaguaGt. InaguaGt. InaguaGt. InaguaGt. InaguaGt. InaguaGt. InaguaGt. Inagua
OPCMOPMMOPOP
21111111
1015710158101591016010166101721017510179
BP99-18MBP99-15/16MBP99-15/16MBP99-15/16MBP99-15/16MBP99-15/16MBP99-24MBP99-15/16M
Gt. InaguaGt. InaguaGt. InaguaGt. InaguaGt. InaguaGt. InaguaGt. InaguaGt. Inagua
MCOPCCCCC
11112211
1018410204102051020610212102151021910220
BP99-15/16MBP99-21WBP99-22MBP99-21WBP99-18MBP99-25WBP99-22MBP99-22M
Gt. InaguaGt. InaguaGt. InaguaGt. InaguaGt. InaguaGt. InaguaGt. InaguaGt. Inagua
OPCMCCCOPOP
11221111
1022110224102251024110253102561025810259
BP99-21WBP99-22MBP99-25WBP99-25WBP99-16MBP99-16MBP99-16MBP99-24M/30-40M
Gt. InaguaGt. InaguaGt. InaguaGt. InaguaGt. InaguaGt. InaguaGt. InaguaGt. Inagua
CCCOPCCMM
11211111
1026010261102691027010276102781027910280
BP99-24M/30-40MBP99-24M/30-40MBP99-25WBP99-24M/30-40MBP99-24MBP99-16MBP99-16MBP99-16M
Gt. InaguaGt. InaguaGt. InaguaGt. InaguaGt. InaguaGt. InaguaGt. InaguaGt. Inagua
CMMCCMCM
11112222
1028210284102851028610291102921029310295
BP99-24MBP99-24MBP99-24MBP99-24MBP99-25WBP99-25WBP99-09WBP99-10M
Gt. InaguaGt. InaguaGt. InaguaGt. InaguaGt. InaguaGt. InaguaSan SalvadorSan Salvador
OPCCCCCOPOP

421OVERLAPPING SPECIES BOUNDARIES IN REEF CORALS
Appendix 1. Continued.
Environment Specimen BPK no. Sample no. IslandGrowth
form (field)
22222211
1030710308103101031510316103201032110328
BP99-09WBP99-09WBP99-10MBP99-17WBP99-10MBP99-25WBP99-22MBP99-22M
San SalvadorSan SalvadorSan SalvadorGt. InaguaSan SalvadorGt. InaguaGt. InaguaGt. Inagua
CCOPOPOPOPCC
21222212
1033510347103481035010352103531035510356
BP99-17WBP99-22MBP99-18MBP99-17WBP99-17WBP99-18MBP99-22MBP99-17W
Gt. InaguaGt. InaguaGt. InaguaGt. InaguaGt. InaguaGt. InaguaGt. InaguaGt. Inagua
OPOPCCCCCOP
22221222
1036010371103731037810379103871039310394
BP99-26MBP99-26MBP99-25WBP99-25WBP99-22MBP99-17WBP99-25WBP99-18M
Gt. InaguaGt. InaguaGt. InaguaGt. InaguaGt. InaguaGt. InaguaGt. InaguaGt. Inagua
OPCCCCOPOPOP
21122112
1039610398104001040110403104041040910410
BP99-17WBP99-20MBP99-20MBP99-18MBP99-25WBP99-21WBP99-20MBP99-25W
Gt. InaguaGt. InaguaGt. InaguaGt. InaguaGt. InaguaGt. InaguaGt. InaguaGt. Inagua
OPOPCCCCCC
12212112
1041110416104191042110422104241042910431
BP99-20MBP99-25WBP99-17WBP99-16MBP99-25WBP99-24MBP99-24MBP99-09W
Gt. InaguaGt. InaguaGt. InaguaGt. InaguaGt. InaguaGt. InaguaGt. InaguaSan Salvador
CCOPCCCOPC
2222222222
10436104411044310444104491045210455104591046310481
BP99-10MBP99-09WBP99-09WBP99-09WBP99-03W/4MBP99-03W/4MBP99-03W/4MBP99-03W/4MBP99-07W/8MBP99-07W/8M
San SalvadorSan SalvadorSan SalvadorSan SalvadorSan SalvadorSan SalvadorSan SalvadorSan SalvadorSan SalvadorSan Salvador
OPOPOPCOPMMOPCOP

422 ANN F. BUDD AND JOHN M. PANDOLFI
Appendix 2
Transect vs. taxon data matrices analyzed with PRIMER. Values are the summed lengths (m) of transect lineintercepted by each species. All transects were 40 m in length.
SpeciesBP99-
3WBP99-
4MBP99-
5WBP99-
6MBP99-
7WBP99-
8MBP99-
9WBP99-10M
BP99-11W
BP99-12M
Acropora cervicornisAcropora palmataAgaricia agaricitesSiderastrea radiansSiderastrea sidereaPorites asteroides
05.780000
000000
0.910.69000.191.3
000000
4.880.15000.51.07
000000
5.430.370000.68
000000
23.46000.081.220
000000
Porites furcataFavia fragumDiploria clivosaDiploria labyrinthiformisDiploria strigosaManicina areolata
2.430002.820
000000
0001.232.460.23
000000
0001.4300
000000
0.32000.330.660
000000
0000.361.430
000000
Columnar MontastraeaMassive MontastraeaPlaty MontastraeaMontastraea cavernosaOrgan-pipe MontastraeaDichocoenia stokesi
04.3008.950
05.3100
13.820
1.341.4300
10.290
1.43000
11.110
11.730.3200.469.10.15
14.741.63009.360
5.5200.730
12.370
6.72000
16.90
10004.90
1.370005.320
Isophyllastrea rigidaEusmilia fastigiataIsophyllia sinuosa? Mussismilia sp.Total coral recorded
0000
24.28
0000
19.13
0000
20.07
0000
12.54
0000
29.79
0000
25.73
0000
26.41
0000
23.62
00.1400
32.59
00006.69

423OVERLAPPING SPECIES BOUNDARIES IN REEF CORALS
Appendix 2. Extended.
BP99-13W
BP99-14M
BP99-15W
BP99-16M
BP99-17W
BP99-18M
BP99-19W
BP99-20M
BP99-21W
BP99-22M
BP99-23W
BP99-24M
BP99-25W
BP99-26M
17.12500000
000000
6.454.777.43000.14
000000
3.113.640.25000.26
000000
0.710.82
8.73000
000000
0.5812.6
0000.06
000000
10.316.140.41000.06
000000
0.100000
000000
000.302.3750
000000
0.2600.5506.820
000000
0.310.150.610.122.770.05
000000
00004.860
000000
002.980.40.180
000000
0.5802.4500.480
000000
00001.30
000000
0.20.950000
0.353.80000
2.920001.840.1
12.032.17005.450
4.22000.145.750
7.61.42009.740
3.220.97002.10
6.950.54002.250
2.95000.080.230
6.851.190.302.540
0.783.02002.40.1
9.624.13002.010
10.352.2200
14.050
17.662.8700
16.010
0.0500.150
21.15
00004.15
0.08000
31.36
0000
19.65
0000
21.38
0000
18.76
0000
31.4
00009.74
0000
20.06
0000.22
11.1
0.05000
26.78
0000
15.76
0000
28.02
0000
36.54
Appendix 3
Landmarks on transverse thin-sections of corallites of Montastraea. Types: 1 5 juxtaposition of structures, 2 5maxima of curvature, 3 5 extremal points.
Number Type Description
12345
33111
Center of coralliteOutermost point on secondary costaOuter left junction of secondary costoseptum with wall dissepimentOuter right junction of secondary costoseptum with wall dissepimentInner left junction of secondary costoseptum with wall dissepiment
6789
10
12233
Inner right junction of secondary costoseptum with wall dissepimentLeft point of maximum curvature associated with secondary septal thinningRight point of maximum curvature associated with secondary septal thinningInnermost point on secondary septumOutermost point on tertiary costa
111213141516
111122
Outer left junction of tertiary costoseptum with wall dissepimentOuter right junction of tertiary costoseptum with wall dissepimentInner left junction of tertiary costoseptum with wall dissepimentInner right junction of tertiary costoseptum with wall dissepimentLeft point of maximum curvature associated with tertiary septal thinningRight point of maximum curvature associated with tertiary septal thinning
1718192021
33111
Innermost point on tertiary septumOutermost point on primary costaOuter left junction of primary costoseptum with wall dissepimentOuter right junction of primary costoseptum with wall dissepimentInner left junction of primary costoseptum with wall dissepiment
222324252627
122311
Inner right junction of primary costoseptum with wall dissepimentLeft point of maximum curvature associated with primary septal thinningRight point of maximum curvature associated with primary septal thinningInnermost point on primary septumOuter left junction of tertiary costoseptum with wall dissepimentInner left junction of tertiary costoseptum with wall dissepiment

424 ANN F. BUDD AND JOHN M. PANDOLFI
App
endi
x4
Cor
rela
tion
sb
etw
een
char
acte
rs(T
able
2)an
dca
non
ical
dis
crim
inan
tfu
nct
ion
sca
lcu
late
din
anal
yse
sco
mp
arin
gth
eth
ree
Ple
isto
cen
esp
ecie
s.*
5re
lati
vely
hig
hco
rrel
atio
n.
En
vir
onm
ent
1R
eef
cres
t
Ch
arac
ter
Dis
crim
inan
tFu
nct
ion
12
En
vir
onm
ent
2P
atch
reef
Ch
arac
ter
Dis
crim
inan
tFu
nct
ion
12
All
3E
nv
iron
men
ts
Ch
arac
ter
Dis
crim
inan
tFu
nct
ion
12
x2 x10
x18
y22
exs
20.
4200
6*2
0.28
262*
20.
2192
0*0.
1163
22
0.11
125
20.
2219
22
0.07
293
20.
1669
20.
0227
02
0.03
571
y19
cd y21
LE
NG
TH
exs
0.52
112*
0.46
220*
0.40
244*
0.38
134*
0.37
152*
20.
2252
72
0.04
637
20.
3546
52
0.23
604
0.01
289
ens
x10
x16
CSI
ZE
cl
20.
4618
2*0.
3404
6*0.
3108
2*2
0.24
825*
20.
2226
1*
0.18
000
20.
0461
62
0.07
978
20.
0945
50.
1241
9L
EN
GT
Htt cl x2
1x1
4
0.07
108
20.
0514
70.
0503
62
0.20
835
20.
1925
0
20.
0503
52
0.01
607
20.
0490
22
0.47
954*
20.
4711
1*
x14
y11
x21
y22
x2
0.32
443*
0.32
405*
0.31
453*
20.
2892
1*0.
0960
8
0.07
564
20.
0835
70.
0912
40.
1367
42
0.03
352
x25
tt x9 x17
y19
0.14
329
20.
1336
20.
1136
92
0.04
988
20.
2978
2
20.
0560
30.
0368
72
0.02
081
0.01
349
0.59
827*
y19
y21
y11
x25
td
20.
0720
62
0.03
257
20.
1454
30.
0732
10.
0139
5
20.
4599
9*2
0.34
784*
20.
2738
6*0.
2572
8*2
0.18
295
ens
x18
x10
CSI
ZE
x16
0.18
767
0.12
389
20.
2126
50.
0838
72
0.17
584
20.
4333
8*0.
3513
3*0.
2591
6*2
0.23
444*
0.20
057*
x14
x21
cd y21
y11
0.00
160
0.01
912
20.
1439
72
0.34
131
20.
0560
6
0.58
767*
0.58
044*
0.47
035*
0.42
657*
0.42
317*
CSI
ZE
x16
x9 ens
x17
cd
0.17
564
20.
1180
20.
0342
90.
0660
00.
0104
60.
0432
9
0.18
285
0.17
595
0.15
663
20.
1088
32
0.07
999
20.
0501
7
x25
x17
cl x9 td tt
0.11
835
0.09
114
0.07
229
0.01
271
0.02
231
0.04
161
0.19
078
0.14
289
20.
1232
10.
1199
70.
0893
12
0.05
673
exs
y22
LE
NG
TH
x18
x2 td
0.04
533
20.
0247
22
0.26
983
0.23
298
0.16
898
20.
1357
8
0.35
171*
20.
3429
2*0.
3069
4*0.
2921
4*0.
2626
9*0.
2312
1*
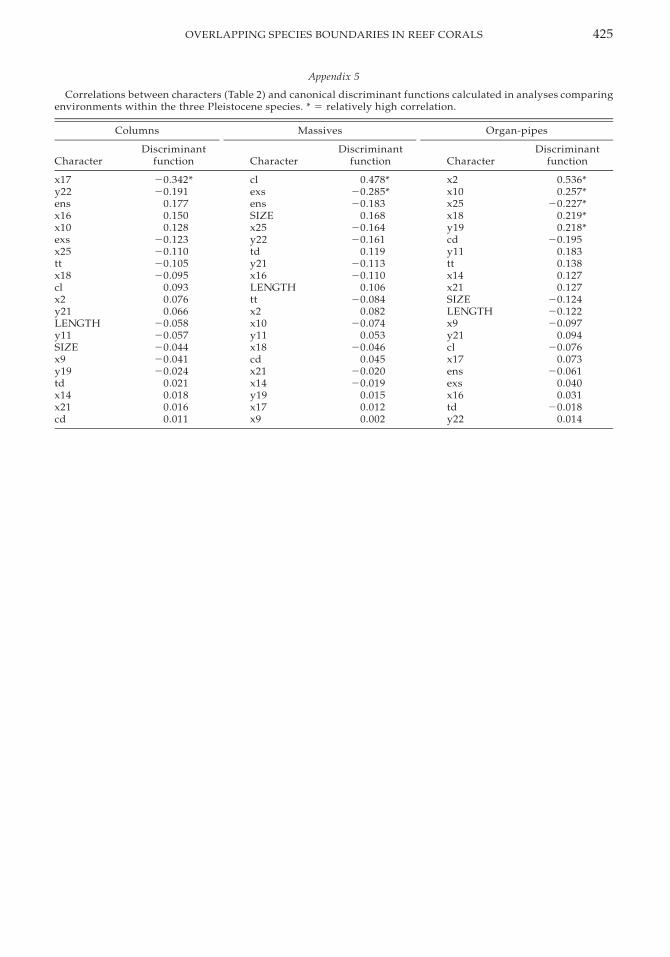
425OVERLAPPING SPECIES BOUNDARIES IN REEF CORALS
Appendix 5
Correlations between characters (Table 2) and canonical discriminant functions calculated in analyses comparingenvironments within the three Pleistocene species. * 5 relatively high correlation.
Columns
CharacterDiscriminant
function
Massives
CharacterDiscriminant
function
Organ-pipes
CharacterDiscriminant
function
x17y22ensx16x10
20.342*20.191
0.1770.1500.128
clexsensSIZEx25
0.478*20.285*20.183
0.16820.164
x2x10x25x18y19
0.536*0.257*
20.227*0.219*0.218*
exsx25ttx18cl
20.12320.11020.10520.095
0.093
y22tdy21x16LENGTH
20.1610.119
20.11320.110
0.106
cdy11ttx14x21
20.1950.1830.1380.1270.127
x2y21LENGTHy11SIZE
0.0760.066
20.05820.05720.044
ttx2x10y11x18
20.0840.082
20.0740.053
20.046
SIZELENGTHx9y21cl
20.12420.12220.097
0.09420.076
x9y19tdx14x21cd
20.04120.024
0.0210.0180.0160.011
cdx21x14y19x17x9
0.04520.02020.019
0.0150.0120.002
x17ensexsx16tdy22
0.07320.061
0.0400.031
20.0180.014