overfishing in the philippine commercial marine fisheries ... · in terms of output, the philippine...
TRANSCRIPT

For comments, suggestions or further inquiries please contact:
Philippine Institute for Development Studies
The PIDS Discussion Paper Seriesconstitutes studies that are preliminary andsubject to further revisions. They are be-ing circulated in a limited number of cop-ies only for purposes of soliciting com-ments and suggestions for further refine-ments. The studies under the Series areunedited and unreviewed.
The views and opinions expressedare those of the author(s) and do not neces-sarily reflect those of the Institute.
Not for quotation without permissionfrom the author(s) and the Institute.
The Research Information Staff, Philippine Institute for Development Studies3rd Floor, NEDA sa Makati Building, 106 Amorsolo Street, Legaspi Village, Makati City, PhilippinesTel Nos: 8924059 and 8935705; Fax No: 8939589; E-mail: [email protected]
Or visit our website at http://www.pids.gov.ph
January 1997
Overfishing in the PhilippineCommercial Marine Fisheries Sector
DISCUSSION PAPER SERIES NO. 97-01
Danilo C. Israel and Cesar P. Banzon

OVERFISHING IN THE PHILIPPINE COMMERCIAL MARINEFISHERIES SECTOR
by
Da_do C l_d and Ce_ P, _.o# _
1. Introduction
Since the country is archipelagic, the fisheries sector of the Philippines is tradition_ya significant contributor to its economy. The total output of the sector approximately
comprises five percent of the Gross National Product. Furthermore, fisheries productionmeets more than two-thirds of national animal protein consumption (Guerrero 1989; BAR
1991).
While the fisheries sector is economically significant, it is currently facing a serious
problem that threatens k viability as economic base. Specifically, empirical studies indicatethat marine fishery stocks are already overfished (e.g Silvestre and Pauly 1987; Dalzell et al.1987; Trinidad et al. 1993; Padilla and De Guzman 1994). It has been argued that if thecurrent rate of overfishingcontinues unabated, the marine fisheries may collapse as important
edible fish species are driven to virtual extinction.
A survey of the available literature, however, shows that there are some gapsin theresearch on marine overfishing which need to be addressed. Among others, an importantlimitation of past studies is that analyses were mainly based on groupings of species, i.e.small pelagic and demersal marine fisheries. This approach may render findings inadequatefor actual fisheries management and policy-making which may be sector-based. Secondly,the studies have generally disregarded the unemployment implications that proposedreductions in overfishing may cause. Needless to say, these should be major concerns in adeveloping country that emphasizes on social equity as a development goal.
The objective of this paper is to address the abovecited gaps in research by lookinginto the commercial marine fisheries. The sector was chosen as subject of analysis because,in contrast to the municipal fisheries which is now generally accepted as overfished, thereappears to be no consensus as to whether or not the same holds true for the commercialfisheries. It is the aim of the paper to help shed light on issues and contribute informationuseful for the management of the commercial fisheries.
The rest of the paper is .organized as fo't_s. A review of the performance of thefisheries industry in general and the commercial fish'e<iessector in particular is presented in
XResearchfellowa_KItbrmerresearchassociate,respectively,ofthe philippine Institutefor DevelopmentStudies,NEDAsa MakatiBldg.,106AmorsoloSt.,LegaspiVillage,Makati1200,MetroManila,philippines.
1

section 2. Then, Section 3 summarizes the overfishing problem in the marine fisheries using
species-based data obtained from past studies. The basic theory and models of over-fishingare discussed in Section 4 while Section 5 explains the data used in the study. FinallySection 6 present the remits while Section 7 provides the conclusions, recommendations andareas for future research.
2. Performance of the Fisheries Industry
In terms of output, the Philippine fisheries industry has been s.teadilygrowing inrecentyears (Table 1). From 1981 to 1994, the sector posted an average annual growth rateof 3.30 percent, in terms of quantity, and 15.84 percent, in terms of value of production.Among the four fisheries sectors, aquaculture and commercial fisheries grew the fastest, inquantity terms, while municipal marine fisheries and inland fisheries increased the slowest.
The commercial fisheries, in particular, rose at an average annual rate of 4.62
percent, in quantity, and 13.76 percent, invalue of production over the 1981-94 period. In1994, the sector produced about 5 thousand metric tons offish valued at approximately 14billion pesos.
The fisheries industry employs about a million fishermen and fishfarrners,
highlighting its importance as a generator of mainly rural jobs (BFAR 1991). Of these, 36percent were in municipal marine fisheries, 29 percent were in commercial fisheries, 27percent were in aquaculture and 8 percent were in inlandfisheries (Figure 1). Hence, thecommercialfisheriessector is a majoremployment base, second only to the municipal marinefisheries.
In addition,when all backward and forward linkages are considered, about 12 percent
of the general population were in one way or another dependent on fisheries related activitiesfor their livelihood (e.g. Trinidad et al. 1993). This again highlights the importance offisheries as a source of employmentto the national economy. It is not known, however, howmuch of this can be attributable to the commercial fisheries.
Lastly, the fisheries industry has been a steady dollar earner. In recent years, inparticular, fishery exports have been growing at very high rates annually, especially in valueterms (Table 2). While this was the case, however, imports have increased as well, at evengreater rates than do exports. Because of this, the industry has been recording negative netexports over time, in quantity terms, although in value terms, it has been posting positive netexports.
3. Overfishing in the Marine Fisheries
Based on species-baseddata from past studies, the overfishing problem in the marinefisheries can be summarized as follows (Table 3). Over time, the catch per unit effort, orCPUE, for both smallpelagic and demersal species has steadilyfallen so that by 1984, it wasonly approximately a third of the 1965 figure, in contrast, fishing effort has risen in 1984 to

Table 1: Quantib Thousand Mr) and FOB Value 0Vlillion P) of Fish Production in the Philippines r by Sector r1981-94.Municipal Inland
All Sectors Commercial Marine Aquaculture FishingYear Quantity Value Quantity Value Quantity Value Quantity Value Quantity Value
1981 1,774 13,955 495 4,125 710 6,264 340 2,866 229 7001982 1,896 15,064 526 4,355 708 6,488 392 3,393 270 8281983 2,110 18,982 519 4,643 771 7,463 445 4,799 375 2,0771984 2,080 25,650 513 6,521 790 10,291 478 7,266 299 1,5721985 2,052 31,297 512 7,857 785 12,796 495 8,724 260 1,9201986 2,089 37,331 546 9,248 807 14,611 471 10,832 265 2,6401987 2,213 37,350 591 9,821 816 14,217 561 11,421 245 1,8911988 2,270 42,118 600 10,272 838 14,693 600 15,213 232 1,9401989 2,371 45,094 637 11,033 883 16,182 629 15,673 222 2,2061990 2,504 52,177 701 12,411 895 16, 736 671 20,466 237 2,5641991 2,599 60,034 760 15,245 914 19,614 692 22,656 233 2,519
_o 1992 2,626 65,443 805 16,801 855 19,444 736 25,986 230 3,2121993 2,647 71,058 845 18,365 803 20,118 772 30,508 227 2,0671994 2,686 81,229 883 21,130 787 22,327 791 35,280 223 2,492
Ave. Annual 3.30 14.84 4.62 13.76 0.88 10.77 6.87 22.01 0.69 16.87
Growth Rate (%)
Source: BAS. "Selected Fisheries Statistics".
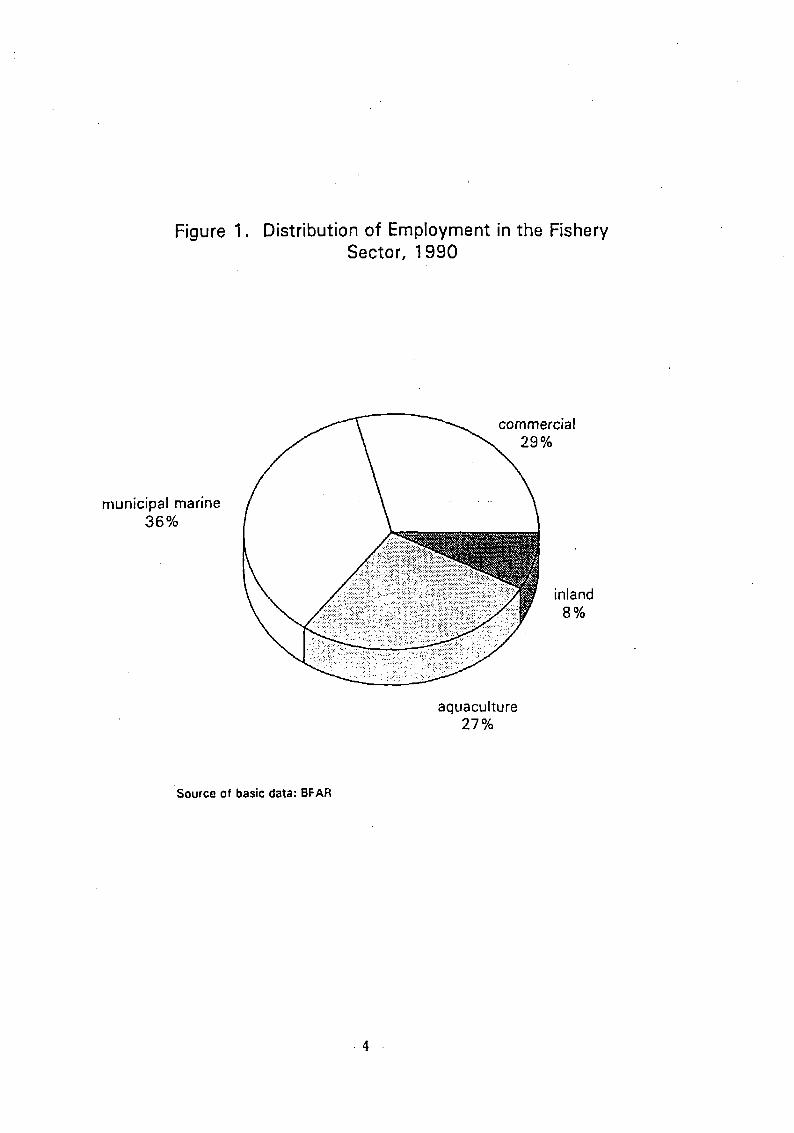
Figure 1. Distribution of Employment in the FisherySector, 1990
_ commercial29%
municipal marine36%
inland
_ 8_aquaculture
27%
Sourceof basicdata:BFAR
.4

Table 2: Quantity (1_r) and FOB Value (Million P! of Exports and Imports of Fishery Products by the Philippines r1981-94.Net
Exports Imports ExportsYear Quantity Value Quantity Value Quantity •Value
1981 83,736 1,251 46,850 288 36,886 9631982 68,265 1,120 83,445 444 (15,180) 6761983 75,589 1,593 23,038 111 52,551 1,4821984 63,055 2,179 6,097 50 56,958 2,1291985 95,077 3,496 " 28,755 118 66,322 3,3781986 101,453 4,883 69,085 386 32,368 4,4971987 111,830 6,442 104,936 637 6,894 5,805
1988 128,903 9,599 164,575 1,312 (35,672) 8,2871989 145,099 10,248 197,966 1,424 (52,867) 8,8241990 143,038 11,529 196,115 1,854 (53,077) 9,6751991 144,939 14,048 193,635 2,323 (48,696) 11,7251992 131,915 11,090 221,545 2,496 (89,630) •8,5941993 163,745 14,074 208,895 2,249 (45,150) 11,8251994 172,080 15,027 241,194 2,505 (69,114) 12,522
Ave. Annual 7.03 23.33 45.77 40.87 -41.90 26.99
Growth Rate (%)
Source: BAS. "Selected Fisheries Statistics".

2
Table 3: Fishing Effort and Catch Per Unit Effort for Small Pelagic and Demersal Fish Specie
n the PhilippinesL1965-85. ii I . ii i i
Small Pelagic.s . . Demersals,Year Effort CPUE Effort CPUE
, ('000 I-Ip_.. _, (Mt/I-Ip/v) ,, ('000 Hp) (Mt/I-Ip,/y
1965 105 2.50 182 1.131966 194 2.00 203 1.091967 210 1.55 264 0.201968 203 1.76 337 0.891969 166 2.11 431 0.651970 157 2.69 494 0.561971 155 2.93 536 • 0.531972 313 2.08 610 0.541973 292 1.74 676 0.511974 280 1.82 718 0.521975 266 1.94 653 .0.461976 259 2.01 524 0.691977 280 2.03 509 0.731978 363 1.64 534 0.681979 416 1.20 534 0.681980 371 1.21 677 0.551981 491 1.13 677 0.471982 625 0.92 777 0.471983 621 0.85 946 0.401984 557 0.84 976 0.421985 558 0.84 - -
Ave. Annual 11.93 -4.07 10.04 10.83
Growth Rate (%)
Sources: Silvest_e and G uly (1987) an'd Dalzell et._ll (1987).
6

greater than five times the 1965 level. Thus, clearly, while more and more effort has beendedicated to catching fish, the yield per unit has been fast declining.
A graphical presentation of the overfishing data, however, indicates that there wereactually years when fishing effort declined (Figure 2). For small pelagic species, for instance,fishing effort decreased in the late sixties, early seventies, mid-seventies and mid-eighties.For the demersal species, on the other hand, effort fell in the t_::Liddleand late seventies. Whilethis was so, on the other hand, there is no mistaking that the overall general trend of fishingeffort has been increasing over the whole period.
A similar case can be observed about the CPUE (Figure 3). As can be seen, for small
pelagic species, it increased in the early and late seventies while for demersal species, it rosein the late sixties and middle seventies. Again, however, the overall trend of the CPUE has
been falling over the whole period. ......
4. The Theory and Models of Overfishing
4.1 Basic Theory
In general, overfishing can be classified into four categories (see e.g. Pauly 1987).One is growth overfishing which occurs when the fish are caught even before they have achance to grow. Another is recruitment overfishing which happens when the adult fish
population is caught in large numbers so that reproduction is impaired. The third isecosystem overfishing which takes place when the decline in a once abundantfish stock dueto fishing is not compensated for by an increase in the stocks of other species. Finally, thefourth category is economic overfishing which occurs when increases in the fishing effortleads to profit levels which are below the desired maximum.
Of the above categories of overfishing, economic overfishing may be of most interestto fisheries managers and planners. This is because fisheries resources are primarily viewedas economic resources, i.e. as generators of food andemployment. As such, any disruptionin fisheries will be analyzed eventually in terms of how much it impacts on its role as aneconomic sector.
The basic theory behind marine overfishing is already well discussed in theliterature(e.g. Cunningjaarnet al. 1985; Panayotou and Jetanavanich 1987; Schatz 1991). insummary, it starts with the notion of a fisheryresource, the sea, that is owned by no one andwhose exploitation is open to everyone. Beforethe entrance of man into the fishery, the stockof fish, P, is assumed to grow at a net natural rate, r, between two time periods. This r isequal to the recruitment of young fish joining the stock plus the growth of original fish in thestock less the natural fish mortality.
As man enters the fishery and starts to prey on the fish, the situation evolves. Bydefinition, r is now also the volume of fish, y, that can be caught by man in a sustained
way without affecting the size of the stock. It is sustainable because with all of thenatural growth in the stock captured by man, total stock will not grow but remains

Figure 2. Total Fishing Effort for Small Pelagicand Demersal Fishes, 1 965-1 985
'000 horsepower1200
1000 -
800
Demersal
60O
400
SmallPelagic
2OO
0 Years1965 1970 1975 1980
Source of basic data: Table 3.

Figure 3. Catch Per Unit Effort for Small Pelagicand Demersal Fishes, 1965-1985
mt/hp/yr3.5
3.0 -
2.5
2.0
1.5
SmallPelagic
1.0
Demersal
0.5
I0 l I I. I t, . I I I l I t t t ! l t , ._]__ t t I
1965 1970 1975 1980 Years
Source of basic data: Table 3.

constant over time. Also, since man preys on fish and adds to their mortality, his activity
may eventually lead to the reduction of P. This implies that the relationship betweenfishing effort, E, and P is inverse.
From the above relationships, a more in-depth examination will reveal that a U-
shaped relationship exists between r or y and E. The relationship is one where at lowereffort levels, the fish stock is high and this causes overcrowding and slow growth. Asfishing effort rises, the stock declines and crowding is lessened, hence, causing fastergrowth. Finally, at too much effort, there is smaller stock to reproduce and growth slowsdown again.
In the U-shaped relationship between r or y and E, the point at which the level ofeffort yields the maximum r is the maximum sustainable point. Here, the fish catch byman is the biological optimum, the so-called maximum sustainable yield or MSY.
The biological theory summarized above, however, will not be a sufficient basisfor marine resource planning and management where, as mentioned, economic concernsare important. Hence, the biological theory has to be transformed into an eccaornictheory. This transformation is facilitated by incorporating prices for fish •catch andfishing effort to turn the biological parameters into economic parameters.
In brief, to illustrate the economic theory, the total revenue, or TR, is firstgenerated by multiplying fish catch by the price of fish and the total cost, or TC, isderived by multiplying fishing effort by the price of effort per unit of time. If the•pricesof fish and effort are assumed constant, the resulting TR curve will be U-shaped whilethe TC curve is a straight line sloping upward (Figure 4).
Initially, the economic theory explains that as E increases, TR also increases butat a decreasing rate. Thus, continued increases in E brings the level of TR first to theeconomic optimum, the maximum economic yield or MEY. At MEY, the standardeconomic condition for profit maximization is met. Hence, from the economicstandpoint, MEY is the most desirable exploitation level for the fishery.
If the fishery is efficiently run, fishing should stop at MEY where profits are atmaximum. However, with complete open-access, fishing continues beyond MEY asmore and more fishermen,motivated by the existence of profits, get into the fishery. This
situation pushes the level of fishing past the economic optimum into the next optimum,the MSY, which as already mentioned is the biological optimum of the fishery.
At the MSY level, positive profit still exist as TR remains greater than TC. This
profit induces further fishing until, finally, the open access yield, or OAY, is reached. Atthis point, positive profits are gone and, without any incentive to continue fishing, furtherhuman predation stops. The OAY is the long-run equilibrium point of the fishery.
In addition to the MEY, MSY and OAY concepts, an economic indicator that isoften used to measure sustainability in the fishery is the economic rent or ER. Thisindicator is defined as the net return that occurs when the fishery is used in an
10

Figure 4. The Basic Economic Theory of Overfishing
TR,TC
TC
.I
Fishing Effort (E)0 EMEY EMSY EOAY
11

economically optimal way and is equal to the excess profits which is the differencebetween the overall economic value of the goods produced from the activity less theeconomic cost of production, where the cost is inclusive of normal profits (Schatz 1991,
p. 3). Thus, ER is simply the profits at MEY. In this study, a clarification in thedefinition of economic rent is made. Here, the term "maximum economic rent" or MER
is used to imply the profits at MEY. On the other hand, ER means the excess profit atany of point of exploitation of the fishery.
4.2 Models
There are four general types of models which can be applied in the analysis ofoverfishing. These are the single species and constant price models, single species andvariable price models, multiple species and constant price models and multiple speciesand variable price models. The single species and constant price type of models is.selected for this study primarily due to data constraints.
There are two single species and constant price models which are employedpopularly in empirical research, the Gordon-Schaefer, or GS model, and the Fox Model.The GS model originated from Gordon (1953) and Schaefer (1954, 1957) while the Foxmodel has its beginnings in Fox (1970). Mathematically, the GS model is specified as
r- ¢E. _E2 . u (1)
or
I"tE- a • _g. u (2)
where Y is fish catch, E is defined as before, a is the intercept, b is the coefficient andu is the error term. On the other hand, the Fox model is specified as
7. g • °''_'_ (3)
or
.r/'_' .. _'P* _' n (4)
where c and d are the intercept and coefficient, respectively, e stands for exponent andthe other symbols are the same as before.
12

5. Commercial Fisheries Data
5.1 Sources of Data
This studyused secondary time-series data covering the period 1948-1994. Thesources of data were the Bureau of Fisheries and Aquatic Resources (BFAR), Bureau of
Agricultural Statistics (BAS) and past studies. The basic data for the subperiod 1948-87were mainly from the BFAR while those for 1988-94 were from the BAS.
The relevant publication of the BFAR was the "Fisheries Statistics of thephilippines". Those of BAS were the "Fishery Statistics", "Commercial FisheryProduction Statistics" and "Selected Fishery Statistics".
5.2 Fish Catch Data
The available time-series catch data from the sources for the i_o subperiods,1948-87 and 1988-94, were inconsistent and thus necessitated some adjustment. In
particular, catch data for the first subperiod were underestimated while those for the latterwere overestimated (see Dalzell et al. 1987; Padilla and de Guzman 1994). To address
this, the data were adjusted using a regression-based procedure. The final catch data forthe whole 1948-94 period are shown in Table 4. A more detailed explanation of the dataused in the studyis contained in Israel and Banzon (1996).
5.3 Fishing Effort Data
In past works, the most commonlyaccepted measure of fishing effort was fleethorsepower. This study used a modified measurefor fishing effort, the details of whichwere also explained earlier(1bid). In summary,fishing effort was estimated as the sumof engine and labor horsepower in the catch and cartier fleets of commercial fisheries,adjustedfor learning effects.
Some problemswere encounteredin generating engine horsepower data for thecommercial catch fleet. For the whole 1948-87 subperiod, for instance, BFAR did not
gather information on the engine horsepower of catch vessels but instead collected dataon the tonnage and number of gears in earlier years. To address this inconsistency, theengine horsepower data series for the catch fleet was constructed based on the availableraw data by using a regression-based procedure. For 1988-94 subperiod, on the otherhand, no BAS data were available at all on which a measurement of engine horsepowerof catch vessels can be based. To address this probleml the engine horsepower data were
extrapolated using a procedure based on ratios and proportions.
Once the engine horsepower for the catch fleet was accounted for, the laborhorsepower was computed. As there were no availabledata which can be used to directlymeasure it labor horsepower, it was estimatedby taking it as ratio of engine horsepower
by using data from Trinidad et al. (1993) and Karim (1985).
13

CatchrEffort and Catch Per Unit Effort in the Philippine Commercial Fisheries, 1948-94.
Year Catch Effort CPUE., (Mr) (Hp)
1948 85,653 24,247 3.53251949 113,310 41,889 2.70501950 133,235 57,485• 2.31771951 161,584 83,800 1.92821952 180,787 104,359 • 1.73241953 178,539 101,839 1.75311954 192,090 11_487 1.63501955 191,270 116,509 1.64171956 189,295 114,170 1.65801957 183,684 10_651 1.70631958 208,102 13_381 1.51481959 214,935 146,332 1.46881960 214,877 146,256 1.46921961 227,180 163,063 1.39321962 243,969 18_437 1.30161963 271,604 231,158 1.17501964 279,811 245,002 1.14211965 300,074 310,237 0.96721966 314,899 392,013 0.80331967 330,922 422,195........ 0.78381968 406,794 409,450 0.99351969 368,727 439,560 0.83891970 381,877 484,615 0.78801971 382,276 460,943 0.82931972 424,754 553,994 0.76671973 465,422 634,416 0.73361974 470,675 620,618 0.75841975 498,617 601,506 0.82891976 508,197 633,966 0.80161977 518,165 549,419 0.94311978 505,840 577,953 0.87521979 500,747 712,080 0.70321980 488,478 775,780 0.62971981 494,768 900,325 0.54951982 526,273 981,712 0.53611983 519,316 1,055,844 0.49181984 513,335 969,779 0.52931985 511,987 1,003,392 0.51031986 546,230 983,919 0.55521987 591,192 -1,077,893 0.54851988 599,995 1,149,098 0.52211989 637,138 1,265,398 0.50351990 700,564 1,428,673 0.49041991 759,815 1,59Z473 0.47561992 804,866 1,756,049 0.45831993 845,431 1,918,635 0.44061994 .....88_5,446 .... 2,091,899 0.4233|lw
14

In the case of the commercial cartier fleet, engine horsepower data for e_lier
years were directly generated from DalzeUet al. (1987). To estimate data for latter years,engine horsepower was projected based on the average annual growth rate for earlieryears. On the other hand, data for cartier labor horsepower were measured using thesame procedure used for estimating labor horsepower for the catchfleet..
After the engine and labor horsepower data for the catch and cartier fleets were
generated, these are adjusted for learning effects. This final adjustment was done byusing the learning factors developed by Silvestre et al. (1986) and later applied inSilvestre and Pauly (1987).
The fishing effort data used in the study are also provided in Table 4. Dividingthe catch data by the fishing effort data gives the CPUE data which aze likewise presentedin the same table. .....
5.4 Price of Fish and Fishing Effort Data
For this study, the price of commercial fish was estimated by averaging themarket wholesale prices for major commercial fish species for 1994, based on BAS data.The price offish used was P49,742 per metric ton. On the other hand, the cost of effortwas based on 1988 data from Trinidad et al. (1993). The price was scaled upwards to
1994 figures to account for inflation. The price of fishing effort used was P16,043 perhorsepower.
6. Findings
6.1 Results of Estimation
The results of the estimation of the biological specification of the GS and Fox
models are provided in Table 5. As shown, the GS model had a higher adjustedcoefficient of multiple determination. Both models generated the expected signs andsignificance for the coefficients thus indicating that the commercial fisheries as a wholeare overfished.
Using the results for the GS model, the MEY, MSY and OAY levels werecomputed (Table 6 and Figure 5). The MSY was at 785,706 metric tons valued atP39.084 billionand produced at the fishing effort of 1,833,191 horsepower. When thesefigures were compared with catch and effort values in Table 4, the MSY level appearedto have occurred back in the early nineties.
The MEY, on the other hand, was at 674,476 metric tons valued at P33.550billion and produced at the effort level of 1,143,447 horsepower. Comparing with thefigures in Table 4, this level appeared to have been attained back in the late eighties andearly nineties.
15

Table 5: Regression Results for the Gordon-Schaefer and Fox Models in the Philippine Commercial Fisheries r 1948-94
Specification (a) Model al a2 Adjusted R2
Catch -- a Effort + b Effort2 Gordon-Schaefer .8572* -.0000002338* 0.85(21.676) (-8.654)
Catch = Effort Exp (c + d Effort) Fox .4588* -.000000888* 0.76(7.760) (-12.154)
Figures in parenthesis are t-values.*means significant at the I percent level.(a) Catch and effort are in quantity terms.
o_

Table 6: Key Indicators Usin _the Gordon-Schaefer Model Results in the PhiIippine Commercial Fisheries r 1994.Maximum Economic
Indicator Volume of Catch Total Revenues Amount of Effort Total Costs Rent/(Metric Tons) (Pesos) (Pesos) (Pesos) Economic Rent
Maximum Sustainable Point 785,706 39,082,565,981 1,833,191 29,409,879,384 9,672,686,597 .
Maximum Economic Point 674,476 33,549,785,675 1,143,447 18,344,318,773 15,205,466,902
Open Access Point 735_579 3G6881637r546 2_28G894 36r688r637r546 0
b-a

Figure 5. Results of the Estimation of the Gordon-Schaefer
Model for the Commercial Fisheries, 1948-1994
BillionPesos
MSYTC
MSY = P39.0 _ _A YOAY = P36,7 -- . ..
f I
MER=PlS.2
I " I
__- I II I
f I
• I " II II I
0 1.1 1.8 2.3 FishingEffort(MillionHorsepower)
18

The OAY was at 737,579 metric tons valued at P36.687 billion and produced ateffort level of 2,286,894 horsepower. Comparing with figures in Table 4, This level has
yet to happen, implying that with open access, further exploitation in the sector will likelyoccur.
Expressed in terms of quantity, the MER that can be had from the commercialfisheries per year amount to 305,677 metric tons. This estimate is generally consistentwith results of previous studies. Dalzell et al. (1987) measured that MER from small
pelagic fisheries was about 366,000 metric tons. On the other hand, Silvestre and Pauly(1986) estimated the MER from the demersal fisheries at approximately 125,000 to200,000 metric tons or 162,500 metric tons on average per year. When summed up, thecomputed MER from the small pelagic and demersal fisheries was at 528,500 metrictons.
Little is known about how much of small pelagic and demersal catch came fromcommercial fisheries. However, the average share of commercial fisheries catch to totalmarine fisheries catch from 1990 to 1994 was 48 percent (see Table 1). Using this as a
rough basis, the commercial fisheries share of the MER coming from the small pelagicand demersal fisheries was about 253,680 metric tons a year.
There is no information about the MER from large pelagic fisheries, much less
the portion of this that goes to commercial fisheries. At any rate, it can be assumed thatthe difference between the figure of 253,580 metric tons from past studies and the figureof 305,677 metric tons computed by this study represents the rent from large pelagicfisheries.
6.2 Employment Impact of Reduction of Fishing Effort
Based on the aboveresults, fishing effort needs to be reduced from the 1994 level
of 2,091,899 horsepower (Table 4). In percentage terms, effort in the commercialfisheries sector will have to be reduced by about 45 percent to arrive at MEY. To attainthe MSY, o.nthe other hand, it will have to be lowered by approximately 12 percent.
A reduction in fishing effort to attain MSY or MEY is expected to raise the
productivity of commercial fisheries. However, it may result to unemployment amongthe fishermen who will be eased out, at least in the short-run. While it is difficult to
exactly estimate employment effects of a reduction in effort, it is attempted here and theresults are provided in Table 7.
Based on the 1990 figure of about 1 million total fishermen and fishfarmers, the
percentage of commercial fishermen to the total and the annual growth rates of thegeneral population t_ereafter, the estimated number of commercial fishermen in 1994 is319,937. As mentioned, to attain'MSY, fishing effort must be decreased by 12 percent.If this is applied equally to labor and engine horsepower, then commercial fishermen willbe reduced by 38,392. To arrive at MEY, on the other hand, effort must be lowered by45 percent. Again, if this is applied equally to labor and engine horsepower, thencommercial fishermen will be reduced by 143,972.
19

Table 7: Estimated Employment Impacts on a Reduction of Fishing Effort to Attain MSY and MEY r 1994.Maximum Sustainable Yield Maximum Economic Yield
Percent Current Number Decrease in Percent Decrease Number of Decrease in
Decrease in Effort of Fishermen (a) Employment in Effort Fishermen (a) Employment
12 319,937 38,392 45 319,937 143,972
(a) To derive the figures for the number of fishermen, general population growth rates were taken from the NCSO "PhilippineStatistical Yearbook". Then the 1994 fishermen population was computed based on the growth rates and the 1990 ratio ofcommercial fishermen to the total provided in Figure 1.
tOO

From the above estimation, therefore, a large number of commercial fishermenwill lose their jobs if efficiency and sustainability is to be achieved in the commercialfisheries. Since the Philippines already has a serious unemployment problem, this fisherymanagement concern cannot be ignored.
7. Conclusions, Recommendations and Areas for Future Research
7.1 Conclusions
To recapitulate, the results of the study indicate that the commercial fisheries asa whole is overfished and that the overexploitation may have started way back in the
eighties. Furthermore, substantial gains in terms of economic rent can be had if the sectoris operated at sustainable levels. These conclusions are generally consistent to those ofpast species-based studies.
The results further imPlYthat substantial reduction in fishing effort will berequired to reach sustainable levels of operation of the commercial fisheries. To attainMEY, for instance, current effort may have to be decreased by as much as 45 percent.Because of this, unemployment, at least in the short-run, will be a serious negative side-effect of sustainable operation. In particular, approximately 144,000 commercialfishermen will lose their jobs if the MEY level is attained.
From the above results, there is clearly the need to immediately address the
problem of overfishing in the commercial fisheries if the sector is to survive as aneconomic base. On the other hand, the solution to the problem must be sensitive to the
potentially large unemployment impacts it may bring.
7.2 Recommendations
Based on findings of the study, some recommendations for the improvement ofthe management of the commercial fisheries sectors are suggested. First and foremost,since commercial fisheries as a whole is already overfished due to excessive fishingeffort, this overexploitation must be immediately addressed by controlling total effort.At present, the Fisheries Sector Program (FSP) is in the process of devising an approachto actually do this. Suffice it to say at this point that the incoming recommendations ofthe FSP regarding effort reduction in the commercial fisheries must be seriouslyconsidered, if not immediatly implemented by the authorities.
Without pre-empting the efforts of the FSP, some important points can be raisedhere in the search for a long-term way of reducing fishing effort. Firstly, any futurereduction must be done in such a manner that the expected costs of reduction, such asadministrative costs, rent seeking costs, etc., willbe less than the expected gains, suchas increased public revenues, production efficiency, etc.
Another point that can be raised is that in the search for immediate solutions tooverfishing, a practical approach which can be considered is to substantially raise the
21

license fee ratesnow imposedin the commercialfisheries. At present, the licensefeesareverylowto effect any real effort reduction (see e.g. Schatz 1991). Usingthe licensesystemto helpreduceefforthas a distinctadvantagein that the fisheryauthorities alreadyhave long experiencein using it.
There is doubt, however, that the licensingsystemwillbe effectivein reducingfishing effort in the long-term. This is because there is the danger that the burden ofhigher license rates will just be transferred by commercial fishermen to the finalconsumersviahigherpricesfor the catch. Thus, it becomes necessarythat over the long-term, othermeasuresshouldbe consideredbythe fisheryauthorities (seee.g. Panayotou1995; Pearse 1991). A management systemsimilarto the ITQ in New Zealand andadjusted to accommodatelocal conditions,for instance, might work here.
It shouldalsobe rememberedthatwhilethe commercialfisheriessector mayhavea high MER computed in this study, the actualeconomicrent it has been enjoyingmaybe muchless,giventhat the subsector is operating close to open access equilibrium. Soas not to encouragesuddendislocationand closureamongthe commercialfishermen,anyeffort reduction schememust be appliedgradually,for instance,if higher licenceratesare to be imposed,the establishednew set rates must be set waybelow what can capturethe whole MER initially. In addition, the increases in licence rates have to be donegraduallyto allowadjustmentamong the fishermen. In the first year of implementation,for instance, the rates may not be more than, say, 20 percent of the final targetedmaximumrates for the attainmentof sustainability. Then, the rates can be increased atthe same percentage everytwo years or so thereafter.
Theproblemof displacedcommercialfishermenonce an effectiveeffort reducingscheme is in place should be a matter of serious concern. As many fishermen havelimited skills outside of their profession, it will be difficult to employthe displaced inothereconomicsectors. Hence,a retrainingand employmentprogrammay be necessary.A potential option is for the national government and private sector to pool theirresourcestogetherto organizesucha program. Moreover, if the need arises, probablyanalternative livelihood program similar to those developed for municipalfisherieswillhaveto be put up to accommodateat least themost disadvantagedcommercialfishermen.
Over andabovewhat hasalreadybeensuggested, in mustbe emphasizedthat theuse ofinstnunentsto reducefishingeffortmustbe accompaniedby strong reforms in theenforcement side. In particular, the illegal underground economy in fisheries, e.g.commercialoperatorsusingunlicensedduplicateboats, must be curtailed. Furthermore,reducing the poaching by foreign vesselsin local waters is a necessity. It also goeswithout saying that penalizing the offenders strictly according to law is a must todiscourage futureunlawfulactivities.
Finally, althoughthe commercialfisheriesas a whole may be overfished, theremay subsectors within, e.g. specific fishing areas and commercial species, whichcurrently remain underexploited. The developmentof these subsectors must also beafforded priority in fisheriesmanagement. It is the challengeof government, therefore,
22
to be able to control overexploitation at the national level but at the same time promotefurther development in certain pockets in the commercial fisheries.
To wrap up, this study argues that at this point in fisheries development, seriousfishing effort reduction must be done at the national level if our commercial marinefisheries resources are to last into the long future. However, the objective of effortreduction and sustainable development in fisheries must not be attained at the exorbitantprice of imposing iniquitous burden on poor segments of the population who were forcedby economic realities to hitch their lives on the fisheries sector.
7.3 Areas for Future Research
Finally, before ending, some caveats regarding the methods and resuks of thestudy have to be discussed. Firstly, it is clear that the results, e.g. exploitation levels andeconomic rents, generated here depend to a large extent on the price data assumed. Forinstance, a decrease in the assumed price of fish or an increase in the cost of effort maysubstantiallyreduce the value of the estimated economic rent, etc. In the study, the usedprices of fish and effort were considered the best estimate given data constraints.However, a future study using more accurate price data will be useful. Furthermore, astudy that will assume variable, instead of fixed prices, will be welcome.
Secondly, k must be emphasized that some of the annual data on catch and effortwere simply estimates. This again raises concern about the reliability of results. Sufficeit to say that another study can be conducted, if and when more accurate data can be hadfrom the institutional sources.
Thirdly, the GS and Fox models are partial models in that they only considereffort as the factor influencingcatch. Although in this study, learning and hence in a waytechnology, has been imputed as a factor, other diverse determinants offish catch wereexcluded, such as fishery regulations and seasonal bad weather, for instance. The extentby which these and other factors influence catch has not been investigated and should belooked into in future studies.
Finally, there is the need to study overfishing in terms of specific areas andspecies, especially the most commercially important and endangered ones. This studywill help identify areas and species whose exploitation need to be closely controlled orfurther developed.
23

REFERENCES
Bureau of Fisheries and Aquatic Resources (1991). "1990 Philippine Fisheries Profile".
.(Various Years). "Fisheries Statistics of the Philippines". QuezonCity, Philippines.
Bureau of Agricultural Research (1991). "National Fisheries Research Program".Department ofAgriculture, Diliman, Quezon City.
Bureau of Agricultural Statistics (Various Years). "Fishery Statistics". Quezon City,Philippines.
(Various Years). "Commercial Fishery Production Statistics".Quezon City, Philippines.
(Various Years). "Selected Fishery Statistics". Quezon City,Philippines.
Cunningham, S., M.K Duma and D. Whitmarsh (1985). Fisheries Economics: An_, London:Mansell Publishing Lt&, 372p.
Dalzell, P., P. Corpuz, R. Ganaden and D. Pauly (1987). "EStimation of SustainableYield and Maximum Economic Rent from the Philippine Small PelagicFisheries," ICLARM Technical Paper Series, Vol. 10, Number 3, 23p.
Fox, W.J. (1970). "An Exponential Surplus-Yield Model for Optimizing Exploited FishPopulations," Transactions of the American Fisheries Society, Florida, Vol. 99,Number 1, January, pp, 80-88.
Gordon, H. (1953). "The Economic Theory of Common Property Resource: TheFishery," Journal of' Political Economy, Vol. 62, pp. 124-142.
Guerrero, R. C. III (1989). "Our Marine Fisheries Resources: Their Depletion andManagement". Paper Presented at the Regional Seminar on Productive andStable Ecosystems, Philippine National Science Society, December 1-2, 1988,Los Bafios, Laguna.
Israel, D. C. and C. P. Banzon (1996). "Overfishingin the Philippine Marine FisheriesSector: A Disaggregated Analysis. Economy and Environment Program forSoutheast Asia. Final Report. 135 p.
Karim, M. N. A. (1985). "Energy Expenditure of a Group of Students at UniversitiPertanian Malaysia. _8(1). pp. 155-157.
24
National Statistics Coordination Board (Various Years). "Philippine StatisticalYearbook".
Padiila, J.E. and F. De Guzman (1994). "Fishery Resources Accounting in thePhilippines: Applications to the Small Pelagic Fisheries," In PhilippineEnvironmental and Na_aralResources AccountingProject:Phase 1I, 26p., QuezonCity.
Panayotou, T. F. (1995). "Economic Instruments for Environmental Management andSustainable Development". Final Report. International Environment Program,Harvard Institute for International Development, Harvard University, Cambridge,Massachusetts, 45 p.
Panayotou, T.F. and S. Jetanavanich (1987). "The Economics and Management of ThaiMarine Fisheries," ICLARM Studies and Reviews 14, Manila, 82p.
Pauly, D. (1987). "Theory and Practice of Overfishing: A Southeast Asian Perspective,"In FAO, IPFC, February 1987, pp. 146-163.
Pearse, P. H. (1991). "Building on Progress: Fisheries Policy Development in NewZealand". A Report Prepared for the Ministry of Fisheries, Wellington, NewZealand, 28 p.
Schaefer, MB. (1954). "Some Aspects of the Dynamics of Populations Important to theManagement of the Commercial Marine Fisheries," Inter Amer TropL Tuna.C,.9.mm.d3a_1 (2), pp. 27-56.
(1957). "Some Considerations of Population Dynamics andEconomics in Relation to the Management of Commercial Marine Fisheries,",loornal of Fisheries Research Board of Canada, Canada, 14 (5), pp. 669-681.
Schatz, Richard (1991). "Economic Rent Study for the Philippine Fisheries SectorProgram," Final Report.
Silvestre, G. R. and D. Pauly (1987) "Estimate of Yield and Economic Rent fromPhilippine Demersal Stocks (1946-1984) Using Vessel Horsepower as an Indexof Fishing Effort", ICLARM Technical Contribution, Number 418, pp. 11-24.
Silvestre, G. R., R. Federizon, J. Munoz and D. Pauly (1987). "Overexploitation of theDemersal Resources of ManilaBay and Adjacent Areas". IFPC/FAO Symposium
Paper, Darwin, Australia.
Trinidad, A.C., R.S: Pomeroy, P.V. Cruz and M. Aquero (1993) "Bioeconomics of thePhilippine Small Pelagics Fishery," ICLARM Technical Report # 38, 74p.,Makati, Metro Manila.
25