overall effectiveness of a blade endwall with jet...
TRANSCRIPT

Amy Mensche-mail: [email protected]
Karen A. Tholee-mail: [email protected]
Department of Mechanical and
Nuclear Engineering,
The Pennsylvania State University,
137 Reber Building,
University Park, PA 16802
Overall Effectiveness of a BladeEndwall With Jet Impingementand Film CoolingEver-increasing thermal loads on gas turbine components require improved coolingschemes to extend component life. Engine designers often rely on multiple thermal pro-tection techniques, including internal cooling and external film cooling. A conjugate heattransfer model for the endwall of a seven-blade cascade was developed to examine theimpact of both convective cooling and solid conduction through the endwall. Appropriateparameters were scaled to ensure engine-relevant temperatures were reported. Externalfilm cooling and internal jet impingement cooling were tested separately and together fortheir combined effects. Experiments with only film cooling showed high effectivenessaround film-cooling holes due to convective cooling within the holes. Internal impinge-ment cooling provided more uniform effectiveness than film cooling, and impingementeffectiveness improved markedly with increasing blowing ratio. Combining internalimpingement and external film cooling produced overall effectiveness values as high as0.4. A simplified, one-dimensional heat transfer analysis was used to develop a predictionof the combined overall effectiveness using results from impingement only and film cool-ing only cases. The analysis resulted in relatively good predictions, which served to rein-force the consistency of the experimental data. [DOI: 10.1115/1.4025835]
Introduction
Advances in gas turbine technology for both power generationand aircraft propulsion are focused on increasing efficiency aswell as maintaining or extending part service life. Even with cur-rent designs, gas temperatures at the inlet to the turbine oftenexceed allowable material temperatures, and internal cooling andexternal film cooling are used extensively to cool turbine walls.Thermal degradation of turbine parts has the potential to causemajor engine problems, giving rise to costly repairs and down-time. Improved gas turbine efficiency will lead to even higherthermal loads on the turbine. The ability to evaluate coolingschemes accurately with regard to meaningful performance met-rics is crucial.
Ultimately, the parameter of interest is the predicted metaltemperature of the airfoils and associated surfaces. The nondi-mensional, scaled metal temperature commonly used is theoverall effectiveness, /. Many studies report a distinctly dif-ferent quantity known as the adiabatic effectiveness, g, repre-senting the scaled adiabatic wall temperature, which does notaccount for internal cooling or heat conduction. Typically, /is determined through numerical simulation of the solid con-duction using imposed boundary conditions of the parameters:g and the internal and external heat transfer coefficients (hi
and h1). Alternatively, / can be measured directly providedthe proper experimental scaling, and the metal temperaturecan be predicted directly.
As will be discussed in the following sections, morerecent studies have reported conjugate heat transfer effectsand provided the scaled metal temperature. None of thesepapers, however, have reported conjugate heat transfer resultsfor an endwall surface. Turbine endwall heat transfer isknown to be greatly influenced by secondary flow effects;thus, measurements of conjugate heat transfer for a film-cooled endwall with internal impingement cooling are of sig-nificant value.
Relevant Literature
Conjugate heat transfer models to determine the overall effec-tiveness (/) have been applied to various geometries, includingflat plates, leading edge models, and vane models. The conjugateeffects of conduction and film cooling for a flat plate were exam-ined in a computational study by Bohn et al. [1]. Bohn et al. com-pared adiabatic and overall effectiveness for a flat plate with onerow of 30 deg film-cooling holes. While g varied laterally acrossthe plate, / was relatively uniform. In a similar study, Na et al.[2] reported that laterally averaged / was significantly higher thanlaterally averaged g.
Sweeney and Rhodes [3] experimentally simulated a conjugatesurface by matching the engine Biot number, Bi, for a configura-tion including internal impingement jets and film cooling.Between the impingement plate and the wall were heat transferenhancement features in a Lamilloy
VR
snowflake design. Theirresults showed that impingement cooling dominated over filmcooling in the influence on overall effectiveness. The overalleffectiveness distribution was smooth when impingement jetswere tightly spaced, but nonuniformities were observed when thejet spacing became large. A recent study by Panda and Prasad [4]involved experimental and computational measurements of over-all effectiveness for a film-cooled plate with and without internalimpingement. The authors considered conduction through the wallbut did not report what parameter of their model was matched toan engine. Their results showed that the increase in overall effec-tiveness from adding internal impingement became more substan-tial as blowing ratio increased.
Leading edge and vane studies involving both film cooling andinternal impingement cooling also provide insight into conductingwall configurations. A series of experimental and computationalstudies incorporating impingement cooling and film cooling wereperformed by the same research group on a leading edge model[5–10]. The leading edge study by Albert et al. [5] showed that itwas essential to match Bi as well as the ratio of internal-to-exter-nal heat transfer coefficients to accurately measure overall effec-tiveness. Maikell et al. [6] measured / in the stagnation regionwith impingement and round film-cooling holes. They observedcontinuous streaks of high / around the rows of film-coolingholes as blowing ratio increased. Dobrowolski et al. [7] performedconjugate simulations corresponding to the Maikell et al. [6]
Contributed by the Heat Transfer Committee of ASME for publication in theJOURNAL OF ENGINEERING FOR GAS TURBINES AND POWER. Manuscript received August29, 2013; final manuscript received October 22, 2013; published online November14, 2013. Editor: David Wisler.
Journal of Engineering for Gas Turbines and Power MARCH 2014, Vol. 136 / 031901-1Copyright VC 2014 by ASME
Downloaded From: http://gasturbinespower.asmedigitalcollection.asme.org/ on 09/22/2015 Terms of Use: http://www.asme.org/about-asme/terms-of-use

experiments. The effect of impingement was applied by settingthe internal wall temperature distribution to the temperature meas-ured in the experiments. The same leading edge model withshaped film-cooling holes and impingement was considered byMouzon et al. [8] and Ravelli et al. [9]. Their results showed that thepresence of impingement (H/D� 5) did not have much effect on /because in-hole convection dominated heat transfer in the stagnationregion. Terrell et al. [10] examined the in-hole convection in moredetail. Their experimental and computational study measured thetotal heat transfer to the coolant as it passed through shaped holes inthe stagnation region. The heating of the coolant was found to be sig-nificant and needed to be accounted for in their analyses.
Experimental work of a conducting vane was pioneered byHylton et al. [11,12] and Turner et al. [13] using a C3X vane.Although engine relevance was limited because matched Bi andh1/hi were not confirmed, these studies improved understandingof the thermal fields of a conducting vane and provided experi-mental data for benchmarking computational work. In a series ofstudies [14–18], multiple authors examined different areas of aC3X vane constructed to match engine Bi. Nathan et al. [14]measured / on the stagnation region of the vane, which wascooled internally with impingement and externally with a shower-head arrangement of cooling holes. On the vane pressure side,Albert and Bogard [15] found that / decreased with increasingblowing ratio due to jet detachment. Dees et al. [16] and Ledezmaet al. [17] examined / on the vane suction side experimentallyand computationally, respectively. Internal cooling was providedby a u-bend passage inside the vane that fed film-cooling holes.Impingement cooling was added to the suction side of the vane inWilliams et al. [18]. In addition to measuring /, the authors triedto analytically predict /. They measured g on an adiabatic vaneand the overall effectiveness with impingement only by blockingsome film-cooling holes in the suction side row. The unblockedfilm-cooling holes provided a path for the impingement jets toexhaust. The prediction performed reasonably well for a range ofmomentum flux ratios.
Although much attention has been paid to conjugate simula-tions for internally and externally cooled vanes, no studies havebeen done that consider the endwall surface. Part of the unique-ness of endwall heat transfer is the presence of secondary passageflows based on endwall flow models, such as that of Langston [19].The passage vortices that develop along the endwall skew the direc-tion of endwall flow and locally increase the external heat transfercoefficient. What distinguishes this work from previous studies is thepresentation of experimental data for a conjugate endwall with prop-erly scaled conditions, as discussed in the next section.
Conjugate Endwall Surface
To achieve relevant experimental data for overall effectiveness,a conjugate surface with appropriate nondimensionless parametersmust be matched between the engine and the experimental model.Using such a model provides a scaled wall temperature measure-ment that best represents what would occur in the engine, consid-ering all of the convection and solid conduction heat transfer. Theexperimental endwall model in this study incorporates externalfilm cooling, wall conduction, and internal impingement jet cool-ing, thereby including the conjugate effects.
The nondimensional parameters influencing the heat transferare given in Eq. (1), which is derived from a one-dimensional con-sideration of the heat transfer from the external driving tempera-ture, expressed as Taw, to the internal coolant temperature at theplenum supplying the impingement cooling, Tc,internal [18].
/ ¼ T1�Tw
T1�Tc;internal
¼1�vgg
1þ Biþ h1=hiþ vgg (1)
Equation (1) demonstrates the importance of matching Bi and theratio of external to internal heat transfer coefficients. A correction
factor for g, vg, is defined in Eq. (2) to ensure that the normalizingtemperature difference matches that of /.
vg ¼T1�Tc;exit
T1�Tc;internal
(2)
The vg parameter represents the internal heating of the coolantfrom the supply plenum, at Tc,internal, through impingement andthe film-cooling hole, exiting at Tc,exit.
The nondimensional parameters matched for the endwall in thisstudy relative to those of a typical engine are given in Table 1.The external heat transfer coefficient, h1, is enhanced due to pas-sage secondary flows and has been previously reported for thiscascade by Lynch et al. [20]. Although Lynch et al. [20] measuredh1 without film cooling, film-cooling augmentation on the end-wall is assumed to be minor [21,22]. The internal heat transfercoefficient, hi, is enhanced with impingement jet cooling. To esti-mate the average hi, Nusselt number correlations in the literaturefor impingement cooling with and without crossflow [23,24] wereapplied. The range of h1/hi values had some variation with blow-ing ratio but stayed reasonably close to 1.0. A reasonable Bi rangewas achieved by scaling the endwall thickness and using Corian
VR
,a DuPont material, for the endwall.
Experimental Methods
Measurements of endwall overall effectiveness were obtainedfor a linear Pack-B blade cascade using the large-scale, low-speed,closed-loop wind tunnel depicted in Figs. 1(a) and 1(b). In this fa-cility, the flow was split into three flow paths. The top and bottomportions, with dark walls in Fig. 1(a), passed through chilled waterheat exchangers, while the middle portion passed through a heaterbank supplying the mainstream flow to the test section. Moredetails regarding the wind tunnel and flow conditioning elementscan be found in Ref. [20]. Mainstream temperatures were meas-ured by a five-thermocouple rake inserted 0.52Cax upstream of theblade leading edge at multiple locations across the cascade. Themainstream temperatures measured were averaged to find T1.The maximum variation from the average T1 for any locationwas 60.6 �C.
The secondary flow for the endwall coolant supply wasremoved from the top white channel of the wind tunnel and fur-ther cooled by an auxiliary heat exchanger as shown in Fig. 1(b).The auxiliary heat exchanger circulated a sub-0 �C glycol-watermixture from the auxiliary chiller. To prevent any ice formationon the heat exchanger fins, a desiccant drier was installedupstream of the heat exchanger. A laminar flow element (LFE)measured the total coolant flow rate before the lines split the cool-ant feed for three separate plenums, which are described in detaillater. The configuration shown in Figs. 1(a) and 1(b) provided amainstream-to-coolant temperature difference of about 40 �C,resulting in a density ratio (DR) of 1.15. Coolant temperature wasmeasured by two thermocouples: �8.7D below the impingementplate and �8.7D below the endwall when there was no impinge-ment plate. The two thermocouples agreed to within 63 �C orless.
The top view of the test section, shown in Fig. 2, contained aseven-blade, six-passage linear cascade based on the low-pressureturbine Pack-B airfoil, a generic geometry that has been used
Table 1 Conjugate endwall parameters
Model Typical engine
Mavg 0.6, 1.0, 2.0 1.0–2.0kw, W/m-K 0.99–1.06 22t, cm 1.27 0.20h1/hi 0.4–2.5 1.0Bi 0.3–0.7 0.27
031901-2 / Vol. 136, MARCH 2014 Transactions of the ASME
Downloaded From: http://gasturbinespower.asmedigitalcollection.asme.org/ on 09/22/2015 Terms of Use: http://www.asme.org/about-asme/terms-of-use

extensively in the literature [20,25–34]. The operating conditions,as listed in Table 2, include engine-matched Re and geometricspecifications. The inlet mainstream velocity, U1, was measuredby inserting a Pitot probe 0.52Cax upstream of each blade leading
edge. There was very little variation in U1 across the cascade, asthe standard deviation over the mean was less than 1%. The testsection inlet boundary layer parameters, also listed in Table 2,were measured previously by Lynch et al. [20]. Based on theupstream boundary layer measurements, at the blade inlet planed/S was 0.071 and the freestream turbulence was 4% [20].
To ensure uniformity and periodicity of the cascade, static pres-sure taps in the blade midspan were used to measure the pressuredistribution before all experiments. A typical set of pressure coef-ficient, Cp, data is plotted in Fig. 3 as a function of normalizedaxial distance for all the blades. The measured Cp agreed wellwith the inviscid computational fluid dynamics (CFD) prediction[20], confirming flow uniformity for all passages.
The endwall in this study was constructed with a geometricconfiguration and parameters of Bi and h1/hi relevant to enginedesign. The schematic in Fig. 4(a) shows the generic internal andexternal endwall cooling scheme used. Coolant flow is directedinto a stagnant plenum passing around a splash plate. The plenumfeeds an array of 28 staggered holes in an impingement plate,which feed ten angled film-cooling holes in the endwall. Thediameter, D, is the same for the film and impingement holes.Film-cooling holes are inclined at an angle of 30 deg relative tothe surface, corresponding to a hole length-to-diameter ratio, L/D,of 5.8. Figure 4(b) shows the locations of the impingement jetsand film holes. The film-cooling hole inlets are staggered betweenthe impingement jets. The film-cooling hole exits are oriented to
Fig. 1 Depiction of the (a) large-scale, low-speed wind tunnel, with a corner test section housing the Pack-B cascade, and (b)the coolant loop with auxiliary cooling capability and the inlet flow development section
Fig. 2 Schematic of the Pack-B linear blade cascade with bladeand passage numbering and top view of the conjugate endwall
Table 2 Flow conditions and blade geometry
Scale factor 8.6
Boundary layerParameters 2.85Cax
Upstream of blade 4 [20]Cax 0.218 mp/Cax 0.826S/Cax 2.50 d/S 0.061Inlet Re 1.22� 105 d*/S 0.0062Exit Re 1.98� 105 h/S 0.0046Inlet U1 10.5 m/s Boundary layer
shape factor1.34
Inlet, exit flow angles 35 deg, 60 degInlet, exit Ma 0.029, 0.047 u0/U 0.060 Fig. 3 Pack-B cascade static pressure distribution at the blade
midspan compared to a CFD prediction [20]
Journal of Engineering for Gas Turbines and Power MARCH 2014, Vol. 136 / 031901-3
Downloaded From: http://gasturbinespower.asmedigitalcollection.asme.org/ on 09/22/2015 Terms of Use: http://www.asme.org/about-asme/terms-of-use

align with endwall streaklines obtained using oil flow visualiza-tion [20]. The area outlined in black is used to calculate the area-averaged / presented in the results.
To study the effects of the internal and external cooling featuresseparately as well as together, the endwall was divided into threesections of two passages. Each section was fed independently by aseparate plenum and incorporated a different cooling arrange-ment. The center passages, 3 and 4 (see Fig. 2), contained both in-ternal impingement cooling and external film cooling. Passages 1and 2 had a static plenum and film cooling and no impingementplate. Passages 5 and 6 had impingement cooling only, whichimposed crossflow. Instead of exhausting the coolant throughfilm-cooling holes, the coolant flowed out of the channel in thepitchwise (y) direction from a slot above passage 6. The dark areaof the endwall in Fig. 2 represents the endwall constructed ofCorian
VR
material, and the light area represents the rest of the end-wall constructed of medium density fiberboard.
Measurement Methods and Uncertainty
The primary measurements in each experiment are the coolantflow rate used to calculate blowing ratio, the coolant and main-stream temperatures, and the endwall temperatures. As mentionedpreviously, the total coolant flow rate fed to each plenum is meas-ured with an LFE. For experiments using film cooling, the flowrate is adjusted to achieve the desired film-cooling blowing ratio.Blowing ratios reported in this paper reflect the average blowingratio of all ten film-cooling holes, hence the use of Mavg. The localblowing ratio for each film-cooling hole, Mloc, is calculated byconsidering the static exit pressure of each film-cooling hole,
measured using pressure taps installed in passage 6. For the caseswith only impingement cooling, the mass flow rate of coolant ismatched to the total mass flow rate corresponding to the threeMavg values from film cooling. For a 95% confidence interval, theuncertainty in coolant flow rate is estimated to be 63% using thesequential perturbation method described in Moffat [35].
For film-cooled experiments, the pressure drop can be used tocalculate the average discharge coefficient, Cd, of the film-coolingholes or the impingement plate plus film holes. Figure 5 shows themeasured values of Cd, plotted in filled symbols, as a function ofthe average pressure ratio, where Ptot,c is the plenum pressureupstream of the impingement plate and Ploc,1 is the local staticexit pressure of the hole. The results for film cooling only (filledsquares) agree with previous data for 30 deg inclined holes at lowpressure ratios (open squares) [36,37]. The effective Cd for theimpingement plate and the film holes (filled circles) is slightlylower than film cooling only, as expected for an additional flowrestriction.
Steady-state infrared (IR) thermography was used to measuresurface temperatures on the endwall. To maximize the spatialmeasurement resolution and take advantage of the scaled-up ge-ometry, a FLIR P20 IR camera was used to measure endwall sur-face temperatures. The ceiling of the test section contained 16removable viewing ports distributed across five blade passages toallow direct optical access for the IR camera. At each viewinglocation, the IR camera was placed perpendicular to the endwallsurface at a distance of approximately 56 cm to acquire images.With a camera field of view angle of 25 deg and a camera resolu-tion of 320� 240 pixels, the resulting image resolution was 1.3pixels/mm, which equates to 5.7 pixels/D. Thermocouples wereplaced in discrete locations on the endwall surface, arranged sothat at least two thermocouples were captured in each image.When the thermocouples indicated that steady-state was achieved,five IR images were acquired at each port location. At each loca-tion, the images were calibrated for emissivity and reflected tem-perature by minimizing the difference between the thermocouplereadings and the image temperatures. The emissivity was typically0.92 because all endwall surfaces were painted with flat blackpaint. After calibration, the five images were averaged andexported to an in-house MATLAB program, which assembled theaveraged images from each location. Once a complete endwalltemperature map was obtained, the data were reduced to /.
The partial derivative method [35] was used to determine theuncertainty in /. The largest source of uncertainty comes from thecalibration of the IR images that provide Tw. The bias error of Tw
was estimated to be, at most, 0.8 �C from the difference of the IR
Fig. 4 Schematic of internal and external cooling scheme fromthe side view (a) and the top view (b)
Fig. 5 Discharge coefficient measured as a function of pres-sure ratio compared to Refs. [36] and [37]
031901-4 / Vol. 136, MARCH 2014 Transactions of the ASME
Downloaded From: http://gasturbinespower.asmedigitalcollection.asme.org/ on 09/22/2015 Terms of Use: http://www.asme.org/about-asme/terms-of-use

image temperatures from the thermocouples. The precision errorof Tw was estimated to be 0.3 �C from the standard deviation ofthe five images. Using a confidence interval of 95%, the totaluncertainty in measurement of / was estimated to be 60.02.
Results and Discussion
Overall effectiveness was measured for the three coolingarrangements at three different blowing ratios: Mavg¼ 0.6, 1.0,and 2.0 as listed in Table 3. The momentum flux ratio, Iavg, andthe associated h1/hi are also shown. As mentioned previously, h1was measured and reported by Lynch et al. [20] and hi was esti-mated from correlations [23,24]. In the second column of Table 3,the nondimensional temperature that was measured for each cool-ing arrangement is defined. The definitions in Table 3 are impor-tant to note for the analyses that will be described later in thepaper. The differences in overall effectiveness occur in the nota-
tion of the coolant temperature: Tc,inlet for film cooling only versusTc,internal for the cases with impingement cooling. The locations ofthese temperatures are shown in Fig. 6. Tc,internal is the coolanttemperature upstream of the impingement plate. Tc,inlet is coolanttemperature at the inlet of the film-cooling hole. For the case withno impingement plate, Tc,inlet is approximately equal to the stag-nant coolant temperature.
Film-Cooling Only Results. The overall effectiveness con-tours for film cooling only, /f, are presented in Figs. 7(a)–7(c).The film-cooling holes and plenum boundaries are shown for ref-erence. Although there is near-stagnant air below the endwall,conduction caused /f to be above zero along the pressure side ofthe passage. In-hole conduction effects are apparent from theincreased /f upstream of the film-cooling hole exits. Also, there isevidence of cross passage flow sweeping film coolant to the suc-tion side of the passage in all cases. From the contours, the film-cooling jets appear lifted off the surface for Mavg¼ 1.0 and 2.0,while most of the jets remain attached to the endwall forMavg¼ 0.6. Laterally averaged /f for film cooling only is plottedas a function of axial distance in Fig. 7(d). The �/f is almost thesame for Mavg¼ 0.6 and 1.0. There is a peak around x/Cax¼ 0.15,coinciding with the first row of film-cooling holes, and a dropoffafter x/Cax> 0.55 near the last film-cooling hole. Local increasesare apparent for Mavg¼ 2.0 at the first row of holes, as well as inthe downstream parts of the passage, after x/Cax> 0.3.
Impingement Cooling Only Results. For impingement cool-ing only, the /o contours with impingement hole locations areshown in Figs. 8(a)–8(c). Figure 8(a) specifies direction of coolantexiting the impingement channel under the endwall for the case ofimpingement only. Compared to film cooling at the same flowrate, the peak values of /o are lower than /f, but the distributionof /o is more uniform than /f. The influence of the external pas-sage flow can be observed in higher effectiveness near the bladesuction side compared to the blade pressure side. As hot externalflow travels across the middle of the passage, the cooler endwallreduces the temperature of the flow. The cooler passage flowcarries less heat to the downstream suction side of thepassage, resulting in cooler wall temperatures. Laterally averaged/o is plotted as a function of axial distance in Fig. 8(d). The high-est values of /o occur in the middle part of the passage anddecrease after x/Cax> 0.5, near the last row of impingement jets.In contrast to �/f ,
�/o increases with blowing ratio due tothe corresponding increase in impingement jet flow rate andinternal heat transfer. Average impingement Nusselt numbers
Table 3 Experimental test matrix
Cooling arrangement Measurement Mavg Iavg h1/hi
Film cooling /f ¼T1�Tw;f
T1�Tc;inlet
2.0 3.5 N/A1.0 0.90.6 0.3
Impingement /o ¼T1�Tw;o
T1�Tc;internal
2.0 3.5 0.4–1.01.0 0.9 0.6–1.40.6 0.3 1.0–2.2
Film and impingement / ¼ T1�Tw
T1�Tc;internal
2.0 3.5 0.5–1.01.0 0.9 0.7–1.60.6 0.3 1.1–2.5
Fig. 6 Coolant and wall temperatures of the conjugate wallwith film and impingement cooling
Fig. 7 Contours of /f for blowing ratios: (a) Mavg 5 0.6, (b) Mavg 5 1.0, (c) Mavg 5 2.0, with 30 deg inclined holes and ple-num boundaries overlaid, and (d) pitchwise, laterally averaged /f plotted as a function of axial distance
Journal of Engineering for Gas Turbines and Power MARCH 2014, Vol. 136 / 031901-5
Downloaded From: http://gasturbinespower.asmedigitalcollection.asme.org/ on 09/22/2015 Terms of Use: http://www.asme.org/about-asme/terms-of-use

estimated from literature correlations [24] are listed in thelegend in Fig. 8(d). A similar trend for impingement coolingonly was noted for the vane in Williams et al. [18].
Film and Impingement Cooling Results. Overall effective-ness for internal impingement and film cooling, /, was measuredin passages 3 and 4 in the same experiment. The contours are pre-sented in Figs. 9(a)–9(c) with the impingement and film-coolinghole locations. Boundaries just below the blades are shown, whichprevented coolant from crossing from one passage to another inthe channel above the impingement plate. Although there is high/ throughout much of the passage, / varies significantly and isnot uniform. The primary effect of film cooling, conduction withinthe film-cooling holes, resulted in high / around film holes. Themost noticeable blowing ratio effect is at Mavg¼ 2, with increasedcooling particularly from convection in the holes.
Figure 9(d) shows laterally averaged / from passage 4 plottedas a function of axial distance. Similar to film cooling only, thereis a peak at x/Cax¼ 0.15 around the first row of film holes and adecrease in / after x/Cax> 0.55. The influence of impingement
can be observed in the increase of �/ with blowing ratio. Figure9(d) also shows a repeat experiment performed for film andimpingement at Mavg¼ 1.0. Good agreement between the twoexperiments for Mavg¼ 1.0 as well as both passages in Figs.9(a)–9(c) supports the repeatability and reproducibility of theresults.
Comparison of Individual and Combined Cooling Effects.The data presented in Figs. 7–9 are summarized in Fig. 10, inwhich area-averaged overall effectiveness is presented as a func-tion of Mavg. Area-averaged / for film and impingement increasesfrom about 0.3 to 0.4 with an increase in Mavg from 0.6 to 2.0.Consistent with the laterally averaged data, an increase in blowingratio improves area-averaged ��/o more than ��/f . Figure 10 alsohighlights the improved cooling that results from addingimpingement. From this perspective, the increase of ��/ from ��/f islarger for higher blowing ratios. In other words, ��/ increases fasterthan ��/f . This trend was also observed for a flat plate in Panda andPrasad [4]. Alternatively, the effect of adding film cooling to an
Fig. 8 Contours of /o for blowing ratios: (a) Mavg 5 0.6, (b) Mavg 5 1.0, (c) Mavg 5 2.0, with 90 degimpingement holes and plenum boundaries overlaid, and (d) pitchwise, laterally averaged /o plotted asa function of axial distance
Fig. 9 Contours of / for blowing ratios: (a) Mavg 5 0.6, (b) Mavg 5 1.0, (c) Mavg 5 2.0, with 30 deg inclinedfilm holes, 90 deg impingement holes, and plenum boundaries overlaid, and (d) pitchwise, laterally aver-aged / plotted as a function of axial distance
031901-6 / Vol. 136, MARCH 2014 Transactions of the ASME
Downloaded From: http://gasturbinespower.asmedigitalcollection.asme.org/ on 09/22/2015 Terms of Use: http://www.asme.org/about-asme/terms-of-use

impingement-cooled plate indicates a smaller benefit, especiallyfor Mavg¼ 2.0.
The laterally averaged effectiveness at Mavg¼ 1.0 for film cool-ing only, impingement only, and film and impingement are plottedtogether in Fig. 11. Laterally averaged / for the combined coolingscheme is higher than �/f or �/o from x/Cax¼ 0.05 around the inletsof the film-cooling holes to x/Cax¼ 0.35 just before the last row ofimpingement holes. However, �/o is not much lower than �/,indicating that the effectiveness is dominated by impingementcooling. Upstream and downstream, x/Cax< 0.05 and> 0.45, �/o
is higher than �/. This unexpected result for impingement onlyoccurs because, after impingement, coolant flows away from themiddle of the passage and convectively cools the internal wall inthe region x/Cax< 0.05 and> 0.45. With combined film andimpingement, the coolant is instead directed into the film-coolingholes.
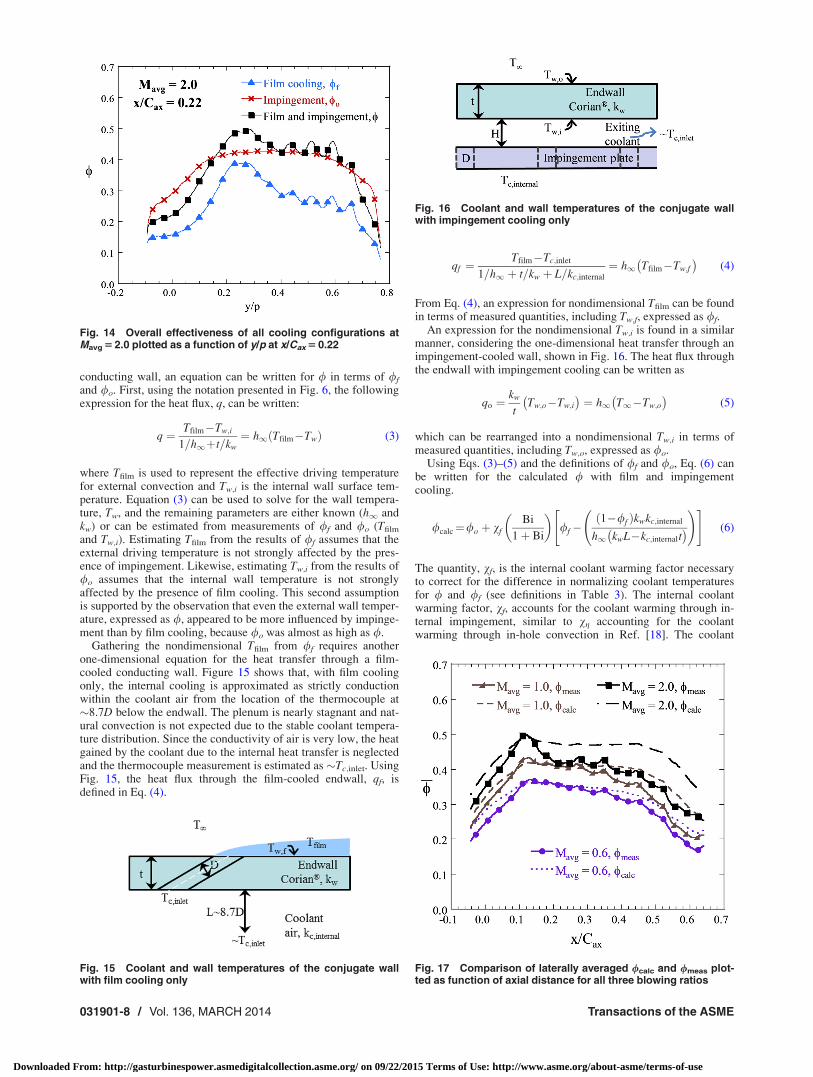
Just downstream of the first row of film-cooling holes, at axialdistance x/Cax¼ 0.22, / is plotted across the passage as a functionof normalized distance, y/p, in Figs. 12–14. Peaks and valleys due
to the film-cooling jets can be seen in the cases with film cooling.For impingement cooling, /o has a relatively flat distribution fromy/p¼ 0.2 to 0.55, corresponding to the impingement jet locations.For film cooling, there is a peak in /f and / around y/p¼ 0.25,corresponding to one of the film-cooling holes in the diagonalrow. The drop after this peak, especially for Mavg¼ 2.0, is attrib-uted to detachment of the film-cooling jets from the vertical rowof holes. Figures 12–14 also show that /o is closest to /f atMavg¼ 0.6, but /o becomes closest to / at Mavg¼ 2.0.
Calculation of Combined Effectiveness Based on
Individual Cooling Features
Noting the apparent influence of film cooling and impingementon the combined overall effectiveness, an analysis was performedthat uses the measured values of /f and /o to calculate the com-bined film cooling and impingement effectiveness, /. Comparingthe results of such an analysis to measured / confirms the consis-tency of the data acquired in the different sections of the cascade.Applying a one-dimensional analysis and reasonable assumptionsto the heat transfer of the combined film and impingement-cooled
Fig. 11 Pitchwise, laterally averaged / plotted as a function ofaxial distance for the three cooling configurations at Mavg 5 1.0
Fig. 12 Overall effectiveness of all cooling configurations atMavg 5 0.6 plotted as a function of y/p at x/Cax 5 0.22
Fig. 13 Overall effectiveness of all cooling configurations atMavg 5 1.0 plotted as a function of y/p at x/Cax 5 0.22
Fig. 10 Area-averaged / (using area outlined in Fig. 4) plottedas a function of blowing ratio for all three coolingconfigurations
Journal of Engineering for Gas Turbines and Power MARCH 2014, Vol. 136 / 031901-7
Downloaded From: http://gasturbinespower.asmedigitalcollection.asme.org/ on 09/22/2015 Terms of Use: http://www.asme.org/about-asme/terms-of-use
conducting wall, an equation can be written for / in terms of /f
and /o. First, using the notation presented in Fig. 6, the followingexpression for the heat flux, q, can be written:
q ¼ Tfilm�Tw;i
1=h1þt=kw¼ h1 Tfilm�Twð Þ (3)
where Tfilm is used to represent the effective driving temperaturefor external convection and Tw,i is the internal wall surface tem-perature. Equation (3) can be used to solve for the wall tempera-ture, Tw, and the remaining parameters are either known (h1 andkw) or can be estimated from measurements of /f and /o (Tfilm
and Tw,i). Estimating Tfilm from the results of /f assumes that theexternal driving temperature is not strongly affected by the pres-ence of impingement. Likewise, estimating Tw,i from the results of/o assumes that the internal wall temperature is not stronglyaffected by the presence of film cooling. This second assumptionis supported by the observation that even the external wall temper-ature, expressed as /, appeared to be more influenced by impinge-ment than by film cooling, because /o was almost as high as /.
Gathering the nondimensional Tfilm from /f requires anotherone-dimensional equation for the heat transfer through a film-cooled conducting wall. Figure 15 shows that, with film coolingonly, the internal cooling is approximated as strictly conductionwithin the coolant air from the location of the thermocouple at�8.7D below the endwall. The plenum is nearly stagnant and nat-ural convection is not expected due to the stable coolant tempera-ture distribution. Since the conductivity of air is very low, the heatgained by the coolant due to the internal heat transfer is neglectedand the thermocouple measurement is estimated as �Tc,inlet. UsingFig. 15, the heat flux through the film-cooled endwall, qf, isdefined in Eq. (4).
qf ¼Tfilm�Tc;inlet
1=h1 þ t=kw þ L=kc;internal
¼ h1 Tfilm�Tw;f
� �(4)
From Eq. (4), an expression for nondimensional Tfilm can be foundin terms of measured quantities, including Tw,f, expressed as /f.
An expression for the nondimensional Tw,i is found in a similarmanner, considering the one-dimensional heat transfer through animpingement-cooled wall, shown in Fig. 16. The heat flux throughthe endwall with impingement cooling can be written as
qo ¼kw
tTw;o�Tw;i
� �¼ h1 T1�Tw;o
� �(5)
which can be rearranged into a nondimensional Tw,i in terms ofmeasured quantities, including Tw,o, expressed as /o.
Using Eqs. (3)–(5) and the definitions of /f and /o, Eq. (6) canbe written for the calculated / with film and impingementcooling.
/calc¼/o þ vf
Bi
1þ Bi
� �/f�
ð1�/f Þkwkc;internal
h1 kwL�kc;internalt� �
!" #(6)
The quantity, vf, is the internal coolant warming factor necessaryto correct for the difference in normalizing coolant temperaturesfor / and /f (see definitions in Table 3). The internal coolantwarming factor, vf, accounts for the coolant warming through in-ternal impingement, similar to vg accounting for the coolantwarming through in-hole convection in Ref. [18]. The coolant
Fig. 15 Coolant and wall temperatures of the conjugate wallwith film cooling only
Fig. 16 Coolant and wall temperatures of the conjugate wallwith impingement cooling only
Fig. 17 Comparison of laterally averaged /calc and /meas plot-ted as function of axial distance for all three blowing ratios
Fig. 14 Overall effectiveness of all cooling configurations atMavg 5 2.0 plotted as a function of y/p at x/Cax 5 0.22
031901-8 / Vol. 136, MARCH 2014 Transactions of the ASME
Downloaded From: http://gasturbinespower.asmedigitalcollection.asme.org/ on 09/22/2015 Terms of Use: http://www.asme.org/about-asme/terms-of-use

temperature increase due to impingement, between the plenum atTc,internal and the inlet to the film-cooling hole at Tc,inlet, can beestimated from a total energy balance on the case of impingementonly. Assuming the heat gained by the coolant comes from theendwall only, Tc,inlet can be estimated as the temperature of thecoolant exiting the impingement channel in Fig. 16, leading toEq. (7).
vf ¼T1�Tc;inlet
T1�Tc;internal
¼ 1�P
qoA
_mccp T1�Tc;internal
� � (7)
The values of vf were 0.75 for Mavg¼ 0.6, 0.82 for Mavg¼ 1.0,and 0.88 for Mavg¼ 2.0.
When Eq. (6) is applied, the laterally averaged /calc (acrossthe area outlined in Fig. 4) are calculated for the combinedfilm-cooling and impingement-cooling cases and plotted inFig. 17. The calculated values agree very well with thosemeasured at Mavg¼ 0.6. Although agreement for all blowingratios is relatively good in the upstream parts of the passage,more deviation occurs downstream as blowing ratio increases.The overpredictions downstream are probably an effect ofhigher measured effectiveness for impingement only than forfilm and impingement after x/Cax> 0.45, seen in Fig. 11. Thiswas attributed to differences in the impingement flow withand without film cooling present. With impingement only, theimpingement jets are exhausted laterally, as shown in Fig.8(a), and the resulting channel flow cools the downstream in-ternal wall more than when the coolant is directed into thefilm-cooling holes. Additional sources of deviation arise fromthe assumptions made in the analyses, including using thesame h1 for cases with and without film cooling and assum-ing the coolant air below the film-cooling only endwall wasstagnant. The literature has shown that external heat transfercoefficient can increase with the addition of film cooling, andthis effect increases with blowing ratio [21,22]. An underesti-mated h1 would result in a higher /calc, consistent with theresults of the calculation in Fig. 17.
Overall, the favorable comparison between the individual cool-ing features and the overall impingement plus film cooling is wellpredicted. These results provide insights as to the contribution ofeach for a conjugate endwall.
Conclusions
Overall effectiveness data were presented for an endwall withexternal film cooling and internal impingement jet cooling. Thesetwo cooling mechanisms were examined separately and togetherat three different film-cooling blowing ratios.
The results indicated that, with film cooling alone, higher effec-tiveness values were measured near the film-cooling holes due toconvection within the holes. Increasing blowing ratio increasedthe cooling effectiveness near the hole exits but did not signifi-cantly improve effectiveness elsewhere in the passage, given thejets separated from the surface. Alternatively, impingement cool-ing showed clear improvement with increasing coolant flow rates.In addition, the effectiveness distribution for impingement coolingwas very uniform.
Combining internal and external cooling produced higheroverall effectiveness compared to impingement cooling or filmcooling alone. The passages cooled with impingement andfilm cooling showed high effectiveness near the holes andincreasing effectiveness with blowing ratio. Effectivenessresults from film cooling alone and impingement coolingalone were used to calculate the effectiveness of the com-bined cooling scheme. The calculations compared reasonablywell to the measured data using a simple one-dimensionalheat transfer analysis. The agreement was best for Mavg¼ 0.6and 1.0. As the blowing ratio increased, the increasing influ-ence of internal impingement on overall effectiveness caused
more deviations from the analyses due to impingement flowdifferences.
The current study demonstrates the conjugate methodologyand overall trends for a generic impingement and film-cooledendwall, regardless of the specific airfoil geometry. Theseresults demonstrate the importance of testing internal andexternal cooling schemes together to capture conjugate effects.There were differences in impingement-cooling and film-cooling behavior when the two were combined. Measurementsof conjugate heat transfer on an endwall fill a gap in overalleffectiveness data for gas turbine endwalls. This study alsoprovides a valuable data set to benchmark future conjugatesimulations.
Acknowledgment
The authors would like to acknowledge support from the U.S.Department of Energy (DOE), National Energy Technology Labo-ratory (NETL) through the University Turbine Systems Researchprogram. Any opinions, findings, conclusions, or recommenda-tions expressed herein are solely those of the authors and do notnecessarily reflect the views of the DOE. The writers would liketo thank Mark Zelesky of Pratt & Whitney, Dr. David Bogard ofthe University of Texas, and Robin Ames of DOE-NETL for theircontinued communication and support regarding this research.
Nomenclature
A ¼ areaBi ¼ Biot number (h1t/kw)
Cax ¼ axial chord lengthCd ¼ discharge coefficientcp ¼ specific heatCp ¼ pressure coefficientD ¼ hole diameter
DR ¼ density ratio (qc/q1)h ¼ convective heat transfer coefficientH ¼ gap heightI ¼ momentum flux ratio (qcUc
2/q1U12)
k ¼ thermal conductivityL ¼ length
M ¼ blowing ratio (qcUc/q1U1)_m ¼ mass flow rate
Ma ¼ Mach numberNu ¼ Nusselt number (hD/kfluid)
p ¼ pitch lengthP ¼ pressureq ¼ heat flux
Re ¼ Reynolds number (q1U1Cax/l1)S ¼ blade spant ¼ thickness
T ¼ temperatureU ¼ streamwise velocityu0 ¼ fluctuating velocity
x, y, z ¼ global coordinates, where x is blade axial direction
Greek Symbols
d ¼ boundary layer thicknessd* ¼ displacement thicknessg ¼ adiabatic effectiveness (T1�Taw)/(T1�Tc,exit)h ¼ momentum thicknessl ¼ dynamic viscosityq ¼ density/ ¼ overall effectiveness (T1�Tw)/(T1�Tc,internal)/f ¼ overall effectiveness with film cooling
(T1�Tw,f)/(T1�Tc,inlet)/o ¼ overall effectiveness with impingement
(T1�Tw,o)/(T1�Tc,internal)vf ¼ internal coolant warming factor for /f
(T1�Tc,inlet)/(T1�Tc,internal)
Journal of Engineering for Gas Turbines and Power MARCH 2014, Vol. 136 / 031901-9
Downloaded From: http://gasturbinespower.asmedigitalcollection.asme.org/ on 09/22/2015 Terms of Use: http://www.asme.org/about-asme/terms-of-use

vg ¼ internal coolant warming factor for g(T1�Tc,exit)/(T1�Tc,internal)
Subscripts, Accents
avg ¼ averageaw ¼ adiabatic wall surface
c,exit ¼ coolant at film-cooling hole exitc,inlet ¼ coolant at film-cooling hole inlet
c,internal ¼ coolant upstream of impingement platecalc ¼ calculated
i ¼ internalf ¼ film cooling only
film ¼ external driving temperature locationloc ¼ local
meas ¼ measuredo ¼ impingement cooling onlys ¼ static
tot ¼ totalw ¼ wall1¼ mainstream or externalðÞ ¼ laterally averaged
ðÞ ¼ area averaged
References
[1] Bohn, D., Ren, J., and Kusterer, K., 2003, “Conjugate Heat Transfer Analysisfor Film Cooling Configurations With Different Hole Geometries,” ASME Pa-per No. GT2003-38369.
[2] Na, S., Williams, B., Dennis, R. A., Bryden, K. M., and Shih, T. I.-P., 2007,“Internal and Film Cooling of a Flat Plate With Conjugate Heat Transfer,”ASME Paper No. GT2007-27599.
[3] Sweeney, P. C., and Rhodes, J. F., 2000, “An Infrared Technique for EvaluatingTurbine Airfoil Cooling Designs,” ASME J. Turbomach., 122(1), pp. 170–177.
[4] Panda, R. K., and Prasad, B. V. S. S. S., 2012, “Conjugate Heat Transfer Froma Flat Plate With Combined Impingement and Film Cooling,” ASME Paper No.GT2012-68830.
[5] Albert, J. E., Bogard, D. G., and Cunha, F., 2004, “Adiabatic and Overall Effec-tiveness for a Film Cooled Blade,” ASME Paper No. GT2004-53998.
[6] Maikell, J., Bogard, D., Piggush, J., and Kohli, A., 2011, “Experimental Simu-lation of a Film Cooled Turbine Blade Leading Edge Including Thermal BarrierCoating Effects,” ASME J. Turbomach., 133(1), p. 011014.
[7] Dobrowolski, L. D., Bogard, D. G., Piggush, J., and Kohli, A., 2009,“Numerical Simulation of a Simulated Film Cooled Turbine Blade LeadingEdge Including Conjugate Heat Transfer Effects,” ASME Paper No.IMECE2009-11670.
[8] Mouzon, B. D., Terrell, E. J., Albert, J. E., and Bogard, D. G., 2005, “Net HeatFlux Reduction and Overall Effectiveness for a Turbine Blade Leading Edge,”ASME Paper No. GT2005-69002.
[9] Ravelli, S., Dobrowolski, L., and Bogard, D. G., 2010, “Evaluating the Effectsof Internal Impingement Cooling on a Film Cooled Turbine Blade LeadingEdge,” ASME Paper No. GT2010-23002.
[10] Terrell, E. J., Mouzon, B. D., and Bogard, D. G., 2005, “Convective HeatTransfer Through Film Cooling Holes of a Gas Turbine Blade Leading Edge,”ASME Paper No. GT2005-69003.
[11] Hylton, L. D., Mihelc, M. S., Turner, E. R., Nealy, D. A., and York, R. E.,1983, “Analytical and Experimental Evaluation of the Heat Transfer Distribu-tion Over the Surfaces of Turbine Vanes,” Paper No. NASA-CR-168015.
[12] Hylton, L. D., Nirmalan, V., Sultanian, B. K., and Kauffman, R. M., 1988, “TheEffects of Leading Edge and Downstream Film Cooling on Turbine Vane HeatTransfer,” Paper No. NASA-CR-182133.
[13] Turner, E. R., Wilson, M. D., Hylton, L. D., and Kauffman, R. M., 1985,“Turbine Vane External Heat Transfer. Volume 1: Analytical and ExperimentalEvaluation of Surface Heat Transfer Distributions With Leading Edge Shower-head Film Cooling,” Paper No. NASA-CR-174827.
[14] Nathan, M. L., Dyson, T. E., Bogard, D. G., and Bradshaw, S. D., 2013,“Adiabatic and Overall Effectiveness for the Showerhead Film Cooling of aTurbine Vane,” ASME J. Turbomach., 136(3), p. 031005.
[15] Albert, J. E., and Bogard, D. G., 2013, “Measurements of Adiabatic Film andOverall Cooling Effectiveness on a Turbine Vane Pressure Side With aTrench,” ASME J. Turbomach., 135(5), p. 051007.
[16] Dees, J. E., Bogard, D. G., Ledezma, G. A., and Laskowski, G. M., 2013,“Overall and Adiabatic Effectiveness Values on a Scaled Up, Simulated GasTurbine Vane,” ASME J. Turbomach., 135(5), p. 051017.
[17] Ledezma, G. A., Laskowski, G. M., Dees, J. E., and Bogard, D. G., 2011,“Overall and Adiabatic Effectiveness Values on a Scaled Up Simulated GasTurbine Vane: Part II—Numerical Simulation,” ASME Paper No. GT2011-46616.
[18] Williams, R. P., Dyson, T. E., Bogard, D. G., and Bradshaw, S. D., 2013,“Sensitivity of the Overall Effectiveness to Film Cooling and Internal Cool-ing on a Turbine Vane Suction Side,” ASME J. Turbomach., 136(3), p.031006.
[19] Langston, L. S., 1980, “Crossflows in a Turbine Cascade Passage,” ASME J.Eng. Power, 102(4), pp. 866–874.
[20] Lynch, S. P., Sundaram, N., Thole, K. A., Kohli, A., and Lehane, C., 2011,“Heat Transfer for a Turbine Blade With Nonaxisymmetric Endwall Con-touring,” ASME J. Turbomach., 133(1), p. 011019.
[21] Eriksen, V. L., and Goldstein, R. J., 1974, “Heat Transfer and Film CoolingFollowing Injection Through Inclined Circular Tubes,” ASME J. Heat Transfer,96(2), pp. 239–245.
[22] Dees, J. E., Bogard, D. G., and Bunker, R. S., 2010, “Heat Transfer Augmenta-tion Downstream of Rows of Various Dimple Geometries on the Suction Sideof a Gas Turbine Airfoil,” ASME J. Turbomach., 132(3), p. 031010.
[23] Hollworth, B. R., and Dagan, L., 1980, “Arrays of Impinging Jets With SpentFluid Removal Through Vent Holes on the Target Surface—Part 1: AverageHeat Transfer,” ASME J. Eng. Power, 102(4), pp. 994–999.
[24] Florschuetz, L. W., Truman, C. R., and Metzger, D. E., 1981, “StreamwiseFlow and Heat Transfer Distributions for Jet Array Impingement With Cross-flow,” ASME J. Heat Transfer, 103(2), pp. 337–342.
[25] Praisner, T. J., Allen-Bradley, E., Grover, E. A., Knezevici, D. C., and Sjo-lander, S. A., 2007, “Application of Non-Axisymmetric Endwall Contouring toConventional and High-Lift Turbine Airfoils,” ASME Paper No. GT2007-27579.
[26] Knezevici, D. C., Sjolander, S. A., Praisner, T. J., Allen-Bradley, E., andGrover, E. A., 2010, “Measurements of Secondary Losses in a Turbine CascadeWith the Implementation of Nonaxisymmetric Endwall Contouring,” ASME J.Turbomach., 132(1), p. 011013.
[27] Praisner, T. J., Grover, E. A., Knezevici, D. C., Popovic, I., Sjolander, S. A.,Clark, J. P., and Sondergaard, R., 2008, “Toward the Expansion of Low-Pres-sure-Turbine Airfoil Design Space,” ASME Paper No. GT2008-50898.
[28] Lake, J., King, P., and Rivir, R., 1999, “Reduction of Separation Losses on aTurbine Blade With Low Reynolds Numbers,” AIAA Aerospace SciencesMeeting, Reno, NV, January 11–14, AIAA Paper No. 99-0242.
[29] Murawski, C. G., and Vafai, K., 2000, “An Experimental Investigation of theEffect of Freestream Turbulence on the Wake of a Separated Low-Pressure Tur-bine Blade at Low Reynolds Numbers,” ASME J. Fluids Eng., 122(2), pp.431–433.
[30] Mahallati, A., McAuliffe, B. R., Sjolander, S. A., and Praisner, T. J., 2007,“Aerodynamics of a Low-Pressure Turbine Airfoil at Low-Reynolds Numbers:Part 1—Steady Flow Measurements,” ASME Paper No. GT2007-27347.
[31] Zoric, T., Popovic, I., Sjolander, S. A., Praisner, T., and Grover, E., 2007,“Comparative Investigation of Three Highly Loaded LP Turbine Airfoils: PartI—Measured Profile and Secondary Losses at Design Incidence,” ASME PaperNo. GT2007-27537.
[32] Popovic, I., Zhu, J., Dai, W., Sjolander, S. A., Praisner, T., and Grover, E.,2006, “Aerodynamics of a Family of Three Highly Loaded Low-Pressure Tur-bine Airfoils: Measured Effects of Reynolds Number and Turbulence Intensityin Steady Flow,” ASME Paper No. GT2006-91271.
[33] Lynch, S. P., Thole, K. A., Kohli, A., and Lehane, C., 2011, “ComputationalPredictions of Heat Transfer and Film-Cooling for a Turbine Blade With Non-axisymmetric Endwall Contouring,” ASME J. Turbomach., 133(4), p. 041003.
[34] Lawson, S. A., Lynch, S. P., and Thole, K. A., 2013, “Simulations of Multi-phase Particle Deposition on a Nonaxisymmetric Contoured Endwall WithFilm-Cooling,” ASME J. Turbomach., 135(3), p. 031032.
[35] Moffat, R. J., 1988, “Describing the Uncertainties in Experimental Results,”Exp. Therm. Fluid Sci., 1(1), pp. 3–17.
[36] Burd, S. W., and Simon, T. W., 1999, “Measurements of Discharge Coefficientsin Film Cooling,” ASME J. Turbomach., 121(2), pp. 243–248.
[37] Barringer, M. D., Richard, O. T., Walter, J. P., Stitzel, S. M., and Thole, K. A.,2002, “Flow Field Simulations of a Gas Turbine Combustor,” ASME J. Tur-bomach., 124(3), pp. 508–516.
031901-10 / Vol. 136, MARCH 2014 Transactions of the ASME
Downloaded From: http://gasturbinespower.asmedigitalcollection.asme.org/ on 09/22/2015 Terms of Use: http://www.asme.org/about-asme/terms-of-use