over-seasons analysis of quantitative trait loci affecting...
TRANSCRIPT

1 Over-seasons Analysis of Quantitative Trait Loci Affecting Phenolic2 Content and Antioxidant Capacity in Raspberry3 Patricia Dobson,† Julie Graham,† D. Stewart,†,§ Rex Brennan,† Christine A. Hackett,#
4 and Gordon J. McDougall*,†
5†Enhancing Crop Productivity and Utilization Theme, The James Hutton Institute, Invergowrie, Dundee, Scotland DD2 5DA, U.K.
6§School of Life Sciences, Heriot Watt University, Edinburgh, Scotland EH14 4AS, U.K.
7#Biomathematics and Statistics Scotland, Invergowrie, Dundee, Scotland DD2 5DA, U.K.
8 *S Supporting Information
9 ABSTRACT: This study examined the total phenol content (TPC) and total anthocyanin content (TAC) in ripe fruit of10 progeny of a mapping population generated from a cross between the European red raspberry cv. Glen Moy (Rubus ideaus var.11 idaeus) and the North American red raspberry cv. Latham (Rubus ideaus var. strigosus) over five seasons in two different growing12 environments. Measurements of antioxidant capacity (FRAP and TEAC) were also carried out. TPC was highly correlated with13 TEAC and FRAP across the entire data set. The subset of anthocyanin content was genotype-dependent but also correlated with14 TPC, although the proportion of anthocyanin compounds varied between progeny. Quantitative trait locus (QTL) analysis was15 carried out, and key markers were tested for consistency of effects over sites and years. Four regions, on linkage groups 2, 3, 5,16 and 6, were identified. These agree with QTLs from a previous study over a single season and indicate that QTL effects were17 robust over seasons.
18 KEYWORDS: raspberry, progeny, polyphenols, anthocyanins, ellagitannins, antioxidants, inheritance, quantitative trait loci,19 environment
20 ■ INTRODUCTION21 Berry fruit cultivation in the United Kingdom has relied for22 many years on new cultivars offering improvements in yield,23 cropping season, and resistance to damaging pests and diseases.24 Although these characters remain important to the success of25 newly released cultivars, there has been a growing demand from26 growers, processors, and consumers for improvements in fruit27 quality attributes, to the point where these traits are now28 equally important for cultivars and, indeed, may even affect29 decisions regarding commercial release.1
30 Fruit quality covers a range of traits, including physical31 characters such as berry size, berry color, berry conformation32 (drupelet structure and cohesion), firmness, and shelf life in the33 case of fresh fruit. Traits associated with chemical composition,34 such as color, sweetness, sourness, and flavor intensity, and the35 levels of nutritionally important compounds are becoming36 increasingly important.37 A number of studies have been carried out in raspberry on38 quality aspects including a study of ripening,2 color,3 and39 anthocyanins.4 These studies have examined environmental and40 seasonal effects on these traits as well as identified associated41 quantitative trait loci (QTLs), and, in some cases, candidate42 genes for their control have been hypothesized.43 Berries are among the richest sources of polyphenols in44 commonly eaten fruits5 and also provide a diverse range of45 polyphenols including flavonoids (such as anthocyanins,46 flavanols, and flavonols), condensed and hydrolyzable tannins,47 and phenolic acid derivatives.6 In raspberries, the major48 polyphenols are anthocyanins and ellagitannins,7−9 which49 make up >90% the total phenol cotent. The anthocyanins are
50responsible for their deep red coloration and are important
51targets for breeding efforts to improve and maintain consumer
52quality perception. Ellagitannins are important for the
53characteristic astringency and flavor of raspberries and must54also be taken into account in breeding efforts.55Raspberry polyphenols have been implicated in a range of
56bioactivities relevant to human health.10 Previous work has
57shown potent inhibition of cancer cell lines8,11,12 and inhibition
58of digestive enzymes relevant to glycemic control,13 lipid
59digestion, and obesity.14 Indeed, in many cases, ellagitannins60have been shown to be particularly potent.61This study examined the total phenol content (TPC) and
62total anthocyanin content (TAC) in ripe fruit of progeny of a
63mapping population generated from a cross between the
64European red raspberry cv. Glen Moy (Rubus ideaus var. idaeus)
65and the North American red raspberry cv. Latham (Rubus
66ideaus var. strigosus) over five seasons in two growing
67environments that differed in abiotic and biotic stresses. QTL
68analysis was carried out on the TPC and TAC to identify
69regions of the genome associated with these traits, and the
70consistency of key molecular markers for TPC and TAC over71sites and years was examined.
Received: February 7, 2012Revised: May 9, 2012Accepted: May 10, 2012
Article
pubs.acs.org/JAFC
© XXXX American Chemical Society A dx.doi.org/10.1021/jf3005178 | J. Agric. Food Chem. XXXX, XXX, XXX−XXX
emr00 | ACSJCA | JCA10.0.1465/W Unicode | research.3f (R3.1.5.i2:3679 | 2.0 alpha 39) 2012/05/08 15:22:00 | PROD-JCAVA | rq_1522098 | 5/16/2012 09:25:05 | 7

72 ■ MATERIALS AND METHODS73 The raspberry mapping population and genetic linkage maps have74 been described in detail previously.2−4,15,16 It consists of a full sib75 family of 350 individuals generated from a cross between the European76 red raspberry cv. Glen Moy and the North American red raspberry cv.77 Latham.78 Field Conditions. Two different trial sites were selected at the79 James Hutton Institute (JHI), Dundee, Scotland. The first (site H)80 was known to be contaminated by Phytophthora rubi (the causative81 agent of root rot), having previously been tested (JHI farm records),82 and the second (site B) was considered to be disease-free. Disease83 incidence and severity were further exacerbated at the contaminated84 site by spreading and rotavating contaminated topsoil from another85 site, irrigation on a daily basis (using a tape irrigation system from June86 until September), and planting in the absence of ridging and fungicide87 treatment. In contrast, the clean site (site B) was ridged as standard88 practice for growing raspberries to control Phytophthora and was89 treated with fungicides. Management at both sites was otherwise in90 line with current commercial practice. Both sites were planted in a91 randomized block design with three blocks per site. Further details of92 the trial sites and their management have been published17 in a93 previous study of rot root resistance.94 Fruit Sampling. Fruit was sampled from a single block at each site95 in 2003, 2004, 2005, and 2006. The fruit samples were frozen in bags96 until extraction. In 2007 and 2008, fruit was sampled from two blocks97 at the clean site (site B) only. In each year, fruit was sampled for the98 same 93 individuals. This subset of the cross has been referred to99 previously2 and elsewhere as mapping population MP1, for which100 extensive molecular marker information is available.101 Extraction Procedure. A representative subsample of fruit from102 each progeny was selected for extraction. The selected berries were cut103 in half, weighed, and then extracted with an equal volume to weight of104 acetonitrile containing 4% acetic acid. The samples were homogenized105 by hand using a glass tissue homogenizer with a PTFE pestle and then106 centrifuged at 13000 rpm for 5 min. The centrifugation was repeated107 and the supernatant taken as the extract. Subsamples and suitable108 dilutions were made for TPC and TAC measurements but also for109 FRAP and TEAC assays, which were carried out in batches. These110 extracts were stored at −80 °C.111 Total Phenol and Total Anthocyanin Contents. TAC and TPC112 were estimated using the methods outlined previously.18 In brief, TPC113 was measured using a modified Folin−Ciocalteu method with gallic114 acid as standard. TAC was estimated by a pH differential absorbance115 method. The absorbance value was related to anthocyanin content116 using a molar extinction coefficient calculated in-house for pure117 cyanidin-3-O-glucoside (purchased from ExtraSynthese, Genay,118 France). All analyses were carried out in triplicate.119 Assessment of Antioxidant Capacity (TEAC and FRAP).120 Analyses were performed as described before.18 For the TEAC assay,121 samples were mixed with buffer (25 mM phosphate, pH 7.4, 488.6122 μL), metmyoglobin (70 mM stock in buffer, 36 μL), and 2,2′-123 azinobis(3-ethylbenzthiazoline-6-sulfonic acid) (ABTS, 500 mM stock124 in buffer, 300 μL). Absorbance (734 nm) of the developing ABTS•+
125 chromophore was recorded 7.5 min after initiation by addition of126 hydrogen peroxide solution (450 μM stock in water, 167 μL). In127 controls, distilled water replaced the hydrogen peroxide. All analyses128 were carried out in triplicate.129 A manual FRAP assay based on the method described previously18
130 was used. FRAP reagent was freshly prepared (1 mM 2,4,6-tripyridyl-131 2-triazine (TPTZ) and 2 mM ferric chloride in 0.25 M sodium acetate,132 pH 3.6). A 100 μL aliquot of raspberry extract (at 1% v/v in distilled133 water) was added to 900 μL of FRAP reagent and mixed. After134 standing at ambient temperature (∼20 °C) for 4 min, absorbance at135 593 nm was determined against a water blank. Calibration was against136 a standard curve (50 ± 1000 μM ferrous ion) produced by the137 addition of freshly prepared ammonium ferrous sulfate. FRAP values138 obtained are presented as micromolar ferrous ion equivalents (ferric139 reducing power) of the extracts, from three determinations.
140Statistical Analysis. The TPC, TAC, FRAP, and TEAC data were141analyzed using a mixed model fitted by residual maximum likelihood142[REML]19 to estimate site and year means. The 93 individual143genotypes were initially fitted as a random effect, as was the interaction144between genotype and environment (i.e., year by site combination). A145common residual variance across the environments was compared with146separate residual variances to see whether there were significant147differences among the environments. The broad-sense heritability for148each trait was estimated as
σσ σ σ
=+ +
H2 G2
G2
GL2
E2
149where σG2 is the variance component for genotypes, σGL
2 is the variance150component for the genotype by environment interaction, and σE
2 is the151overall residual mean square. The analysis was repeated with genotype152and environment as fixed effects to estimate genotype means across153the environments for each trait for QTL mapping. Each trait was154mapped on the linkage map using Kruskal−Wallis analysis, as155implemented in the MapQTL 5 software.20 The most significant156markers were included as fixed effects in a mixed model analysis to test157for significant marker main effects and interactions with site and year.158All statistical analyses apart from the Kruskal−Wallis mapping were159carried out using the statistical program Genstat 12 for Windows.21
160The linkage maps were drawn using MapChart 2.2.22
161■ RESULTS AND DISCUSSION162The Pearson correlations between TPC, TAC, and the163measurements of antioxidant capacity (FRAP and TEAC)164 t1over all seasons and fields are shown in Table 1. All of the
165correlations are positive and highly significant (p < 0.001). TPC166and the two measures of antioxidant capacity (FRAP and167TEAC) were more highly correlated with each other than with168 t2TAC. Table 2 shows the correlation between TPC and TAC at169every site and year. TAC and TPC were significantly correlated170at every site and year. For field B in 2005 and 2006, the171correlation was lowest, but still significant with p < 0.05. For the172other environments the correlation was significant with p <1730.001.174The two measurement of antioxidant capacity (TEAC and175FRAP) correlated well with TPC. This has been noted before176within varieties of cultivated berries and wild species of177berries.18 It is well accepted that the Folin assay for TPC and178the antioxidant measurements (TEAC and FRAP) effectively179measure different aspects of antioxidant capacity23 and180therefore are often well correlated within berry types.24,25
181TAC, which is a subset of total phenol content, also correlated182with TPC and the measures of antioxidant capacity. This has183been noted previously. For example, TPC was closely184correlated with FRAP (r = 0.93) in progeny of factorial mating185design experiment encompassing 411 raspberry genotypes,26
186but TAC was less well correlated with FRAP (r = 0.53) 27
Table 1. Pearson Correlations (R) between Total PhenolContent (TPC), Total Anthocyanin Content (TAC), andAntioxidant Capacity Measurements (FRAP and TEAC)over All Seasons and Field Environments
TPCa
FRAPb 0.81TEACb 0.87 0.84TACb 0.43 0.46 0.41
TPC FRAP TEACaExpressed as mg/100 g FW fruit. bExpressed as mmol/g FW.
Journal of Agricultural and Food Chemistry Article
dx.doi.org/10.1021/jf3005178 | J. Agric. Food Chem. XXXX, XXX, XXX−XXXB
187 The correlation of TEAC and FRAP with TPC has been188 noted before within varieties of cultivated berries and wild189 species of berries.18 It is well accepted that the Folin assay for190 TPC and the antioxidant measurements (TEAC and FRAP)191 effectively measure different aspects of antioxidant capacity23
192 and therefore are often well correlated within berry types.24,25
193 The correlations of these with TAC, which is a subset of total194 phenol content, have also been noted previously. For example,195 TPC was closely correlated with FRAP (r = 0.93) in the196 progeny of a factorial mating design experiment encompassing197 411 raspberry genotypes,26 but TAC was less well correlated198 with FRAP (r = 0.53).27
199 Despite the fact that anthocyanins are a subset of the200 polyphenolic pool, there is substantial plasticity in TAC201 compared to TPC in raspberry, which suggests that202 anthocyanin levels are not governed by the size of the total203 polyphenol pool. This plasticity has been highlighted in204 previous work on this raspberry progeny set3,4 grown under205 field and controlled conditions. However, this study provides206 evidence that the plasticity is robust across multiple seasons and207 in two field environments. As anthocyanins are end-points of a
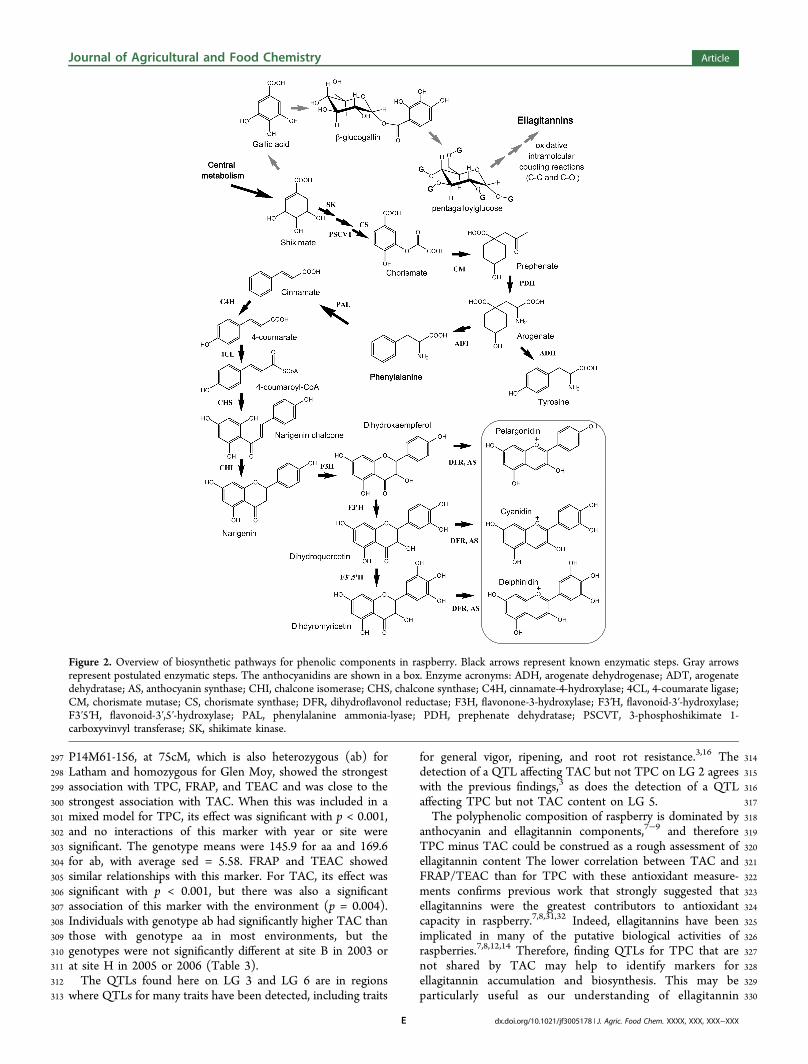
f1f2 208 branch of the general phenolic biosynthetic pathway (Figure 2),209 they are likely to be subject to different control mechanisms.210 Abiotic influences, such as light and temperature, have long211 been known to influence anthocyanin biosynthesis and212 accumulation (see, e.g., ref 28). Moreover, recent work has213 illustrated that altering postflowering temperature can influence214 anthocyanin content and composition and the amounts of215 ellagitannin components in raspberry.29
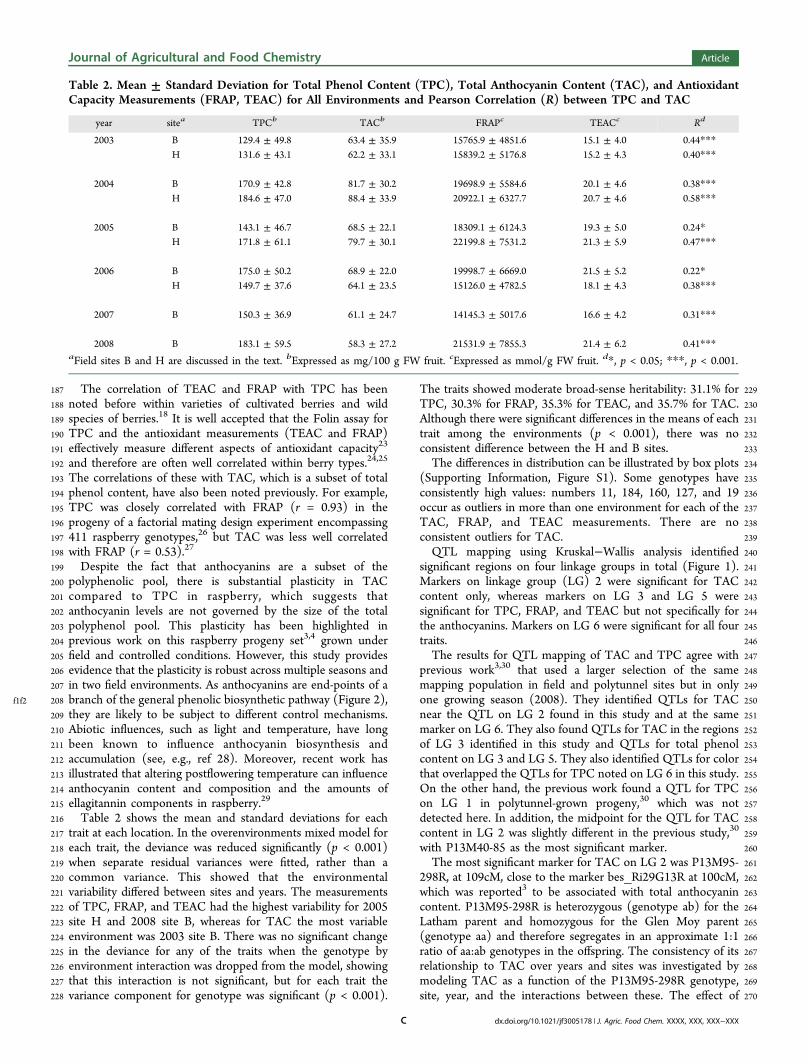
216 Table 2 shows the mean and standard deviations for each217 trait at each location. In the overenvironments mixed model for218 each trait, the deviance was reduced significantly (p < 0.001)219 when separate residual variances were fitted, rather than a220 common variance. This showed that the environmental221 variability differed between sites and years. The measurements222 of TPC, FRAP, and TEAC had the highest variability for 2005223 site H and 2008 site B, whereas for TAC the most variable224 environment was 2003 site B. There was no significant change225 in the deviance for any of the traits when the genotype by226 environment interaction was dropped from the model, showing227 that this interaction is not significant, but for each trait the228 variance component for genotype was significant (p < 0.001).
229The traits showed moderate broad-sense heritability: 31.1% for230TPC, 30.3% for FRAP, 35.3% for TEAC, and 35.7% for TAC.231Although there were significant differences in the means of each232trait among the environments (p < 0.001), there was no233consistent difference between the H and B sites.234The differences in distribution can be illustrated by box plots235(Supporting Information, Figure S1). Some genotypes have236consistently high values: numbers 11, 184, 160, 127, and 19237occur as outliers in more than one environment for each of the238TAC, FRAP, and TEAC measurements. There are no239consistent outliers for TAC.240QTL mapping using Kruskal−Wallis analysis identified241significant regions on four linkage groups in total (Figure 1).242Markers on linkage group (LG) 2 were significant for TAC243content only, whereas markers on LG 3 and LG 5 were244significant for TPC, FRAP, and TEAC but not specifically for245the anthocyanins. Markers on LG 6 were significant for all four246traits.247The results for QTL mapping of TAC and TPC agree with248previous work3,30 that used a larger selection of the same249mapping population in field and polytunnel sites but in only250one growing season (2008). They identified QTLs for TAC251near the QTL on LG 2 found in this study and at the same252marker on LG 6. They also found QTLs for TAC in the regions253of LG 3 identified in this study and QTLs for total phenol254content on LG 3 and LG 5. They also identified QTLs for color255that overlapped the QTLs for TPC noted on LG 6 in this study.256On the other hand, the previous work found a QTL for TPC257on LG 1 in polytunnel-grown progeny,30 which was not258detected here. In addition, the midpoint for the QTL for TAC259content in LG 2 was slightly different in the previous study,30
260with P13M40-85 as the most significant marker.261The most significant marker for TAC on LG 2 was P13M95-262298R, at 109cM, close to the marker bes_Ri29G13R at 100cM,263which was reported3 to be associated with total anthocyanin264content. P13M95-298R is heterozygous (genotype ab) for the265Latham parent and homozygous for the Glen Moy parent266(genotype aa) and therefore segregates in an approximate 1:1267ratio of aa:ab genotypes in the offspring. The consistency of its268relationship to TAC over years and sites was investigated by269modeling TAC as a function of the P13M95-298R genotype,270site, year, and the interactions between these. The effect of
Table 2. Mean ± Standard Deviation for Total Phenol Content (TPC), Total Anthocyanin Content (TAC), and AntioxidantCapacity Measurements (FRAP, TEAC) for All Environments and Pearson Correlation (R) between TPC and TAC
year sitea TPCb TACb FRAPc TEACc Rd
2003 B 129.4 ± 49.8 63.4 ± 35.9 15765.9 ± 4851.6 15.1 ± 4.0 0.44***H 131.6 ± 43.1 62.2 ± 33.1 15839.2 ± 5176.8 15.2 ± 4.3 0.40***
2004 B 170.9 ± 42.8 81.7 ± 30.2 19698.9 ± 5584.6 20.1 ± 4.6 0.38***H 184.6 ± 47.0 88.4 ± 33.9 20922.1 ± 6327.7 20.7 ± 4.6 0.58***
2005 B 143.1 ± 46.7 68.5 ± 22.1 18309.1 ± 6124.3 19.3 ± 5.0 0.24*H 171.8 ± 61.1 79.7 ± 30.1 22199.8 ± 7531.2 21.3 ± 5.9 0.47***
2006 B 175.0 ± 50.2 68.9 ± 22.0 19998.7 ± 6669.0 21.5 ± 5.2 0.22*H 149.7 ± 37.6 64.1 ± 23.5 15126.0 ± 4782.5 18.1 ± 4.3 0.38***
2007 B 150.3 ± 36.9 61.1 ± 24.7 14145.3 ± 5017.6 16.6 ± 4.2 0.31***
2008 B 183.1 ± 59.5 58.3 ± 27.2 21531.9 ± 7855.3 21.4 ± 6.2 0.41***aField sites B and H are discussed in the text. bExpressed as mg/100 g FW fruit. cExpressed as mmol/g FW fruit. d*, p < 0.05; ***, p < 0.001.
Journal of Agricultural and Food Chemistry Article
dx.doi.org/10.1021/jf3005178 | J. Agric. Food Chem. XXXX, XXX, XXX−XXXC

271 P13M95-298R was significant with p < 0.001, but there was272 also a significant interaction with the site (p = 0.002). Offspring273 with genotype ab at this marker had significantly higher TAC274 than those with genotype aa, with a larger difference at the
t3 275 infected site H (Table 3). The most significant association with276 TPC, FRAP, and TEAC on LG 3 was with marker P14M61-277 124, at 72cM, which is also heterozygous (ab) for Latham and278 homozygous for Glen Moy. When this was included in a mixed279 model for TPC, its effect was significant with p < 0.001. There280 was also some evidence of an interaction between the marker,281 site, and year (p = 0.033). Offspring with genotype ab had282 significantly higher TPC than those with genotype aa, except283 for site H in 2003, where the differences were not significant.
284The mean difference, excluding site H in 2003, was 27.4 mg/285100 g, with sed = 9.17. FRAP and TEAC showed similar286relationships with this marker. The most significant association287with TPC, FRAP, and TEAC on LG 5 was with marker288RiM019 at 80cM, which is heterozygous for both parents with289four different alleles (abxcd) and, therefore, four genotype290classes for the offspring ac:ad:bc:bd occurring in an expected2911:1:1:1 ratio.. When this marker was included in a mixed model292for TPC, its effect was significant with p < 0.001, but no293interactions of this marker with year or site were significant.294The genotype means were ac, 168.9; ad, 174.7; bc, 138.1; and295bd, 156.5, with an average sed = 8.17. FRAP and TEAC showed296similar relationships with this marker. For LG 6, marker
Figure 1. Maps of Rubus linkage groups 2, 3, 5, and 6. The map shows the regions where the significance of the Kruskal−Wallis test for associationswith the traits is <0.001. The markers used in the mixed model are underlined.
Journal of Agricultural and Food Chemistry Article
dx.doi.org/10.1021/jf3005178 | J. Agric. Food Chem. XXXX, XXX, XXX−XXXD
297 P14M61-156, at 75cM, which is also heterozygous (ab) for298 Latham and homozygous for Glen Moy, showed the strongest299 association with TPC, FRAP, and TEAC and was close to the300 strongest association with TAC. When this was included in a301 mixed model for TPC, its effect was significant with p < 0.001,302 and no interactions of this marker with year or site were303 significant. The genotype means were 145.9 for aa and 169.6304 for ab, with average sed = 5.58. FRAP and TEAC showed305 similar relationships with this marker. For TAC, its effect was306 significant with p < 0.001, but there was also a significant307 association of this marker with the environment (p = 0.004).308 Individuals with genotype ab had significantly higher TAC than309 those with genotype aa in most environments, but the310 genotypes were not significantly different at site B in 2003 or311 at site H in 2005 or 2006 (Table 3).312 The QTLs found here on LG 3 and LG 6 are in regions313 where QTLs for many traits have been detected, including traits
314for general vigor, ripening, and root rot resistance.3,16 The315detection of a QTL affecting TAC but not TPC on LG 2 agrees316with the previous findings,3 as does the detection of a QTL317affecting TPC but not TAC content on LG 5.318The polyphenolic composition of raspberry is dominated by319anthocyanin and ellagitannin components,7−9 and therefore320TPC minus TAC could be construed as a rough assessment of321ellagitannin content The lower correlation between TAC and322FRAP/TEAC than for TPC with these antioxidant measure-323ments confirms previous work that strongly suggested that324ellagitannins were the greatest contributors to antioxidant325capacity in raspberry.7,8,31,32 Indeed, ellagitannins have been326implicated in many of the putative biological activities of327raspberries.7,8,12,14 Therefore, finding QTLs for TPC that are328not shared by TAC may help to identify markers for329ellagitannin accumulation and biosynthesis. This may be330particularly useful as our understanding of ellagitannin
Figure 2. Overview of biosynthetic pathways for phenolic components in raspberry. Black arrows represent known enzymatic steps. Gray arrowsrepresent postulated enzymatic steps. The anthocyanidins are shown in a box. Enzyme acronyms: ADH, arogenate dehydrogenase; ADT, arogenatedehydratase; AS, anthocyanin synthase; CHI, chalcone isomerase; CHS, chalcone synthase; C4H, cinnamate-4-hydroxylase; 4CL, 4-coumarate ligase;CM, chorismate mutase; CS, chorismate synthase; DFR, dihydroflavonol reductase; F3H, flavonone-3-hydroxylase; F3′H, flavonoid-3′-hydroxylase;F3′5′H, flavonoid-3′,5′-hydroxylase; PAL, phenylalanine ammonia-lyase; PDH, prephenate dehydratase; PSCVT, 3-phosphoshikimate 1-carboxyvinvyl transferase; SK, shikimate kinase.
Journal of Agricultural and Food Chemistry Article
dx.doi.org/10.1021/jf3005178 | J. Agric. Food Chem. XXXX, XXX, XXX−XXXE

331 biosynthesis is not well-defined33 and is well behind that of332 anthocyanin biosynthesis (see, e.g., ref 34). Ellagitannins also333 contribute to sensorial quality through astringency and, along334 with acid/sugar balance, are key to the complex sensory nature335 of raspberries.35 From what is known about the biosynthesis of336 ellagitannins, they originate from gallic acid, which is itself337 formed from the central metabolite, shikimate. Therefore,338 regulation of ellagitannin content must operate at a different339 level, “higher” up the biosynthetic pathway than the biosyn-340 thesis of anthocyanins, which effectively represents a metabolic341 end-point (Figure 2). Ellagitannins are generally synthesized342 earlier in fruit development than the anthocyanins,36 which are343 obviously associated with ripening, and therefore must also344 come under different temporal control regimes.345 In general, the QTL effects are quite consistent over years346 and sites: interactions are either nonsignificant or only weakly347 significant. Some differences were less significant in the 2003348 sampling (the first fruiting year) than in later samples, which349 may reflect differences in plant maturity and fruit set. There is350 some evidence that anthocyanin QTLs may have different sized351 effects at clean and root rot sites, but this needs to be352 investigated further on a larger population before firm353 conclusions about this can be drawn. Therefore, we conclude354 that the molecular markers identified here are good candidates355 for use in marker-assisted selection.
356 ■ ASSOCIATED CONTENT357 *S Supporting Information358 Figure S1. This material is available free of charge via the359 Internet at http://pubs.acs.org.
360■ AUTHOR INFORMATION361Corresponding Author362*Phone: +441382 568782. Fax: +44 1382 568704. E-mail:[email protected].
364Funding365We acknowledge funding from the Scottish Government Rural366and Environment Science and Analytical Services Division.
367Notes368The authors declare no competing financial interest.
369■ REFERENCES(1) 370Graham, J.; Jennings, S. N. Raspberry breeding. In Breeding
371Plantation Tree Crops: Tropical Species; Jain, S. M., Priyadarshan, M.,372Eds.; IBH and Science Publication: Oxford, U.K., 2009; pp 233−248.
(2) 373Graham, J.; Hackett, C. A.; Smith, K.; Woodhead, M.; Hein, I.;374McCallum, S. Mapping QTLs for developmental traits in raspberry375from bud break to ripe fruit. Theor. Appl. Genet. 2009, 118, 1143−3761155.
(3) 377McCallum, S.; Woodhead, M.; Hackett, C. A.; Kassim, A.;378Paterson, A.; Graham, J. Genetic and environmental effects influencing379fruit color and QTL analysis in raspberry. Theor. Appl. Genet. 2010,380121, 611−627.
(4) 381Kassim, A.; Poette, J.; Paterson, A.; Zait, D.; McCallum, S.;382Woodhead, M.; Smith, K.; Hackett, C.; Graham, J. Environmental and383seasonal influences on red raspberry anthocyanin antioxidant contents384and identification of QTL. Mol. Nutr. Food Res. 2009, 53, 625−634.
(5) 385Kahkonen, M. P.; Hopia, A. I.; Heinonen, M. Berry phenolics and386their antioxidant activity. J. Agric. Food Chem. 2001, 49, 4076−4082.
(6) 387Macheix, J.-J.; Fleuriet, A.; Billot, J. Fruit Phenolics; CRC Press:388Boca Raton, FL, 1990.
(7) 389Mullen, W.; McGinn, J.; Lean, M. J.; MacLean, M. R.; Gardiner,390P.; Duthie, G. G.; Yokota, T.; Crozier, A. Ellagitannins, flavanoids, and391other phenolics in red raspberries and their contribution to antioxidant392capacity and vaso-relaxation properties. J. Agric. Food Chem. 2002, 50,3935191−5196.
(8) 394Ross, H. A.; McDougall, G. J.; Stewart, D. Antiproliferative395activity is pedominantly associated with ellagitannins in raspberry396extracts. Phytochemistry 2007, 68, 218−228.
(9) 397McDougall, G. J.; Martinussen, I.; Stewart, D. Towards fruitful398metabolomics: high throughput analyses of polyphenol composition in399berries using direct infusion mass spectrometry. J. Chromatog., B 2008,400871, 362−369.
(10) 401Seeram, N. P. Berry fruits: compositional elements, biochemical402activities, and the impact of their intake on human health,403performance, and disease. J. Agric. Food Chem. 2008, 56, 627−629.
(11) 404McDougall, G. J.; Ross, H. A.; Ikeji, M.; Stewart, D. Berry405extracts exert different antiproliferative effects against cervical and406colon cancer cells grown in vitro. J. Agric. Food Chem. 2008, 56, 3016−4073023.
(12) 408Coates, E. M.; Popa, G.; Gill, C. I. R.; McCann, M. J.;409McDougall, G. J.; Stewart, D.; Rowland, I. R. Colon-available raspberry410polyphenols exhibit anti-cancer effects on in vitro models of colon411cancer. J. Carcinogenesis 2007, 6, 4−11.
(13) 412Grussu, D.; Stewart, D.; McDougall, G. J. Berry polyphenols413inhibit α-amylase in vitro: identifying active components in414rowanberry and raspberry. J. Agric. Food Chem. 2011, 59, 2324−2331.
(14) 415McDougall, G. J.; Kulkarni, N.; Stewart, D. Berry polyphenols416inhibit pancreatic lipase activity in vitro. Food Chem. 2009, 115, 193−417199.
(15) 418Graham, J.; Smith, K.; MacKenzie, K.; Jorgenson, L.; Hackett, C.419A.; Powell, W. The construction of a genetic linkage map of red420raspberry (Rubus idaeus subsp. idaeus) based on AFLPs, genomic-SSR421and EST-SSR markers. Theor. Appl. Genet. 2004, 109, 740−749.
(16) 422Graham, J.; Smith, K.; Tierney, I.; MacKenzie, K.; Hackett, C. A.423Mapping gene H controlling cane pubescence in raspberry and its424association with resistance to cane botrytis and spur blight, rust and425cane spot. Theor. Appl. Genet. 2006, 112, 818−831.
Table 3. Mean Total Anthocyanin Content (TAC)a for theaa and ab Genotypes of Marker P13M95-298R (fromLinkage Group 2) at Each Site and of Marker P14M61-156(from Linkage Group 6) at Each Site and Year
(A) P13M95-298R Genotype
site aa ab sedb
B 59.59 73.94 3.446H 61.55 84.77 3.917
(B) P14M61-156 Genotype
year site aa ab sedc
2003 B 61.15 66.12 7.368H 53.20 70.74 7.369
2004 B 70.01 93.07 5.692H 76.69 99.31 5.867
2005 B 58.77 78.47 4.447H 76.44 83.61 5.870
2006 B 62.14 75.29 4.606H 66.36 63.88 4.989
2007 B 53.01 69.17 4.246
2008 B 49.77 65.46 5.899aTAC is expressed as mg/100 g FW fruit. bThe seds (standard error ofdifference) in the table are for comparison of the genotypes withineach site. The average sed across all pairwise comparisons was 3.306.cThe seds in the table are for comparison of the genotypes within eachsite and year. The average sed across all pairwise comparisons was5.407.
Journal of Agricultural and Food Chemistry Article
dx.doi.org/10.1021/jf3005178 | J. Agric. Food Chem. XXXX, XXX, XXX−XXXF
(17)426 Graham, J.; Hackett, C. A.; Smith, K.; Woodhead, M.;427 MacKenzie, K.; Tierney, I.; Cooke, D.; Bayer, M. Towards an428 understanding of the nature of resistance to Phytophthora root rot in429 red raspberry: is it mainly root vigour? Theor. Appl. Genet. 2011, 123,430 585−601.
(18)431 Deighton, N.; Brennan, R.; Finn, C.; Davies, H. V. Antioxidant432 properties of domesticated and wild Rubus species. J. Sci. Food Agric.433 2000, 80, 1307−1313.
(19)434 Patterson, H. D.; Thompson, R. Recovery of inter-block435 information when block sizes are unequal. Biometrika 1971, 58, 545−436 554.
(20)437 Van Ooijen, J. W. MapQTL® 5, software for the mapping of438 quantitative trait loci in experimental populations. Kyazma BV,439 Wageningen, The Netherlands, 2004.
(21)440 Genstat for Windows Release 12.2. VSN International Ltd.,441 Hemel Hempstead, Hertfordshire, U.K., 2009
(22)442 Voorrips, R. E. MapChart: Software for the graphical443 presentation of linkage maps and QTLs. J. Heredity 2002, 93, 77−78.
(23)444 Huang, D.; Ou, B.; Prior, R. L. The chemistry behind445 antioxidant capacity assays. J. Agric. Food Chem. 2005, 53, 1841−1856.
(24)446 Wang, S. Y.; Lin, H.-S. Antioxidant activity in fruits and leaves of447 blackberry, raspberry, and strawberry varies with cultivar and448 developmental stage. J. Agric. Food Chem. 2000, 48, 140−146.
(25)449 Sariburun, E.; Sahin, S.; Demir, C.; Turkben, C.; Uylaser, V.450 Phenolic content and antioxidant activity of raspberry and blackberry451 cultivars. J. Food Sci. 2010, 4, C328−C335.
(26)452 Connor, A.-M.; Stephens, M. J.; Hall, H. K.; Alspach, P. A.453 Variation and heritabilities of antioxidant activity and total phenolic454 content estimated from a red raspberry factorial experiment. J. Am.455 Hortic. Sci. 2005, 130, 403−411.
(27)456 Connor, A.-M.; McGhie, T. K.; Stephens, M. J.; Hall, H. K.;457 Alspach, P. A. Variation and heritability estimates of anthocyanins and458 their relationship to antioxidant activity in a red raspberry factorial459 mating design. J. Am. Hortic. Sci. 2005, 130, 534−542.
(28)460 Jaakola, L.; Hohtola, A. Effect of latitude on flavonoid461 biosynthesis in plants. Plant Cell Environ. 2010, 33, 1239−1247.
(29)462 Remberg, S. V.; Sønsteby, A.; Aaby, K.; Heide, O. M. Influence463 of postflowering temperature on fruit size and chemical composition of464 Glen Ample raspberry (Rubus idaeus L.). J. Agric. Food Chem. 2010, 58,465 9120−9128.
(30)466 McCallum, S. Marker assisted breeding for sensory character-467 istics in red raspberry (Rubus idaeus). Ph.D. thesis, University of468 Strathclyde, 2010.
(31)469 Beekwilder, J.; Jonker, H.; Meesters, P.; Hall, R. D.; van der470 Meer, I. M.; de Vos, C. H. R. Antioxidants in raspberry: on-line471 analysis links antioxidant activity to a diversity of individual472 metabolites. J. Agric. Food Chem. 2005, 53, 3313−3320.
(32)473 Borges, G.; Degeneve, A.; Mullen, W.; Crozier, A. Identification474 of flavonoid and phenolic antioxidants in black currants, blueberries,475 raspberries, red currants, and cranberries. J. Agric. Food Chem. 2010,476 58, 3901−3909.
(33)477 Gross, G. G. Biosynthesis of ellagitannins: old ideas and new478 solutions. In Chemistry and Biology of Ellagitannins. An Underestimated479 Class of Plant Poylphenols; Quideau, S., Ed.; World Scientific480 Publishers: London, U.K., 2009; pp 94−118.
(34)481 Lin-Wang, K.; Bolitho, K.; Grafton, K.; Kortstee, A.;482 Karunairetnam, S.; McGhie, T. K.; Espley, R. V.; Hellens, R. P.;483 Allan, A. C. An R2R3MYB transcription factor associated with484 regulation of the anthocyanin biosynthetic pathway in Rosaceae. BMC485 Plant Biol. 2010, 21, 10−15.
(35)486 Bakkalbasi, E.; Mentes, O.; Artik, N. Food ellagitannins −487 occurrence, effects of processing and storage. Crit. Rev. Food Sci. Nutr.488 2009, 49, 283−298.
(36)489 Fait, A.; Hanhineva, K.; Beleggia, R.; Dai, N.; Rogachev, I.;490 Nikiforova, V. J.; Fernie, A. R.; Aharoni, A. Reconfiguration of the491 achene and receptacle metabolic networks during strawberry fruit492 development. Plant Physiol. 2008, 148, 730−750.
Journal of Agricultural and Food Chemistry Article
dx.doi.org/10.1021/jf3005178 | J. Agric. Food Chem. XXXX, XXX, XXX−XXXG