outlook for outbound leisure travel - amazon web...
TRANSCRIPT

Outlook for Outbound Leisure Travel
Summer 2015
Outbound travel intentions this summer are better than they were a year ago at this time. Of Canadians planning to
take a vacation trip during summer 2015, 49 per cent plan to travel outside the country. Residents of all regions
except Alberta reported increased outbound travel plans for the upcoming summer season. The proportion of
Canadians planning to travel to the U.S. is up slightly even though the dollar is trading at its lowest level in years.
Compared to 2013, more outbound travellers intend to visit the Caribbean and Mexico this year. Mexico, Cuba, and
the Dominican Republic are expected to see much of this growth as carriers will once again offer a considerable
boost in seat capacity. Supported by the aging population, summer travel intentions to Europe remain steady.
About four-in-ten Canadians planning a trip to Europe this summer are 55 or older. Fewer Canadians intend to visit
the Asia-Pacific region this summer, but a significant increase in the availability of direct flights to cities in China and
Japan will keep overall trip volumes steady. Total outbound leisure travel is forecast to grow by 2.0 per cent during
summer 2015 to almost 14.7 million trips. Trips to the U.S. are forecast to decline slightly due to reductions in auto
travel to short-haul destinations, while trips to other countries are forecast to grow by 7.7 per cent.
WHAT'S INSIDE

Table of Contents
Outbound Travel Intentions ........................................................................................................................................................ 1
Trip Volumes and Summer 2015 Outlook .................................................................................................................................... 2
Comparison of Exchange Rates................................................................................................................................................ 2
Summer Travel Destinations ........................................................................................................................................................ 3
Travel Intentions versus Actions .................................................................................................................................................. 4
Use of Travel Agents .................................................................................................................................................................... 4
The Internet and Travel Planning ................................................................................................................................................ 5
Package Vacations ....................................................................................................................................................................... 5
Travel Arrangements ................................................................................................................................................................... 6
Travel Insurance Coverage ........................................................................................................................................................... 6
At Destination Activities .............................................................................................................................................................. 7
Travelling with Mobile Devices .................................................................................................................................................... 8
Arrivals and Capacity Estimates by Region (2010-2015) ............................................................................................................. 9
United States ........................................................................................................................................................................... 9
Europe .................................................................................................................................................................................... 11
Summer Seat Capacity ....................................................................................................................................................... 12
Summer Arrivals Outlook ................................................................................................................................................... 13
Caribbean & Mexico .............................................................................................................................................................. 13
Summer Seat Capacity ....................................................................................................................................................... 14
Summer Arrivals Outlook ................................................................................................................................................... 15
Asia and the South Pacific ...................................................................................................................................................... 16
Summer Seat Capacity ....................................................................................................................................................... 16
Summer Arrivals Outlook ................................................................................................................................................... 17

Summer Outbound Travel Intentions 1 ©The Conference Board of Canada
Outbound Travel Intentions
Even though slightly fewer Canadians (-1.1%) intend to take a vacation trip this summer, a much higher proportion of travellers plan to travel outside the country on their longest summer trip. Half of Canadians planning to take a trip this summer, who have selected their destination, intend to travel outside the country. Higher outbound travel intentions come at the expense of domestic trips as fewer Canadians (51%) plan to spend their longest summer vacation trip closer to home. Compared to summer 2014, a similar proportion of travellers who have selected their destination plan to vacation in the U.S., Europe, and the Asia/Pacific region. The strong upward trend of summer trips to the Caribbean and Mexico continues in 2015 as more Canadians intend on travelling to the region this summer. Summer Outbound Vacation Intentions
Source: CBoC annual summer travel intentions survey of 1,500 Canadian adults; margin of error is +/- 2.5% at 95% confidence interval.
On a year-over-year basis, outbound summer trip intentions are up in all regions except Alberta (-8%). Summer outbound trip intentions are highest in BC (42%) and Ontario (39%), however the largest change was registered in Atlantic Canada (+17%). To provide further insight on trip intentions, travellers were asked which stage of the booking process they were at in regards to their summer trip. At the time of the survey, travellers from Atlantic Canada were most likely to be in the final stage of the booking process, while those in Quebec were least likely to have already purchased their travel arrangements. In fact, 39% of Quebec residents who said they would be taking a outbound trip this summer were in the investigation stage and 26% were still dreaming about getting away. This indicates that Quebec is a region in which operators may have higher success in influencing the trip planning process. Outbound Travellers and the Booking Process - Stage by Province/Region
Source: CBoC annual summer travel intentions survey of 1,500 Canadian adults; margin of error is +/- 2.5% at 95% confidence interval.
76%
60%
33%
78%
60%
36%
74%
56%
41%
75%
58%
39%
74%
51% 49%
Total Trip Intentions Domestic Trip Outbound Trip
2011 2012 2013 2014 2015
17%
26%
23%
11%
14%
13%
13%
39%
32%
32%
35%
35%
37%
17%
23%
29%
26%
24%
33%
19%
22%
29%
26%
29%
Atlantic
Quebec
Ontario
Prairies
Alberta
BC
Dreaming Investigating Planning Booking

Summer Outbound Travel Intentions 2 ©The Conference Board of Canada
Trip Volumes and Summer 2015 Outlook
During the summer months of 2014 (May to October), Canadians made an estimated 14.4 million outbound leisure trips, an increase of 1.7% compared to summer 2013. Almost three-quarters (73%) of these trips were to the U.S., a slightly smaller proportion than previous years. Summer trips to the U.S. fell 1.7% to 10.4 million, while trips to other destinations increased 11.9% to 4.0 million. Outbound leisure trips are forecast to grow by 2.0 per cent during summer 2015 though the increase will be driven by trips to non-U.S. destinations. Summer leisure trips to the U.S. are forecast to fall by 0.1 per cent due to a decline in auto travel. Leisure trips to non-US destinations are forecast to grow by 7.7 per cent to reach 4.26 million. Annual Summer Leisure Trips by Canadians, 2012-2015
Source: Summer 2015 represents CBoC forecast. Summer refers to the months of May through October. Leisure trips refer to visiting friends and relatives and pure pleasure travel.
Summer Leisure Trips to the U.S., by Province of Residence
CANADA Atlantic Quebec Ontario Manitoba Saskatchewan Alberta BC1
% change -0.1% 5.8% 1.8% 1.7% 10.0% 2.7% -2.3% 1.9%
2015f 10,423,063 346,166 2,005,875 4,467,326 452,169 143,553 782,548 2,436,839
2014 10,435,766 327,292 1,971,286 4,394,780 411,196 139,745 800,684 2,390,782
2013 10,622,236 347,032 2,005,030 4,500,281 430,567 139,476 770,350 2,429,498
2012 10,424,169 356,989 1,922,083 4,461,253 466,157 137,675 723,706 2,356,306 1. Includes the Yukon
Summer Leisure Trips to non-U.S. Destinations, by Province of Residence
CANADA Atlantic Quebec Ontario Manitoba Saskatchewan Alberta BC1
% change 7.7% 7.0% 1.8% 2.4% 9.7% 2.6% -0.8% 3.5%
2015f 4,257,307 77,538 935,291 2,073,415 9,228 5,826 296,829 647,767
2014 3,954,585 72,454 919,116 2,023,894 8,412 5,681 299,218 625,810
2013 3,533,088 59,089 858,301 1,773,821 8,421 5,155 268,614 559,688
2012 3,467,766 61,391 827,189 1,753,405 7,798 4,064 259,077 554,843 1. Includes the Yukon
Comparison of Exchange Rates
This summer, it will cost Canadians $1.36 to purchase one Euro versus $1.43 last summer. And, one Canadian dollar is expected to be worth ¥96, the same rate as in summer 2014. However, one British Pound will cost Canadians $1.89 compared to $1.75 in summer 2014. Most notably, the Canadian dollar will be worth just USD $0.75 this coming summer making it 18% more expensive to visit the United States.
2.9%
2.8%
2.9%
3.0%
20.0%
20.1%
20.2%
19.8%
44.6%
44.6%
44.3%
44.7%
4.2%
3.9%
4.1%
4.4%
7.4%
7.6%
7.3%
7.1%
21.0%
21.0%
21.1%
21.0%
Summer 2015f 14,680,370
Summer 2014 14,390,351
Summer 2013 14,155,324
Summer 2012 13,867,935
ATLANTIC QC ON PRAIRIES AB BC
Summer Outbound Travel Intentions 3 ©The Conference Board of Canada
Canadian Exchange Rate each Summer
EUR/CAD GBP/CAD CAD/USD AUD/CAD HKD/CAD JPY/CAD
May-Oct 2015f $1.36 $1.89 $0.75 $0.97 ¥ 96.00
May-Oct 2014 $1.43 $1.75 $0.91 $0.94 HK$7.10 ¥ 96.00
May-Oct 2013 $1.37 $1.61 $0.97 $0.97 HK$7.52 ¥ 95.53
May-Oct 2012 $1.27 $1.59 $1.02 $1.03 HK$7.75 ¥ 78.86
May-Oct 2011 $1.39 $1.58 $0.98 $1.03 HK$7.91 ¥ 79.73
May-Oct 2010 $1.34 $1.58 $1.04 $0.94 HK$7.51 ¥ 83.88
Sources: CBoC forecast for U.S., CIBC World Markets Monthly FX Outlook, March 11, 2015.
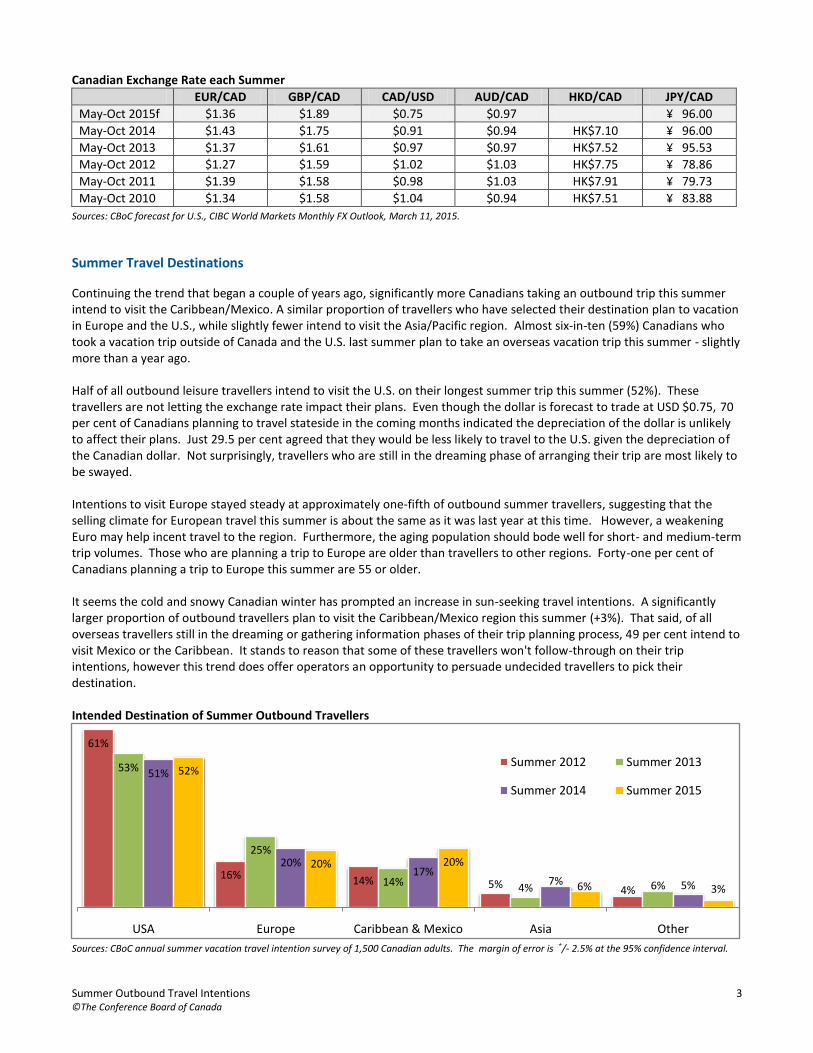
Summer Travel Destinations
Continuing the trend that began a couple of years ago, significantly more Canadians taking an outbound trip this summer intend to visit the Caribbean/Mexico. A similar proportion of travellers who have selected their destination plan to vacation in Europe and the U.S., while slightly fewer intend to visit the Asia/Pacific region. Almost six-in-ten (59%) Canadians who took a vacation trip outside of Canada and the U.S. last summer plan to take an overseas vacation trip this summer - slightly more than a year ago. Half of all outbound leisure travellers intend to visit the U.S. on their longest summer trip this summer (52%). These travellers are not letting the exchange rate impact their plans. Even though the dollar is forecast to trade at USD $0.75, 70 per cent of Canadians planning to travel stateside in the coming months indicated the depreciation of the dollar is unlikely to affect their plans. Just 29.5 per cent agreed that they would be less likely to travel to the U.S. given the depreciation of the Canadian dollar. Not surprisingly, travellers who are still in the dreaming phase of arranging their trip are most likely to be swayed. Intentions to visit Europe stayed steady at approximately one-fifth of outbound summer travellers, suggesting that the selling climate for European travel this summer is about the same as it was last year at this time. However, a weakening Euro may help incent travel to the region. Furthermore, the aging population should bode well for short- and medium-term trip volumes. Those who are planning a trip to Europe are older than travellers to other regions. Forty-one per cent of Canadians planning a trip to Europe this summer are 55 or older. It seems the cold and snowy Canadian winter has prompted an increase in sun-seeking travel intentions. A significantly larger proportion of outbound travellers plan to visit the Caribbean/Mexico region this summer (+3%). That said, of all overseas travellers still in the dreaming or gathering information phases of their trip planning process, 49 per cent intend to visit Mexico or the Caribbean. It stands to reason that some of these travellers won't follow-through on their trip intentions, however this trend does offer operators an opportunity to persuade undecided travellers to pick their destination. Intended Destination of Summer Outbound Travellers
Sources: CBoC annual summer vacation travel intention survey of 1,500 Canadian adults. The margin of error is +/- 2.5% at the 95% confidence interval.
61%
16% 14% 5%4%
53%
25%
14% 4% 6%
51%
20%17%
7% 5%
52%
20% 20%
6% 3%
USA Europe Caribbean & Mexico Asia Other
Summer 2012 Summer 2013
Summer 2014 Summer 2015

Summer Outbound Travel Intentions 4 ©The Conference Board of Canada
Intentions versus Actions
Thirty-nine per cent of respondents in the March 2014 survey said they planned to take an outbound summer leisure trip that year. According to the most recent data, 30 per cent of the Canadian population actually took an outbound summer trip between May 1 and October 31, 2014. A smaller proportion of travellers visited the U.S. but a larger proportion ended up travelling to the Caribbean and Mexico. Many travellers to the Caribbean/Mexico and the U.S. started with a desired destination in mind. However, for those who didn't know where they wanted to travel, the top three factors considered when they selected their destination were: their budget; the availability of special deals; and, the type of experience sought. Since these factors offer flexibility in the choice of destinations, it appears that travellers intending to visit the U.S. in 2014 were enticed by the perceived value and deals offered by sun destinations. Intended Destination of Summer Outbound Travellers
Sources: CBoC annual summer vacation travel intention survey of 1,500 Canadian adults. The margin of error is +/- 2.5% at the 95% confidence interval.
Use of Travel Agents
A good proportion of Canadians planning an outbound trip this summer intend to use the services of a travel agent either for information and/or to book their trip. Forty-four per cent plan to use the services of a travel agent to gather information, and 46 per cent intend to book their trip via a travel agent. On a regional basis, travellers to the U.S. are least likely to use the services of a travel agent. Almost two-thirds (64%) of travellers to the Caribbean/Mexico are very/somewhat likely to book their trip with a travel agent. However, not all travellers realize that online operators are in fact travel agents, so this figure is likely higher. Canadians planning a trip to the Asia/Pacific region are most likely use the services of a travel agent for information (64%). Likelihood to Use the Services of a Travel Agent for Summer Trip Planning and/or Booking
Use a travel agent for information Use a travel agent to book the trip
U.S.
Caribbean & Mexico
Europe Asia/ Pacific
U.S. Caribbean &
Mexico Europe Asia/ Pacific
Very likely 17% 39% 36% 39% 16% 44% 42% 32%
Somewhat likely 15% 21% 16% 25% 14% 20% 18% 29%
Somewhat unlikely 17% 19% 21% 4% 16% 15% 13% 11%
Very unlikely 51% 21% 28% 32% 54% 20% 28% 29%
Source: CBoC annual summer vacation travel intention survey of 1,500 Canadian adults. Totals may not add to 100% due to rounding.
51%
42%
20%
21%
17%
24%
7%
8%
5%
5%
Where they planned to go
Where they actually went
USA Europe Caribbean & Mexico Asia/South Pacific Other Destination

Summer Outbound Travel Intentions 5 ©The Conference Board of Canada
The Internet and Travel Planning
Of Canadians travelling outside the country on vacation this summer, 87 per cent plan to use the internet to research their destination and compare prices. In addition, 79 per cent plan to book some or all of their vacation online. Expedia.ca is the number one website travellers say they use to research their destination, compare prices, and book accommodations. Not surprisingly, airline websites are most commonly used to book flights. Use of Travel Websites for Booking and to Gather Information
Online Travel Site Research the Destination
Compare Prices
Book Flights
Book Accommodations
Other Activity
Expedia.ca 57% 62% 40% 43% 22%
Travelocity.ca 32% 43% 18% 17% 18%
iTravel2000 18% 22% 12% 7% 13%
Selloffvacations.ca 14% 18% 9% 7% 14%
Flightcentre 17% 22% 11% 6% 15%
CAA 23% 19% 9% 8% 19%
Hotels.com 25% 30% 7% 24% 9%
airline website 32% 41% 46% 10% 13%
hotel/resort website 39% 33% 9% 31% 11%
destination website 39% 23% 8% 12% 26%
other travel website 33% 25% 20% 18% 35%
Source: CBoC annual summer vacation travel intention survey of 1,500 Canadian adults. The margin of error is +/- 2.5% at the 95% confidence interval.
Package Vacations
Almost half (47.5%) of Canadians planning an outbound trip this summer are very/somewhat likely to purchase a package vacation. As with previous years, those planning to visit the Caribbean/Mexico this summer are most likely to purchase a package. On the other hand, less than one in four Canadians visiting the U.S. (39%) or Europe (33%) this summer plan to purchase a package vacation, which includes at least their flight and accommodation. Proportion of Summer Travellers Planning to Purchase a Packaged Vacation by Region of Travel
Source: CBoC annual summer vacation travel intention survey of 1,500 Canadian adults. The margin of error is +/- 2.5% at the 95% confidence interval.
32%
82%
28%
43%
67%
25%
71%
28%
58%
50%
31%
85%
29%
55%
47%
39%
83%
33%
61%
54%
USA Caribbean & Mexico Europe Asia/South Pacific Other
Summer 2012 Summer 2013
Summer 2014 Summer 2015

Summer Outbound Travel Intentions 6 ©The Conference Board of Canada
Travel Arrangements
Of all outbound travellers, just 13 per cent have already booked their flight or vacation package. Forty-eight per cent of these travellers are 55 and older. Thirty-seven per cent of summer travellers intend to book their trip six weeks or less prior to departure. Travellers planning to go to the Caribbean and Mexico are most likely to book their trip less than six weeks prior to departure. Proportion of Summer Travellers Planning to Make Travel Arrangements ≤ 6 Weeks Prior to Trip
Source: CBoC annual summer vacation travel intention survey of 1,500 Canadian adults. The margin of error is +/- 2.5% at the 95% confidence interval.
Travel Insurance Coverage
Half of outbound travellers this summer intend to purchase travel health insurance in preparation for their trip. Fifty-eight per cent of outbound travellers aged 55+ plan to buy health insurance. On the other hand, 43 per cent of travellers under age 35 think they will make this purchase, but many individuals in this age group have coverage through a group plan. Individuals travelling to the Caribbean/Mexico and Europe are the most likely to purchase travel health insurance. More than three-quarters of Canadians (77%) who took a leisure trip outside the country in the past three years had some type of travel health insurance. Coverage included group benefits, provided by an employer or other institution (48%), as well as plans purchased for one or more trips (52%). Pre-Trip Purchase Intentions: Travel Insurance Coverage
Source: CBoC annual summer vacation travel intention survey of 1,500 Canadian adults. The margin of error is +/- 2.5% at the 95% confidence interval.
50%
67%
27% 28%
41%46%
54%
22%26%
40%
48%51%
31%
47%43%
41% 44%
26%
37%
23%
USA Caribbean & Mexico Europe Asia/South Pacific Other
2012 2013 2014 2015
49%
24%
16%
46%
24%
16%
46%
31%
19%
50%
27%
13%
Travel Health Insurance
Trip Cancellation Insurance
Baggage Insurance
Summer 2013
Summer 2012
Summer 2014
Summer 2015

Summer Outbound Travel Intentions 7 ©The Conference Board of Canada
At Destination Activities
Canadians seek a variety of experiences when travelling. During their upcoming summer trip, more than half of travellers intend to participate in cultural activities including visiting a museum or heritage site. Other popular activities include outdoor activities (36%), experiencing the nightlife (35%), and attending a festival, concert, or sporting event (31%). More than half (54%) of Canadians planning to vacation outside the country this summer intend to purchase an activity or tour while on their trip. Travellers to the U.S. are least likely to purchase activities at their destination. Proportion of Summer Travellers Likely to Purchase a Separate Activity/Tour by Region of Visit
Source: CBoC annual summer vacation travel intention survey of 1,500 Canadian adults. The margin of error is +/- 2.5% at the 95% confidence interval.
The type of activities Canadians intend to purchase while on vacation vary by region. Not surprisingly, purchasing a water-based or adventure activity is most likely to occur on trips to the Caribbean and Mexico. City and sightseeing tours are most popular in Europe, while sporting events and theme parks are most popular in the U.S. Travellers to Asia and the South Pacific say they are most likely to purchase sightseeing tours and tickets to arts and cultural attractions. Type of Activity Purchased While on Trip, by Destination of Visit
Activity All Outbound
Travellers USA
Caribbean & Mexico
Europe Asia/Pacific
Water related activity 23% 8% 20% 3% 7%
Spa treatment or related 22% 10% 11% 7% 12%
Golf 10% 6% 5% 2% 3%
Adventure activity 22% 7% 17% 8% 6%
City/sightseeing tour 60% 24% 23% 32% 24%
Tickets to a cultural event/ attraction
43% 19% 8% 26% 24%
Tickets to a sporting event, theme park or other attraction
29% 18% 6% 11% 12%
Other activity/event 16% 5% 5% 9% 12%
Source: CBoC annual summer vacation travel intention survey of 1,500 Canadian adults. The margin of error is +/- 2.5% at the 95% confidence interval.
44%
73%
52% 51%55%
48%
85%
56%
71%
47%43%
67%63%
82%
46%
USA Caribbean & Mexico Europe Asia/South Pacific Other Destination
Summer 2013 Summer 2014 Summer 2015

Summer Outbound Travel Intentions 8 ©The Conference Board of Canada
Use of Mobile Devices
Canadians like to stay connected during their outbound trips. Of Canadians travelling outside the country on vacation this summer, 92 per cent plan to be connected with one or more mobile device. Most of these travellers are connected with a smart phone (67%) and/or a tablet (44%). Plans to take a smart phone and/or tablet on outbound trips has increased significantly since 2011. Only one-third of outbound summer travellers planned to take a smart phone or tablet on their 2011 outbound summer vacation trip, compared to three-quarters of travellers in 2015. Travellers visiting the U.S. are most likely to bring a mobile device, however smart phone use is particularly high amongst Canadians visiting the Asia/Pacific region. Proportion of Travellers Taking a Mobile Device on Summer Vacation Trip, by Region of Visit and Device
All Travellers USA Caribbean & Mexico Europe Asia/Pacific
ANY DEVICE 92% 95% 87% 90% 90%
Cell phone 21% 14% 14% 9% 5%
Smart phone 67% 40% 46% 40% 51%
Tablet 44% 25% 25% 32% 30%
Laptop/Notebook 32% 21% 16% 19% 14%
Source: CBoC annual summer vacation travel intention survey of 1,500 Canadian adults.
Sending photos and messages is the main thing travellers intend to use their devices for while on their trip. About six-in-ten plan to use their device to "research local activities", and/or "make voice/video calls". Using a mobile device to make dining reservations, book travel arrangements, or purchase activities are becoming more common. About one-third of travellers plan to use their smart device to purchase a product or service while travelling outside the country this summer. In 2011, less than one-quarter (23%) of outbound summer travellers planned to make a purchase with their smart device. Use of Mobile Devices When Travelling Outside Canada
Source: CBoC annual summer vacation travel intention survey of 1,500 Canadian adults.
17%
30%
31%
33%
37%
60%
61%
68%
Blog about the trip
Rate an attraction, restaurant, or hotel
Purchase tours/activities after departure
Book hotel rooms, car rentals, etc.
Make dining reservations
Make voice/video calls
Research local activities/history
Send photos or messages

Summer Outbound Travel Intentions 9 ©The Conference Board of Canada
Arrivals and Capacity Estimates by Region (2010-2015)
The following tables show the number of Canadian direct arrivals/visits during the summer months of May through October each year. The compound average annual rate of growth (CARG) is also shown where appropriate.
United States
With the exception of Miami, direct air arrivals from Canada grew to all of the major U.S. long-haul destinations during summer 2014 as carriers increased direct seat capacity to these destinations. Carriers plan to increase the available seats again during summer 2015. Notably, Air Canada will start offering flights from Toronto to Sarasota, and extend Ottawa to Fort Lauderdale service to year-round. Air Canada rouge will offer twice-weekly non-stop service between Toronto and Honolulu, resulting in an increase of more than 25 thousand seats. And, Fort Myers will see increased summer capacity (+34.2%) by both Air Canada and WestJet. After increasing 6.1 per cent during the summer of 2014, direct air arrivals to Florida are expected to grow 12.6 per cent this summer as carriers offer more than 100 thousand new seats to key cities. Direct air arrivals to Los Angeles are estimated to grow 6.4 per cent and Phoenix is expected to see an increase of 6.5 per cent. Current capacity and load factor data supports an additional 14 thousand direct arrivals to Las Vegas, and Hawaii is expected to welcome 18 thousand more Canadian visitors this summer. Direct Air Arrivals from Canada to Selected U.S. Destinations each Summer
Destination 2010 2011 2012 2013 2014 % change
2014 vs. 2013 CARG
(2010-2014) 2015f
Fort Lauderdale 106,289 110,191 108,540 120,868 142,981 18.3% 7.7% 153,984
Fort Myers 9,715 11,495 17,447 15,950 17,766 11.4% 16.3% 22,213
Miami 154,200 162,921 159,913 164,532 143,176 -13.0% -1.8% 173,873
Orlando 129,158 143,313 147,503 152,273 173,743 14.1% 7.7% 187,113
Palm Beach 73 405 130 169 0 -- -- 146
Sarasota 112 188 142 116 0 -- -- 3,799
Tampa 35,798 36,681 37,263 36,645 44,485 21.4% 5.6% 46,968
Total Florida 431,879 462,064 470,938 492,296 522,151 6.1% 6.2% 588,096
Hawaii 54,779 70,023 67,861 74,591 75,378 1.1% 8.3% 93,702
Las Vegas 297,621 370,937 370,271 370,638 449,098 21.2% 10.8% 463,744
Los Angeles 446,039 456,610 453,762 503,855 572,449 13.6% 6.4% 609,295
New Orleans 0 8,250 9,025 8,545 9,209 7.8% -- 10,685
Phoenix 124,440 156,440 155,427 154,856 157,688 1.8% 6.1% 167,963
Sources: Respective airport authorities. Hawaii figures are direct arrivals as reported by DBEDT. Summer 2015 figures are CBoC estimates. CARG=Compound Annual Rate of Growth
Summer Seat Capacity to select U.S. Destinations
2011 2012 2013 2014 2015f
% change 2015 vs. 2014
Hawaii 89,905 91,973 87,411 90,257 117,128 29.8%
Las Vegas 408,602 416,910 405,754 512,123 528,537 3.2%
Los Angeles 549,630 546,030 608,633 700,052 749,161 7.0%
Orlando 161,443 161,807 162,956 193,573 214,442 10.8%
Phoenix 185,632 189,151 190,382 195,537 207,386 6.1%
Sources: OAG, US BTS, and carrier websites.

Summer Outbound Travel Intentions 10 ©The Conference Board of Canada
Direct flights remain the most popular way for Canadians to get to Arizona, Hawaii, and Nevada this summer, however lower fuel prices seem to be affecting the plans of Florida-bound travellers. The proportion of travellers intending to visit Florida who plan to drive (25%) is up from 14 per cent last summer. Almost three-quarters (72%) of visitors to Nevada will fly directly, compared to 28 per cent of Canadians planning to visit Florida. Potential visitors to Hawaii and Florida are more likely to travel via a U.S. connection. However, a lot of new direct capacity as been added to these routes this summer, which may negate this trend as travellers find more direct options available to them. Fifty per cent of travellers planning to visit Hawaii and 56 per cent of travellers planning to visit Florida have not yet booked their trip. How Canadians Plan to Travel to Selected U.S. Destinations this Summer
Source: CBoC March 2015 travel intentions survey.
Using current capacity data and total visitation volumes from previous years, the percentage of indirect arrivals to various destinations can be estimated. Assuming carriers deliver reported capacity, Orlando can expect 322 thousand total arrivals from Canada during summer 2015. Las Vegas can expect 552 thousand arrivals and Phoenix 381 thousand arrivals. Direct and indirect arrivals to Hawaii are estimated at 161 thousand. Summer 2015 Direct and Indirect Arrival Estimates
Source: CBoC estimates.
29%
14%
18%
27%
25%
5%
10%
18%
9%
9%
13%
28%
72%
63%
60%
Florida
Nevada
Arizona
Hawaii
Fly with U.S. connection
Drive all the way
Drive to U.S. & fly
Direct flight
187,113
463,744
167,963
93,702
135,496
88,332
213,771
67,853
Orlando
Las Vegas
Phoenix
HawaiiDirect Arrivals
Indirect Arrivals

Summer Outbound Travel Intentions 11 ©The Conference Board of Canada
Europe
From May to October 2014, Canadians made more than 3 million visits to the 24 European countries for which visitor estimates are available, an increase of 0.5 per cent compared to summer 2013. Visitor volumes to France were significantly better than expected, likely due to events and ceremonies surrounding the 70th anniversary of D-Day. Other countries that did particularly well last summer include Ireland, Norway, and Portugal. After rebounding from the 2012 riots and economic instability, visits to Greece declined 37 per cent last summer. However, visitation volumes in 2013 were an anomaly prompted by pent-up demand. In 2014, Canadian arrivals to Greece were up 4.3 per cent compared to 2011--the last "normal" visitation year.
Canadian Visits to Selected European Countries
Country 2010 2011 2012 2013 2014 % change
2014 vs. 2013 CARG
2010 - 2014 2015f
Austria 67,791 72,987 70,150 70,010 72,129 2.9% 1.6% 71,071
Belgium 33,443 37,447 37,192 38,143 41,399 7.9% 5.5% 38,766
Bulgaria 11,038 11,602 12,310 13,241 15,317 13.6% 8.5% 14,879
Czech Republic 41,031 41,195 49,277 52,516 58,666 10.5% 9.3% 57,928
Croatia 37,735 44,836 50,190 60,008 72,250 16.9% 17.6% 68,903
Denmark 32,798 43,379 44,606 47,051 46,152 -1.9% 8.9% 48,567
Finland 7,452 8,605 10,076 9,929 10,472 5.2% 8.9% 10,630
France 539,592 575,217 566,678 598,695 739,608 19.1% 8.2% 772,089
Germany 186,171 186,785 196,546 193,521 187,926 -3.0% 0.2% 198,769
Greece 95,485 120,171 87,228 172,189 125,327 -37.4% 7.0% 155,079
Holland 82,709 85,965 89,873 91,175 92,476 1.4% 2.8% 96,915
Hungary 16,163 17,978 18,923 22,058 25,631 13.9% 12.2% 24,846
Ireland 62,997 70,211 78,104 88,086 114,688 23.2% 16.2% 119,528
Italy 448,305 473,499 452,751 479,427 481,650 0.5% 1.8% 500,792
Norway 15,198 18,570 20,129 29,342 36,629 19.9% 24.6% 32,305
Portugal 50,401 65,071 73,459 82,832 103,370 19.9% 19.7% 113,067
Romania 8,905 15,673 18,003 9,631 12,834 25.0% 9.6% 11,703
Slovenia 7,697 8,656 9,275 9,873 10,698 7.7% 8.6% 10,718
Serbia 3,332 3,321 3,975 4,771 4,750 -0.4% 9.3% 4,961
Spain 123,176 158,419 185,174 183,501 157,300 -16.7% 6.3% 167,986
Sweden 12,592 13,545 13,639 15,017 14,743 -1.9% 4.0% 15,508
Switzerland 66,522 63,738 67,408 68,309 68,809 0.7% 0.8% 71,448
Turkey 116,698 147,253 139,022 148,259 144,424 -2.7% 5.5% 152,514
UK 455,000 481,000 451,000 507,000 469,000 -8.1% 0.8% 471,653
Total 2,522,232 2,765,123
2,869,804
3,093,445
3,106,248
0.4% 5.3% 3,230,497
Sources: Statistical agencies for each country. CARG=Compound Annual Rate of Growth
The selling climate for Europe this summer is fairly stable. Intentions to visit Europe stayed steady at approximately one-fifth of outbound summer travellers. In addition, 17 per cent of Canadians who travelled outside of Canada and the U.S. last summer plan to visit Europe this summer. This is down from 18 per cent in 2014, but up from 16 per cent in 2013. A weakening Euro will support travel to the region and the aging population should bode well for short- and medium-term trip volumes. Those who are planning a trip to Europe are older than travellers to other regions. Forty-one per cent of Canadians planning a trip to Europe this summer are 55 or older.

Summer Outbound Travel Intentions 12 ©The Conference Board of Canada
Proportion of Outbound Travellers1 Planning a Summer Trip to Europe
Source: CBoC summer travel intentions surveys. Surveys had a sample of 1,500 with a margin of error of +/- 2.4%. 1 Canadians who reported taking an outbound summer trip in the previous year .
Summer Seat Capacity
Scheduled carriers plan to offer 4.25 million seats to Europe from Canada during summer 2015, which is 295 thousand more seats than they provided in 2014. This 7.5% increase is largely due to significant new capacity from Air Canada who plans to add 258 thousand seats this summer. As part of the carrier's ongoing international network expansion, summer 2015 additions include new Air Canada rouge seasonal service from Montreal to Venice, year-round flights to Amsterdam from Toronto, twice-daily service to Paris from both Toronto and Montreal, and increased capacity to Barcelona and Athens. Compared to 2014, WestJet will add 26 thousand seats in 2015 by further expanding its service to Dublin and introducing new capacity to Glasgow. Together, KLM and Lufthansa will add almost 50 thousand seats from Canada this summer through expanded service to Amsterdam (KLM), Frankfurt (LH), and Munich (LH). Direct seat capacity is expected to expand the most to Greece, Iceland, Spain, and Ireland, as well the Netherlands and Italy. On the other hand, Finland, Germany, Austria, and Belgium are expected to receive fewer direct seats from Canada during summer 2015. Direct Seat Capacity from Canada to Europe each Summer on Scheduled Carriers (millions of seats)
Source: OAG Summer Seat Capacity by European Country
Country 2014 2015 % change Country 2014 2015 % change
Austria 40,538 40,186 -0.9% Ireland 111,406 134,483 20.7%
Belgium 114,463 113,772 -0.6% Italy 258,925 299,203 15.6%
Denmark 41,796 43,303 3.6% Netherlands 297,214 347,517 16.9%
Finland 13,279 12,401 -6.6% Portugal 100,399 101,170 0.8%
France 707,750 777,724 9.9% Spain 95,344 121,269 27.2%
Germany 675,710 663,466 -1.8% Switzerland 139,001 152,733 6.8%
Great Britain 1,119,499 1,143,435 2.1% Turkey 107,672 110,892 3.0%
Greece 57,867 96,205 66.3% Total 3,953,170 4,252,736 7.5%
Iceland 72,307 94,977 31.4% Source: OAG
2.57 2.743.12 3.16
3.66 3.643.45 3.59
3.77 3.73 3.653.95
4.25
2003 2004 2005 2006 2007 2008 2009 2010 2011 2012 2013 2014 2015
15%
16%
18%
17%
Summer 2012
Summer 2013
Summer 2014
Summer 2015

Summer Outbound Travel Intentions 13 ©The Conference Board of Canada
Summer Seat Capacity to Europe by Carrier (direct flights)
Carrier Summer
2014 Summer
2015 %
Change
Carrier Summer
2014 Summer
2015 %
Change
Aer Lingus 32,214 32,037 -0.5% Finnair 13,279 12,401 -6.6%
Air Canada 1,483,366 1,741,330 17.4% Icelandair 72,307 94,977 31.4%
Air France 258,499 273,630 5.9% Jet Airways 53,100 49,312 -7.1%
Air Transat 817,158 809,172 -1.0% KLM 251,033 271,715 8.2%
Alitalia 49,018 44,797 -8.6% Lufthansa 265,590 294,384 10.8%
Arkefly 4,811 5,519 14.7% Sata International 48,174 35,520 -26.3%
Austrian Airlines 40,538 40,186 -0.9% Swiss/Crossair 42,952 42,952 0.0%
British Airways 295,583 268,340 -9.2% Turkish Airlines 71,718 75,740 5.6%
Condor Flugdienst 64,362 62,907 -2.3% Virgin Atlantic 23,202 -- --
Corsair 42,000 36,128 -14.0% WestJet 17,952 44,064 145.5%
Edelweiss Air 10,298 17,625 71.1% Total 3,957,154 4,252,736 7.5%
Source: OAG and carrier websites
Summer Arrivals Outlook
After a season of very little growth, Canadian trips to Europe are expected to rebound in 2015. Growth is estimated at 4.0% for the May-October period. Following two consecutive years of increased arrivals, visitation to Spain dropped off in 2014, but is expected to remain stable in 2015 due to an increase in direct seat capacity. Visits to Greece, Ireland, and Italy will also be positively impacted by increased seat capacity this summer. The availability of 50 thousand additional seats to Amsterdam and 48 thousand more seats to Paris will impact travel volumes to the Netherlands and France, as well as many other connecting destinations. After a significant rebound in 2013, visits to the UK saw modest growth in 2014. The region is expected to maintain visitor interest throughout 2015, even as its overall share of visitors continues to decline.
Caribbean & Mexico
Continuing the trend of increased travel to "sun destinations" in the summer months, 20 per cent of Canadians plan to take a trip to the Caribbean or Mexico this summer. This is up from 17 per cent in summer 2014. Furthermore, of Canadians who took an outbound trip in 2014, 17 per cent intend to go south this summer. Just 15 per cent of outbound travellers in 2013 planned to vacation in the Caribbean or Mexico during summer 2014. Canadians continue to be attracted to the region by guaranteed sun and cost-effective package options. Proportion of Outbound Travellers
1 Planning a Summer Trip to the Caribbean/Mexico
Source: CBoC summer travel intentions surveys. Surveys had a sample of 1,500 with a margin of error of +/- 2.4%. 1 Canadians who reported taking an outbound summer trip in the previous year .
12%
10%
15%
17%
Summer 2012
Summer 2013
Summer 2014
Summer 2015

Summer Outbound Travel Intentions 14 ©The Conference Board of Canada
Summer Seat Capacity
Carriers have responded to the increase in demand for travel to the Caribbean and Mexico over the summer period. Following steady growth over the past decade, seat capacity on scheduled carriers is again on the rise. According to current OAG data, carriers plan to offer 1.69 million seats to southern destinations during summer 2015, an increase of 19%. Direct Seat Capacity from Canada to the Caribbean and Mexico each Summer on Scheduled Carriers
Source: OAG
Canadian Visits to the Caribbean and Mexico each Summer
Country 2011 2012 2013 2014 % change
2014 vs. 2013 CARG
2011 - 2014 2015f
Anguilla 823 900 1,120 994 -11.3% 6.5% 1,065
Antigua 5,594 5,194 7,766 6,811 -12.3% 6.8% 6,726
Aruba 11,036 14,623 14,042 13,113 -6.6% 5.9% 13,210
Bahamas 36,756 43,396 41,317 45,170 9.3% 7.1% 47,555
Barbados 22,547 21,149 20,950 20,697 -1.2% -2.8% 19,815
Belize 4,283 5,801 6,929 6,150 -11.2% 12.8% 6,605
Bermuda 14,353 15,625 14,483 15,675 8.2% 3.0% 15,852
Cayman Islands 6,166 5,719 6,304 6,498 3.1% 1.8% 6,605
Costa Rica 27,813 34,330 38,916 40,763 4.7% 13.6% 40,644
Cuba 273,375 299,924 309,658 326,217 5.3% 6.1% 352,700
Curacao 1,550 1,704 1,650 1,611 -2.4% 1.3% 1,834
Dominica 1,224 1,368 1,331 1,221 -8.2% -0.1% 1,343
Dominican Republic 129,476 138,300 153,666 175,382 14.1% 10.6% 192,862
Grenada 2,908 3,130 3,792 5,603 47.7% 24.4% 4,241
Guatemala 15,155 17,968 15,458 13,646 -11.7% -3.4% 14,531
Jamaica 102,115 115,659 126,098 141,984 12.6% 11.6% 138,702
Mexico 347,280 335,488 361,249 377,433 4.5% 2.8% 408,181
Panama 13,620 15,036 12,323 14,995 21.7% 3.3% 15,852
Puerto Rico 5,436 6,686 6,514 5,613 -13.8% 1.1% 7,047
St. Kitts/Nevis 2,279 2,120 1,824 2,163 18.6% -1.7% 2,609
St. Lucia 10,493 10,376 10,020 10,278 2.6% -0.7% 10,568
St. Maarten 7,234 10,278 10,953 11,364 3.8% 16.2% 10,996
St. Vincent 2,333 2,820 2,782 2,822 1.4% 6.5% 2,642
Total 1,043,849 1,107,593 1,169,144 1,246,202 6.6% 6.1% 1,320,974
Sources: respective government agencies for each country and CTO. Forecast is by CBoC.
146,987
177,976
195,138
231,394
222,620
253,819
268,007
313,376
323,033
389,593
475,565
299,774
313,541
321,514
335,939
387,375
538,858
576,932
612,876
711,707
1,030,833
1,214,412
2005
2006
2007
2008
2009
2010
2011
2012
2013
2014
2015
Mexico
Caribbean

Summer Outbound Travel Intentions 15 ©The Conference Board of Canada
Responsible for 56.5 per cent of visits in May-October 2014, Mexico and Cuba are the top destinations in the region for summer visitors. Coinciding with the increase in demand, direct seat capacity to both Cuba and Mexico is up significantly this summer. Carriers plan to offer 116 thousand more seats to Cuba and 86 thousand additional seats to Mexico. Both Aeromexico and Air Canada are offering more seats to Mexico City this summer, while Sunwing is increasing capacity to Cancun and San José del Cabo. Summer Seat Capacity by Caribbean Country
Destination Summer 2012 Summer 2013 Summer 2014 Summer 2015 % change
Antigua 6,538 10,152 9,970 10,438 4.7%
Aruba 8,442 11,570 11,780 11,736 -0.4%
Bahamas 40,844 45,023 51,352 61,509 19.8%
Barbados 40,152 36,386 38,248 36,496 -4.6%
Bermuda 32,636 21,836 31,837 30,554 -4.0%
Cayman Islands 6,047 6,183 8,813 8,910 1.1%
Costa Rica 5,686 11,424 12,096 12,708 5.1%
Cuba 240,167 278,817 386,139 502,560 30.2%
Dominican Republic 81,224 123,810 165,126 211,107 27.8%
Jamaica 127,122 145,789 184,281 190,315 3.3%
Mexico 313,376 323,033 389,593 475,565 22.1%
Panama 16,244 16,275 28,836 47,400 64.4%
Puerto Rico 3,702 3,702 3,702 3,928 6.1%
Saint Lucia 13,312 13,584 13,584 13,568 -0.1%
St Maarten 3,672 7,238 7,268 7,358 1.2%
Trinidad/Tobago 53,312 68,606 67,066 55,326 -17.5%
Turks & Caicos 9,018 7,617 10,735 10,499 -2.2%
Total 1,001,494 1,131,045 1,420,426 1,689,977 19.0%
Source: OAG
CanJet and Sunwing are also adding service to a number of destinations in Cuba and the Dominican Republic, including Cayo Coco, Holguin, Santa Clara, and Varadero in Cuba, and Puerto Plata and Punta Cana in the Dominican Republic. In addition, Cubana Airlines has significantly increased their capacity to Santiago de Cuba and Varadero. Summer Seat Capacity to the Caribbean and Mexico by Carrier (direct flights)
Carrier Summer
2014 Summer
2015 %
Change
Carrier Summer
2014 Summer
2015 %
Change
Aeromexico 29,224 51,920 77.7% Cubana 40,144 66,680 66.1%
Air Canada 354,058 386,293 9.1% Fly Jamaica 5,694 2,376 -58.3%
Air Transat 206,484 221,777 7.4% Sunwing 347,193 469,476 35.2%
CanJet Airlines 34,965 -- United Airlines 213 -- --
Caribbean Airlines
54,208 52,668 -2.8% WestJet 354,372 365,902 3.3%
Copa Airlines 28,836 37,920 31.5% Total 1,420,426 1,689,977 19.0%
Summer Arrivals Outlook
Even though Canadian travel to the Caribbean and Mexico is slowing down, total arrivals are expected to grow this summer compared to summer 2014. The CAD-USD exchange rate as well as increased prices in the Caribbean will restrain overall trip volumes, but increased capacity to destinations such as Cuba and the Bahamas will help keep visitation levels to the region steady. Competition from popular Caribbean destinations as well as Central and South America will moderate visit growth to Mexico, but good vacation value and significant new capacity will keep it the number one sun destination for Canadians in 2015. Indeed, one-fifth of Canadians who plan to take an outbound trip this summer plan to travel to Mexico and the Caribbean, up from 17 per cent in 2014 and 14 per cent in 2013.

Summer Outbound Travel Intentions 16 ©The Conference Board of Canada
Asia and the South Pacific
Canadians made over 1.04 million visits to the Asia/Pacific region during summer 2014, an increase of just 0.6 per cent compared to summer 2013. Almost 15 thousand fewer Canadians visited China last summer, while Thailand experienced a decline of 9 thousand arrivals. In contrast, Japan (+20%) and South Korea (+11%) both experienced double-digit growth during the season. Canadian Visits to Asia/Pacific Countries each Summer
Country 2011 2012 2013 2014 % change
2014 vs. 2013 CARG
2011 - 2014 2015f
Australia 44,700 44,500 45,000 49,400 9.8% 3.4% 50,182
Cambodia 15,276 17,045 17,379 17,668 1.7% 5.0% 16,436
China 371,300 347,300 342,200 327,400 -4.3% -4.1% 332,455
Fiji 6,798 6,525 6,566 6,144 -6.4% -3.3% 6,022
Hong Kong 193,922 181,935 162,976 163,078 0.1% -5.6% 162,046
Japan 46,269 65,364 75,566 90,881 20.3% 25.2% 96,182
Malaysia 39,838 40,541 38,740 40,826 5.4% 0.8% 41,818
New Zealand 15,012 12,752 12,608 13,072 3.7% -4.5% 13,277
Philippines 45,656 47,790 49,922 54,820 9.8% 6.3% 57,500
Singapore 29,312 29,909 31,907 31,341 -1.8% 2.3% 30,318
South Africa 26,164 30,754 30,414 26,797 -11.9% 0.8% 26,136
South Korea 65,149 67,117 72,029 79,660 10.6% 6.9% 83,636
Sri Lanka 12,616 15,170 15,807 16,688 5.6% 9.8% 14,446
Thailand 79,729 86,016 90,384 81,411 -9.9% 0.7% 76,318
Vietnam 40,417 41,417 42,601 41,068 -3.6% 0.5% 38,682
Total 1,032,158 1,034,135 1,034,099 1,040,254 0.6% 0.3% 1,045,455
Sources: respective government agencies. Forecast is by CBoC.
Summer Seat Capacity
Direct seat capacity to the Asia/Pacific region is expected to grow by 9.0 per cent this summer, with flights to Japan and China representing more than half of the increase (138 thousand seats). Air Canada and China Eastern Airlines plan to add 64 thousand seats to China this summer, while All Nippon Airways along with Air Canada are adding 78 thousand seats to Japan. Philippine Airlines is expected to increase capacity by 38% compared to summer 2014. Air Canada continues to dominate the market providing 42% of all direct seat capacity to the region in the summer months. After reporting the best quarter in the airline's 77-year history, Air Canada has accelerated its international expansion plans, which include the new twice-daily Air Canada rouge service between Vancouver and Osaka in summer 2015. Summer Seat Capacity to the Asia/Pacific Region by Country
Destination Summer 2012 Summer 2013 Summer 2014 Summer 2015 % change Australia 100,710 101,520 103,145 115,872 12.3% China 692,907 812,099 864,491 930,866 7.7% Chinese Taipei 214,062 199,310 215,080 228,964 6.5% Hong Kong 639,232 614,668 664,525 672,765 1.2% India 61,560 -- -- 9,972 -- Indonesia 31,680 26,040 9,000 -- -- Japan 343,722 362,161 413,623 485,431 17.4% New Zealand 50,614 63,536 64,464 68,440 6.2% Pakistan 48,670 54,038 58,135 51,324 -11.7% Philippines 112,486 134,472 133,704 184,488 38.0% South Korea 242,480 232,720 221,007 247,490 12.0%
Total 2,538,123 2,600,564 2,747,174 2,995,612 9.0% Source: OAG

Summer Outbound Travel Intentions 17 ©The Conference Board of Canada
Summer Arrivals Outlook
A nominal increase in travel to the Asia/Pacific region is expected this summer. Just 6 per cent of outbound travellers intend to visit the region in the coming months. Additional capacity to countries such as Australia, China, and Japan will prop up arrivals to these countries. However, a lack of direct seat capacity, costly airfare, and high prices in destinations like Australia, Hong Kong and Singapore will constrain visit growth to the region. That said, Australia remains the top destination in the Asia/Pacific region that Canadians have the most interest in visiting
during the next three years. Destinations that rounded out the top five include New Zealand, Thailand, Japan, and China.
Asia/Pacific Countries Most Interested in Visiting (2015-2017)
Source: CBoC June 2014 survey of Canadians that had take 1+ leisure trips outside country of 6+ nights in the past three years.
14.2%
8.7% 8.5% 7.9%
6.0% 5.5% 5.3% 4.8% 4.4% 4.3%
Australia New Zealand Thailand Japan China Hong Kong Fiji India Vietnam Philippines