outlook 2016 spread
TRANSCRIPT

7/23/2019 Outlook 2016 Spread
http://slidepdf.com/reader/full/outlook-2016-spread 1/15

7/23/2019 Outlook 2016 Spread
http://slidepdf.com/reader/full/outlook-2016-spread 2/15
2 3
LPL Research expects to see routine year-end outcomes in many areas of the economy
and financial markets in 2016, but how we get there may be anything but routine. Certainconditions have been unusual for so long, that 2016 may hold some unexpected turns that
could catch some investors unprepared, and it will take a solid investment plan to navigate it.
Some of our expectations, as we follow what may be an unfamiliar path for 2016, include:
U.S. economic growth of 2.5 – 3%. However, the mix of that growth may look
different than in 2015, with manufacturing, business capital spending, and net exports
taking larger roles. Labor markets are almost back to long-term expectations, and
inflation may be poised to accelerate. An extraordinary extended period of loose
monetary policy in the United States should start to normalize.
Mid-single-digit returns for the S&P 500. Stocks, we believe, will not collapse,
as many think, or soar, as many hope, but may offer near historical routine returns.
Earnings may start to normalize, and oil markets should find their equilibrium.
International markets may re-emerge as a more viable investing opportunity. But we
are still in the second half of the economic cycle, and investors need to be vigilant
about monitoring pockets of volatility and potential signs of an economic downturn.
Limited returns for bonds. The year as a whole may look similar to 2015, with bond
prices facing the challenges of high valuations, steady economic growth, and the
prospect of interest rate hikes. But bonds still play a vital role in investors’ portfolios,
to help with risk mitigation and diversification.
For some investors, progress toward their financial goals has been hur t by breaking
with well-considered investing routines in response to one of the most maligned bull
markets in history. LPL Research’s Outlook 2016 will help investors stick to their routines
in the face of developments that may seem anything but routine. By maintaining ourinvestment process, we can focus on what matters most to markets, block out short-
term distractions that will quickly fade, and turn a good daily routine into the potential for
successful long-term performance.

7/23/2019 Outlook 2016 Spread
http://slidepdf.com/reader/full/outlook-2016-spread 3/15
4
5
W e expect the Fed t o begin a t ightening cycle for the first t ime in over 10 years in December 2015 or early2016. Alt hough t his may signal t hat t he Fed believes t he U.S. economy is ready t o s t and o n it s ow n t wo f eet , likely providing a positive backdrop f or stocks, it may also increase volatility. Expected policy divergence among major global cent ral banks shouldhelp support global growth while also potentially creating invest ment opportunities.
W e believe that oil prices may begin to stabilize in 2016wit h abias to the upside as supply and demand continue to move int o balance. Greater stability would help support U.S. economic growth by encouraging capit alspending and would impact a wide range of assetclasses beyond direct energy-related investment s,including emerging market st ocks and high-yield bonds.
As t he headwinds that have restrained earnings begin to subside, including falling oil prices, a strong U.S. dollar, m anuf act uring weakness, an d slowing growth in China, we believe earnings growth will accelerate.Resumption of earnings growth is key to stock market perf ormance in 2016 and we expect it t o be t he foundation of another year of posit ive returns.
Dev, m-ek my g F i r a.
Wl a u y mg vs gw.
Atv ua ky o m f my muu.
Lw yd, xevua, grasy iga m p.
Lw yd m U.S. un uey ik mk uav ik/rwd.
Bef m gg U.S.m x mg vs gw.
Lg-m ual av m
gw vl mkmy up c.
Img vs gw ky o m mrqunav g.
Ted d bt u y bf mmvd g gw.
Ca hvily d ubt dug d iga a c rm y.
L sv ig a my nu bf
m w du megy s xur.
Cue mkeme — gvme cn k y dvgec,w mda ay — udb u s ag.
F ght ei g Cyl
KEY HEME S T W ACH
St blzi g Ol Pr c s
Ea i gs R boun
We believe we are likely in the second half of the economic cycle, but 2016 may be the first typicalmid-cycle year of the expansion. Planning around potentially increased volatility, rising interes t rates,and improving global growth will help investors get back to that routine.
DON’ FORGE!
HOW T INVE S
N n Rcmedan
& Inv e In
7/23/2019 Outlook 2016 Spread
http://slidepdf.com/reader/full/outlook-2016-spread 4/15
6 7
3.5
3.0
2.5
2.0
1.5
1.0
0.5
0.0
-0.5
-1.0
%
20142013201220112010 YTD2015
Government
Total GDP
Contribution to GDP Growth by Economic Sector, %
Ne t E xp or ts I nv en tor ies H ous ing Bu sin es s S pendin g C on su me r S pen ding
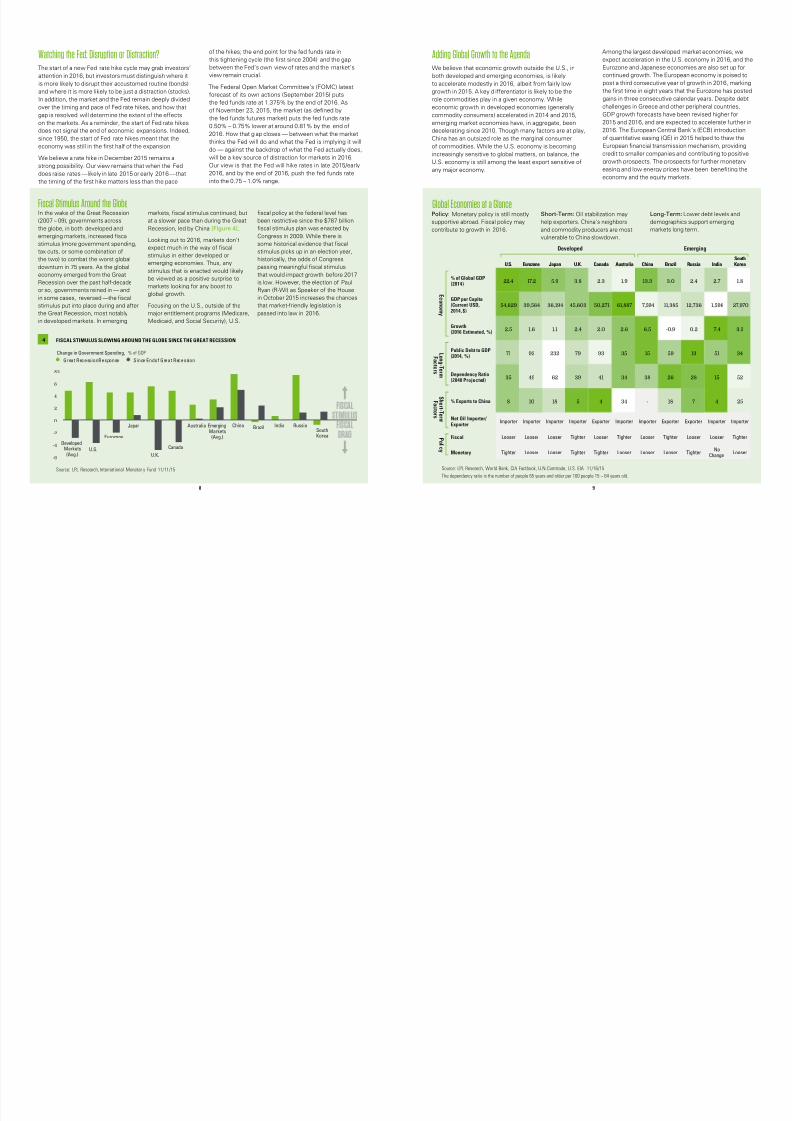
Our view is that the U.S. economy — as measured by
real gross domestic product ( GDP) — is likely to post
growth of 2.5 – 3.0% in 2016, below its post-World War II
average of 3.2%, but above the 2 – 2.5% average growth
rate seen in the first six-and-a -half years of this expansion,
based on the factors discussed below. Despite the lengthof the current expansion (already the fourth longest on
record), it has not followed what would be considered
a routine path. Supportive monetary policy from the
Federal Reserve (Fed) has remained in place throughout
the expansion; economic growth, while steady, has been
below trend; and inflation, which often picks up near the
middle of the cycle, remains near cycle lows. While we
believe we are likely in the second half of the economic
cycle, 2016 may be the first typical mid-cycle year of the
expansion, and investors may need to figure out what it
means to get back to that routine.
Returning to Our Typical Sources for GrowthAs we plan ahead for 2016, the mix of economic growth
may look a bit different than in 2015, with manufacturing,
business capital spending, and net exports potentially
taking larger roles. The manufacturing economy isstabilizing after a difficult 18-month period (mid-2014
to late 2015) and may accelerate further. The housing
sector is expected to contribute to growth for the
sixth consecutive year, and the consumer sector may
continue adding to growth, benefiting from low energy
prices, record levels of household net worth, and still
low consumer interest rates. Business capital spending
struggled in late 2014 and throughout 2015 amid the
collapse in oil prices and stronger U.S. dollar. We believe
oil prices may move modestly higher as demand remains
strong and, as we’ve started to see in 2015, supply comes
down. Business capital spending may add to growth in
2016 as commodity prices stabilize [Figure 1].
The hallmark of this current economic expansion
has been underinvesting, especially in research and
development, and while we do not expect a boom in
2016, there is potential for some catch-up spending. Net
exports, which were a sizable drag on growth in b oth
2014 and in the first three quarters of 2015, may stabilize
as the dollar consolidates after the 20%+ gain between
mid-2014 and mid-2015 — matching the largest 12-month
increase in the value of the dollar versus its major trading
partners since the dollar went off the gold standard in the
early 1970s [Figure 2]. We expect the dollar will begin
to stabilize as central bank policies and the outcomes of
those policies become clearer. A stabilizing do llar should
help to boost exports and remove a key headwind for
manufacturing and profits of U.S. corporations.
Continued Progress for Employment & WagesWe expect continued progress in the U.S. labor market
in 2016, with the economy generating enough jobs tonudge the unemployment rate ever closer to the elusive
“full employment” range, the level at which, in the past,
businesses need to raise wages to attract and retain
skilled employees. Wage growth has been limited but
should continue to accelerate in 2016 [Figure 3]. This
acceleration in wages — if not accompanied by better
economic growth — may cause headaches for the Fed as
it begins to normalize policy in 2016. We expect the Fed
to begin raising rates in late 2015 or early 2016, with our
focus on the pace of hikes throughout 2016 and beyond.
Checking Off InflationInflation remains in check, but commodity/goods infl
may be poised to make a comeback, which would he
keep the Fed on schedule to begin raising rates. Sinc
the middle of 2009, prices of services in the econom
(as measured by the Consumer Price Index [ CPI] for
services) accelerated from under 1.0% to as high as
in early 2014, and then settled into a range of 2 – 2.5
Prices of services (medical services, rents, etc.) acco
for over two-thirds of overall CPI, and history sugges
that as the business cycle ages, and as the housing a
labor markets tighten, service inflation may continue
accelerate. The Fed has to watch this closely.
However, the CPI for goods (prices of oil and other
commodities purchased by consumers) sank along w
oil prices from mid-2014 through late 2015. This kep
the U.S. economy flirting with deflation (a prolonged
period of falling wages and prices). Overall CPI postea 2.1% year-over-year gain in mid-2014, and by the e
of October 2015, the overall CPI was just 0.2%. Loo
ahead to 2016, if oil prices move up as we expect, th
goods portion of CPI may increase by 2 – 3%; and if
pace of service sector inflation remains between 2%
and 2.5%, overall CPI will accelerate quickly and ma
well over 2.0% by year-end. By then, the Fed will ha
already begun raising rates.
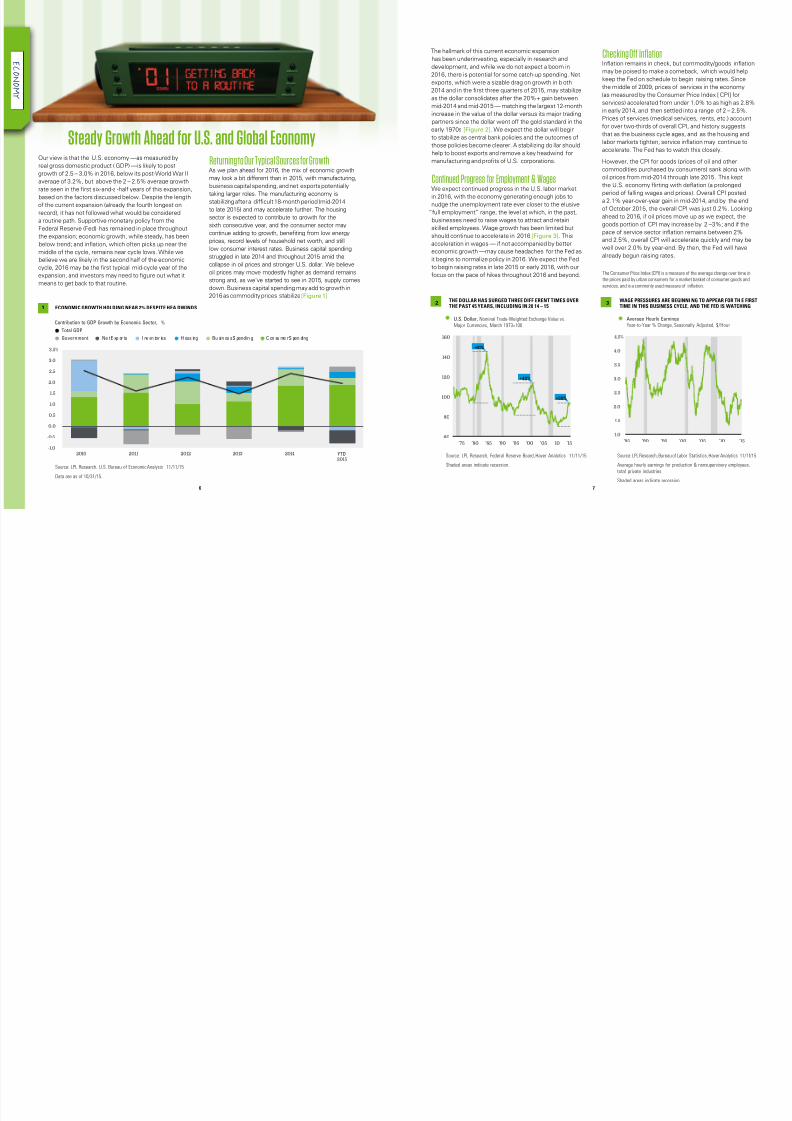
Steady Growth Ahead for U.S. and Global Economy
1 ECONOMIC GROWTH HOLDING NEAR 2% DESPITE HEA DWINDS
Source: LPL Research, U.S. Bureau of Economic Analysis 11/11/15
Data are as of 10/31/15.
3 WAGE PRESSURES ARE BEGINNI NG TO APPEAR FOR THTIME IN THIS BUSINESS CYCLE, AND THE FED IS WATC
Source: LPL Research, Bureau of Labor Statistics, Haver Analytics
Average hourly earnings for production & nonsupervisory employ
total private industries
Shaded areas indicate recession.
4.5
4.0
3.5
3.0
2.5
2.0
1.5
1.0
%
’05’00’95’90’85 ’10 ’
Average Hourly Earnings
Year-to-Year % Change, Seasonally Adjusted, $/Hour
2THE DOLLAR HAS SURGED THREE DIFF ERENT TIMES OVERTHE PAST 45 YEARS, INCLUDING IN 20 14 – 15
Source: LPL Research, Federal Reserve Board, Haver Analytics 11/11/15
Shaded areas indicate recession.
160
140
120
100
80
60
’05’00’95’90’85’80’75 ’10 ’15
U.S. Dollar, Nominal Trade-Weighted Exchange Value vs.
Major Currencies, March 1973=100
+38%
+42%
+61%
The Consumer Price Index (CPI) is a measure of the average change over timthe prices paid by urban consumers for a market basket of consumer goods
services, and is a commonly used measure of inflation.
7/23/2019 Outlook 2016 Spread
http://slidepdf.com/reader/full/outlook-2016-spread 5/15
8 9
Watching the Fed: Disruption or Distraction?The start of a new Fed rate hike cycle may grab investors’
attention in 2016, but investors must distinguish where it
is more likely to disrupt their accustomed routine (bonds)
and where it is more likely to be just a distraction (stocks).
In addition, the market and the Fed remain deeply divided
over the timing and pace of Fed rate hikes, and how that
gap is resolved will determine the extent of the effects
on the markets. As a reminder, the start of Fed rate hikes
does not signal the end of economic expansions. Indeed,
since 1950, the start of Fed rate hikes meant that the
economy was still in the first half of the expansion.
We believe a rate hike in December 2015 remains a
strong possibility. Our view remains that when the Fed
does raise rates — likely in late 2015 or early 2016 — that
the timing of the first hike matters less than the pace
of the hikes; the end point for the fed funds rate in
this tightening cycle (the first since 2004) and the gap
between the Fed’s own view of rates and the market’s
view remain crucial.
The Federal Open Market Committee’s (FOMC) latest
forecast of its own actions (September 2015) puts
the fed funds rate at 1.375% by the end of 2016. As
of November 23, 2015, the market (as defined by
the fed funds futures market) puts the fed funds rate
0.50% – 0.75% lower at around 0.81% by the end of
2016. How that g ap closes — between what the market
thinks the Fed will do and what the Fed is implying it will
do — against the backdrop of what the Fed actually does,
will be a key source of distraction for markets in 2016.
Our view is that the Fed will hike rates in late 2015/early
2016, and by the end of 2016, push the fed funds rate
into the 0.75 – 1.0% range.
Adding Global Growth to the AgendaWe believe that economic growth outside the U.S., in
both developed and emerging economies, is likely
to accelerate modestly in 2016, albeit from fairly low
growth in 2015. A key d ifferentiator is likely to be the
role commodities play in a given economy. While
economic growth in developed economies (generally
commodity consumers) accelerated in 2014 and 2015,
emerging market economies have, in aggregate, been
decelerating since 2010. Though many factors are at play,
China has an outsized role as the marginal consumer
of commodities. While the U.S. economy is becoming
increasingly sensitive to global matters, on balance, the
U.S. economy is still among the least export sensitive of
any major economy.
Among the largest developed market economies, we
expect acceleration in the U.S. economy in 2016, and
Eurozone and Japanese economies are also set up fo
continued growth. The European economy is poised
post a third consecutive year of growth in 2016, mar
the first time in eight years that the Eurozone has po
gains in three consecutive calendar years. Despite de
challenges in Greece and other peripheral countries,
GDP growth forecasts have been revised higher for
2015 and 2016, and are expected to accelerate furthe
2016. The European Central Bank’s (ECB) introductio
of quantitative easing (QE) in 2015 helped to thaw th
European financial transmission mechanism, providin
credit to smaller companies and contributing to posit
growth prospects. The prospects for further moneta
easing and low energy prices have been benefiting t
economy and the equity markets.
Fiscal Stimulus Around the GlobeIn the wake of the Great Recession
(2007 – 09), governments across
the globe, in both developed and
emerging markets, increased fiscal
stimulus (more government spending,
tax cuts, or some combination of
the two) to combat the worst global
downturn in 75 years. As the global
economy emerged from the Great
Recession over the past half-decade
or so, governments reined in — and
in some cases, reversed — the fiscal
stimulus put into place during and after
the Great Recession, most notably
in developed markets. In emerging
markets, fiscal stimulus continued, but
at a slower pace than during the Great
Recession, led by China [Figure 4].
Looking out to 2016, markets don’t
expect much in the way of fiscal
stimulus in either developed or
emerging economies. Thus, any
stimulus that is enacted would likely
be viewed as a positive surprise to
markets looking for any boost to
global growth.
Focusing on the U.S., outside of the
major entitlement programs (Medicare,
Medicaid, and Social Security), U.S.
fiscal policy at the federal level has
been restrictive since the $787 billion
fiscal stimulus plan was enacted by
Congress in 2009. While there is
some historical evidence that fiscal
stimulus picks up in an election year,
historically, the odds of Congress
passing meaningful fiscal stimulus
that would impact growth before 2017
is low. However, the election of Paul
Ryan (R-WI) as Speaker of the House
in October 2015 increases the chances
that market-friendly legislation is
passed into law in 2016.
SouKor
1.
27,9
3.
34
5
2
Impo
Tigh
Loo
India
2.7
1,596
7.4
51
15
4
Importer
Looser
NoChange
Russia
2.4
12,736
0.2
13
28
7
Exporter
Looser
Tighter
Brazil
3.0
11,385
-0.9
59
26
18
Exporter
Tighter
Looser
China
13.3
7,594
6.5
15
38
-
Importer
Looser
Looser
Australia
1.9
61,887
2.6
35
34
34
Importer
Tighter
Looser
Canada
2.3
50,271
2.0
93
41
4
Exporter
Looser
Tighter
U.K.
3.8
45,603
2.4
79
39
5
Importer
Tighter
Tighter
Japan
5.9
36,194
1.1
232
62
18
Importer
Looser
Looser
Eurozone
17.2
39,564
1.6
92
49
10
Importer
Looser
Looser
U.S.
22.4
54,629
2.5
71
35
8
Importer
Looser
Tighter
% of Global GDP(2014)
GDP per Capita(Current USD,2014, $)
Growth(2016 Estimated, %)
Public Debt to GDP(2014, %)
Dependency Ratio(2040 Projected)
% Exports to China
Net Oil Importer/ Exporter
Fiscal
Monetary
Source: LPL Research, World Bank, CIA Factbook, U.N. Comtrade, U.S. EIA 11/16/15
The dependency ratio is the number of people 65 years and older per 100 people 15 – 64 years old.
Global Economies at a Glance
Developed Emerging
E c o n o m y
L o n g -T e r m
F a c t o r s
S h o r t -T e r m
F a c t o r s
P o l i c y
4 FISCAL STIMULUS SLOWING AROUND THE GLOBE SINCE THE GREAT RECESSION
Source: LPL Research, International Monetar y Fund 11/11/15
8
6
4
2
0
-2
-4
-6
%
DevelopedMarkets
(Avg.)
RussiaIndiaBrazilChinaEmergingMarkets
(Avg.)
Australia
Canada
U.K.
Eurozone
U.S.
Great Recession Response Since End of Great Recession
Change in Government Spending, % of GDP
JapanSouthKorea
Policy: Monetary policy is still mostly
supportive abroad. Fiscal policy may
contribute to growth in 2016.
Short-Term: Oil stabilization may
help exporters. China’s neighbors
and commodity producers are most
vulnerable to China slowdown.
Long-Term: Lower debt levels and
demographics support emerging
markets long term.

7/23/2019 Outlook 2016 Spread
http://slidepdf.com/reader/full/outlook-2016-spread 6/15
10 11
%50
40
30
20
10
0
-10
-20
-30
’13’12’11’10’09’08’07’06’05 ’14
C ons um er S pendi ng Go ver nm en t S pen ding I nv es tm en t E xpor ts I mpor ts
Percentage of China GDP
Unless there is meaningful acceleration
in Eurozone inflation and economic
growth, we believe the ECB is likely
to extend, and even possibly increase,
its QE program in 2016, or even at its
final policy meeting of 2015 (set for
December 3, 2015), to head off deflation.
Another round of monetary stimulus
should continue to foster improvement
in the European banking system. Despite
positive progress, risks loom in the
Eurozone, and in the wider European
Union (EU). The recent influx of
immigration from outside the EU into key
EU economies will continue to generate
headlines and skew political discussions
(and elections) away from pro-growth
economic policies and reforms. Though
there are no national elections in majorcountries scheduled for 2016, regional
elections in the U.K. and Germany are
giving voice, if not power, to the more
radical and populist parties that cast
doubt on the future of the EU.
While teetering on recession for most of
2015, we expect marginal improvement
in Japan in 2016. How well its economy
and stock markets perform will likely be
determined by a combination of three
factors: additional QE, substantive economic reform, and
a weaker yen to benefit exports. The Bank of Japan (BOJ)
is in “wait and see” mode after enacting QE in early 2013
and increasing its size in late 2014, and is promising to do
more if GDP growth falters or deflation persists. Although
deteriorating demographics and large public debt levels
will continue to weigh on Japanese growth in the coming
years and decades, Japan is in a somewhat unique
position as most of its debt is held internally.
With respect to emerging markets, it’s
important to realize that there is really
no such thing as “emerging markets.”
Instead, there are a group of countries
with some common attributes, butjust as many differences. Emerging
market equity valuations have been
largely stagnant since 2011, whereas
developed markets, including the U.S.,
have seen a marked increase in equity
market valuation. The major difference
across the countries is the extent to
which they are impacted by commodity
prices. There are major splits between
commodity exporters, such
as Brazil and Russia, and
commodity importers, particularly
China, South Korea, and
Taiwan. Expected stabilization
in commodities should enable
commodity exporters to fare
better in 2016, though this may
take several months, or even
quarters, to fully develop.
Monitoring China’sGrowth ProspectsWe expect China’s official growth
to continue to slow in 2016 to the
6 – 7% range, in contrast to an
average annualized growth rate
of 9.5% over the past 10 years.
Concerns about a significant
slowdown in the Chinese
economy captured investors’
attention over the summer of
2015. We believe that China’s
true GDP growth rate is probably
2 – 3 percentage points below
official numbers. However, what
happened in 2014 or 2015 is less
important than where we go in
the future. Independent analysis
of Chinese GDP suggests that the economy is stabilizing,
again at lower than official levels. Though China needs to
be monitored, we view the potential for a “hard landing”
as remote.
These concerns related to China’s growth are
understandable given that China has provided
approximately 40% of the world’s economic growth
over the past five years (according to the World Bank).
Considering that impact, a hard landing (which we
define as 2% growth for the
Chinese economy) would
represent a significant reduction
in contribution to global growth.
Just as important as the absolute
level of growth in China is the
composition of that growth.
The Chinese economy is very dependent on investment
spending, largely driven by the government, even if the
entity involved is theoretically a private company [Figure
5]. China’s large population means its economic future
may be driven by consumer spending, similar to the shift
that occurred in the U.S. after World War II. However, it
will be years or even decades before Chinese consumers
are able to spend on par with their developed nation
counterparts. The Chinese government has put a lot
of emphasis on the transition to a consumer economy,
and we believe it will ultimately be successful, though
challenges remain and the economic road ahead is likely
to remain bumpy. More recently, China altered its “one
child” policy to allow people to have two children. It will
be years before any change impacts the workforce. But
should there be an increase in the number of children,
this may increase domestic spending.
One risk is that China’s notoriously volatile stock market
will cause a pullback in consumer spending. Although
Chinese stocks are not closely tied to the global economy,
a significant downdraft could cause ripple effects in
global markets. The Chinese government was widely
criticized internally and externally for its heavy-hande
actions in dealing with declines in the stock market.
Some of those policies, such as the suspension of in
public offerings (IPO), have already been rescinded.
Another China-related risk is its debt levels. China’s
investment boom was spurred by additional debt to
counter the impact of the global recession in 2008 .
While this increase in debt is problematic, China has
vast financial resources (more than $3 trillion in fore
reserves, plus assets of state-owned enterprises [SO
that the government could use to mitigate the risk
of a catastrophic, 2008- like event. Importantly, most
of China’s debt is held internally. Should the Chinese
government need to intervene to help manage any d
related issues, it will not need approval from any out
sources of funding. In this respect, China is more like
Japan and less like Greece or some of the other heav
indebted European countries.EMERGING MA RKE T S
Fo bl luaos,s o g d moghc rns, n o e l fos mulus supo v of gow h fo m gi g m k stcks.
DEVELOP
INERNIONA L
W b v dv p
nan k
y u p
U. S. 2016. Eup ,
pcu, i
rcv y hn U.S.,
ug pe ly
n n
w v s, w
uan ravy
r acv. Dl
rn y rwd
v t w cos t
cuecy xpur.
5 REBALANCING THE CHINESE ECONOMY TO CONSUMER SPENDING
Source: LPL Research, China National Bureau of Statistics, Haver Analytics, World Trade Organization 11/11/15
Data are as of 12/31/14.
Commodity-linked investments may be more
volatile and less liquid than the underlying
instruments or measures, and their value may
be affected by the performance of the overallcommodities baskets as well as weather,
disease, and regulatory developments.
Investing in foreign and emerging markets securities
involves special additional risks. These risks include,
but are not limited t o, currency risk, geopolitical
risk, and risk associated with varying accounting
standards. Investing in emerging markets mayaccentuate these risks.

7/23/2019 Outlook 2016 Spread
http://slidepdf.com/reader/full/outlook-2016-spread 7/15
12 1312 13
LPL Research’s Cycle Clock compares where
we are in t he current economic expansion with
prior expansions across several important
measures of economic activity. The Cycle
Clock highlights different ways of looking at
the current expansion and i s no t m eant to be
predictive. Each perspective is measured either
against a key event (how far into an expansion
a peak or trough takes place, on average) or
by comparing a current value (how far into
previous expansions we were, on average,
when we reached that value). For events, the
model assumes the peak or trough has already
been established for the current expansion, but
if a new peak or trough were to be set (a new
peak for real earnings, for example), we will in
fact be earlier in the cycle.
The Cycle Clock suggests we are in the mid-
to-lat e st age of the cur rent e xpansion, but we
are still seeing some early cycle and late cycle
behavior. Extended loose monetary policy,
inflation, and employment growth are still
exhibiting early cycle behavior, while some
items relating to corporate profits are showing
late cycle behavior, although they may be reset
if profits improve.
Early Cycle Extraordinary monetary support by the Fed has kept short-term rates, whichusually start to rise early in the cycle as the Fed begins to tighten policy, lowfor an extended period of time. The Great Recession also had a deep impacton the job market; despite the steady but slow job recovery, we only reached the prio r peak in to tal empl oyment i n September 2014. Inflati on, which is offits lows, remains well contained for now.
Mid-Cycle Lows for wage growth and the 10-year Treasury yield, usually early cycleevents, were pushed back in the current expansion, but were consistentenough with typical timing to indicate we are mid-cycle. Commodityprices tend to rise toward the end of the cycle when the economy start s tooverheat, and current levels are more typical of mid-cycle behavior.
Late Cycle U.S. corporations have been able to increase efficiencies to help driveearnings in the current cycle, and the stock market has responded, butfurther margin expansion may be limited. If energy sector earnings stabilizeand we hit new peaks for earnings, we’ll be earlier in the cycle thanindicated, but corporate America will once again have to show the resilienceit’s exhibited in the current economic cycle.
Sources: LPL Research, Federal Reserve, U.S. Bureau of Economic Analysis (BEA), U.S. Bureau of Labor Statistics, U.S. Bureau of the Census, Standard and Poor’s,Robert Shiller, National Bureau of Economic Research, Haver Analytics 11/11/15
Data for all series are as of October 31, 2015. Starting point for all series is June 1954 except housing starts (March 1961), hourly earnings (December 1970), andcommodity prices (December 1970). Real prices and real earnings determined using the Consumer Price Index for all urban consumers (CPI-U). Commodity prices arebased on the GSCI Total Return Index. Profitability is based on real profit per unit value added for non-financial corporate business based on current production ascalculated by the BEA.
Late CycleAverage
HistoricalCycle
Averages
CurrentCycle
Progress
Mid-CycleAverage
Early CycleAverage
A s s
u m e d
p r o
g r e s s t
h r o u
g h c u
r r e n t
e x p a n s i
o n i nde xed
from key dat a
p o i n t s b a s e d o n h i s t o r i c a l a v e r a g e s f o r p r i o
r e x p a n s i o
n s

7/23/2019 Outlook 2016 Spread
http://slidepdf.com/reader/full/outlook-2016-spread 8/15
14 15
-25% to -15% -15% to -5%< -25% -5% to +5% +5% to +15% +15% to +25% > +25%
Annual S&P 500 Gains/Losses Without Dividends Since 1950
1968
1959
2 0 0 4
1 965
1960 1949 1985
1 994 197 1 197 2 1 991
1957 2011 2014 1 951 1955
1 966 1970 1 952 1983 2003
2001 1 97 8 1979 1 963 1998
1 962 1 984 1 988 1 976 1989
1 97 7 1987 2010 1 999 2013
1969 195 6 1 964 1967 1997
2000 2005 201 2 1996 1975
1 981 20 07 20 0 6 1950 1 995
2 00 8 20 02 1953 2015 1 986 1961 195 8
1974 197 3 1990 1 992 1982 20 09 195 4
1993
Mid-Cycle Years
Gains May Require Tolerance for Volatility
Stocks historically have offered a tradeoff of higher returnfor higher risk, the gain of more upside than high-quality
bonds versus the pain of market volatility and losses.
For the last few years, U.S. stock
markets provided below-average
pain, while still providing strong
returns. Between October 2011
and July 2015, the S&P 500 Index
went nearly four years without a
“correction” of more than 10%,
while climbing an average of 20%
a year.
Although we expect average returns
for stocks in 2016, the path to reach
them will be anything but routine. LPL
Research expects stocks to produce
mid-single-digit returns for the S&P
500, consistent with historical mid-
to-late economic cycle performance,
driven by mid- to high-single-digit gains in earnings and a
largely stable price-to-earnings ratio (PE). This return to a
more normal market may mean more volatility, challenging
investors’ ability to stay focused on their goals.
How Is 2016 Shaping Up?In 2016, we expect the macroeconomic
environment to be molded by a mid-
to-late cycle U.S. economy, modest
inflation, and the start of a Fed rate hike
campaign. If the U.S. does not enter recession in a givenyear, the probability of an S&P 500 gain is 82%, based on
historical data from 1950 to present. Heading into 2016,
there have been scant signs of excesses
in the U.S. economy that may signal
vulnerability to recession. We are always
on watch for economic deterioration, but
would be surprised if the U.S. economy
begins to contract in 2016. In short, this
low recession risk points to a potentially
positive year for stock markets.
Given our view on the economy, we
have high confidence that the range of
potential market outcomes in 2016 will
fall into those highlighted in Figure 6 (p.
15), characterized as mid-cycle years. We
believe the worst returns during these
years are unlikely. These years included
shocks such as severe Fed rate hikes
(1994), an inflationary oil shock (1977), and a European debt
crisis (2011). We believe the high end is also unlikely, since
it also includes several years with unusual circumstances
such as a bounce back from an accounting scandal (2003),
several years inflated by a stock bubble
(1995, 1996, 1998), or recovery from
the fiscal cliff crisis (2013).
That leaves -5% to +25% as a
reasonable range of outcomes, with
+5% to +15% the most likely based
on these observations alone.
The historical likelihood of a positive year coupled with
our low-return expectations for the bond market support
our positive stock market view for 2 016.
Earnings Ramp-UpGetting the most out of a routine usually requires a little
variety. Corporate profits felt stagnant in 2015, largely
due to the drag from a strengthening U.S. dollar and
the impact of the drop in oil prices on energy sector
profits. Because we expect 2016 U.S. GDP growth
near its long-term trend, corporate America should get
back to delivering solid profits with mid- to high-single-
digit earnings growth (in-line with Thomson Reuters
consensus estimates), helping to push the stock market
higher. Earnings growth in 2016 is expected to be similar
with and without energy included, as shown in Figure 7.
Steady GDP growth in 2016 would set the tone for
corporate revenue growth, which historically has
correlated well with the growth of the overall economy.
Adding in improving growth overseas and a more stable
dollar should provide a solid macroeconomic backdrop
for revenue, which, through operating leverage, mayhelp support profit margins. Profit margins remain near
multi-decade highs and we expect corporate America to
maintain strong margins through a combination of:
1) limited wage pressure, 2) cost efficiency,
3) widespread use of automation/technology, 4) low
input cost inflation, 5) low borrowing costs due to low
interest rates, and 6) falling tax rates as more profits are
earned overseas in lower tax countries.
LARGE CA P U.S. STCKS
A u cyc
aur, cp,
-quy cpn
hv itcly bn f.
Ov s xpur y b
pv 2016.
CYCLICA L GOW H S TCK S
A cnu cmc
x hud f
cmcly s v
s ct , uch
du ch gy.
PRODUC TIVITY
W x mk t
rwd fm w g
o mog m g
og c .
6 HISTORICAL MID-CYCLE RETURNS SUGGEST MODEST GAINS FOR STOCKS IN 2016
Source: LPL Research, FactSet 11/11/15
Indexes are unmanaged and cannot be invested directly.Mid-cycle years (highlighted) are defined as more than a year away from the start or end of a recession.
7EARNINGS POISED TO ACCELERATE IN 2016 AS ENERGYDRAG ABATES
Source: LPL Research, FactSet 11/06/15
Based on the consensus of analysts’ estimates collected by Fac
This is for illustrative purposes only and is not representative ofthe performance of any index or investment product. The econom
forecast may not develop as predicted.
10
8
6
4
2
0
-2
-4
%
Change Change Ex-Energy
Earnings, Year-over-Year % Change
Q1
’15
Q2
’15
Q3
’15
Q4
’15
2016ConsensusEstimate
High-Single-Digits
Investing in U.S. equities includes numerous
specific risks including: the fluctuation of dividend,
loss of principal and potential illiquidity of the
investment in a falling market.
The PE ratio (price-to-earnings ratio) is a measure of
the price paid for a share relative to the annual net
income or profit earned by the firm per share. It is afinancial ratio used for valuation: a higher PE ratio
means that investors are paying more for each unit of
net income, so the stock is more expensive compared
to one with lower PE ratio.
Because of its narrow f ocus, specialty sector
investing, such as healthcare, financials, or energy,
will be subject to greater volatility than investing
more broadly across many sectors and companies.

7/23/2019 Outlook 2016 Spread
http://slidepdf.com/reader/full/outlook-2016-spread 9/15
16 17
40
20
0
-20
-40
%
’05’00’95’90’85’80 ’10
S&P 500 Annual Price Returns, % Change Maximum Drawdowns, %
- 17 - 1 8 - 17 - 7 - 1 3 - 8 - 9 - 34 - 8 - 8 - 20 - 6 - 6 - 5 - 9 - 3 - 8 - 1 1 - 1 9 -1 2 - 17 - 30 -34 - 14 - 8 - 7 - 8 - 1 0 - 48 - 28 - 1 6 - 19 - 1 0 - 6 - 7
Avg. Drawdowns:
All Yrs: -14%
Up Yrs: -11%
Stretching Out the Bull MarketWe expect the generally favorable macroeconomic
backdrop to lead to potential stock gains in 2016 and
possibly bring the current bull market, one of the most
powerful in the S&P 500’s history, to its seventh
birthday. The age of the bull market and above-average
valuations have led some to question whether stocks
may be too expensive to continue to rise. Valuations have
not historically been good predictors of stock market
performance over the coming 12 months; but, like a
regular warm-up, monitoring valuations can help investors’
long-term health.
At 17.6 as of November 23, 2015, stocks are above their
long-term average trailing PE of 15.3 (based on S&P 500
data back to 1950 ), though they are only slightly above
the average since 1980 of 16.4.
However, these valuations look more reasonable when put
in context of low interest rates [Figure 8]. Since 1962, the
average trailing PE ratio when interest rates are low (below
4% on the 10-year Treasury) is 17.7 versus 8.6 when they
are high (above 8%), suggesting stocks are fairly valued.
The relationship is similar when inflation is low.
Sticking With Your Habits — Even Through VolatilityOne characteristic of the stock market that is customary,
but certainly does not feel that way, is volatility. The S&P
500’s peak-to-trough decline of 12% (May 21 to August
25, 2015) did not feel typical. But this type of pullback isactually quite normal, even in positive returning years. In
fact, since 1950, the average peak-to-trough decline for
the S&P 500 is 14%; even in positive returning years, the
average is 11%, and the index suffered at least a 10%
correction in 41% of those positive years [Figure 9].
Another way to show
that the volatility
experienced in 2015 is
closer to the norm is
by looking at the VIX,
a measure of implied
stock market volatility.
The year-to-date
average for the VIX
ENEGY
h e gy s ct i
i f rbu
h g du upy
d ju me o
cnu dm
rm dy.
in 2015 is 16.6, above the average of the prior two years
between 14 and 15, but below the 20-year average (20.9)
and the average during the current bull market (19.6).
We expect volatility to be with us again in 2016 as the
business cycle ages, making sticking to your long-term
investment habits even more important to avoid locking
in losses and missing out on opportunities. A number of
factors beyond the aging business cycle could lead to
increased market volatility in 2016. The Fed is about to
embark on its first rate hike campaign since 2004 – 06.
A further pronounced drop in oil prices — though not
our expectation — could negatively impact the global
economy and markets. And recent terrorist attacks in
Paris and the associated military response highlight
the heightened geopolitical risk in the Middle East and
throughout the world.
Stretch, But Don’t Strain, When It Comes to EnergyOil has become a critical factor for financial markets.
The drop in oil prices has significantly impacted overall
corporate profits, capital spending, emerging market
economies, and even the credit markets. As a result, oil
has the potential to be either a source of disruption or a
key driver of stock market gains.
We do not think it is a stretch to expect oil prices to
potentially produce double-digit gains in 2016. On the
supply side, the decline in capital investment by energy
producers will likely result in reduced production.
The marginal cost of the majority of U.S. shale produc
ranges between $40 and $6 0; prices in the lower end
this range may discourage production and force highe
producers to exit the market. Though some have worr
that low prices may be indicative of weak demand, to
contrary, global oil consumption remains strong, with
demand 1.8 million barrels per day higher in 2015 than
2014, and an expected increase of 1.2 million barrels p
day in 2016, according to International Energy Agency
(IEA) forecasts.
A surprise cut to production targets from OPEC (the
Organization of Petroleum Exporting Countries), thou
a low probability event, may push oil substantially hig
in 2016. Potential violence in the Middle East, sparki
fears of supply disruptions, could also provide a posit
catalyst for the commodity price. Two of the more
prominent risks on the downside include Iran’s impe
return to global oil markets, which may increase supp
by an additional800 – 900 thousand
barrels of oil
per day, and the
potential drag from
further appreciation
in the U.S. dollar,
which makes oil
more expensive to
foreign buyers.
HL HCA R
D mg hc r, A C
dm, gb rch,
cnu a m
d t bv-m k
g g w h r
f h hc tck.
H RmPolitical headline risk is perhaps
most acute in the healthcare industry
as lawmakers and presidential
candidates focus on drug pricing.
Regulatory changes are unlikely,
potentially creating an opportunity for
the healthcare sector. The Affordable
Care Act (ACA) is likely to remain
largely intact and support demand for
healthcare products and services.
Tx RmAlthough comprehensive corporate
tax reform is unlikely in 2016,
targeted measures may be reached,
such as a deal to allow multinational
companies to repatriate foreign
earnings at a lower tax rate, given
Paul Ryan’s election as Speaker of
the House.
Egy PyEnergy issues will command
significant attention in 2016. The
oil export ban is unlikely to be lifted
amidst opposition in the White
House and among Democratic
leaders, who believe exports will
raise gasoline prices. This may
delay the pace of the market’s
supply adjustment. The outgoing
administration will seek to cement
environmental initiatives, a headwind
for coal producers and utilities.
In 2016, the political cycle brings us a presidential election that is likely to
deliver more of the usual. Since 1950, S& P 500 returns during election years
have historically been routine — averaging about 7%. Election years also tend
to be a difficult time for a divided Congress to pass legislation. However,
specific political issues may influence the market in 2016:
8STOCK VALUATIONS HISTORICALLY HIGHER AT LOWINTEREST RATE LEVELS
Source: LPL Research, FactSet 11/06/15
20
18
16
14
12
10
8
6
S&P 500 Index Average Trailing PE
<4% 4–6% 6%–8% >8%
10-Year Treasury Yield
9 STOCK MARKET CORRECTIONS ARE NORMAL EVEN IN POSITIVE YEARS
Source: LPL Research, FactSet 11/06/15
Maximum drawdown is calculated as maximum pea k-to-trough decline in a given calendar year.
The performance data presented represents past performance and is no guarantee of future results. All indexes are unmanaged and cannot be invested into directly.

7/23/2019 Outlook 2016 Spread
http://slidepdf.com/reader/full/outlook-2016-spread 10/15
18 19
Some routines are more challenging than others and
sticking with bonds may be one of them. A limited return
environment is likely to persist in 2016 and the year as a
whole may look similar to 2015. High valuations, steady
economic growth, and the lingering threat of Fed rate
hikes will likely keep pressure on bond prices in 2016.
We do not envision a recession developing, which we
believe is ultimately needed for a sustained move higher
in bond prices.
A bond routine should nonetheless be maintained and
plays a vital role in investors’ portfolios despite prospects
of low returns. Even in a low-yielding environment,
high-quality bonds can play an important diversification role
and help mitigate risk [Figure 10]. Over the past 12 years,
high-quality bonds provided a key buffer during periods of
stock market weakness. Specifically, high-quality bonds
outperformed stocks by more than 13%, on average,
when the broad stock market declined by 5% or more over
a period of three or more weeks. This relationship has held
even during the very low-yield environment of the past five
years. While the average absolute return from bonds was
low, risk mitigation was still notable.
IN TERMIA E-BOND S
Hg-qult y t ma os o mo t n dv sfcao b ft s l co ot olos. In ma os, a t h so t - o lo g-t m os, o p o a led o y ld o gv moun o t rst a ik.
Planning for What May Be AheadA simple 2016 scenario analysis using existing yields and
characteristics of the broad Barclays Aggregate Bond
Index shows the potential diversification benefits offered
by high-quality bonds [Figure 11]. Even a small 0.25%
decline among intermediate Treasury yields may produce
a gain of 4.6%, and if interest rates fall further, gains
would increase from there.
However, our expectation is that average intermediate-
term Treasury yields rise by ap proximately 0.25% to
0.50%, with a lesser probability of a 0.75% increase
possible, as three main challenges facing bonds persist:
high valuations, steady economic growth, and the
prospect of Fed rate hikes. These three factors should
exert upward pressure on bond yields and downward
pressure on bond prices. Our interest rate expectations
correspond to a range of high- quality bond total returns
from a modest loss to a small gain of 1.8%; thus, our
“flat” return expectation.
More specifically the three challenges that may pressure
bond prices in 2016 include:
High valuations. Inflation-adjusted yields, one of our
key valuation barometers, remain very low by historical
comparison [Figure 12]. The lower the inflation-adjusted
(or real) yield, the more expensive bonds are, and vice
versa. We believe bonds may remain expensive by
historical comparison; however, current valuations have
gone a long way to price in weak economic growth, as
well as a delayed start to Fed interest rate hikes. Much
of the good news is priced in and absent a recession,
upside for high-quality bonds is limited and we remaincautious. The last time valuations were more expensive
than late 2015 levels was in late 2011 and into 2012 in
the aftermath of European debt fears and a “double- dip”
recession in Europe.
Steady economic growth. In 2016, we expect the
U.S. economy to continue to grow 2.5 – 3% and avoid a
recession. Although inflation remains low by historical
comparison with wage pressures still limited, continued
global economic expansion is likely to slowly lift actual
inflation and inflation expectations. Therefore, grow
concerns that supported high-quality bond prices in
2015 may begin to fade.
Prospect
of Fed rate
hikes. The gap
between market
expectationsand Fed
forecasts
regarding timing
of a first Fed
rate hike has
narrowed, but
expectations
on the pace of
rate hikes remain
wide and imply
a much more
gradual pace of
BANK LOA NS
Bk o sv t i g a
my onu t
bf om ow du
m e gy
st xour.
In Reverse Chronological Order
Stock Market
Peak – Trough
Duration
(Weeks)
S&P 500 Total
Return
Barclays Aggregate
Bond Total R eturn Difference
8/17/15 – 9/28/15 6 -10.5% 0.3% 10.8%
9/18/14 – 10/15/14 4 -7.4% 2.4% 9.8%
5/21/13 – 6/24/13 5 -5.8% -3.1% 2.7%
9/14/12 – 11/14/12 9 -7.5% 1.2% 8.7%
4/2/12 – 6/1/12 9 -9.9% 2.2% 12.2%
7/7/11 – 10/3/11 13 -18.8% 4.2% 23.0%
4/23/10 – 7/2/10 10 -16.0% 3.0% 19.0%
Average -10.8% 1.5% 12.3%
Source: LPL Research, Bloomberg, Standard & Poor’s, Barclays 11/06/15
All performance referenced is historical and is no guarantee of future results.
10 BONDS PROVIDE KEY DIVERSIFICATION BENEFITS EVEN IN A LOW-YIELD ENVIRONMENT
11 BARCLAYS AGGREGATE BOND INDEX SCENARIO ANALYSIS
Change in Bond Yields - 0.75% -0.50% -0.25% 0.00% 0.25% 0.50% 0.75% 1.00%
Total Return 7.4% 6.0% 4.6% 3.2% 1.8% 0.4% -1.0% -2.4%
Source: LPL Research, Barclays 11/06/15
Scenario analysis is based on a return of 3.2% as of 11/6/15 for the Barclays Aggregate, based upon one-year time horizon, parallel shift in the yield curve,no change to yield spreads, and no reinvestment of interest income.
This is a hypothetical example and is not representative of any specific situation. Your results will vary. The hypothetical rates of return used do not reflethe deduction of fees and charges inherent to investing.
Indexes are unmanaged and cannot be invested into directly.
12REAL YIELDS REMAIN VERY LOW BY HISTORICALCOMPARISON AND REFLECT AN EXPENSIVE VALUATIO
Source: LPL Research, Bloomberg 11/06/15
Shaded area indicates recession.
3.5
3.0
2.5
2.0
1.5
1.0
0.5
0.0
-0.5
-1.0
%
’13’12’11’10’09’08’07’06’05 ’14 ’15
Real Yield
10-Year Treasury Yield Minus Core CPI, Year-over-Year
Average
Bond Returns Expected to Remain Flat
There is no guarantee that a diversified portfolio will enhance overall returns or
outperform a nondiversified portfolio. Diversification does not ensure against
market risk.
Bonds are subject to market and interest rate risk if
sold prior to maturity. Bond and bond mutual fund
values and yields will decline as interest r ates rise and
bonds are subject to availability and change in price.
Bank loans are loans issued by below investm
companies for short-term funding purposes wi
yield than short-term debt and involve risk.

7/23/2019 Outlook 2016 Spread
http://slidepdf.com/reader/full/outlook-2016-spread 11/15
20 21
rate increases compared to Fed forecasts [Figure 13].
Much of the good news about a go-slow approach from
the Fed is already priced in an d removes a potential upside
catalyst to bond gains.
These three factors, prevalent at the start of 2015,
conspired to produce low returns in 2015. All three are
expected to continue and are likely to influence the bond
market once again in 2016.
Finding Value in Your RoutineHigh-yield bonds may be a beneficiary of sticking to a plan.
Roiled by a renewed decline in oil prices and overseas
growth concerns during the third quarter of 2015, high-
yield bond prices weakened as default fears increased.
The energy sector was the primary driver of high-yield
weakness during the third quarter of 2015, and prices
reversed some of what we viewed as an overly severe
reaction. As of November 23, 2015, the average yield
spread of high-yield bonds was approximately 6.4%, above
the historic average of 5.8%, despite low defaults.
Much of the bad news regarding the high-yield energy
sector is likely factored into current pricing. Defaults
increased in 2015 and are likely to increase further in 2016,
but market pricing suggests an overly pessimistic outcome
in our view. The implied default rate for the energy sector
is a staggering 16% over a one-year time horizon. Although
energy issuers have contributed to rising defaults, the
current annualized rate of energy-related defaults is 5%,
and in our view, unlikely to reach the high end of market
implied expectations.
This is not
the first time
a decline in
oil prices has
translated into
rising default
expectations.
In late 1985, oil
prices began to
decline with the
price per barrel
falling by nearly
two-thirds
from $30 per
barrel to just
over $10 per
barrel. While the
high-yield bond
market was in
its infancy then,
the default rate
climbed by 2%,
nowhere near
the double-digit
default rates
witnessed as
a result of a
recession. A rise in the default rate by 2% would be a
headwind for high-yield bonds, but that outcome has
largely been factored into current valuations.
Tune In for Potential VolatilityChanging investor expectations in response to oil prices,
Fed guidance, and economic data c ould translate into
bond volatility remaining elevated. The pendulum,
however, swings both ways, with volatile periods pushing
yields higher or lower. Bond volatility increased in 2015
as interest rates rose during the spring and subsequently
fell over the summer. High-yield bonds have been marked
by periods of strength and weakness since the middle
of 2014. Each move ultimately proved inconclusive,
providing investors opportunities along the way. In
2016, more opportunities may come investors’ way as
market forces may push prices and yields too far in eitherdirection. While the path of interest rates is gradually
higher, investors may have to be more active in 2016 to
take advantage of oppo rtunities in a low-return, limited
opportunity environment.
Opportunities may similarly arise in emerging markets
debt (EMD), which witnessed its share of volatility
HIGH-Y IELD BOND S
I wod o m
u , g-yd o
o u n
yd dng t U.S.
Tru. W du
ky t rm ow y
it d
2016 uao
d quay omea g
o i g d u ik,
w f u g-
y d o, st h
h it ly ord
u g ig
r a.
in 2015. An
average yield
spread of 4%
has proven to
be a barometer
of value, with
spreads rarely
staying notably
above that
level for any
sustained period
of time. Our
view is that
many emerging
economies will
likely stabilize in
2016, providing
a floor for EMD.
While we prefer
high-yield bonds
for their much
lower interest
rate sensitivity, EMD may provide opportunity given
cheaper valuations. Local currency EMD remains more
volatile, and valuations are not compelling enough to take
on this added risk.
We continue to find high-quality municipal bonds
attractive due to still cheap valuations relative to
Treasuries, with most top-quality issuers yielding slig
more than comparable maturity Treasuries [Figure 14
The relative strength of U.S. Treasuries over the seco
half of 2015 put municipal valuations on more attractiv
footing. Bear in mind, municipal bonds will take their
from the Treasury market, but more attractive valuatio
can provide a buffer against rising interest rates in add
to an attractive level of after-tax yields.
The municipal market is on track to post limited overa
debt growth in 2015 but any meaningful increase is
unlikely. States and municipalities battle with still tigh
budgets that will likely keep bond issuance for new
infrastructure projects limited. Net supply of the muni
bond market is likely to see only limited growth once
in 2016, which should provide support to prices. How
like taxable bonds, municipal bonds are likely to witne
a low-return environment as well and not escape the
challenges facing all bond investors in 2016.
MUNICIPAL BOND S
Mu uao
movd a 2015
u rm a v
rav t Tru o
og- m i. Tx
que y d rm
av om t
x av
m upy my
upo c .
AL TERNIVE S TREGIE S
Our overall market view is positive, but with increasedvolatility and divergent policies in different countries. Wbelieve this will be a favorable environment for global strategies. Global macro strategies apply macroeconodriven investment processes seeking to capitalize on the impact of movements in different asset classes orsegments. We also believe that trend following strateg(also referred to as managed futures) may be successmany of the same reasons. Both strategies rely on chatrends and volatility in the markets. The difference is tglobal macro strategies are generally discretionary andbased on economic analysis, whereas managed futurestrategies are quantitative and based on previous pricemovements. Both can be very volatile.
For more conservative investors interested in addingalternative strategies to their portfolio, we recommenmulti-strategy. As the name implies, these contain anumber of different trading strategies across a numbedifferent underlying asset classes. Their goal is a relatstable, constant return with relatively low volatility and
correlation to stocks and bonds.
13ALTHOUGH THE GAP HAS NARROWED, FUTURESALREADY REFLECT A SLOWER PACE OF RATE HIKES
Source: LPL Research, Chicago Board of Trade, Federal Reserve 11/06/15
Long run is defined as five years.
4.0
3.5
3.0
2.5
2.0
1.5
1.0
0.5
0.0
%
Year-End2017
Year-End2018
Year-End2016
Year-End2015
Long Run
Future Fed Funds Target Rate
Fed Proj ect ion M arket Expectat i on
14MUNICIPAL VALUATIONS IMPROVED IN 2015 BUT REMAINATTRACTIVE ON A LONG-TERM BASIS
Source: LPL Research, Municipal Market Advisors 11/06/15
The credit ratings are published rankings based on detailed financial
analyses by a credit bureau specifically as it relates to the bondissue’s ability to meet debt obligations. The highest rating is AAA, and
the lowest is D. Securities with credit ratings of BBB and above are
considered investment grade.
130
120
110
100
90
%
Nov’15
May’15
Aug’15
Feb’15
Nov’14
Nov’13
May’14
Aug’14
Feb’14
AAA Municipal-to-Treasury Yield Ratio
1 0- Ye ar 3 0 -Y ea r
MunicipalsLess Expensive
MunicipalsMore Expensive
Global macro strategies attempt to profit from anticipated price movements i
markets, interest rates, foreign exchange and physical commodities. Global m
risks include but are not limited to imperfect knowledge of macro events, div
movement from macro events, loss of principal, and related geopolitical risks
Managed futures strategies use systematic quantitative programs to find and
invest in positive and negative trends in the futures markets for financials an
commodities. Futures and forward trading is speculative, includes a high deg
risk that the anticipated market outcome may not occur, and may not be suit
all investors.
High-yield/junk bonds are not investment-grade
securities, involve substantial risks, and generally
should be part of the diversified portfolio of
sophisticated investors.
Municipal bonds are subject to availability, price,
and to market and interest rate risk if sold prior
to maturity. Bond values will decline as interest
rate rise. Interest income may be subject to thealternative minimum tax. Federally tax-free but otherstate and local taxes may apply.
Investing in foreign and emerging markets debt securities involves special additional
risks. These risks include, but are not limited to, currency risk, geopolitical and
regulatory risk, and risk associated with varying settlement standards.

7/23/2019 Outlook 2016 Spread
http://slidepdf.com/reader/full/outlook-2016-spread 12/15
22 23
Embrace “The New Routine”Since the start of the bull market for stocks that began in early 2009, the investing environment has been filled with
plenty of distractions, some serious disruptions, and occasional risks of derailment, from the lingering shock of the Great
Recession to extraordinary central bank intervention around the world, a debt crisis in Europe, slowing growth in China,
falling oil prices, and plenty of political drama. As we progress into the latter half of the business cycle, a good routine
will continue to serve as a steady guide as investors work toward their financial goals, but it will become increasingly
important for a good routine to be flexible enough to adjust to a changing environment. As we look ahead to 2016, we
present some “new routines,” including those principles we believe investors should continue to rely on, some areas that
may require some flexibility, and some important changes we see in the coming year and beyond.
There are some investing principles that remain in place
no matter what the environment. These principles remain
holdovers from the prior routine:
Think like an investor, not like a speculator. An
investor is providing capital to businesses, or even
individuals, with the expectation that it wil l help provide
opportunities that deliver a fair return.
Stay committed to a long-term plan. Dollar cost
averaging (investing a relatively fixed amount steadily
over time) and rebalancing, when practical, are still
good practices to help manage market ups and downs
and help mitigate risk. Getting added return requires taking on added risk.
(It doesn’t necessarily work the other way around.
Sometimes a risky investment is just risky without
providing additional return.) Investors are more likely
to get added return for the risk they take on if risk is
diversified and fairly priced.
Know your goals. Every investor is different. Some are
retired; some just starting to save for retirement. Some
are more sensitive to taxes; some are very sensitive
to risk. Investors need a portfolio that matches their
goals and personal circumstances as they change over
time. Different goals can lead to different approaches
to managing a similar investment environment. An
investor’s goals need to come first; figuring out how
current opportunities line up with those goals follows.
The New Routine Brace for lower stock returns. The annual total return
for the S&P 50 0 over the next 10 years will likely be
below its long- term average of over 11% (going back to
1928); but a slow recovery following a deep recession
means the economy may have room to r un, despite
entering the second half of the cycle. That potential,
together with a likely rebound in profits, creates a
strong possibility of stocks providing an average to
above-historical premium to bonds i n 2016 and beyond.
Volatility on the rise. With the Fed likely ending its
near zero interest rate policy in late 2015 or early 2016,
volatility is likely to pick up. Investors need to review
their risk tolerance and understanding of economic
cycles. Emotionally challenging pullbacks like we saw
in August and September 2015 may become more
frequent, even in an advancing market. Fed r ate hike
cycles have also impacted the performance of stock and
bond sectors and investors need to have a game plan.
Turn down the noise. As volatility increases, being
able to discern potential disruptors f rom headline noise
will become increasingly important. The press often
focuses on producing headlines that will attract an
audience, not necessarily on what is most important
for investors; smart investors will try to focus on actual
underlying risk.
Be more opportunistic. Increased volatility can
create opportunities for skilled investors who have the
tools to understand when market dislocations create
opportunities and the patience to let markets rebalance.
Investors may be able to find ways to harvest the
value of that experience through well-chosen active
management and sound professional advice.
Bonds still work as a diversifier. Performance in 2015
has provided further confirmation that the bull market
for bonds is nearing an end. Quality bonds remain an
important diversifier, but returns modestly below yields
are likely to be the norm for some time to come.
Alternative strategies are a tool, not a solution.
Alternative strategies, which typically can’t keep up
in a booming market environment, have more value
as a diversified source of returns in a lower-return
environment. But they must be viewed in the context of
a total portfolio, not on a stand-alone basis.
Two other important changes that investors will need to
make will be adjusting to the start of a rate tightening cycle
and planning for a likely long-term lower return environment.
Fed Policy Tightening Game PlanInternational and domestic investments, large and small
company stocks, and stocks and bonds sectors have all
exhibited their own routine in response to Fed rate hikes
[Figure 15]. In some cases, the same routine to handle
Fed rate hikes may serve investors well; but in others,
changing times requires new routines.
We have discussed how stock market returns are, on
average, positive the year following the start of rate hikes,
but focusing on specific areas of the stock market may
boost the odds of success. A look back over the last three
Fed rate hike campaigns (February 1994 – February 1995,
June 1999 – May 2000, and June 2004 – June 2006)
reveals patterns across the stock market.
6-Month 12-Month 18-Mon
Treasuries 0.0% 3.1% 8.6%
Mortgage-Backed Securities 1.1% 3.6% 9.1%
Investment-Grade Corporates 0.5% 2.5% 7.9%
High-Yield 2.1% 2.7% 5.7%
Municipals 0.1% 2.6% 7.7%
Emerging Markets Debt 2.4% 6.0% 14.5%
International Bonds 6 .0% 4.6% 8.9%
Barclays Aggregate 0.5% 3.0% 8.5%
Source: LPL Research, S&P, Barclays, MSCI, Russell, Bloomberg
11/11/15
The performance data presented represents past performance is no guarantee of future results. All indexes are unmanaged an
cannot be invested into directly.
Asset class returns are represented by the indexes defined in th
disclosure section.
GLOBAL
6 -M on th 1 2- Mo nt h 1 8- Mo n
U.S. Stocks 2.8% 2.7% 7.4%
International Stocks 12.0% 7.0% 11.8%
Emerging Markets 12.1% 6.2% 10.6%
6 -M on th 1 2- Mo nt h 1 8- Mo n
Consumer Discretionary 4.0% -4.4% -2.7%
Technology 13.7% 18.7% 18.4%
Healthcare -5. 2% 10.0% 21.9%
Consumer Staples -3.8% -2.2% 10.6%
Financials -1.5% -4.1% 12.6%
Industrials 1.9% -1.3% 10.1%
Telecom 3.7% - 5.3% -11.7%
Materials 3.8% -10.5% 3.9%
Utility -2.9% 6.8% 20.0%
Energy 3.9% 12.1% 23.5%
S&P 500 3.8% 4.7% 10.7%
BOND SECTOR
EQUITY SECTOR
6 -M on th 1 2- Mo nt h 1 8- Mo n
Large Cap 6.5% 9.9% 9.4%
Mid Cap 5.1% 9.0% 20.8%
Small Cap 4.7% 5.9% 12.9%
MARKET CAP
15TOTAL RETURNS OF VARIOUS INDEXES AFTER THE STAOF RATE HIKES
There is no guarantee that any strategy will be successful.

7/23/2019 Outlook 2016 Spread
http://slidepdf.com/reader/full/outlook-2016-spread 13/15
24 25
-5%
0
5
10
15
20
25
35
30
25
20
15
10
5
0
’95 ’20’15’10’05’00 ’25
PE Ratio, Shifted 10 Years Forward (Left Scale)
S&P 500 Annualized 10-Year Total Return (Right Scale, Inverted)
Domestic and International Stocks
International stocks have fared notably better than their
domestic counterparts over the last three rate hike cycles.
The U.S. Fed and international central banks appear set to
follow different paths and this pattern may repeat.
New Routine: We believe divergent central bank policy
and improving global growth are two key drivers for
improving international stock performance in 2016.
Still, we do not expect the disparity of performance
witnessed in prior periods as U.S. economic growth
is likely to remain strong relative to many d eveloped
counterparts. Valuations among emerging market
equities remain particularly attractive and potential
earnings acceleration in Europe and Japan boost the
allure of international stocks.
Large and Small Company Stocks
Large company stocks have weathered the start of Fed
rate hikes better than small and mid cap companies overthe 6- and 12-month periods following a rate increase.
New Routine: Our large cap bias is fundamentally in
response to large cap strength over the second half of
the business cycle, but resilience during rate tightening
cycles also plays a role. Over a longer 18-month
time frame, small and mid cap stocks have enjoyed a
resurgence, but this is in part due to small and mid ca ps
anticipating an economic recovery in the aftermath of
an economic slowdown. We believe the current hike is
taking place in an aging economic cycle and we remain
skeptical of a repeat of small and mid cap strength,
maintaining a slight bias to large caps.
Stock Sectors
During the first six months following a Fed rate
hike, technology is the only sector showing notable
outperformance relative to the broad market as measured
by the S&P 500. One year after the first rate hike, the
technology sector has continued to exhibit strength, as
have both the healthcare and energy sectors, while the
consumer discretionary sector has underperformed.
New Routine: We believe technology will prove resilient
in the face of rate hikes once again. Technology returns
have varied significantly over rate hike periods, in part dueto the late 1990s tech bubble, but we b elieve valuations,
earnings potential, and increased corporate spending on
technology as companies try to remain competitive may
support performance. While stabilizing oil prices may limit
the upside of consumer discretionary stocks in 2016, a
strengthening job market may provide a lift to the sectors’
historical trend of underperformance. On the other
hand, stabilizing oil prices may help the energy sector
start to rebound, although headwinds from the supply
overhang may cap outperformance. Finally, the financials
sector, a notable laggard one year after rate hikes, may
follow a different drumbeat in this cycle. Financials are
fundamentally stronger heading into this rate hike cycle
than in the p ast and may weather rate hikes better,
but the sector still faces some uncertainty if financial
regulation continues to limit growth opportunities.
Bond Sectors
Treasuries have been the most sensitive to Fed rate hikes
in the past and the current period is likely to be similar
given still expensive valuations. More resilient sectors
include emerging markets debt and high-yield bonds. The
added income of these sectors has historically provided a
buffer against rising rates.
New Routine: More attractive valuations still makecorporate bonds, high-yield in particular, part of a
game plan to play defense against rising rates. Among
high-quality bonds, mortgage-backed securities have
shown resilience to Fed rate hikes, but more expensive
valuations during the current environment leave us
neutral on the sector. We expect municipal bonds to fare
better during this rate hike cycle as limited net supply and
attractive valuations on a long-term basis may continue
to support the sector. Lower absolute yields and higher
valuations of developed foreign bond markets limit the
appeal of international bonds this period, and a break
from the old routine may be warranted.
Thinking About 2026, Not Just 2016Many investors think about the year ahead, but
also the long term, and this dual perspective will be
especially important in 2016. For stocks, valuations,
most commonly measured by the PE ratio, can have a
strong influence on returns over the long term [Figure
16]. In general, the lower the PE ratio, the greater the
prospective long-term return, and vice versa. The current
PE ratio on the S&P 500 Index suggests investors may
expect average returns in the high-single-digit range if
the relationship holds, although this is only one factor
influencing returns.
A similar forecast can be done with bonds. While
stocks are moderately expensive, bond yields are sitting
near historical lows with valuations near historical
highs. Over the long term, yield has been the dominant
16PE RATIOS HAVE BEEN A GOOD FORECASTER OF LONG-TERMSTOCK RETURNS
Source: LPL Research, S&P, FactSet, Haver Analytics 11/11/15
PE Ratio = S&P 500 Price/Operating Earnings Ratio
17YIELD IS THE DOMINANT DRIVER OF HIGH-QUALITY BORETURNS OVER THE LONG TERM
Source: LPL Research, Barclays, FactSet 11/11/15
driver of expected returns [Figure 17], although there
are other things that can have an impact, such as
default levels and changing interest rate environments.
Pushing the 10-year Treasury yield out over the next
10 years shows that high-quality bond investors may
expect a modest 2% annualized return, on average,
over the next 10 years.
The difference between the expected return on stocks
and quality bonds is often c alled the equity risk premium
[Figure 18]. It reflects the additional return investors
expect for taking on the added riskiness of equities.
Looking at stock PEs and bond yields, while stock return
expectations need to be lowered over the next 10 years,
so do bond return expectations, and the adde d return for
the added risk of stocks remains fair, with a tilt toward an
above-average premium relative to history.
Understanding the current economic and overall return
environment, both in the short and the long term, will
help investors understand where they can stick with
current routines, and where they need to show flexibility.
The unusual nature of the current cycle, the likely launchof a rate tightening cycle, and the impact of relative stock
and bond valuations will all require investors to make
adjustments in 2016 and beyond, but sound fundamentals
based on a long -term view may continue to help orient
them as they navigate changing markets and seek to
make progress toward their financial goals.
18STOCK PES AND BOND YIELDS POINT TO A LIKELIHOOAN AVERAGE HISTORICAL RISK PREMIUM
Source: LPL Research, Standard and Poor’s, Federal Reserve, A
Damodaran 11/11/15
The performance data presented represents past performance
no guarantee of future results. All indexes are unmanaged and c
be invested into directly.
25
20
15
10
5
0
-5
-10
%
’1’00’86’72’58’44
Historical Equity Risk Premium
Average
16
12
8
4
0
%
’95 ’20’15’10’05’00 ’25
10-Year Treasury Yield, Shifted 10 Years Forward
Barclays Aggregate Annualized 10-Year Total Return
Because of its narrow focus, sector investing will be subject to greater volatility than
investing more broadly across many sectors and companies.
Mortgage-backed securities are subject to credit, default, prepayment risk that acts
much like call risk when you get your principal back sooner than the stated maturity,
extension risk, the opposite of prepayment risk, market and interest rate risk.
The economic forecasts set forth in the presentation may not develop as pre
and there can be no guarantee that strategies promoted will be successful.

7/23/2019 Outlook 2016 Spread
http://slidepdf.com/reader/full/outlook-2016-spread 14/15
IMPORTANT DISCLOSURES
The opinions voiced in this material are for general information only and are not intended to provide or be construed as providing specific investment advice or
recommendations for any individual security. To determine which investments may be appropriate for you, consult your financial advisor prior to investing. All
performance referenced is historical and is no guarantee of future results. All indexes are unmanaged and cannot be invested into directly.
Economic forecasts set forth may not develop as predicted, and there can be no guarantee that strategies promoted will be successful.
Investing in stock includes numerous specific risks including: the fluctuation of dividend, loss of principal, and potential liquidity of the investment in a
falling market.
Quantitative easing (QE) is a government monet ary policy occasionally used to increase the money supply by buying government securities or other
securities from the market. Quantitative easing increases the money supply by flooding financial institutions with capital in an effort to promote
increased lending and liquidity.
Asset classes represented: U.S. Stocks: S&P 500 Index; International Developed Stocks: MSCI EAFE Index; Emerging Market Stocks: MSCI Emerging Markets
Index; Large Cap Stocks: Russell 1000 Index; Mid Cap Stocks: Russell Midcap Index; Small Cap Stocks: Russell 2000 Index; Treasuries: Barclays U.S. Treasury
Index; Mortgage-Backed Securities: Barclays U.S. MBS Index; Investment-Grade Corporate Bonds: Barclays U.S. Corporate Bond Index; High-Yield Bonds:
Barclays U.S. Corporate High-Yield Bond Index; Municipals: Barclays Municipal Bond Index; Emerging Markets Debt: JP Morgan Emerging Markets Global
Index; Foreign Bonds: Barclays Global Aggregate ex-USD Index
The S&P 500 Index is a capitalization-weighted index of 500 stocks designed to measure performance of the broad domestic economy through changes in the
aggregate market value of 500 stocks representing all major industries.
The Russell Midcap Index offers investors access to the mid cap segment of the U.S. equity universe. The Russell Midcap Index is constructed to providea comprehensive and unbiased barometer for the mid cap segment and is completely reconstituted annually to ensure that larger stocks do not distort the
performance and characteristics of the true mid cap opportunity set. The Russell Midcap Index includes the smallest 800 securities in the Russell 1000.
The Russell 2000 Index measures the performance of the small cap segment of the U.S. equity universe. The Russell 2000 Index is a subset of the Russell 3000
Index representing approximately 10% of the total market capitalization of that index.
The Russell 1000 Index measures the performance of the large-cap segment of the U.S. equity universe. It is a subset of the Russell 3000 Index and includes
approximately 1000 of the largest securities based on a combination of their market cap and current index membership. The Russell 1000 representsapproximately 92% of the U.S. market.
The Barclays U.S. Aggregate Bond Index is a broad-based flagship benchmark that measures the investment-grade, U.S. dollar-denominated, fixed-rate taxable
bond market. The index includes Treasuries, government-related and corporate securities, MBS (agency fixed-rate and hybrid ARM pass-throughs), ABS, and
CMBS (agency and non-agency).
The Barclays U.S. Treasury Index is an unmanaged index of public debt obligations of the U.S. Treasury with a remaining maturity of one year or more. The index
does not include T-bills (due to the maturity constraint), zero coupon bonds (strips), or Treasury Inflation-Protected Securities (TIPS).
The Barclays U.S. Mortgage Backed Securities (MBS) Index tracks agency mortgage backed pass-through securities (both fixed rate and hybrid ARM) guaranteed
by Ginnie Mae (GNMA), Fannie Mae (FNMA), and Freddie Mac (FHLMC).
The Barclays U.S. Corporate Index is a broad-based benchmark that measures the investment-grade, U.S. dollar-denominated, fixed-rate, taxable
corporate bond market.
The Barclays U.S. Corporate High Yield Index measures the market of USD-denominated, noninvestment-grade, fixed-rate, taxable corporate bonds. Securities
are classified as high yield if the rating of Moody’s, Fitch, and S&P is Ba1/BB+/BB+ or below, excluding emerging markets debt.
The Barclays Municipal High Yield Bond Index is comprised of bonds with maturities greater than one year, having a par value of at least $3 million issued as part
of a transaction size greater than $20 million, and rated no higher than ‘BB+’ or equivalent by any of the three principal rating agencies. (The long and the short
are subindexes of the Municipal Bond Index, based on duration length.)
The JP Morgan Emerging Markets Bond Index is a benchmark index for measuring the total return performance of international government bonds
issued by emerging markets countries that are considered sovereign (issued in something other than local currency) and that meet specific liquidity and
structural requirements.
The Barclays Global Aggregate ex-USD Index is an unmanaged index considered representative of bonds of foreign countries.
The MSCI Emerging Markets Index is a free float-adjusted, market capitalization index that is designed to measure equity market performance of
emerging markets.
The MSCI EAFE Index is a free float-adjusted, market-capitalization index that is designed to measure the equity market performance of developed markets,
excluding the United States and Canada.

7/23/2019 Outlook 2016 Spread
http://slidepdf.com/reader/full/outlook-2016-spread 15/15
www.lpl.com
RES #5287 1115
Tracking #1-442417 (Exp. 11/16)
Member FINRA/SIPC
This research material has been prepared by LPL Financial LLC.
To the extent you are receiving investment advice from a separately registered independent investment advisor, pleasenote that LPL F inancial LLC is not an affiliate of and makes no representation with respect to such entity.
Not FDIC/NCUA Insured | Not Bank/Credit Union Guaranteed | May Lose Value | Not Guaranteed by any Government Agency | Not a Bank/Credit Union Deposit
Printed on recycled paper containing 10% post-consumer fiber