outline of our recent reporting segment changes - epson of our recent reporting segment changes ......
TRANSCRIPT

0

1
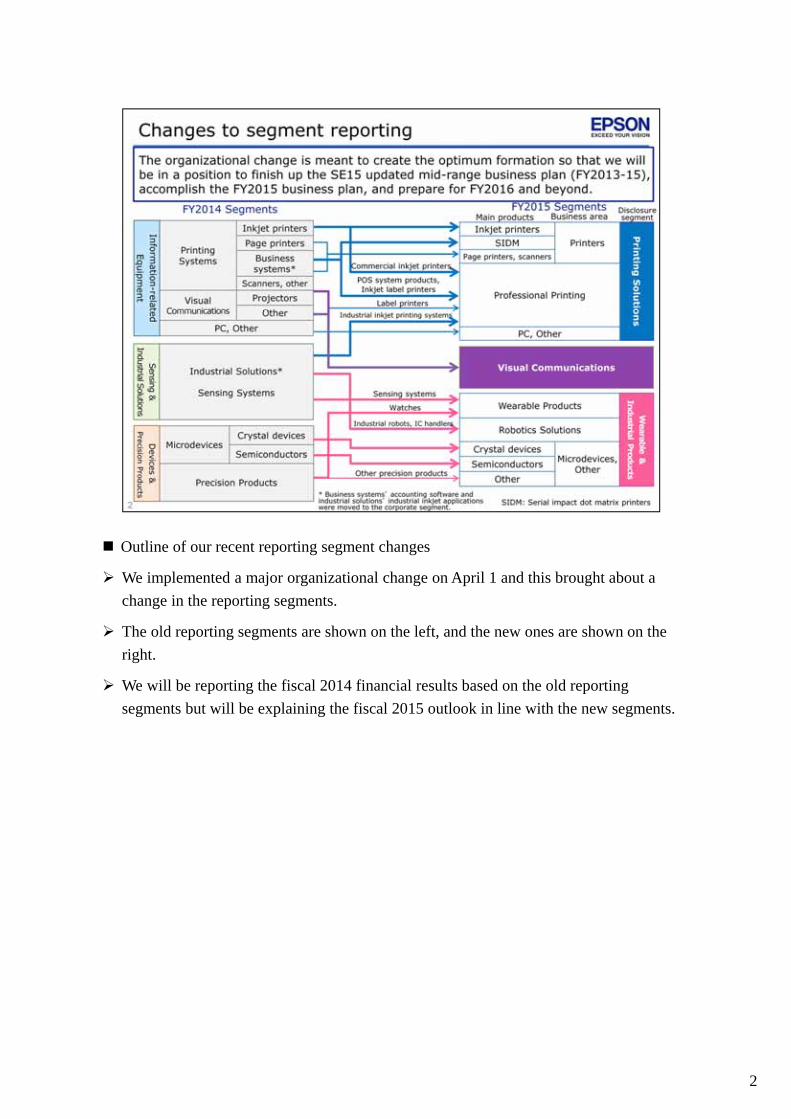
Outline of our recent reporting segment changes
We implemented a major organizational change on April 1 and this brought about a
change in the reporting segments.
The old reporting segments are shown on the left, and the new ones are shown on the
right.
We will be reporting the fiscal 2014 financial results based on the old reporting
segments but will be explaining the fiscal 2015 outlook in line with the new segments.
2

3

4
FY2014 full-year financial results
For the full 2014 fiscal year we recorded 1,086.3 billion yen in revenue, 101.2 billion yen in
business profit, and 112.7 billion yen in profit for the year.
Revenue and business profit were up 7.7% and 12.4% respectively, year over year, but both
were slightly lower than the previous outlook.

5
Revenue and business profit broken out by segment
Both information-related equipment and devices & precision products recorded
year-over-year revenue and business profit growth.
Revenue growth narrowed the loss in sensing & industrial solutions.

6
Revenue breakdown for the year in the businesses that make up information-related
equipment and devices & precision products.

7
FY2014 summary
During the 2014 fiscal year we made significant progress by executing strategies to develop technology,
introduce new products, and adopt new business models that will drive future growth.
The strategic actions that we rolled out, along with the effects of a weaker yen, enabled us to achieve
revenue and profit growth in every segment, even while we aggressively invested in future growth.

Progress on SE15 Updated Mid-Range Business Plan
We are not seeing steep growth in office printer unit shipments, but we are bolstering
the lineup with PrecisionCore models that will generate demand for consumables.
Unit shipments of high-capacity ink tank printers, on the other hand, are growing
steadily and, in fiscal 2014 we achieved year-over-year growth of 40%.
For the 2015 fiscal year we are forecasting steady unit shipment growth in all areas.
8

Progress on SE15 Updated Mid-Range Business Plan
We have achieved our aim for consumables, securing an increase in revenue for the
second consecutive year.
What is feeding sales of consumables is a growing install base of high-end home
printers, and office printers, both of which generate higher print volume, and we expect
sales to grow steadily in the 2015 fiscal year and beyond.
We see ongoing profit growth fueled by increased sales of high-capacity ink tank
printers and the aforementioned expanded sales of consumables.
9

FY2014 business profit change cause analysis
We believe that the results of our strategic actions are generally reflected in the change
factors.
10

11
FY2015 financial outlook
We see certain global economic risks, including a progressively weaker euro, the plummeting
value of Latin American currencies, the economic slump in Russia, and a slowdown in Japan.
At the same time as factoring these risks into our outlook, we set our foreign exchange
assumptions at 115 yen to the US dollar and 125 yen to the euro.
As shown here, we are forecasting 1,130 billion yen in revenue, up 43.6 billion yen year over
year. Business profit should come in at around 102 billion yen, a 700 million yen increase.
Profit from operating activities is expected to be about 100 billion yen. This represents a
decrease of 31.3 billion yen year over year, but our fiscal 2014 profit from operating activities
was pumped up by one-time gains, including a gain on the sale of fixed assets in addition to
an approximately 30 billion yen profit associated with changes in the defined benefit plan.

12
Full-year revenue outlook with the figures broken down by segment and by first and second half
We anticipate revenue growth in every segment. Specifically, we are forecasting
revenue of 757 billion yen in printing solutions, 191 billion yen in visual
communications, and 180 billion yen in wearable & industrial products.
The revenue growth in visual communications will come from projectors, where we
expect unit shipments to increase by 7% year over year, once again outstripping the
market growth rate. Providing traction for this growth is a broad lineup of projectors
that extends from entry-level models to high-brightness and interactive models.

13
Breakdown of revenue outlook in the printing solutions segment
In printers, fiscal 2015 overall inkjet printer market unit sales are expected to be flat year over
year, as sales in emerging economies will compensate for shrinking markets in developed
economies.
We will to continue to advance our strategies of expanding and making qualitative
improvements in the office printer install base, establishing and expanding new business
models such as managed print services, and expanding unit sales of high-capacity ink tank
printers.
We plan to increase inkjet printer unit shipments by 5% compared to last year, when we
shipped approximately 14 million units.
In addition, as I said earlier, we are seeing the benefits of an improved install base, and we
expect sales of consumables to steadily grow. Revenue for the printer business as a whole is
expected to increase.
We are planning for revenue growth in professional printing as a whole. In new market
segments, such as commercial photo, textile, and signage printers, we will expand unit and
consumables sales by creating sharply defined customer value and strengthening trust
relationships. Additional revenue growth will come from continuing efforts to develop new
areas such as mobile and intelligent POS and label printers.

14
Breakdown of revenue outlook in wearable & industrial products
In wearable products, we plan to grow revenue by increasing sales of luxury watches,
watches for the domestic market, extending the movements business and launching
new sensing products.
We expect to increase revenue in robotics solutions by capturing opportunities
presented by the expanding robot market and by growing sales of IC handlers.
As a whole, microdevices and other revenue will decrease. Semiconductor revenue
should be about the same as last year. Emphasizing profit rather than revenue growth,
we are looking to generate a favorable balance between using our existing facilities to
meet external and internal demand for chips and to complete silicon foundry orders. In
the quartz business, although we are seeing expanded sales of industrial, automotive,
and other high-added-value products boost the product mix, revenue will sink due to a
combination of shrinking orders for crystal devices used in consumer applications and
price erosion.

15
FY2015 full-year business profit outlook, with figures broken down by segment and by
half
Our forecast shows business profit of 113 billion yen in printing solutions, up 1.5
billion yen year over year, 23 billion yen in visual communications, up 3.5 billion yen,
and 11 billion yen in wearable & industrial products, up 600 million yen.

FY2015 highlights
FY2015 is the final year of the SE15 mid-range plan, and we are going to spend the year advancing the strategies we have in place.
We have factored in 9 billion yen in foreign exchange effects for the fiscal 2015 plan.
We are going to strategically spend about 15 billion yen on medium- and long-term growth. Investment is earmarked for items such as R&D for volume production of strategic products that will drive growth going forward, as well as on promotional campaigns to strengthen the Epson brand and expand in new areas.
At the same time, we expect to grow profit by around 25 billion yen by improving our existing businesses and developing new businesses in line with the mid-range plan, while at the same time factoring in the risk of the decline of Latin American currencies and political instability in Russia.
As a result, the fiscal 2015 financial outlook appears to show a very slight year-over-year increase in profit. In reality, however, when you break things down, you see that our strategic moves are yielding accelerating profit - enough profit to cover the risk of foreign exchange losses and, at the same time, enable aggressive, strategic investment in medium-term and sustained growth.
We are confident that Epson’s strategies are headed in the right direction, and we intend to stay the course.
16

Purpose of the organizational changes
For Epson to achieve sustained growth, we have to constantly improve our core
technologies, create customer value, expand our customer base, generate appropriate
profits and become an indispensable company that is valued and appreciated by all of our
stakeholders.
To attain this goal, we implemented a major organizational change on April 1 that will put
us in a better position to accelerate the execution of our strategies and plans.
We reorganized along technology and customer lines and combined management
resources. The new organizational structure optimizes functions across the corporate group
and lays a solid path for sustained growth.
With the new organization we are looking to ensure that the strategies we have carried out
under SE15 produce the desired outcomes and that we advance steadily toward increasing
corporate value in a way that is uniquely Epson's.
17

18

19
FY2014 fourth-quarter financial highlights
We recorded 271.5 billion yen in revenue for the quarter. That‘s an increase of 18.3 billion
yen year-over-year. Business profit came in at 15.8 billion yen, up 2.3 billion yen. Profit for
the period was 22.1 billion yen, a decline of 19.5 billion yen.
The decline in profit for the period was because of last year’s sudden financial turnaround,
that resulted in a large increase in deferred tax assets and significant negative tax expenses in
that period.
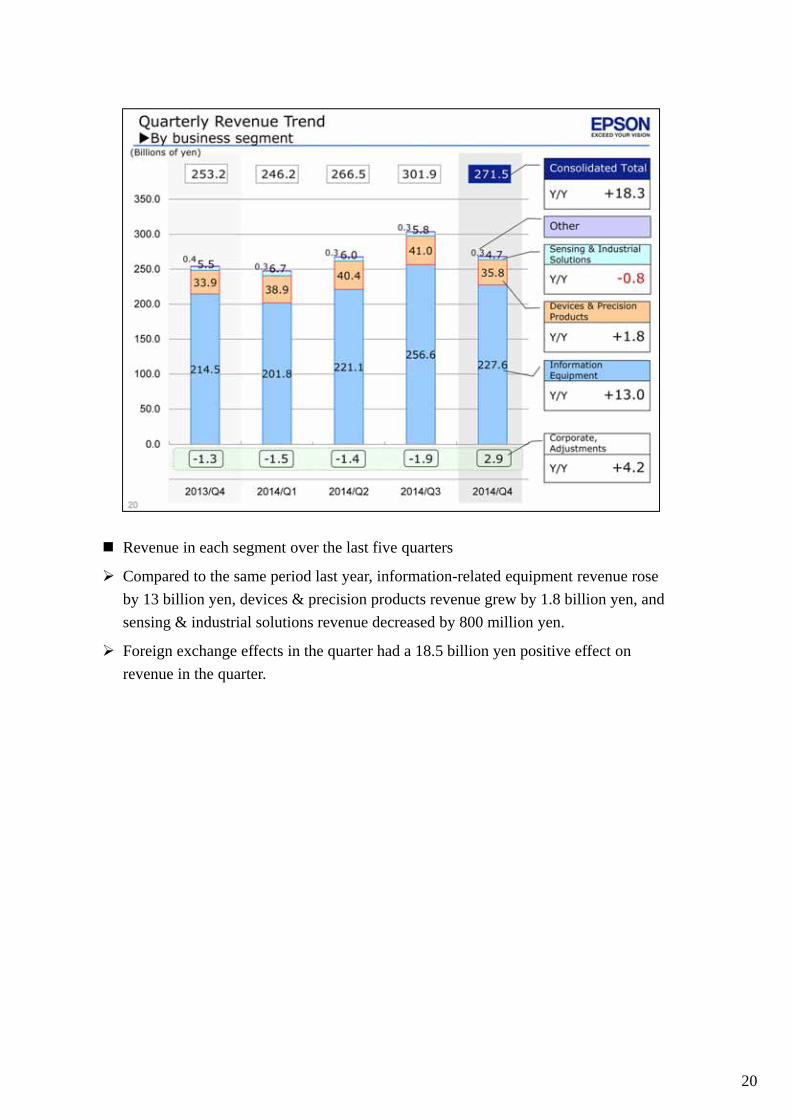
Revenue in each segment over the last five quarters
Compared to the same period last year, information-related equipment revenue rose
by 13 billion yen, devices & precision products revenue grew by 1.8 billion yen, and
sensing & industrial solutions revenue decreased by 800 million yen.
Foreign exchange effects in the quarter had a 18.5 billion yen positive effect on
revenue in the quarter.
20

Quarterly revenue in each business compared to the same period last year
In information-related equipment, printing systems revenue increased by 14.8 billion
yen and visual communications revenue increased by 2.2 billion yen, but PC and other
revenue decreased by 3.9 billion yen.
In devices & precision products, microdevices revenue increased by 400 million yen
and precision products revenue grew by 1.4 billion yen
I will go over the main factors affecting results in each business a little later when I
discuss business profit.
21

Quarterly selling, general and administrative expenses
Fourth-quarter SGA expenses increased compared to the same period last year, but these
expenses as a percentage of revenue changed very little. The main cause of the increase
in SGA expenses was the weaker yen and stronger dollar, which resulted in higher yen
conversion expenses. Contributing factors included higher advertising and sales
promotion expenses due to spending on campaigns to promote sales of high-capacity
ink tank printers and managed print services in developed economies, and other
promotions in new business domains. Another factor was higher transport costs
attributable to problems at critical ports.
22

Breakdown of quarterly business profit by segment
Compared to the same period last year, business profit in information-related
equipment decreased by 4.8 billion yen to end at 23.6 billion yen. Business profit in
devices & precision products grew by 2.8 billion yen to end at 2.6 billion yen. Sensing
& industrial solutions loss increased by 500 million yen to end at ¥3 billion yen.
Business profit in corporate and adjustments improved compared to the same period
last year owing to income from patent royalties.
23

Main factors or changes from the same period last year that affected our fourth quarter results
24

Main factors that affected our fourth-quarter performance versus the internal plan
Although business systems and visual communications were affected by environmental changes in some markets, there has been no significant change in the progress of our basic strategy and we have created a firm base for the 2015 fiscal year.
25

Cause analysis of the 2.3 billion yen increase in business profit compared to the same
period last year
We recorded 15.8 billion yen in business profit for the quarter, up from the 13.4 billion
yen we had in the same quarter last year. Profit was boosted by factors such as foreign
exchange effects, increased volume of high-capacity ink tank printers, and income from
patent royalties. These factors outweighed the items that pulled down on business profit,
such as the increase in SGA expenses associated with the strengthening of promotional
campaigns.
26
27
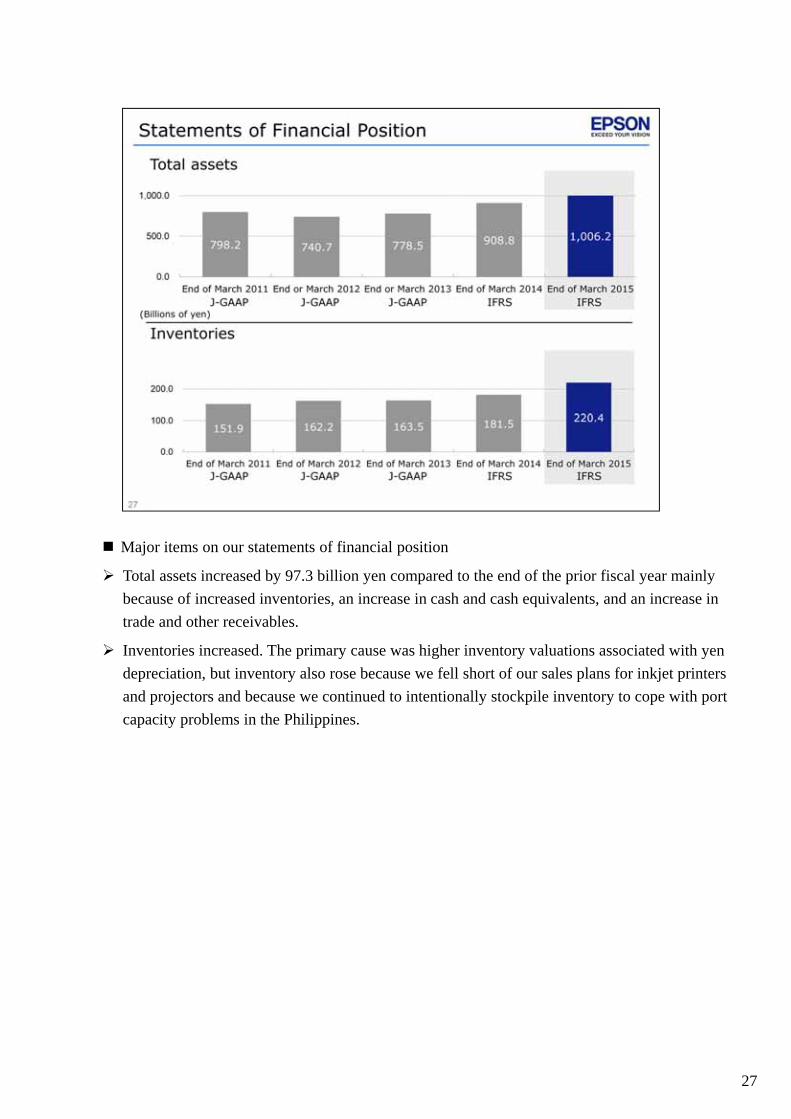
Major items on our statements of financial position
Total assets increased by 97.3 billion yen compared to the end of the prior fiscal year mainly
because of increased inventories, an increase in cash and cash equivalents, and an increase in
trade and other receivables.
Inventories increased. The primary cause was higher inventory valuations associated with yen
depreciation, but inventory also rose because we fell short of our sales plans for inkjet printers
and projectors and because we continued to intentionally stockpile inventory to cope with port
capacity problems in the Philippines.

28
Major items on our statements of financial position
Interest-bearing liabilities decreased by 34.6 billion yen compared to the end of the
previous fiscal year primarily due to a net decrease in short-term loans payable. The ratio
of interest-bearing liabilities to total assets declined to 18.5%.
Net interest-bearing liabilities sharply improved from the 9 billion yen at the end of the
previous fiscal year, and we had 59.3 billion yen in net cash.
Equity attributable to owners of the parent company increased by 131.9 billion yen
compared to the previous fiscal year-end, largely due to our performance during the period.
As a result, the ratio of equity attributable to owners of the parent company increased to
49.1%.

Outlook for capital expenditure and depreciation and amortization expenses
We anticipate a steep year-over-year increase in capital expenditure, to 70 billion yen, because
we plan to aggressively spend on strategic investments with an eye toward medium- and long-
term growth. We will invest in items such as R&D for next-generation products and core
devices, factory expansion in the Philippines and Indonesia to build production capacity over
the medium term, and increased production of hot-selling high-capacity ink tank printers and
projectors.
We are provisionally planning for 47 yen billion in depreciation and amortization expenses
because of a shift in the timing of investments and other factors.
29

Cash flows
In the 2015 fiscal year we are projecting 122.5 billion yen in cash flows from operating
activities, 67.5 billion yen in cash flows from investment activities, and 55 billion yen in
free cash flow.
30

Main management performance indicators
Given the foregoing financial outlook, our major financial management performance
indicators look like this. We forecast:
ROS of 9.0%, and
ROA of 10.1%.
We forecast ROE coming in at 13.5%. Although ROE was at a high level in the 2013
and 2014 fiscal years because of temporary factors affecting profit for the period such
as negative taxation expenses and a revision to the defined benefit corporate pension
system, these factors will not occur in fiscal 2015.
31

Dividend policy
As we announced at the time of our third quarter results, we set our dividend payments
from a 30% dividend payout ratio calculated from business profit from our core
business excluding an amount equivalent to the statutory effective tax rate.
Based on this policy, our dividend per share outlook will be 60 yen per share, after the
share splits that we undertook on April 1.
32

33