outdoor recreation trends: a national assessment of trends and futures for outdoor recreation,...
Post on 19-Dec-2015
218 views
TRANSCRIPT

Outdoor Recreation Trends:
A National Assessment of Trends and Futures for
Outdoor Recreation, Natural Amenity Migration and
Footprints
Ken Cordell, Forest Service Research, Athens, GA
A series of 4 national reports to be published in 2010
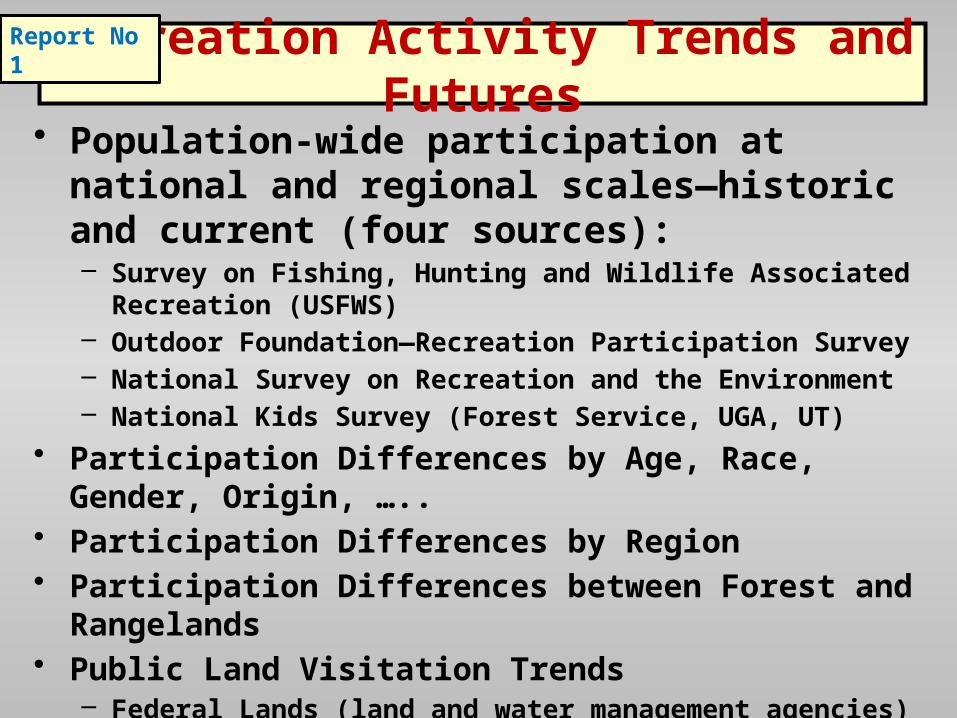
Recreation Activity Trends and Futures• Population-wide participation at national and
regional scales—historic and current (four sources):– Survey on Fishing, Hunting and Wildlife Associated Recreation
(USFWS)– Outdoor Foundation—Recreation Participation Survey– National Survey on Recreation and the Environment– National Kids Survey (Forest Service, UGA, UT)
• Participation Differences by Age, Race, Gender, Origin, …..• Participation Differences by Region• Participation Differences between Forest and Rangelands• Public Land Visitation Trends
– Federal Lands (land and water management agencies)– State Parks (state park systems)
• Projections of Demand to 2060 by IPCC Scenario
Report No 1

Bicycling
Fishing
Canoe/Kayak
Camping
0 5 10 15 20 25 30 35
Summer 1982 Summer 1965 Summer 1960
Shows in brief some of the historic outdoor recreation activity participation trends (percent of population) based on the for-
mer National Recreation Survey, 1960 - 1983.
The NSRE is a continuation of the NRS
Historic Trends, 1960 to 1980s
Percent of population 12+

Primary Sources for Current Outdoor Recreation Trends
• National Survey on Fishing, Hunting and Wildlife Associated Recreation (FWS)
• Outdoor Foundation’s National Outdoor Participation Survey (Topline Report)
• National Survey on Recreation and the Environment (NSRE)
• National Kids Survey (NKS)

Several opinions out there about current recreation trends, thus, other sources also will be summarized and integrated--Including…
Mediamark Research Inc. on Leisure Activities as reported in Census Statistical Abstract
Sporting Goods Manufacturing Assn. (sports participation)
National Household Travel Survey (U. S. DOT) American Time Use Survey (Bureau of Labor
Statistics) A variety of recreation related consumer expenditure
and recreation activities participation statistics in the 2009 Statistical Abstract

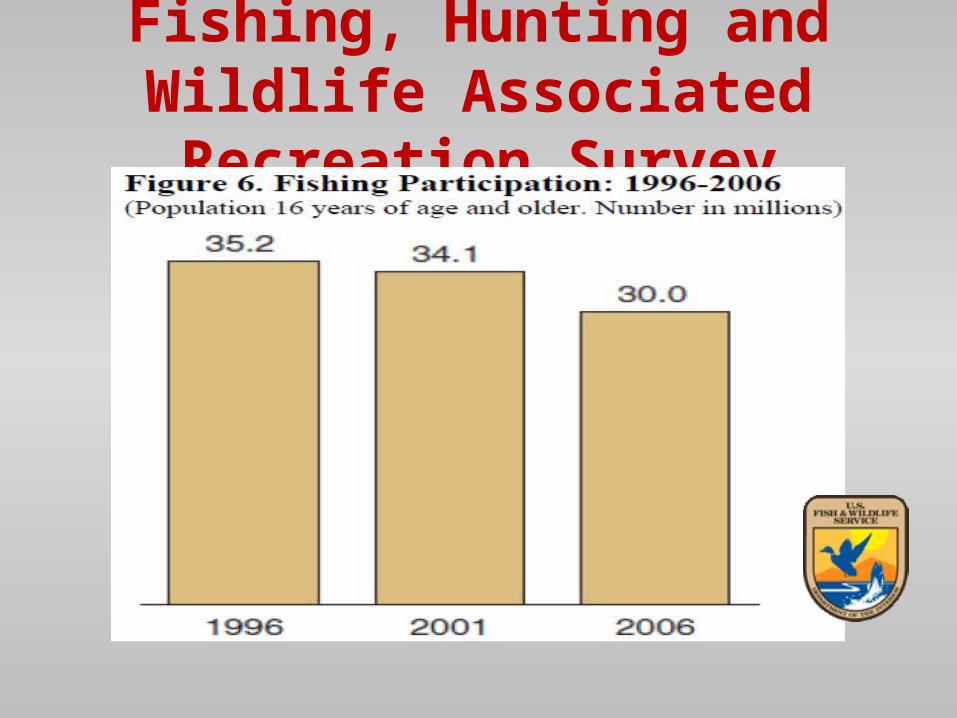
Fishing, Hunting and Wildlife Associated Recreation Survey
Current Trends in U. S.


Tuesday, October 27, 2009
The Outdoor Foundation 2009 Participation ToplineWashington, DC — Initial data from the 2009 Outdoor Recreation Participation Topline Report, published by The Outdoor
Foundation, shows that an increasing number of Americans returned to nature and active outdoor activities last year. The study finds sizeable participation increases in nearly every nature-based activity …including double-digit increases in backpacking, mountain biking and trail running and close to a ten percent increase in hiking and camping. Overall participation trends in recreation, sports and fitness remained largely unchanged from last year.
“Americans, once again, are finding solace and security, adventure and excitement in the great outdoors,” said Christine Fanning, executive director of The Outdoor Foundation. “During these challenging economic times, a return to affordable, nature-based recreation allows individuals, friends and families to reconnect — with one another, with the natural world and with natural values.”The Outdoor Foundation 2009 Outdoor Recreation Participation Topline Report also shows increases in many active outdoor activities among youth……… but overall, outdoor participation for youth ages 6 – 12 is down 7.6% from last year…… showing a continued need to focus on connecting kids and nature. “It is certainly encouraging to see an increase of youth participation in some important recreation categories, but more must be done,” continued Fanning. “Public and private partnerships, effective outreach programs and creative campaigns ……..
Being authored by Chris Fanning and Bryan Mahler , Outdoor Foundation
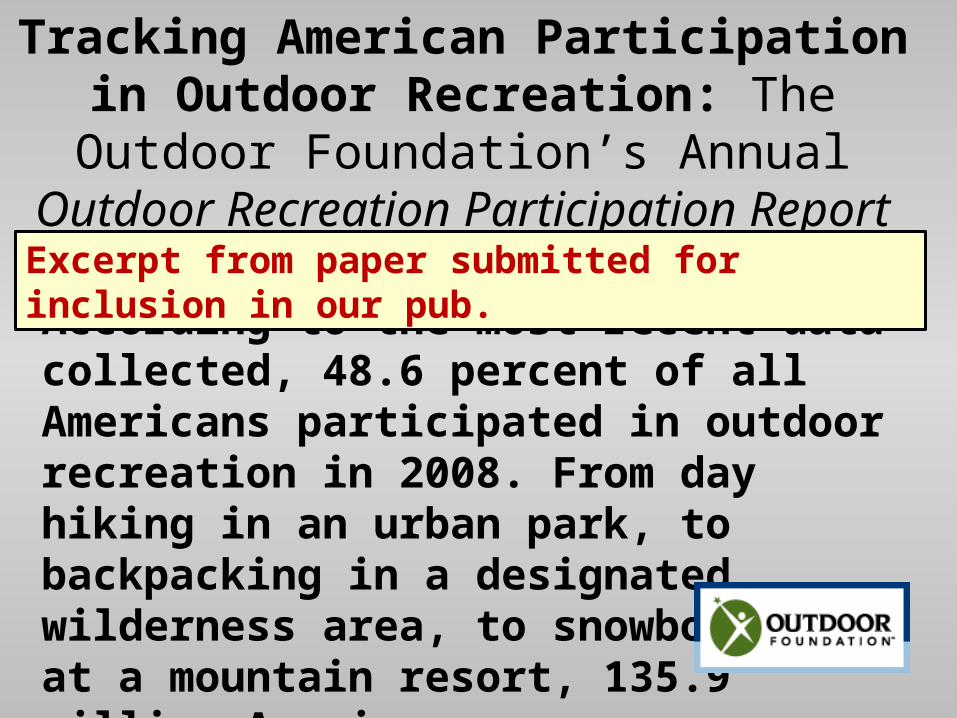
Tracking American Participation in Outdoor Recreation: The Outdoor
Foundation’s Annual Outdoor Recreation Participation Report
According to the most recent data collected, 48.6 percent of all Americans participated in outdoor recreation in 2008. From day hiking in an urban park, to backpacking in a designated wilderness area, to snowboarding at a mountain resort, 135.9 million Americans enjoyed the benefits of a healthy, active outdoor lifestyle...
Excerpt from paper submitted for inclusion in our pub.

6-12 13-17 18-24 25-44 45+0%
10%
20%
30%
40%
50%
60%
70%
CHART 1: Participation in Outdoor Recreation by Age

6-10
11-
15
16-
20
21-
25
26-
30
31-
35
36-
40
41-
45
46-
50
51-
55
56-
60
61-
65
66+
0
10
20
30
40
50
60
70
80
Females
Outdoor ActivitiesTeam SportsIndoor Fitness Activities
CHART 2: Lifecycle of Participation by Age and Gender
6-10
11-
15
16-
20
21-
25
26-
30
31-
35
36-
40
41-
45
46-
50
51-
55
56-
60
61-
65
66+
0
10
20
30
40
50
60
70
80
Males
Outdoor ActivitiesTeam SportsIndoor Fitness Activities

2000 2008150
200
250
40
60
80
100
208 220
67
86
Number Who Participate (million)
Number of Activity Days (billion)
Mil
lion
s w
ho
Par
tici
pat
e
Bil
lion
s of
Day
s+27.5%
+5.6%
Outdoor Recreation generally
NSRE Current Decade Trends---a wide variety of activities

A few top activities showing trends in number and percentage of people 16 and older participating,1999-2001 and 2005-2009
Activity
1994-95
Totalparticipants
(millions)
1999-01
Totalparticipants
(millions)
2005-09
Percent of Population
2005-09
Totalparticipants
(millions)
Percentchange 1999-01
to2005-09
Walk for pleasure 138.4 176.4 84.3 194.7 10.4
Family gatherings outdoors
128.2 158.2 74.4 171.9 8.7
Gardening or landscaping
. 139.3 66.8 154.3 10.7
View/photograph natural scenery
. 127.5 63.5 146.6 14.9
Visit nature centers, etc
110.9 121.3 55.4 128.0 5.5
NSRE Current Decade Trends---a wide variety of activities

Trends in number and percentage of people 16 and older participating in outdoor activities
Activity
1994-95
Totalparticipants
(1,000s)
1999-01
Totalparticipants
(1,000s)
2005-09
Percent of Population
2005-09
Totalparticipants
(1,000s)
Percentchange1999-01
to2005-09
Sledding 27,653.0 32,289.5 10.7 24,806.5 -23.2Saltwater fishing 22,938.5 22,339.9 10.7 24,756.8 10.8Baseball 16,018.3 13,776.4 10.3 23,788.2 72.7Soccer outdoors 11,245.1 15,974.1 10.3 23,749.4 48.7Backpacking 16,982.9 22,209.3 10.0 23,061.6 3.8Tennis outdoors 28,215.2 22,453.5 9.7 22,422.5 -0.1Horseback riding 20,701.5 20,664.2 9.7 22,343.0 8.1Canoeing 17,851.1 20,578.1 9.4 21,662.2 5.3Use personal watercraft 12,021.9 20,320.3 8.9 20,486.7 0.8Waterskiing 22,657.1 17,105.6 8.6 19,853.5 16.1Softball 30,999.0 21,300.9 8.5 19,700.2 -7.5Rafting 19,283.6 20,628.1 8.2 18,936.8 -8.2Horseback riding on trails 15,132.9 16,628.1 7.0 16,214.7 -2.5Big game hunting 19,002.6 17,919.6 6.9 15,998.4 -10.7Small game hunting 17,340.3 15,048.2 6.9 15,967.8 6.1
NSRE

Activity
1999-2001
Totaldays
2005-2009
Totaldays
Percentchange 1999-09
Change intotal days1999-09
Visit historic sites 697.1 693.3 -0.5 -3.8Migratory bird hunting 62.3 57.1 -8.3 -5.2Coldwater fishing 394.1 382.7 -2.9 -11.4Big game hunting 264.2 248.4 -6.0 -15.8Canoeing 143.4 121.1 -15.6 -22.3Cross-country skiing 63.8 33.1 -48.1 -30.7Saltwater fishing 282.9 251.1 -11.2 -31.8Snowmobiling 124.7 79.3 -36.4 -45.4Downhill skiing 147.3 93.7 -36.4 -53.6Horseback riding on trails 429.5 313.3 -27.1 -116.2Picnicking 942.1 799.9 -15.1 -142.2Mountain biking 1,353.9 900.7 -33.5 -453.2Day hiking 2,520.0 2,059.2 -18.3 -460.8
Days on which participation
occurred across all participants
NSRE

Demographic Stratum Percent of participants
Percentof nation
Ratio(1)/(2)
Percent participating
Gender Male 62.9 48.2 1.30 26.6
Female 37.1 51.8 0.72 14.6
Race/ethnicity White, non-Hispanic 73.7 67.3 1.10 22.5
Black, non-Hispanic 7.0 13.9 0.50 10.6
American Indian, non-Hispanic 0.9 0.8 1.13 25.6
Asian or Pacific Islander, non-Hispanic 1.2 3.6 0.33 6.7
Hispanic 17.3 14.4 1.20 24.5
Age 16-24 26.0 15.8 1.65 33.3
25-34 22.6 16.2 1.40 29.4
35-44 20.2 16.9 1.20 25.3
45-54 16.6 17.6 0.94 19.1
55-64 7.9 13.6 0.58 11.9
65+ 6.7 20.0 0.34 6.8
Education Less than high school 23.5 24.0 0.98 19.6
High school graduate 28.4 26.9 1.06 21.6
Some college 30.3 26.8 1.13 23.4
College degree 12.7 14.4 0.88 18.0
Post-graduate degree 5.0 7.9 0.63 13.1
. . . .
Annual family income <$15,000 8.9 16.5 0.54 11.5
$15,000-$24,999 7.5 11.4 0.66 13.2
$25,000-$49,999 29.3 27.4 1.07 22.9
$50,000-$74,999 19.7 18.3 1.08 22.8
$75,000-$99,999 15.6 11.1 1.41 28.0
$100,000-$149,999 11.9 9.4 1.27 26.3
$150,000+ 7.0 6.0 1.17 23.5
Place of residence Non-metro resident 23.5 17.5 1.34 27.5
Metro area resident 76.5 82.5 0.93 18.9
Driving off-road vehicles (ATVs etc.)

Demographic Stratum Percent of participants
Percentof nation
Ratio(1)/(2)
Percent participating
All groups All people age 16 & older . . . 18.2. . . .
Gender Male 62.0 48.2 1.29 23.3
Female 38.0 51.8 0.73 13.4
Race/ethnicity White, non-Hispanic 70.1 67.3 1.04 19.0
Black, non-Hispanic 10.3 13.9 0.74 13.8
American Indian, non-Hispanic 0.9 0.8 1.13 25.4
Asian or Pacific Islander, non-Hispanic 2.2 3.6 0.61 10.3
Hispanic 16.5 14.4 1.15 20.7
Age 16-24 24.2 15.8 1.53 27.7
25-34 21.0 16.2 1.30 24.3
35-44 24.1 16.9 1.43 26.6
45-54 17.8 17.6 1.01 18.0
55-64 8.2 13.6 0.60 10.7
65+ 4.8 20.0 0.24 4.4
Education Less than high school 20.1 24.0 0.84 15.0
High school graduate 23.6 26.9 0.88 16.0
Some college 27.4 26.8 1.02 18.8
College degree 18.5 14.4 1.28 23.0
Post-graduate degree 10.4 7.9 1.32 24.0
Annual family income <$15,000 10.9 16.5 0.66 13.1
$15,000-$24,999 6.4 11.4 0.56 10.5
$25,000-$49,999 24.9 27.4 0.91 17.8
$50,000-$74,999 19.1 18.3 1.04 20.9
$75,000-$99,999 14.8 11.1 1.33 24.2
$100,000-$149,999 14.9 9.4 1.59 29.9
$150,000+ 9.1 6.0 1.52 29.2
. . . .
Place of residence Non-metro resident 17.3 17.5 0.99 18.0
Metro area resident 82.7 82.5 1.00 18.2
Mountain biking

Demographic Stratum Percent of participants
Percentof nation
Ratio(1)/(2)
Percent participating
All groups All people age 16 & older . . . 11.8. . . .
Gender Male 83.2 48.2 1.73 20.4
Female 16.8 51.8 0.32 3.8
. . . .
Race/ethnicity White, non-Hispanic 84.8 67.3 1.26 14.9
Black, non-Hispanic 4.7 13.9 0.34 4.0
American Indian, non-Hispanic 0.9 0.8 1.13 14.2
Asian or Pacific Islander, non-Hispanic 1.1 3.6 0.31 3.8
Hispanic 8.4 14.4 0.58 6.9
. . . .
Age 16-24 20.4 15.8 1.29 15.3
25-34 19.2 16.2 1.19 14.1
35-44 19.7 16.9 1.17 13.8
45-54 20.0 17.6 1.14 13.5
55-64 11.2 13.6 0.82 9.8
65+ 9.6 20.0 0.48 5.7
. . . .
Education Less than high school 22.6 24.0 0.94 11.1
High school graduate 33.2 26.9 1.23 14.5
Some college 28.0 26.8 1.04 12.2
College degree 11.8 14.4 0.82 9.6
Post-graduate degree 4.4 7.9 0.56 6.5
. . . .
Annual family income <$15,000 9.5 16.5 0.58 7.2
$15,000-$24,999 9.1 11.4 0.80 10.0
$25,000-$49,999 28.7 27.4 1.05 13.1
$50,000-$74,999 21.5 18.3 1.17 14.8
$75,000-$99,999 14.9 11.1 1.34 16.8
$100,000-$149,999 10.0 9.4 1.06 13.4
$150,000+ 6.4 6.0 1.07 13.4
. . . .
Place of residence Non-metro resident 31.5 17.5 1.80 21.1
Metro area resident 68.5 82.5 0.83 9.8
Hunting
North SouthRocky
Mountains Pacific Coast
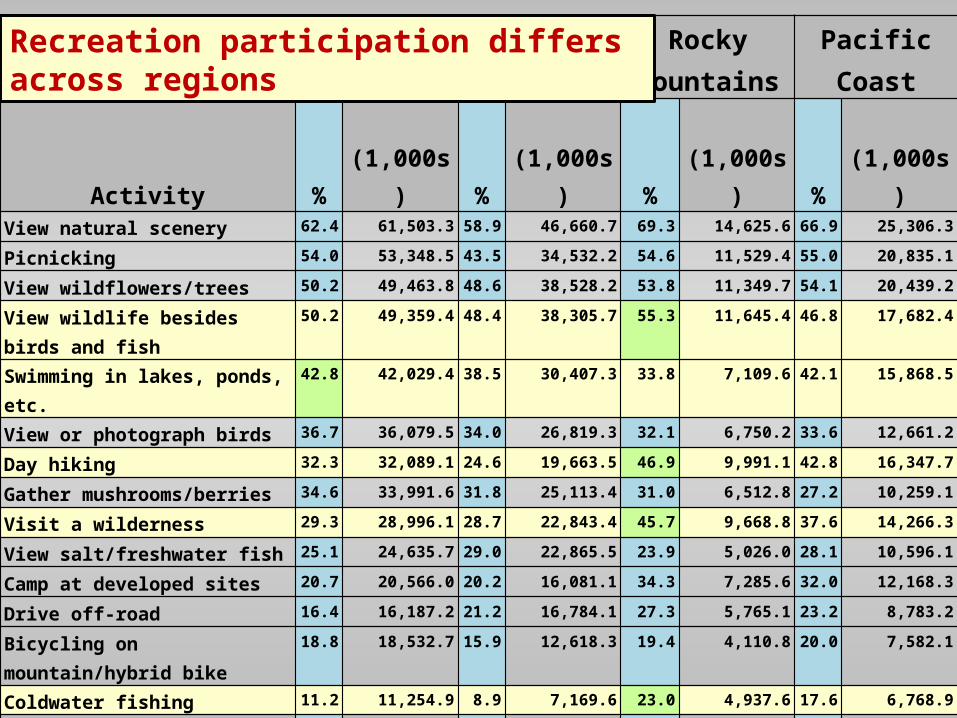
Activity % (1,000s) % (1,000s) % (1,000s) % (1,000s)View natural scenery 62.4 61,503.3 58.9 46,660.7 69.3 14,625.6 66.9 25,306.3
Picnicking 54.0 53,348.5 43.5 34,532.2 54.6 11,529.4 55.0 20,835.1
View wildflowers/trees 50.2 49,463.8 48.6 38,528.2 53.8 11,349.7 54.1 20,439.2
View wildlife besides birds and fish 50.2 49,359.4 48.4 38,305.7 55.3 11,645.4 46.8 17,682.4
Swimming in lakes, ponds, etc. 42.8 42,029.4 38.5 30,407.3 33.8 7,109.6 42.1 15,868.5
View or photograph birds 36.7 36,079.5 34.0 26,819.3 32.1 6,750.2 33.6 12,661.2
Day hiking 32.3 32,089.1 24.6 19,663.5 46.9 9,991.1 42.8 16,347.7
Gather mushrooms/berries 34.6 33,991.6 31.8 25,113.4 31.0 6,512.8 27.2 10,259.1
Visit a wilderness 29.3 28,996.1 28.7 22,843.4 45.7 9,668.8 37.6 14,266.3
View salt/freshwater fish 25.1 24,635.7 29.0 22,865.5 23.9 5,026.0 28.1 10,596.1
Camp at developed sites 20.7 20,566.0 20.2 16,081.1 34.3 7,285.6 32.0 12,168.3
Drive off-road 16.4 16,187.2 21.2 16,784.1 27.3 5,765.1 23.2 8,783.2
Bicycling on mountain/hybrid bike 18.8 18,532.7 15.9 12,618.3 19.4 4,110.8 20.0 7,582.1
Coldwater fishing 11.2 11,254.9 8.9 7,169.6 23.0 4,937.6 17.6 6,768.9
Backpacking on trails 8.0 8,043.0 7.6 6,141.4 16.1 3,440.7 13.9 5,349.1
Canoeing 11.7 11,473.1 8.6 6,769.5 6.8 1,415.4 6.5 2,418.9
Big game hunting 6.7 6,518.4 8.1 6,336.0 11.0 2,306.8 3.1 1,151.7
Small game hunting 6.6 6,402.7 8.0 6,264.8 9.8 2,045.5 3.4 1,279.3
Kayaking 6.3 6,244.5 4.3 3,400.3 4.4 926.5 7.4 2,805.9
Recreation participation differs across regions

2000 2008150
200
250
40
60
80
100
208 220
67
86
Number Who Participate (million)
Number of Activity Days (billion)
Mil
lion
s w
ho
Par
tici
pat
e
Bil
lion
s of
Day
s+27.5%
+5.6%
Outdoor Recreation generally

-1
-0.5
0
0.5
1
Anadromous fishing Big game hunting Coldwater fishing Migratory bird hunting
Saltwater fishing Small Game hunting Warmwater fishing
The Trend Story---Total annual recreation activity days, moving 3-year averages
Hunting and Fishing
The trend, Steady2000 = 0.0
<(Moving avg ÷ 2000) -1>
NSRE Data
-1
-0.5
0
0.5
1
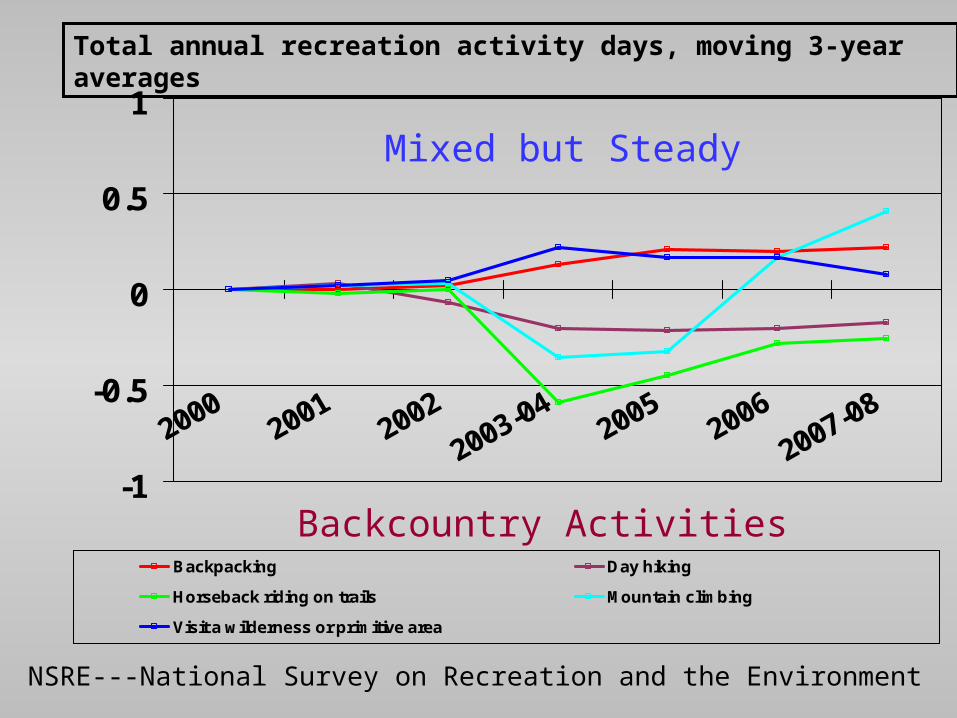
Backpacking Day hiking
Horseback riding on trails Mountain climbing
Visit a wilderness or primitive area
Total annual recreation activity days, moving 3-year averages
NSRE---National Survey on Recreation and the Environment
Backcountry Activities
Mixed but Steady

-1
-0.5
0
0.5
1
Canoeing Kayaking Rafting Rowing Sailing
Total annual recreation activity days, moving 3-year averages
NSRE – National Survey on Recreation and the Environment
Non-Motor Boating Activities
Mixed, slight decline overall

Total annual recreation activity days, moving 3-year averages
NSRE – National Survey on Recreation and the Environment
-1
-0.5
0
0.5
1
20002001
2002
2003-042005
2006
2007-08
Cross country skiing Downhill skiing Snowboarding
Snow Skiing and Boarding
Going down

Total annual recreation activity days, moving 3-year averages
NSRE – National Survey on Recreation and the Environment
-1
-0.5
0
0.5
1
Motorboating Off-highway vehicle driving Snowmobiling
Use personal watercraft Waterskiing
Motorized Activities
One up, one down

NSRE – National Survey on Recreation and the Environment
Total annual recreation activity days, moving 3-year averages
Viewing/Photographing Nature
Reached new Plateau
-1
-0.5
0
0.5
1
View/photograph birds View/photograph natural scenery
View/photograph other wildlife View/photograph wildflowers, trees, etc.

Total annual recreation activity days, moving 3-year averages
Indexing for Groupings of Activities
-1
-0.5
0
0.5
1
20002001
2002
2003-042005
2006
2007-08
Hunting /Fishing Backcountry Activities Non-Motor Boating
Snow Skiing Motorized Activities Viewing Activities
Viewing/Photographing Up, Skiing Down
NSRE – National Survey on Recreation and the Environment

2000 2008150
200
250
40
60
80
100
208 220
67
86
Number Who Participate (million)
Number of Activity Days (billion)
Mil
lion
s w
ho
Par
tici
pat
e
Bil
lion
s of
Day
s+27.5%
+5.6%
Outdoor Recreation generally
2000 2008100
150
200
250
20
40
60
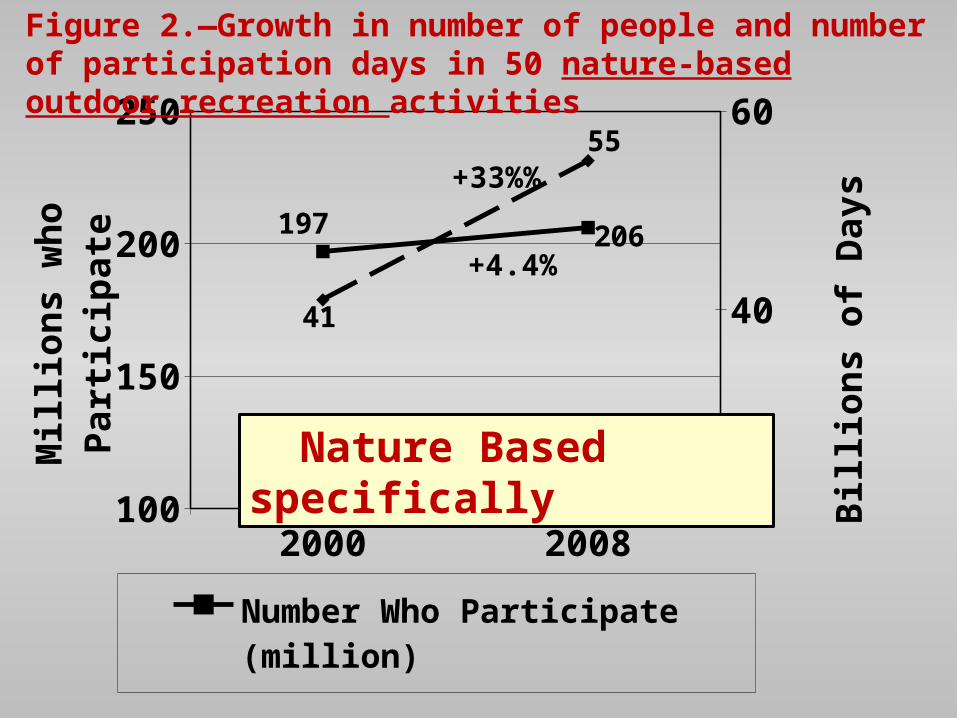
197 206
41
55
Number Who Participate (million)
Number of Activity Days (billion)
Mill
ion
s w
ho
Par
tici
pat
e
Bill
ion
s o
f D
ays+33%
%
+4.4%
Figure 2.—Growth in number of people and number of participation days in 50 nature-based outdoor recreation activities
Nature Based specifically

Gender and Time Outdoors Per Day Male Female
TimeWeek-
dayWeekend
dayWeek-
dayWeekend
dayNone 2.5 4.1 2.6 4.9
Less than 1/2 hour a day 3.6 0.9 6.2 3.6
About 1/2 hour a day 6.9 3.2 10.2 5.0
About 1 hour 19.6 10.3 26.6 14.4
2-3 hours 32.0 24.9 30.8 29.5
4 or more hours 35.4 56.6 23.6 42.6
Findings from the National Kids Survey—Time outdoors, Youth age 6 - 19

Age and Time Outdoors 6-9 10-12 13-15 16-19
TimeWeek-
dayWeekend
dayWeek-
dayWeekend
dayWeek-
dayWeekend
dayWeek-
dayWeekend
dayNone 2.4 2.6 3.9 4.5 1.8 3.1 2.3 7.7
Less than 1/2 hour a day
4.4 2.0 2.8 1.1 5.1 1.0 6.9 4.4
About 1/2 hour a day
8.9 2.0 7.4 4.6 8.2 3.8 9.4 6.2
About 1 hour 26.4 10.4 25.2 6.0 17.4 12.0 22.0 19.6
2-3 hours 35.1 29.5 28.2 26.9 33.6 29.2 28.0 23.1
4 or more hours 22.8 53.4 32.6 57.0 33.9 50.9 31.4 39.1
Findings from the National Kids Survey—Time outdoors

Outdoor Activity Male Female TotalJust play outdoors or hang out 87.5 78.4 83.0Biking, jogging, walking, skate boarding, etc 77.7 80.1 78.8Listen to music, watch movies, or use electronic device 51.3 59.5 55.4Playing or practicing team sports 60.5 40.3 50.8Reading or studying while sitting outdoors 38.5 51.1 44.5Other sports, e.g., tennis, golf 37.5 35.5 36.6Attending camps, field trips, outdoor classes 30.8 39.1 34.8Bird watching, wildlife viewing, etc 28.2 33.1 30.5Swimming, diving, snorkeling, etc 29.3 28.8 28.9Hiking, camping, fishing, etc 29.0 26.7 27.8Riding motorcycles, ATVs, other off-road vehicles 24.4 15.8 20.2Other outdoor activities 10.3 11.6 10.9Snow skiing, snowboarding, cross-country skiing 9.4 8.4 8.9Boating, jet skiing, water skiing, etc 7.9 7.2 7.5Rowing, kayaking, canoeing, surfing, etc 8.5 6.3 7.4
Findings from the National Kids Survey—Outdoor activities

Reasons Male Female TotalInterested in music, art, reading, etc 50.0 66.4 57.9
Interested in video games, DVDs and tv 55.9 41.0 48.6
Interested in Internet, text messaging, etc 38.4 57.7 47.8
More involved in indoor sports 34.5 41.3 37.8
Other reason time not spent outdoors 28.3 38.7 33.3
Neighborhood does not have good access 22.0 28.7 25.2
Spend time at mall, shopping, hanging out 21.2 26.4 23.7
Don't have anyone to play outdoors with 19.9 23.2 21.5
Don't have transportation 16.5 24.8 20.6
It is not safe to play or do sports outside 16.9 9.8 13.4
Was injured or developed a health problem 9.8 6.0 8.0
Estimated percentages of kids in the U.S. by gender and reason for not spending more time, 2007 – 2009

Percent of youth 6 to 19 indicating the activity in which they spent the most time in past week
Activity spent most time doing PercentJust play outdoors or hang out 27.1
Playing/practicing team sports 25.5
Biking, jogging, walking, skate boarding, etc 18.4
Swimming, diving, snorkeling, etc 6.6
Reading, studying while sitting outdoors 6.1
Playing/practicing other sports 3.7
Riding motorcycles, ATVs, other off-road vehicles 3.5
Hiking, camping, fishing, etc. 3.3
Other 2.3
Attending camps, field trips, outdoor classes 1.5
Snow skiing, snowboarding, cross-country skiing 0.7
Bird watching, wildlife viewing, nature study 0.6
Rowing, kayaking, canoeing, surfing, etc 0.3
Boating, jet skiing, water skiing, etc 0.3

Who influenced your decision to participate in outdoor activities?
Parents
Friends
Community program (Boy Scouts, YMCA, neighborhood program)
TV, movies, magazines, books, web sites about the outdoors
0% 20% 40% 60% 80%

Some more interesting stuff from NSREWhen considering rising gasoline and transportation prices, percent who said they took fewer, about the same number, or more trips for their favorite activity compared with 12 months ago (n=982)
Trips taken compared to last year Percent
Fewer 44.5
About the same 43.2
More 8.6
Refused 2.0
Don't know 1.7
100.0
Percent who cited selected reasons for taking fewer trips for their favorite activity compared to a year ago (n=431)
Reason for taking fewer trips Percent
Reduced number of trips anywhere
52.9
Found places closer to home 41.4
Found other outdoor activities to do
46.2
Spend more time indoors 55.6
Other reasons why you are now taking fewer trips
73.9
Over 1/2

Visitation to Public Lands• A paper last year in the PNAS said that public land
visitation was in steep decline.• But, agency data showed that state park, national
park, national wildlife refuge and BLM visitation actually has been relatively stable or increasing since the 90s.
• State park visitation in 2008 rose back above the former level reportedin 2001 (a 1.6% increase) (NationalAssociation of State Park Directors, 2009).
• National Park visitation has beenstable since 2001 (275 in 2008)
• National wildlife refuge visitationhas grown from 33 million in 1998 to over 41 million in 2008, growth of 24 percent
Year (Millions of Visits)1975 4711985 6601995 7462000 7672001 7352003 7352005 7152006 7112007 7402008 747
State Park Trend
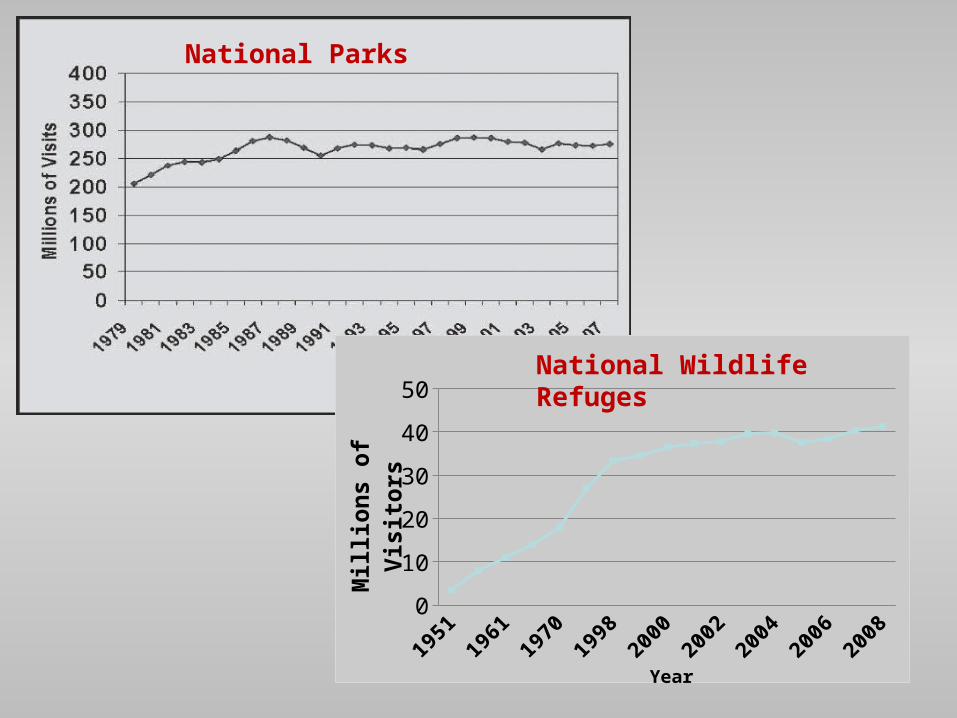
National Parks
Add graph showing National Refuge Visitation
0
10
20
30
40
50
Year
Mil
lio
ns
of
Vis
ito
rsNational Wildlife Refuges

Visit a wilderness 14.2% 971.8 15.0% 1,137.5 17.1% 165.7
NSRE Estimates of visits to wilderness or other wild or primitive places
1999-2001 2005-2009 Change 1999-2009
NSRE since 1994

Contributions from other Scientists—so farRichard Aiken and Anna Harris (FWS)
Preserving the Hunting Heritage: Rise in Youth HuntingChris Fanning and Brian Mauher (Outdoor Foundation)
Active Outdoor ParticipationBarry A. Garst, Daniel R. Williams (RMRS), and, Joseph W. Roggenbuck
Trends in Developed Forest CampingDebbie Chavez (PSW)
Geocaching: Form, Function & OpportunityLatinos and Outdoor Recreation
Glen Hvenegaard (U. Alberta)Wildlife Festivals in North America: Growth and Economic
ImportancePat Winter (PSW)
The Intersection of Trust and Recreation ManagementThe Sustainability of Outdoor Recreation and Tourism: Findings from
a Survey of Forest Service ManagersValues of the Urban Wilderness Visit
Others which are hopefully coming (Don English/Stan Zarnoch, Visitation to NFs //Neal Haggendorn, Visits to AK NFs //Gary Green et al, Constraints to
Recreation Participation//……….)

Summary of Trends
• Recreation activities widely popular in the 1950s through the 1980s, were still popular at the turn of the century
• However, there have been many profound changes over the last 50 years that affect what people choose to do (or not do) for their outdoor recreation
• The popularity of outdoor recreation continued to grow up through the beginning of this decade , and change, e.g., popularity of birding and some forms of motorized activity.
• By the beginning of this century, rising interest in observing and studying/learning about nature was becoming quite evident
• A very noticeable change by 2000ish was growth in the proportion of the total population that participated in outdoor activities.

Summary of Trends
• Outdoor recreation generally, and nature-based recreation especially, are still growing through 2009.
• The mix of Americans’ activities, however, is continuing to change (noticeably, rising interest in viewing/photographing nature and motorized off-highway riding)
• In the meantime, interest in some of the more traditional activities have been declining (e.g., picnicking, visiting historic sites, canoeing, rafting)
• The jury is still out on time and activities by Kids outdoors, but it is clear they do spend time outdoors

Forecasting Future Recreation Participation
• Forecast outdoor recreation participation and participation days 2010 to 2060 for:
–17 activities/groupings–National & 4 RPA regions–3-ish story lines/scenarios–3 x 5 x 17 x 2 some serious simulatin’

10 Primary Activities
• Birding• Equestrian• Hiking/backpacking• Canoeing/kayaking/rafting• Fishing• Hunting• Snow skiing/snow boarding• Motorized off-road use• Motorized water use• Motorized snow use

7 Activity Groupings• Viewing, photographing, studying, gathering nature (birds,
scenery, flowers/trees, wildlife, fish, gathering natural products)• Visiting interpretive sites (nature centers, zoos, historic sites,
prehistoric sites)• Using developed sites (Family gatherings, picnicking, developed
camping)• Winter activities (ice skating, cross country, sledding, snow
shoeing)• Swimming (swimming, visit a beach, visit another waterside,
surfing, snorkeling, diving)• Challenge activities (mountain biking, mountain climbing, rock
climbing, caving)• Visiting primitive areas, primitive camping,backpacking

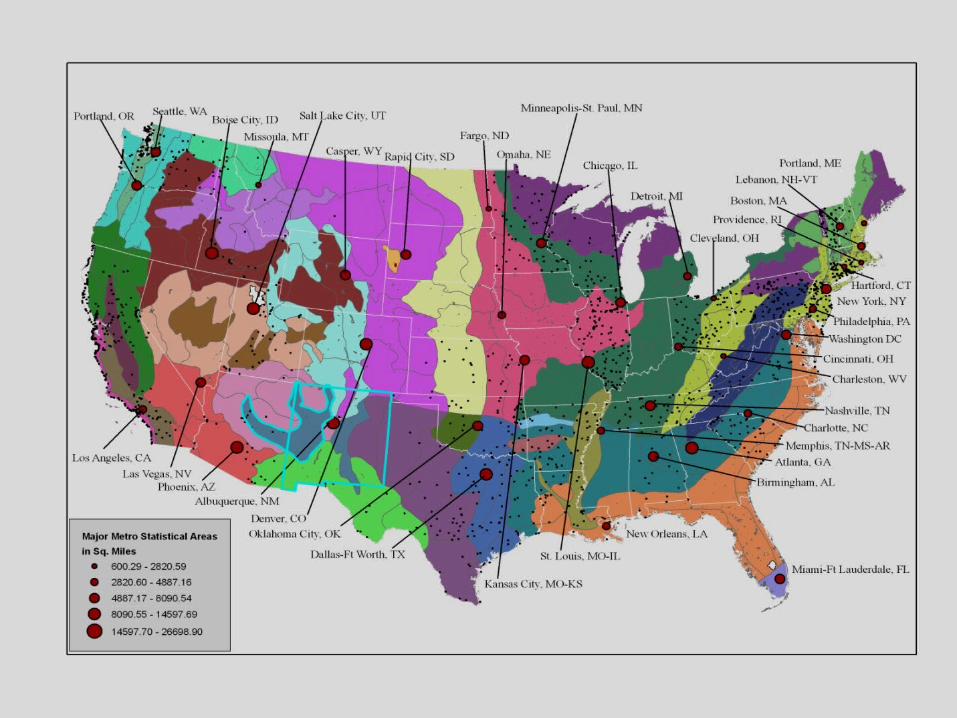
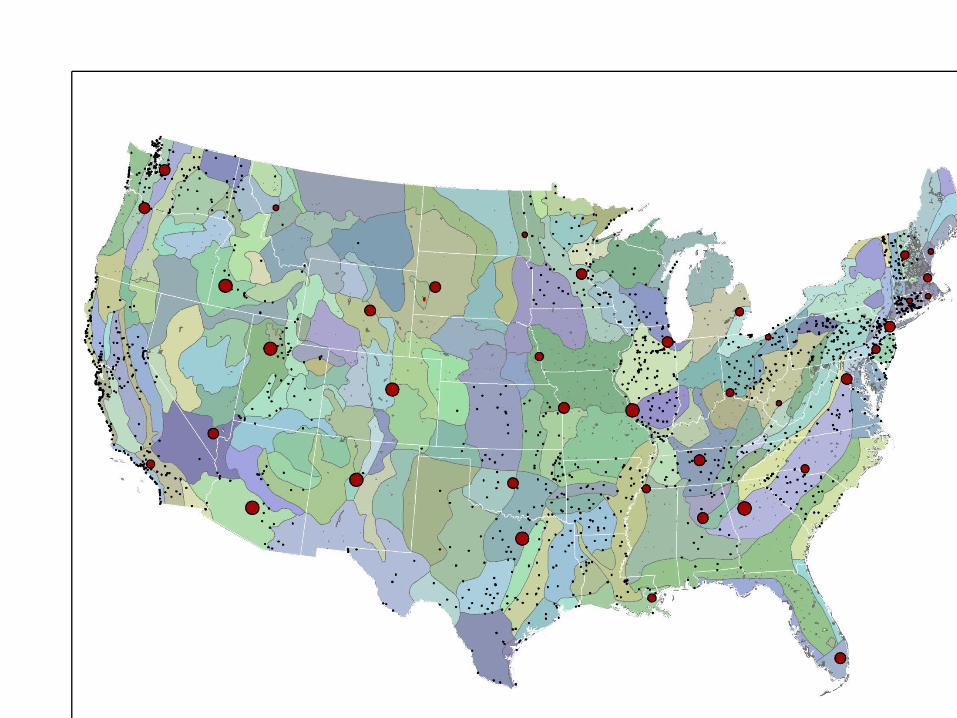
2. Recreation and protected land resources: National, regional and county patterns
• Nature Based Recreation Resources• Recreation access to private lands (NWLOS, Brett Butler)• Recreation access to other private lands• Private business sector (County Business Patterns)• Second and vacation homes (Census of Housing and NSRE second home
ownership Qs)• Private sector role in providing services on public land (Margaret Bailey,
HCM, 10/20/09)• Local Government Systems (Harnik on largest cities)• State Park Systems (Including NASPD survey data)• Federal Government Systems (RECGOV)
• Protected Lands• Private• Local Government• State Government• Federal Wilderness System• Other Federal Systems

Creating recreation and amenities data base with individual and neighboring counties by distance zones:
*Distance zones include within, 30, 50, 100 and 200 miles
• AMENITIES Climate, natural features, housing units• LANDAREA Total land and water area, federal and state• RECGOV Federal recreation sites/facilties• CBP07 2007 Co. Business Patterns recreation bus.• LOCALGOVT 2007 Census of Governments, local P&R• POP Population projections to 2060, IPCC A1/A2/ B2
• DPI_A1 Disposable personal income based A1/A2/B2• LANDUSE Land use projections to 2062, Ralph’s• Other Vars. Airports, seasonal homes,
NORSIS
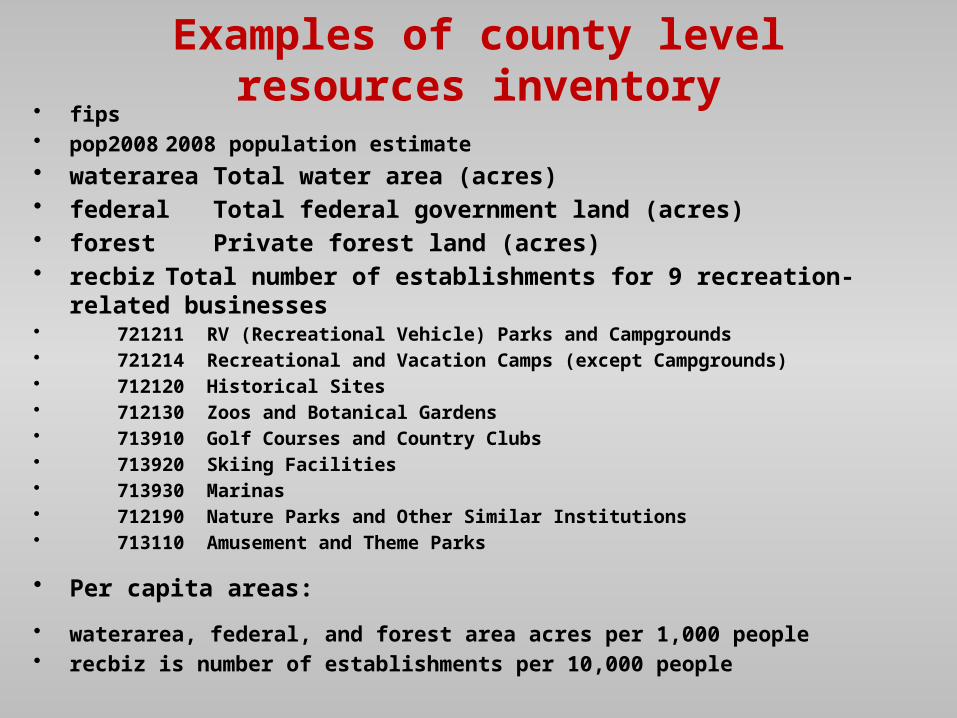
Examples of county level resources inventory• fips• pop2008 2008 population estimate• waterarea Total water area (acres)• federal Total federal government land (acres)• forest Private forest land (acres)• recbiz Total number of establishments for 9 recreation-related businesses• 721211 RV (Recreational Vehicle) Parks and Campgrounds• 721214 Recreational and Vacation Camps (except Campgrounds)• 712120 Historical Sites• 712130 Zoos and Botanical Gardens• 713910 Golf Courses and Country Clubs• 713920 Skiing Facilities• 713930 Marinas• 712190 Nature Parks and Other Similar Institutions• 713110 Amusement and Theme Parks
• Per capita areas:
• waterarea, federal, and forest area acres per 1,000 people• recbiz is number of establishments per 10,000 people
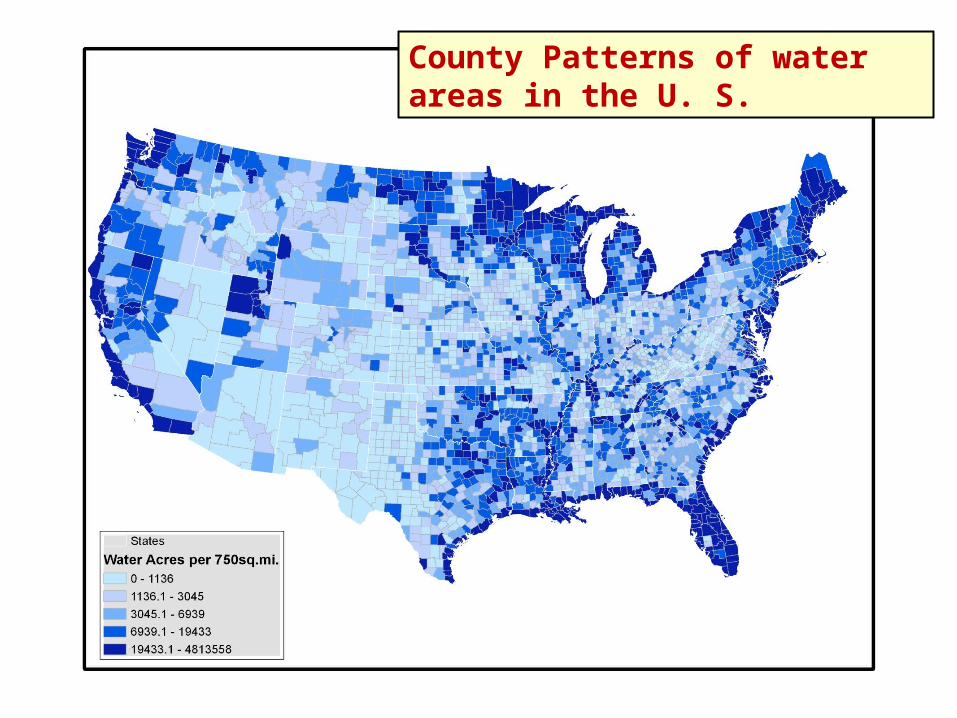
County Patterns of water areas in the U. S.

County Patterns of federal lands in the U. S.

County Patterns of forest area in the U. S.

County Patterns of numbers of businesses connected to outdoor recreation in the U. S.

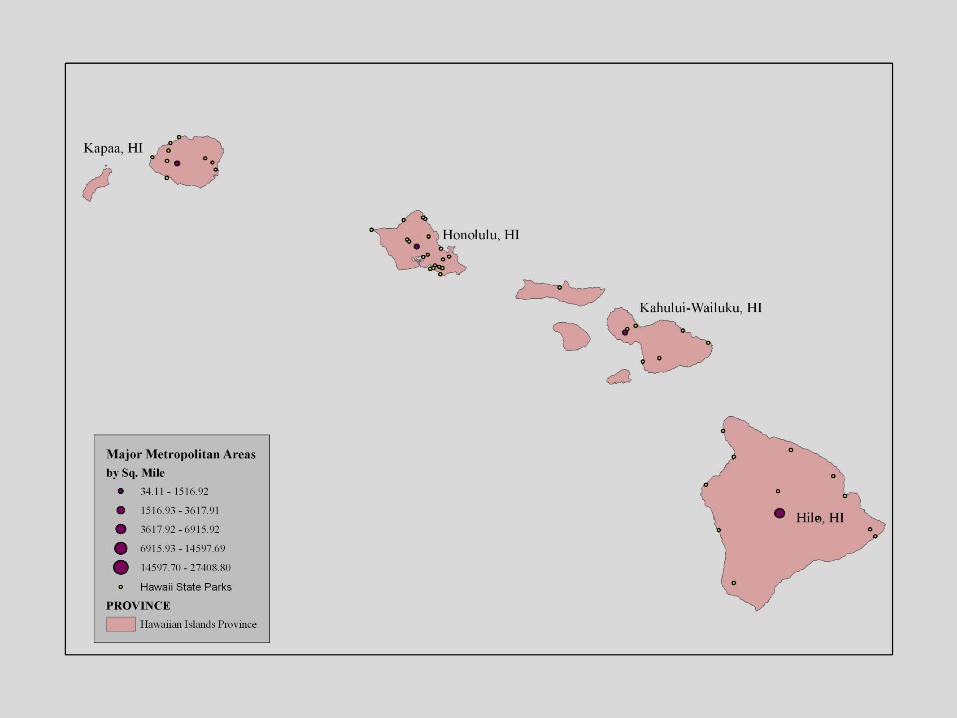
Creating park-level state park system data base for the U. S.
• Resurrect 1999 inventory of state parks done by hand mainly from printed sources
• Update statistics on individual parks for all states from on-line or direct contact sources
• Add size in acres• Add lat/long park locators or, if available, shape files• Call follow-up to each state office, or park office to
validate data and check open status• Map county total acres and individual parks


• Protected Lands• Private• Local Government• State Government• Federal Wilderness System• Other Federal Systems
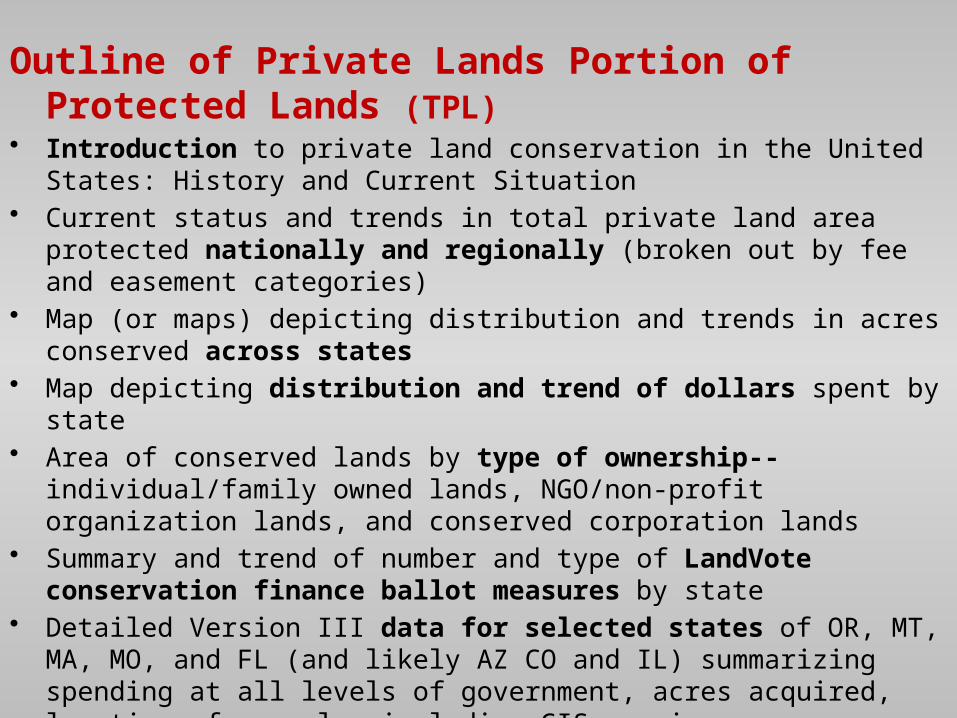
Outline of Private Lands Portion of Protected Lands (TPL)• Introduction to private land conservation in the United States: History and Current
Situation• Current status and trends in total private land area protected nationally and
regionally (broken out by fee and easement categories)• Map (or maps) depicting distribution and trends in acres conserved across states• Map depicting distribution and trend of dollars spent by state• Area of conserved lands by type of ownership--individual/family owned lands,
NGO/non-profit organization lands, and conserved corporation lands• Summary and trend of number and type of LandVote conservation finance ballot
measures by state• Detailed Version III data for selected states of OR, MT, MA, MO, and FL (and
likely AZ CO and IL) summarizing spending at all levels of government, acres acquired, location of parcels, including GIS mapping
• National and regional profile of state land conservation programs and spending• Current levels and trend in federal programs and spending• Discussion of likely future trends at local, state and federal levels

RegionTotal Acres
ProtectedProtected Acres
per Capita% of Region
ProtectedMid-Atlantic 10,304,151.6 0.18 9.2%Midwest 30,139,330.5 0.45 6.3%New England 4,839,352.7 0.34 12.0%Rocky Mountain 95,015,799.3 9.06 29.0%Southeast 28,960,508.7 0.44 9.7%Southwest 37,250,994.8 1.04 10.3%West 267,143,832.8 5.21 41.5%
TOT 473,653,970.5
1.57 20.5%
Almanac
Protected lands
Co-writing with TPLAndrew duMoulin
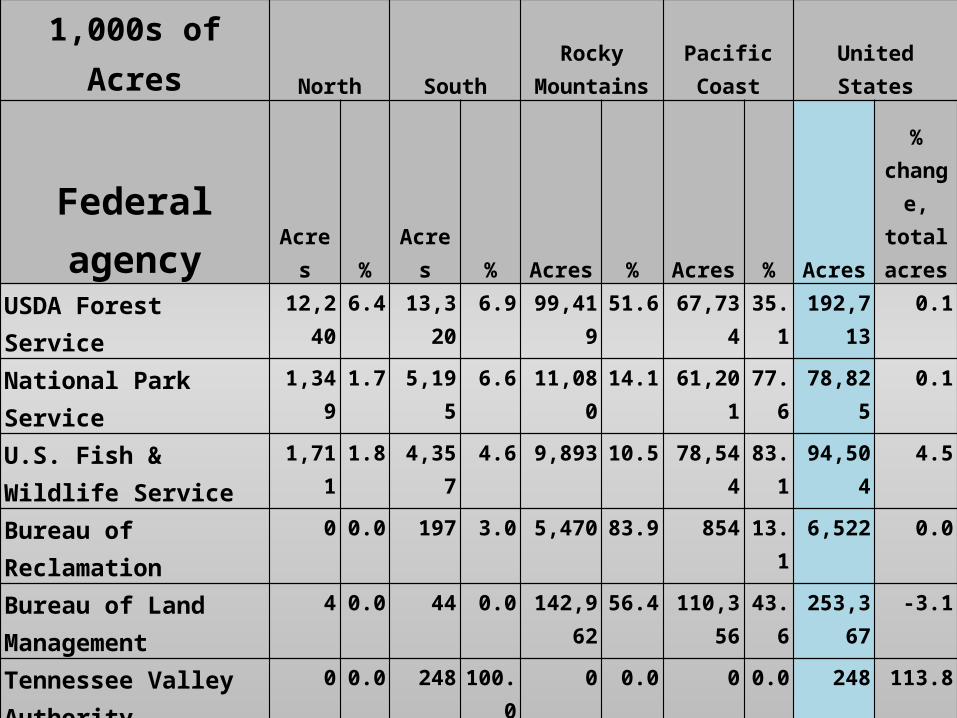
1,000s of Acres North SouthRocky
Mountains Pacific Coast United States
Federal agency Acres % Acres % Acres % Acres % Acres
% change,
total acres
USDA Forest Service 12,240 6.4 13,320 6.9 99,419 51.6 67,734 35.1 192,713 0.1
National Park Service 1,349 1.7 5,195 6.6 11,080 14.1 61,201 77.6 78,825 0.1
U.S. Fish & Wildlife Service
1,711 1.8 4,357 4.6 9,893 10.5 78,544 83.1 94,504 4.5
Bureau of Reclamation 0 0.0 197 3.0 5,470 83.9 854 13.1 6,522 0.0
Bureau of Land Management
4 0.0 44 0.0 142,962 56.4 110,356 43.6 253,367 -3.1
Tennessee Valley Authority
0 0.0 248 100.0 0 0.0 0 0.0 248 113.8
U.S. Army Corps of Engineers
2,557 18.6 7,104 51.7 3,540 25.8 545 4.0 13,746 18.5
All federal agencies 17,862 2.8 30,466 4.8 272,364 42.6 319,234 49.9 639,926 -0.2

North SouthRocky
MountainsPacific Coast United States
Federal agency Units Acres % Units Acres % Units Acres % Units Acres % Units Acres
% ofU. S. total
%change,
acres'03-'09
Bureau of Land Management
0 0.0 0.0 0 0.0 0.0 125 4,606.1 52.8 94 4,119.9 47.2 219 8,726.0 8.0 33.1
Fish & Wildlife Service
14 64.4 0.3 18 470.2 2.3 13 1,464.8 7.1 26 18,703.0 90.3 71 20,702.3 18.9 0.0
Forest Service 55 1,428.1 3.9 85 755.2 2.1 154 18,207.8 50.4 145 15,769.0 43.6 439 36,160.1 33.0 2.5
National Park Service
4 178.6 0.4 7 1,486.8 3.4 25 1,342.5 3.1 24 40,882.5 93.1 60 43,890.5 40.1 1.1
U. S. Total 73 1,671.1 1.5 110 2,712.3 2.5 317 25,621.2 23.4 289 79,474.4 72.6 789 109,478.9 100.0 3.3
National Wilderness Preservation System--2009

2010 Assessment Products
1. Recreation activity trends and futures
2. Recreation and protected land resources
3. Natural amenities and migration
4. Footprints on the land
SRS and UGA, Athens GA

1. Recreation Activity Trends and Futures
• Population-wide participation at national and regional scales—historic and current trends:– Survey on Fishing, Hunting and Wildlife Associated Recreation
(USFWS)– Outdoor Foundation—Recreation Participation Survey– National Survey on Recreation and the Environment and National
Kids Survey (Forest Service, UGA, UT)
• Participation Differences by Age, Race, Gender, Orgin, …..• Participation and Trend Differences by Region• Public Land Visitation Trends
– Federal Lands– State Parks
• Outdoor Recreation-Based Tourism and its Trends• Projections of Demand to 2060 by IPCC Scenario

2. Recreation and protected land resources: National, regional and county patterns
• Nature Based Recreation Resources• Recreation access to private lands (NWLOS, Brett Butler)• Recreation access to other private lands• Private business sector (County Business Patterns)• Second and vacation homes (Census of Housing and NSRE second home
ownership Qs)• Private sector role in providing services on public land (Margaret Bailey,
HCM, 10/20/09)• Local Government Systems (Harnik on largest cities)• State Park Systems (Including NASPD survey data)• Federal Government Systems (RECGOV)
• Protected Lands• Private• Local Government• State Government• Federal Wilderness System• Other Federal Systems

3. Natural Amenities and Migration
• Review of published literature to now• Measures of natural amenities• Amenities index and mapping• Second and vacation homes (NSRE and
Census of Housing)• Migration trends• Motivations to Move• Modeling and forecasting amenity migration

END