outdoor recreation satellite account, u.s. and states, 2020
TRANSCRIPT

EMBARGOED UNTIL RELEASE AT 8:30 A.M. EST, Tuesday, November 9, 2021 BEA 21–55
Technical: Stanislaw Rzeznik (Regional) Patricia Washington (National)
(301) 278-9458 (301) 278-9114
Media: Jeannine Aversa (301) 278-9003 [email protected]
Outdoor Recreation Satellite Account, U.S. and States, 2020 New statistics for 2020; prior years updated
The U.S. Bureau of Economic Analysis (BEA) released statistics today measuring the outdoor recreation economy for the nation, all 50 states, and the District of Columbia. The new U.S. data show that the outdoor recreation economy accounted for 1.8 percent ($374.3 billion) of current-dollar gross domestic product (GDP) for the nation in 2020 (national table 3). At the state level, outdoor recreation value added as a share of state GDP ranged from 4.3 percent in Montana to 1.2 percent in New York and Connecticut. The share was 0.8 percent in the District of Columbia.

- 2 -
Inflation-adjusted (real) GDP for the outdoor recreation economy decreased 19.0 percent from 2019 to 2020, compared with a 3.4 percent decrease for the overall U.S. economy. Real gross output for the outdoor recreation economy decreased 17.4 percent, while outdoor recreation compensation decreased 12.5 percent and employment decreased 17.1 percent.
COVID-19 Impact on the 2020 Outdoor Recreation Satellite Account
Outdoor recreation estimates were impacted by the response to the spread of COVID-19, as governments issued and lifted "stay-at-home" orders. This led to rapid changes in demand as consumers canceled, restricted, or redirected their spending. The U.S. government passed several laws to support and sustain businesses and individuals through the pandemic. The full economic effects of the COVID-19 pandemic cannot be quantified in the outdoor recreation estimates because the impacts are generally embedded in source data and cannot be separately identified. For more information, see Federal Recovery Programs and BEA Statistics.
U.S. Bureau of Economic Analysis

- 3 -
Across all 50 states and the District of Columbia, outdoor recreation employment decreased in 2020, ranging from –9.3 percent in Indiana to –27.2 percent in Hawaii.
Outdoor recreation by activity
Outdoor recreation activities fall into three general categories: conventional activities (such as bicycling, boating, hiking, and hunting); other core activities (such as gardening and outdoor concerts); and supporting activities (such as construction, travel and tourism, local trips, and government expenditures).

- 4 -
In 2020, conventional outdoor recreation accounted for 37.4 percent of U.S. outdoor recreation value added, compared with 30.6 percent in 2019. The increase was due to higher spending on boating/fishing and RVing. Other outdoor recreation accounted for 16.8 percent of value added in 2020, compared with 19.7 percent in 2019. The decrease was driven by amusement parks/water parks and festivals/sporting events/concerts. Supporting activities accounted for the remaining 45.8 percent of value added in 2020, compared with 49.7 percent in 2019. Supporting activities, particularly travel and tourism-related activities, declined in 2020 during the COVID-19 pandemic as consumers traveled less and reduced spending at hotels and restaurants.
U.S. Bureau of Economic Analysis
(percent)

- 5 -
Additional value added by activity highlights for 2020 include:
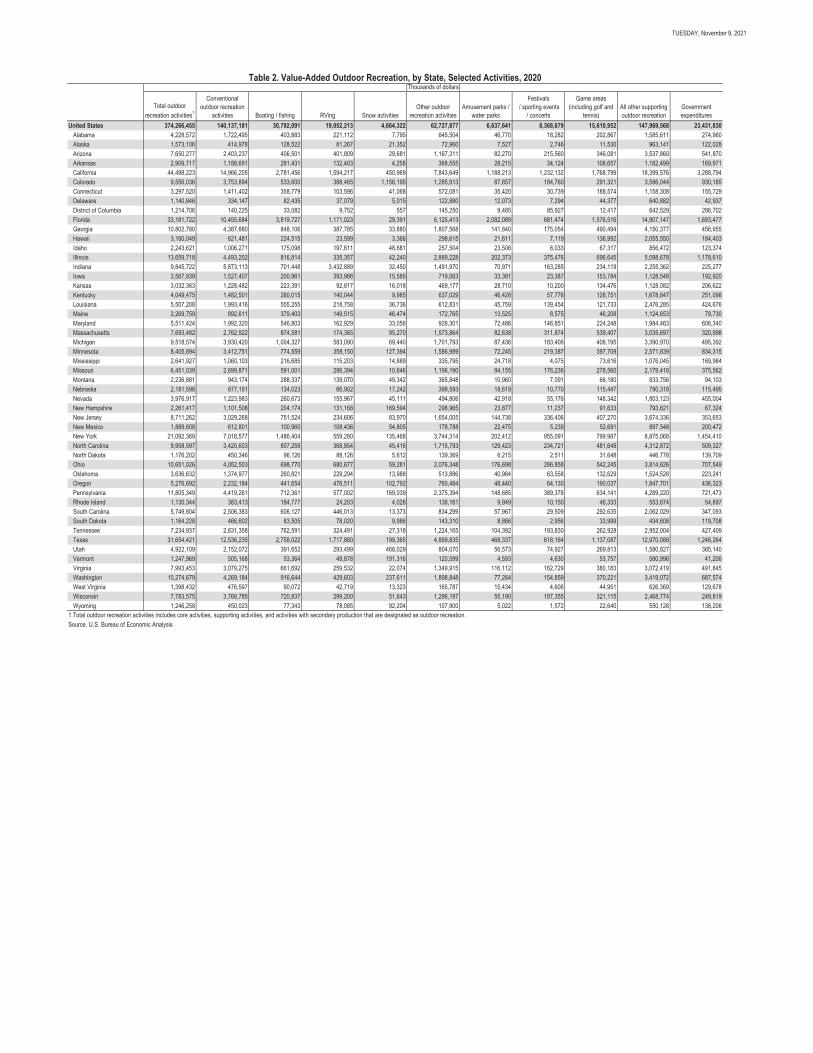
• Boating/fishing was the largest conventional activity for the nation as a whole at $30.8 billion in current-dollar value added and was the largest conventional activity in 39 states and the District of Columbia. Florida ($3.8 billion), California ($2.8 billion), and Texas ($2.8 billion) were the largest contributors to U.S. value added for the activity (state table 2).
• RVing was the second-largest conventional activity nationally at $19.1 billion in current-dollar value added and was the largest conventional activity in five states. The largest contributors were Indiana ($3.4 billion) and Texas ($1.7 billion).
• Snow activities was the largest conventional activity in Colorado ($1.2 billion), Utah ($468.0 million), Vermont ($191.3 million), and Wyoming ($92.2 million) in current-dollar value added. At the national level, current-dollar value added for snow activities was $4.7 billion.
Outdoor recreation by industry The outdoor recreation by industry data show the contribution of different industries to the outdoor recreation economy, including their impact on value added, gross output, employment, and compensation.
U.S. Bureau of Economic Analysis

- 6 -
For the nation, the retail trade sector was the largest contributor to U.S. outdoor recreation value added in 2020, accounting for $101.9 billion (national table 6). At the state level, retail trade was the largest contributor to outdoor recreation value added in 35 states. The leading contributors were California ($11.6 billion), Florida ($8.8 billion), and Texas ($8.6 billion) (state table 3). Additional value added by industry highlights for 2020 include:
• Arts, entertainment, recreation, accommodation, and food services, the second-largest sector,
contributed $86.8 billion in current-dollar value added to outdoor recreation nationally. At the state level, this industry was the largest contributor to outdoor recreation in 13 states and the District of Columbia.
• Manufacturing, the third-largest sector, contributed $52.8 billion nationally to the outdoor recreation economy. At the state level, this sector was the largest contributor to the outdoor recreation economy in Indiana ($5.3 billion) and Wisconsin ($1.9 billion).
U.S. Bureau of Economic Analysis

- 7 -
Updates for 2012–2019
Today’s release also reflects updated statistics for 2012–2019. At the national level, gross output, value added, employment, and compensation were updated to include the results of the 2021 annual update of the National Economic Accounts, which includes the Industry Economic Accounts. The updated state statistics reflect the updated national data as well as the 2021 annual update of the Regional Economic Accounts as well as newly available and revised regional source data.
Next release: November 2022 Outdoor Recreation Satellite Account, U.S. and States, 2021

- 8 -
Additional Information Resources
• Information on COVID-19 and recovery impacts is available on our website.
• Find the latest information on the Outdoor Recreation Satellite Account (ORSA) at BEA’s outdoor recreation website.
• Historical time series for these estimates can be accessed in BEA’s Interactive Data Application.
• Stay informed about BEA developments by reading The BEA Wire, signing up for BEA’s email subscription service, or following BEA on Twitter @BEA_News.
• Access BEA data by registering for BEA’s Data Application Programming Interface.
• For more on BEA’s statistics, see our monthly online journal, the Survey of Current Business.
• For upcoming economic indicators, see BEA’s news release schedule.
• Details on the preparation of BEA’s national statistics are in NIPA Handbook: Concepts and Methods of the U.S. National Income and Product Accounts.
• Complete information on the sources and methods for the estimation of BEA’s state personal income and employment.
Definitions Gross domestic product (GDP) or value added is the value of the goods and services produced by the nation’s economy less the value of the goods and services used up in production. GDP is also equal to the sum of personal consumption expenditures, gross private domestic investment, net exports of goods and services, and government consumption expenditures and gross investment. Gross output is the value of the goods and services produced by the nation’s economy. It is principally measured using industry sales or receipts, including sales to final users (GDP) and sales to other industries. Current-dollar estimates are valued in the prices of the period when the transactions occurred—that is, at “market value.” Also referred to as “nominal estimates” or as “current-price estimates.” Chained-dollar estimates are calculated by taking the current-dollar level of a series in the base period and
multiplying it by the change in the chained-type quantity index number for the series since the base period. Chained-dollar estimates correctly show growth rates for a series but are not additive in periods other than the base period. ORSA employment consists of all full-time, part-time, and temporary wage-and-salary jobs in which the workers are engaged in the production of outdoor recreation goods and services. Self-employed individuals are excluded from employment totals. ORSA compensation consists of the pay to employees (including wages and salaries and benefits such as employer contributions to pension and health funds) in return for their outdoor recreation-related work during a given year. Pay to the self-employed is excluded from compensation but included in value added. ORSA value added (also referred to as GDP) consists of the value of outdoor recreation goods and services produced less the value of expenses incurred for their production. The activity of self-employed individuals is included in value added. Geography of outdoor recreation Outdoor recreation is measured by place of production, not residence of consumer. The value of manufactured goods, such as boats, is assigned to the state where they are produced, even if the goods are not ultimately used there. Services, such as sailing lessons, are assigned to the location where they are consumed. The value of services provided by retailers, such as boat dealers, is also assigned to the location of sale. The services of retailers (known as trade margins) are not measured by sales but are most akin to sales less the cost of goods sold. The production of imported goods is excluded from ORSA, but the value of the services of retailers selling the imported goods is included. Outdoor recreation spending and production are allocated to states by applying state-level data to detailed, underlying national values. The underlying estimates are distributed to states before aggregation to publication levels to provide the most accurate state values possible. Statistics are primarily based on time-series data generated from the Economic Census and Quarterly Census of Employment and Wages. Additional government and nongovernment data sources are used to supplement the census data and to refine and evaluate the statistics.

‐ 9 ‐
List of National‐Level News Release Tables Table 1. Real Outdoor Recreation Value Added by Activity Table 2. Outdoor Recreation Value Added by Activity Table 3. Outdoor Recreation Value Added by Activity as a Percentage of Gross Domestic Product Table 4. Outdoor Recreation Value Added by Activity as a Percentage of Total Outdoor Recreation Value Added Table 5. Real Outdoor Recreation Value Added by Industry Table 6. Outdoor Recreation Value Added by Industry Table 7. Real Outdoor Recreation Gross Output by Activity Table 8. Outdoor Recreation Gross Output by Activity Table 9. Real Outdoor Recreation Gross Output by Industry Table 10. Outdoor Recreation Gross Output by Industry
List of State‐Level News Release Tables Table 1. Outdoor Recreation Value Added, Employment, and Compensation as a Percent of Total, 2020 Table 2. Value‐Added Outdoor Recreation, by State, Selected Activities, 2020 Table 3. Value‐Added Outdoor Recreation, by State, Selected Industries, 2020 Table 4. Employment, Outdoor Recreation, by State, Selected Industries, 2020 Table 5. Compensation, Outdoor Recreation, by State, Selected Industries, 2020

2012 2013 2014 2015 2016 2017 2018 2019 2020 1 Total Outdoor Recreation 359199 364246 367881 374998 377264 394182 405254 409526 3318642 Total core outdoor recreation 183033 185266 188477 191912 195049 205967 211831 211910 1816013 Conventional outdoor recreation 115516 116901 117563 121056 123964 129779 132131 131830 1307534 Bicycling 1850 1972 1975 1894 1923 1941 1872 1969 21075 Boating/fishing 17179 17009 17080 17779 18902 19713 20032 20080 256856 Canoeing 64 60 63 66 72 75 72 82 807 Kayaking 516 398 369 358 348 368 381 385 4358 Fishing (excludes boating) 2590 2482 2521 2838 3963 4494 4766 4554 46709 Sailing 971 1042 1097 1088 1153 1160 1134 1204 856
10 Other boating 13037 13030 13035 13436 13410 13679 13758 13913 1955611 Climbing/hiking/tent camping 3015 3086 3114 2972 2954 3411 3367 3643 369212 Equestrian 3698 3832 4064 4166 4702 5039 5789 5103 435613 Hunting/shooting/trapping 6510 7307 6798 7121 8943 9024 8651 8517 776314 Hunting/trapping 3470 3825 3539 3774 5072 5437 5085 5189 464915 Shooting (includes archery) 3040 3483 3260 3345 3849 3546 3533 3288 308116 Motorcycling/ATVing 8175 8195 8263 8294 8184 8129 8132 7658 793117 Recreational flying 1172 1115 1166 1169 1165 1163 980 1020 133318 RVing 12658 13069 13179 13594 14213 15466 15495 14665 1541119 Snow activities 4963 4890 5205 5215 5078 5027 5197 5472 398220 Skiing 1522 1539 1688 1711 1678 1659 1678 1805 112221 Snowboarding 1302 1340 1438 1450 1471 1514 1533 1658 100322 Other snow activities (includes snowmobiling)1 2138 2011 2080 2056 1930 1854 1983 2009 186423 Other conventional outdoor recreation activities 8529 8425 8516 8800 8421 8510 8692 9353 979324 Other conventional air and land activities2 6620 6636 6614 6539 6153 6239 6377 6614 633025 Other conventional water activities3 1909 1790 1902 2256 2261 2264 2308 2713 336126 Multi-use apparel and accessories (conventional)4 47767 47999 48205 50051 49261 52134 53744 54383 4750027 Other outdoor recreation 67517 68365 70925 70866 71110 76178 79633 79995 5230428 Amusement parks/water parks 8567 7970 7821 7993 8167 9528 10485 10654 401729 Festivals/sporting events/concerts 10802 11135 11841 10784 11434 12145 12566 12910 624330 Field sports 2705 2660 2782 2874 2876 2953 3110 3277 295431 Game areas (includes golfing and tennis) 16610 17153 17065 16674 16719 17825 18179 19016 1403532 Guided tours/outfitted travel 11531 11251 11737 11044 10180 11277 12609 11370 730333 Air and land guided tours/outfitted travel 5800 5675 6314 6274 6126 6149 7081 6412 412034 Water guided tours/outfitted travel (includes boating and fishing charters) 5731 5576 5427 4778 4067 5130 5535 4965 318735 Productive activities (includes gardening) 5651 6248 7479 8537 9130 9113 8909 8721 829136 Other outdoor recreation activities5 8135 8183 8538 9353 9145 9463 9567 9804 780537 Multi-use apparel and accessories (other)4 3514 3799 3814 4039 3993 4038 3988 4037 385738 Supporting outdoor recreation 176166 178981 179415 183089 182290 188384 193601 197668 15063339 Construction 5707 4907 5077 5056 5012 4705 5038 5137 499140 Local trips and travel6 33041 33372 33532 33232 31824 33072 34649 35331 3150441 Trips and travel7 118988 122239 122362 126153 125859 130528 133777 137440 9478942 Food and beverages 22168 18184 18641 19190 19592 20047 20372 20750 1621143 Lodging 30683 35629 32288 34776 33729 34434 34277 35117 2419844 Shopping and souvenirs 20793 21202 21465 21556 21403 22220 22691 22770 2323445 Transportation 45345 47232 50046 50668 51177 53925 56659 59056 3029146 Government expenditures 18430 18482 18459 18655 19530 20093 20147 19773 1893947 Federal government 2591 2790 2573 2518 2612 2635 2725 1923 174148 State and local government 15838 15696 15879 16126 16905 17443 17408 17837 17184
Table 1. Real Outdoor Recreation Value Added by Activity[Millions of chained (2012) dollars]Bureau of Economic Analysis
7. Travel and tourism expenses in the Outdoor Recreation Satellite Account are consistent with the Travel and Tourism Satellite Account, which includes only expenses for travel at least 50 miles away from home.
1. Consists of dog mushing, sleighing, snowmobiling, snow shoeing, and snow tubing.2. Consists of air sports, driving for pleasure, geocaching/orienteering/rock hounding, ice skating, inline skating, land/sand sailing, races, running/walking/jogging, skateboarding, and wildlife watching/birding.3. Consists of boardsailing/windsurfing, SCUBA diving, snorkeling, stand-up paddling, surfing, tubing, wakeboarding, water skiing, and whitewater rafting.4. Consists of backpacks, bug spray, coolers, general outdoor clothing, GPS equipment, hydration equipment, lighting, sports racks, sunscreen, watches, and other miscellaneous gear and equipment.5. Consists of agritourism, augmented reality games, beachgoing, disc golf, hot springs soaking, kite flying, model airplane/rocket/UAV, paintball, photography, stargazing/astronomy, swimming, therapeutic programs, water polo, and yard sports.6. Trip expenses less than 50 miles away from home, including food and beverages, lodging, shopping and souvenirs, and transportation.

2012 2013 2014 2015 2016 2017 2018 2019 2020 1 Total Outdoor Recreation 359199 372397 382706 402057 409551 430584 448899 465184 3742662 Total core outdoor recreation 183033 189611 194151 202089 207856 219487 227389 233877 2028653 Conventional outdoor recreation 115516 119884 121691 127070 130743 136387 139115 142310 1401374 Bicycling 1850 1950 1950 1897 1991 1994 1930 2193 24515 Boating/fishing 17179 17544 18132 19330 20893 21809 22598 23726 307926 Canoeing 64 62 65 71 79 82 81 96 997 Kayaking 516 414 401 396 397 423 452 485 5568 Fishing (excludes boating) 2590 2627 2665 3024 4196 4753 4900 4938 49739 Sailing 971 1053 1126 1161 1262 1251 1262 1391 1028
10 Other boating 13037 13389 13874 14679 14959 15299 15903 16817 2413611 Climbing/hiking/tent camping 3015 3142 3225 3263 3129 3613 3633 3958 399912 Equestrian 3698 3956 4482 4664 5250 5806 6757 6172 545113 Hunting/shooting/trapping 6510 7624 7192 7716 9771 9938 9534 9879 905014 Hunting/trapping 3470 4031 3828 4207 5683 6158 5712 6144 555215 Shooting (includes archery) 3040 3593 3364 3508 4089 3780 3821 3735 349816 Motorcycling/ATVing 8175 8330 8320 8548 8706 8755 8730 8373 881217 Recreational flying 1172 1226 1267 1278 1226 1292 1137 1214 144918 RVing 12658 13521 14122 15082 16062 17439 17957 17416 1905219 Snow activities 4963 4905 5289 5505 5446 5466 5838 6242 466420 Skiing 1522 1535 1697 1795 1810 1768 1839 2041 132621 Snowboarding 1302 1341 1452 1537 1602 1628 1697 1891 119922 Other snow activities (includes snowmobiling)1 2138 2029 2140 2173 2034 2069 2301 2310 213923 Other conventional outdoor recreation activities 8529 8682 8811 9232 8740 8886 9096 9887 1041224 Other conventional air and land activities2 6620 6816 6834 6833 6299 6451 6560 6825 639525 Other conventional water activities3 1909 1866 1977 2399 2441 2434 2536 3062 401826 Multi-use apparel and accessories (conventional)4 47767 49003 48901 50555 49530 51389 51907 53249 4400427 Other outdoor recreation 67517 69728 72460 75019 77113 83101 88274 91567 6272828 Amusement parks/water parks 8567 8681 8997 9794 10680 12937 14559 15673 663829 Festivals/sporting events/concerts 10802 11419 12492 12253 13596 14670 15389 16102 836930 Field sports 2705 2740 2880 3026 3079 3164 3340 3624 328331 Game areas (includes golfing and tennis) 16610 17079 17079 17339 17717 18323 19029 20560 1561132 Guided tours/outfitted travel 11531 11466 12180 12102 11554 12918 14752 13815 926033 Air and land guided tours/outfitted travel 5800 5769 6509 6831 6890 6983 8201 7680 513434 Water guided tours/outfitted travel (includes boating and fishing charters) 5731 5697 5670 5271 4664 5935 6551 6134 412635 Productive activities (includes gardening) 5651 6229 6308 6747 7046 7346 7241 7229 703536 Other outdoor recreation activities5 8135 8303 8729 9722 9446 9676 9960 10435 849337 Multi-use apparel and accessories (other)4 3514 3811 3795 4036 3993 4067 4004 4127 403938 Supporting outdoor recreation 176166 182786 188555 199968 201695 211096 221510 231306 17140139 Construction 5707 5187 5729 6032 6297 6174 6890 7437 754440 Local trips and travel6 33041 33629 34432 35154 33355 35527 38089 38947 3499241 Trips and travel7 118988 124454 128163 137802 140145 146710 153226 161698 10543442 Food and beverages 22168 18724 19604 21260 22620 23770 24904 26234 2227643 Lodging 30683 36622 34440 38406 38578 40397 42200 44625 2817244 Shopping and souvenirs 20793 21432 22067 22750 22641 23515 24237 24957 2596145 Transportation 45345 47676 52051 55386 56305 59028 61886 65883 2902446 Government expenditures 18430 19515 20231 20980 21899 22686 23305 23224 2343247 Federal government 2591 2844 2692 2680 2819 2930 3143 2272 207848 State and local government 15838 16671 17539 18299 19080 19756 20162 20952 21353
Table 2. Outdoor Recreation Value Added by Activity[Millions of current dollars]Bureau of Economic Analysis
7. Travel and tourism expenses in the Outdoor Recreation Satellite Account are consistent with the Travel and Tourism Satellite Account, which includes only expenses for travel at least 50 miles away from home.
1. Consists of dog mushing, sleighing, snowmobiling, snow shoeing, and snow tubing.2. Consists of air sports, driving for pleasure, geocaching/orienteering/rock hounding, ice skating, inline skating, land/sand sailing, races, running/walking/jogging, skateboarding, and wildlife watching/birding.3. Consists of boardsailing/windsurfing, SCUBA diving, snorkeling, stand-up paddling, surfing, tubing, wakeboarding, water skiing, and whitewater rafting.4. Consists of backpacks, bug spray, coolers, general outdoor clothing, GPS equipment, hydration equipment, lighting, sports racks, sunscreen, watches, and other miscellaneous gear and equipment.5. Consists of agritourism, augmented reality games, beachgoing, disc golf, hot springs soaking, kite flying, model airplane/rocket/UAV, paintball, photography, stargazing/astronomy, swimming, therapeutic programs, water polo, and yard sports.6. Trip expenses less than 50 miles away from home, including food and beverages, lodging, shopping and souvenirs, and transportation.

2012 2013 2014 2015 2016 2017 2018 2019 2020 1 Total Outdoor Recreation 2.2 2.2 2.2 2.2 2.2 2.2 2.2 2.2 1.82 Total core outdoor recreation 1.1 1.1 1.1 1.1 1.1 1.1 1.1 1.1 1.03 Conventional outdoor recreation 0.7 0.7 0.7 0.7 0.7 0.7 0.7 0.7 0.74 Bicycling 0.0 0.0 0.0 0.0 0.0 0.0 0.0 0.0 0.05 Boating/fishing 0.1 0.1 0.1 0.1 0.1 0.1 0.1 0.1 0.16 Canoeing 0.0 0.0 0.0 0.0 0.0 0.0 0.0 0.0 0.07 Kayaking 0.0 0.0 0.0 0.0 0.0 0.0 0.0 0.0 0.08 Fishing (excludes boating) 0.0 0.0 0.0 0.0 0.0 0.0 0.0 0.0 0.09 Sailing 0.0 0.0 0.0 0.0 0.0 0.0 0.0 0.0 0.0
10 Other boating 0.1 0.1 0.1 0.1 0.1 0.1 0.1 0.1 0.111 Climbing/hiking/tent camping 0.0 0.0 0.0 0.0 0.0 0.0 0.0 0.0 0.012 Equestrian 0.0 0.0 0.0 0.0 0.0 0.0 0.0 0.0 0.013 Hunting/shooting/trapping 0.0 0.0 0.0 0.0 0.1 0.1 0.0 0.0 0.014 Hunting/trapping 0.0 0.0 0.0 0.0 0.0 0.0 0.0 0.0 0.015 Shooting (includes archery) 0.0 0.0 0.0 0.0 0.0 0.0 0.0 0.0 0.016 Motorcycling/ATVing 0.1 0.0 0.0 0.0 0.0 0.0 0.0 0.0 0.017 Recreational flying 0.0 0.0 0.0 0.0 0.0 0.0 0.0 0.0 0.018 RVing 0.1 0.1 0.1 0.1 0.1 0.1 0.1 0.1 0.119 Snow activities 0.0 0.0 0.0 0.0 0.0 0.0 0.0 0.0 0.020 Skiing 0.0 0.0 0.0 0.0 0.0 0.0 0.0 0.0 0.021 Snowboarding 0.0 0.0 0.0 0.0 0.0 0.0 0.0 0.0 0.022 Other snow activities (includes snowmobiling)1 0.0 0.0 0.0 0.0 0.0 0.0 0.0 0.0 0.023 Other conventional outdoor recreation activities 0.1 0.1 0.1 0.1 0.0 0.0 0.0 0.0 0.024 Other conventional air and land activities2 0.0 0.0 0.0 0.0 0.0 0.0 0.0 0.0 0.025 Other conventional water activities3 0.0 0.0 0.0 0.0 0.0 0.0 0.0 0.0 0.026 Multi-use apparel and accessories (conventional)4 0.3 0.3 0.3 0.3 0.3 0.3 0.3 0.2 0.227 Other outdoor recreation 0.4 0.4 0.4 0.4 0.4 0.4 0.4 0.4 0.328 Amusement parks/water parks 0.1 0.1 0.1 0.1 0.1 0.1 0.1 0.1 0.029 Festivals/sporting events/concerts 0.1 0.1 0.1 0.1 0.1 0.1 0.1 0.1 0.030 Field sports 0.0 0.0 0.0 0.0 0.0 0.0 0.0 0.0 0.031 Game areas (includes golfing and tennis) 0.1 0.1 0.1 0.1 0.1 0.1 0.1 0.1 0.132 Guided tours/outfitted travel 0.1 0.1 0.1 0.1 0.1 0.1 0.1 0.1 0.033 Air and land guided tours/outfitted travel 0.0 0.0 0.0 0.0 0.0 0.0 0.0 0.0 0.034 Water guided tours/outfitted travel (includes boating and fishing charters) 0.0 0.0 0.0 0.0 0.0 0.0 0.0 0.0 0.035 Productive activities (includes gardening) 0.0 0.0 0.0 0.0 0.0 0.0 0.0 0.0 0.036 Other outdoor recreation activities5 0.1 0.0 0.0 0.1 0.1 0.0 0.0 0.0 0.037 Multi-use apparel and accessories (other)4 0.0 0.0 0.0 0.0 0.0 0.0 0.0 0.0 0.038 Supporting outdoor recreation 1.1 1.1 1.1 1.1 1.1 1.1 1.1 1.1 0.839 Construction 0.0 0.0 0.0 0.0 0.0 0.0 0.0 0.0 0.040 Local trips and travel6 0.2 0.2 0.2 0.2 0.2 0.2 0.2 0.2 0.241 Trips and travel7 0.7 0.7 0.7 0.8 0.7 0.8 0.7 0.8 0.542 Food and beverages 0.1 0.1 0.1 0.1 0.1 0.1 0.1 0.1 0.143 Lodging 0.2 0.2 0.2 0.2 0.2 0.2 0.2 0.2 0.144 Shopping and souvenirs 0.1 0.1 0.1 0.1 0.1 0.1 0.1 0.1 0.145 Transportation 0.3 0.3 0.3 0.3 0.3 0.3 0.3 0.3 0.146 Government expenditures 0.1 0.1 0.1 0.1 0.1 0.1 0.1 0.1 0.147 Federal government 0.0 0.0 0.0 0.0 0.0 0.0 0.0 0.0 0.048 State and local government 0.1 0.1 0.1 0.1 0.1 0.1 0.1 0.1 0.1
Table 3. Outdoor Recreation Value Added by Activity as a Percentage of Gross Domestic Product[Percent]Bureau of Economic Analysis
7. Travel and tourism expenses in the Outdoor Recreation Satellite Account are consistent with the Travel and Tourism Satellite Account, which includes only expenses for travel at least 50 miles away from home.
1. Consists of dog mushing, sleighing, snowmobiling, snow shoeing, and snow tubing.2. Consists of air sports, driving for pleasure, geocaching/orienteering/rock hounding, ice skating, inline skating, land/sand sailing, races, running/walking/jogging, skateboarding, and wildlife watching/birding.3. Consists of boardsailing/windsurfing, SCUBA diving, snorkeling, stand-up paddling, surfing, tubing, wakeboarding, water skiing, and whitewater rafting.4. Consists of backpacks, bug spray, coolers, general outdoor clothing, GPS equipment, hydration equipment, lighting, sports racks, sunscreen, watches, and other miscellaneous gear and equipment.5. Consists of agritourism, augmented reality games, beachgoing, disc golf, hot springs soaking, kite flying, model airplane/rocket/UAV, paintball, photography, stargazing/astronomy, swimming, therapeutic programs, water polo, and yard sports.6. Trip expenses less than 50 miles away from home, including food and beverages, lodging, shopping and souvenirs, and transportation.

2012 2013 2014 2015 2016 2017 2018 2019 2020 1 Total Outdoor Recreation 100.0 100.0 100.0 100.0 100.0 100.0 100.0 100.0 100.02 Total core outdoor recreation 51.0 50.9 50.7 50.3 50.8 51.0 50.7 50.3 54.23 Conventional outdoor recreation 32.2 32.2 31.8 31.6 31.9 31.7 31.0 30.6 37.44 Bicycling 0.5 0.5 0.5 0.5 0.5 0.5 0.4 0.5 0.75 Boating/fishing 4.8 4.7 4.7 4.8 5.1 5.1 5.0 5.1 8.26 Canoeing 0.0 0.0 0.0 0.0 0.0 0.0 0.0 0.0 0.07 Kayaking 0.1 0.1 0.1 0.1 0.1 0.1 0.1 0.1 0.18 Fishing (excludes boating) 0.7 0.7 0.7 0.8 1.0 1.1 1.1 1.1 1.39 Sailing 0.3 0.3 0.3 0.3 0.3 0.3 0.3 0.3 0.3
10 Other boating 3.6 3.6 3.6 3.7 3.7 3.6 3.5 3.6 6.411 Climbing/hiking/tent camping 0.8 0.8 0.8 0.8 0.8 0.8 0.8 0.9 1.112 Equestrian 1.0 1.1 1.2 1.2 1.3 1.3 1.5 1.3 1.513 Hunting/shooting/trapping 1.8 2.0 1.9 1.9 2.4 2.3 2.1 2.1 2.414 Hunting/trapping 1.0 1.1 1.0 1.0 1.4 1.4 1.3 1.3 1.515 Shooting (includes archery) 0.8 1.0 0.9 0.9 1.0 0.9 0.9 0.8 0.916 Motorcycling/ATVing 2.3 2.2 2.2 2.1 2.1 2.0 1.9 1.8 2.417 Recreational flying 0.3 0.3 0.3 0.3 0.3 0.3 0.3 0.3 0.418 RVing 3.5 3.6 3.7 3.8 3.9 4.0 4.0 3.7 5.119 Snow activities 1.4 1.3 1.4 1.4 1.3 1.3 1.3 1.3 1.220 Skiing 0.4 0.4 0.4 0.4 0.4 0.4 0.4 0.4 0.421 Snowboarding 0.4 0.4 0.4 0.4 0.4 0.4 0.4 0.4 0.322 Other snow activities (includes snowmobiling)1 0.6 0.5 0.6 0.5 0.5 0.5 0.5 0.5 0.623 Other conventional outdoor recreation activities 2.4 2.3 2.3 2.3 2.1 2.1 2.0 2.1 2.824 Other conventional air and land activities2 1.8 1.8 1.8 1.7 1.5 1.5 1.5 1.5 1.725 Other conventional water activities3 0.5 0.5 0.5 0.6 0.6 0.6 0.6 0.7 1.126 Multi-use apparel and accessories (conventional)4 13.3 13.2 12.8 12.6 12.1 11.9 11.6 11.4 11.827 Other outdoor recreation 18.8 18.7 18.9 18.7 18.8 19.3 19.7 19.7 16.828 Amusement parks/water parks 2.4 2.3 2.4 2.4 2.6 3.0 3.2 3.4 1.829 Festivals/sporting events/concerts 3.0 3.1 3.3 3.0 3.3 3.4 3.4 3.5 2.230 Field sports 0.8 0.7 0.8 0.8 0.8 0.7 0.7 0.8 0.931 Game areas (includes golfing and tennis) 4.6 4.6 4.5 4.3 4.3 4.3 4.2 4.4 4.232 Guided tours/outfitted travel 3.2 3.1 3.2 3.0 2.8 3.0 3.3 3.0 2.533 Air and land guided tours/outfitted travel 1.6 1.5 1.7 1.7 1.7 1.6 1.8 1.7 1.434 Water guided tours/outfitted travel (includes boating and fishing charters) 1.6 1.5 1.5 1.3 1.1 1.4 1.5 1.3 1.135 Productive activities (includes gardening) 1.6 1.7 1.6 1.7 1.7 1.7 1.6 1.6 1.936 Other outdoor recreation activities5 2.3 2.2 2.3 2.4 2.3 2.2 2.2 2.2 2.337 Multi-use apparel and accessories (other)4 1.0 1.0 1.0 1.0 1.0 0.9 0.9 0.9 1.138 Supporting outdoor recreation 49.0 49.1 49.3 49.7 49.2 49.0 49.3 49.7 45.839 Construction 1.6 1.4 1.5 1.5 1.5 1.4 1.5 1.6 2.040 Local trips and travel6 9.2 9.0 9.0 8.7 8.1 8.3 8.5 8.4 9.341 Trips and travel7 33.1 33.4 33.5 34.3 34.2 34.1 34.1 34.8 28.242 Food and beverages 6.2 5.0 5.1 5.3 5.5 5.5 5.5 5.6 6.043 Lodging 8.5 9.8 9.0 9.6 9.4 9.4 9.4 9.6 7.544 Shopping and souvenirs 5.8 5.8 5.8 5.7 5.5 5.5 5.4 5.4 6.945 Transportation 12.6 12.8 13.6 13.8 13.7 13.7 13.8 14.2 7.846 Government expenditures 5.1 5.2 5.3 5.2 5.3 5.3 5.2 5.0 6.347 Federal government 0.7 0.8 0.7 0.7 0.7 0.7 0.7 0.5 0.648 State and local government 4.4 4.5 4.6 4.6 4.7 4.6 4.5 4.5 5.7
Table 4. Outdoor Recreation Value Added by Activity as a Percentage of Total Outdoor Recreation Value Added[Percent]Bureau of Economic Analysis
7. Travel and tourism expenses in the Outdoor Recreation Satellite Account are consistent with the Travel and Tourism Satellite Account, which includes only expenses for travel at least 50 miles away from home.
1. Consists of dog mushing, sleighing, snowmobiling, snow shoeing, and snow tubing.2. Consists of air sports, driving for pleasure, geocaching/orienteering/rock hounding, ice skating, inline skating, land/sand sailing, races, running/walking/jogging, skateboarding, and wildlife watching/birding.3. Consists of boardsailing/windsurfing, SCUBA diving, snorkeling, stand-up paddling, surfing, tubing, wakeboarding, water skiing, and whitewater rafting.4. Consists of backpacks, bug spray, coolers, general outdoor clothing, GPS equipment, hydration equipment, lighting, sports racks, sunscreen, watches, and other miscellaneous gear and equipment.5. Consists of agritourism, augmented reality games, beachgoing, disc golf, hot springs soaking, kite flying, model airplane/rocket/UAV, paintball, photography, stargazing/astronomy, swimming, therapeutic programs, water polo, and yard sports.6. Trip expenses less than 50 miles away from home, including food and beverages, lodging, shopping and souvenirs, and transportation.

2012 2013 2014 2015 2016 2017 2018 2019 2020 1 All Industries 359199 364246 367881 374998 377264 394182 405254 409526 3318642 Private industries 338175 343207 346408 353474 354865 371034 382012 386529 3099023 Agriculture, forestry, fishing, and hunting 7855 8631 9431 9962 11979 13239 12967 12865 113554 Farms 5869 6577 7568 7975 8427 8733 8853 8422 83195 Forestry, fishing, and related activities 1986 2056 1917 2040 3237 3963 3680 3890 28576 Mining 343 315 282 253 236 284 300 390 3337 Oil and gas extraction 106 107 99 128 131 86 73 273 3048 Mining, except oil and gas 185 160 129 87 81 173 197 169 1189 Support activities for mining 52 46 49 32 23 26 34 33 26
10 Utilities 1 1 1 1 1 1 1 0 111 Construction 5117 4594 4532 4385 4298 4013 4326 4467 432612 Manufacturing 48992 50852 50412 49372 48098 52314 56995 54927 5628713 Durable goods 18260 18717 18057 17695 18454 19683 21340 19021 1895914 Wood products 3 3 3 3 3 3 2 3 315 Nonmetallic mineral products 47 50 50 51 49 52 45 56 7016 Primary metals 5 4 4 4 4 4 9 8 617 Fabricated metal products 1727 1871 1609 1712 2160 1891 1964 1768 181518 Machinery 1937 1938 1743 1481 1032 1407 2199 1739 159119 Computer and electronic products 570 582 703 1226 862 819 905 860 90420 Electrical equipment, appliances, and components 638 614 586 620 520 541 534 487 41021 Motor vehicles, bodies and trailers, and parts 3450 3708 3638 3535 4131 4917 5244 4331 464722 Other transportation equipment 6498 6861 6750 6296 6421 6245 6472 5704 515623 Furniture and related products 55 55 54 49 39 38 34 36 4124 Miscellaneous manufacturing 3330 3021 2933 2794 3137 3620 3816 4129 442425 Nondurable goods 30733 32143 32420 31742 29409 32490 35527 36227 3793426 Food and beverage and tobacco products 6480 6596 6515 6359 6108 6339 6476 6481 682127 Textile mills and textile product mills 508 423 448 462 466 417 365 463 99228 Apparel and leather and allied products 2895 2786 2597 2457 2443 2429 2315 2347 245029 Paper products 301 307 307 311 276 254 257 280 30430 Printing and related support activities 112 111 113 126 123 114 117 118 16731 Petroleum and coal products 16735 17982 18529 18349 15889 19493 23161 23941 2370332 Chemical products 3458 3727 3780 3592 3574 3725 3911 3836 411033 Plastics and rubber products 244 243 230 244 246 252 216 222 25934 Wholesale trade 33074 29029 30214 31280 30153 30009 29974 29825 2749835 Retail trade 86849 90923 89620 92126 91741 96560 99125 100718 9790636 Motor vehicle and parts dealers 8230 8251 7875 8856 9398 10171 9809 9579 1131537 Food and beverage stores 5640 5560 5431 5336 5221 5407 5280 5276 550038 General merchandise stores 16070 17326 17313 18275 16919 18058 18643 18381 2026139 Other retail 56910 59804 59049 59741 60131 62899 65414 67462 6091040 Transportation and warehousing 33165 34951 38328 38628 39372 41407 42406 44109 1992241 Air transportation 22292 23237 26620 27589 29531 30978 31418 32183 1134242 Rail transportation 589 570 571 581 581 618 656 607 39243 Water transportation 2565 3306 3423 2885 2013 2117 2668 3219 258144 Truck transportation 4030 3895 3820 3610 3590 3721 3587 3693 332245 Transit and ground passenger transportation 2004 2172 2111 2049 2104 2158 2298 2585 140946 Pipeline transportation 359 363 354 451 469 454 463 418 44147 Other transportation and support activities 1288 1380 1401 1406 1183 1454 1365 1477 30748 Warehousing and storage 39 39 37 37 41 41 39 41 3849 Information 1308 1345 1363 1454 1519 1593 1700 1757 201750 Publishing industries, except internet (includes software) 534 482 468 468 450 451 442 420 35051 Motion picture and sound recording industries 48 42 42 47 49 45 51 66 27052 Broadcasting and telecommunications 605 686 699 757 806 849 921 937 95753 Data processing, internet publishing, and other information services 122 137 156 186 219 256 299 345 38354 Finance, insurance, real estate, rental, and leasing 17879 21612 17799 19015 19459 18948 18846 19471 1901455 Finance and insurance 3732 3315 3866 4166 4071 3601 3527 3607 356056 Federal Reserve banks, credit intermediation, and related activities 354 349 361 386 439 470 392 441 37457 Securities, commodity contracts, and investments ... ... ... ... ... ... ... ... ...58 Insurance carriers and related activities 3378 2965 3506 3781 3633 3134 3136 3167 318559 Funds, trusts, and other financial vehicles ... ... ... ... ... ... ... ... ...60 Real estate and rental and leasing 14147 18297 13944 14862 15403 15383 15358 15908 1549361 Real estate 11199 15335 11614 11846 11604 11398 11526 11657 1173762 Housing 11194 15330 11610 11841 11599 11393 11521 11652 1173263 Other real estate 5 5 5 5 5 5 5 5 564 Rental and leasing services and lessors of intangible assets 2948 2960 2328 3040 3962 4209 4003 4543 384565 Professional and business services 5954 5686 5896 6142 6298 7088 7523 6936 102466 Professional, scientific, and technical services 1079 1066 1214 1297 1334 1429 1472 1470 66267 Legal services ... ... ... ... ... ... ... ... ...68 Computer systems design and related services 63 50 50 61 56 59 60 66 6469 Miscellaneous professional, scientific, and technical services 1015 1016 1164 1237 1279 1370 1413 1404 60170 Management of companies and enterprises ... ... ... ... ... ... ... ... ...71 Administrative and waste management services 4875 4620 4681 4842 4962 5658 6051 5463 27072 Administrative and support services 4874 4620 4680 4840 4960 5657 6050 5462 26873 Waste management and remediation services 1 1 1 1 1 1 1 1 174 Educational services, health care, and social assistance 2747 2632 2746 2765 2967 3042 3245 3421 241475 Educational services 2263 2167 2274 2274 2448 2501 2676 2818 184776 Health care and social assistance 484 465 471 492 520 542 569 602 59677 Ambulatory health care services 273 270 274 285 313 335 359 388 38078 Hospitals 160 143 146 152 154 154 157 161 15279 Nursing and residential care facilities 22 19 19 19 19 19 19 19 1880 Social assistance 29 32 33 35 33 36 36 37 5281 Arts, entertainment, recreation, accommodation, and food services 90217 88335 91274 93444 94279 98702 101060 103585 6853582 Arts, entertainment, and recreation 39668 40162 42159 41205 42782 45763 47862 49190 3012883 Performing arts, spectator sports, museums, and related activities 10512 10808 11522 10594 11235 11931 12340 12614 593084 Amusements, gambling, and recreation industries 29156 29354 30636 30622 31550 33840 35538 36595 2425785 Accommodation and food services 50549 48176 49125 52237 51492 52944 53233 54435 3849886 Accommodation 27949 29078 29396 31914 30784 31693 31661 32471 2105887 Food services and drinking places 22600 19100 19733 20323 20704 21247 21567 21959 1725388 Other services, except government 4673 4599 4688 4785 4879 4910 4924 4983 414689 Government 21024 21043 21468 21540 22372 23133 23256 23035 2174390 Federal 3138 3278 3052 2984 3069 3101 3193 2348 215191 General government 2611 2805 2591 2535 2634 2656 2741 1938 175592 National defense 0 0 0 0 0 0 0 0 093 Nondefense 2611 2804 2590 2534 2634 2656 2741 1938 175494 Government enterprises 527 471 462 449 430 441 446 425 41795 State and local 17886 17769 18402 18536 19279 20001 20037 20624 1952796 General government 18138 17750 18218 18475 19355 19984 20003 20512 1976797 Government enterprises -252 69 235 142 108 139 145 180 44
Table 5. Real Outdoor Recreation Value Added by Industry[Millions of chained (2012) dollars]Bureau of Economic Analysis

2012 2013 2014 2015 2016 2017 2018 2019 2020 1 All Industries 359199 372397 382706 402057 409551 430584 448899 465184 3742662 Private industries 338175 350253 359262 377541 383970 404084 421778 437840 3472373 Agriculture, forestry, fishing, and hunting 7855 8817 8620 8722 10094 11468 11239 11396 102314 Farms 5869 6637 6489 6381 6356 6835 6965 6666 66985 Forestry, fishing, and related activities 1986 2180 2131 2341 3738 4633 4274 4730 35336 Mining 343 314 286 199 174 267 318 289 2327 Oil and gas extraction 106 117 125 93 84 90 107 103 1038 Mining, except oil and gas 185 145 105 67 59 142 170 144 959 Support activities for mining 52 52 56 39 30 35 41 42 34
10 Utilities 1 1 1 1 1 1 1 1 111 Construction 5117 4860 5125 5271 5464 5330 5981 6560 664612 Manufacturing 48992 50526 50189 50249 46694 51389 57039 54931 5282913 Durable goods 18260 19636 19290 19878 21156 22334 24290 22715 2313914 Wood products 3 3 3 3 3 3 2 3 315 Nonmetallic mineral products 47 51 50 54 53 56 49 63 7816 Primary metals 5 4 5 5 5 4 11 10 817 Fabricated metal products 1727 2128 1843 2006 2505 2239 2326 2211 218818 Machinery 1937 2001 1873 1661 1128 1514 2377 1960 184619 Computer and electronic products 570 565 683 1112 686 642 714 669 69620 Electrical equipment, appliances, and components 638 624 600 652 552 564 553 530 46121 Motor vehicles, bodies and trailers, and parts 3450 3990 4093 4354 5395 6559 7256 6212 689122 Other transportation equipment 6498 7113 7048 6970 7458 7226 7371 6941 659223 Furniture and related products 55 59 59 59 51 48 40 47 5824 Miscellaneous manufacturing 3330 3099 3035 3003 3318 3480 3593 4069 431925 Nondurable goods 30733 30890 30899 30371 25539 29055 32749 32216 2968926 Food and beverage and tobacco products 6480 6733 7019 7571 7435 7502 7651 7893 883427 Textile mills and textile product mills 508 460 497 524 539 478 411 531 113728 Apparel and leather and allied products 2895 2898 2739 2675 2692 2731 2639 2701 278229 Paper products 301 301 291 301 275 240 218 254 29030 Printing and related support activities 112 111 115 135 135 124 127 133 19131 Petroleum and coal products 16735 16327 15999 14780 9965 13284 17022 15935 1131032 Chemical products 3458 3818 4008 4125 4231 4434 4462 4538 487033 Plastics and rubber products 244 242 230 259 266 261 219 232 27534 Wholesale trade 33074 32684 34055 35762 34742 35254 35644 36682 3378435 Retail trade 86849 90063 90183 93511 93849 97475 98744 102183 10185636 Motor vehicle and parts dealers 8230 8476 8508 9359 9734 9988 9675 9703 1276537 Food and beverage stores 5640 5698 5797 6105 6267 6513 6560 6683 738838 General merchandise stores 16070 16684 16201 16447 15426 16533 16750 16871 1823939 Other retail 56910 59204 59676 61600 62421 64441 65760 68926 6346540 Transportation and warehousing 33165 35559 40369 43513 45757 47458 48509 52595 1979441 Air transportation 22292 23600 28296 30921 33372 34598 35153 38330 1082042 Rail transportation 589 598 612 647 651 700 748 734 50843 Water transportation 2565 3269 3283 3391 3079 2987 3285 3462 170644 Truck transportation 4030 4016 4101 4141 4185 4324 4481 4776 426145 Transit and ground passenger transportation 2004 2247 2183 2234 2391 2437 2506 2795 145646 Pipeline transportation 359 384 408 557 597 578 597 557 60547 Other transportation and support activities 1288 1405 1448 1585 1441 1791 1697 1894 39648 Warehousing and storage 39 39 38 37 40 42 42 46 4249 Information 1308 1374 1396 1500 1560 1624 1700 1772 209950 Publishing industries, except internet (includes software) 534 495 486 493 482 491 492 487 44851 Motion picture and sound recording industries 48 50 52 59 61 63 71 90 39652 Broadcasting and telecommunications 605 690 700 760 796 813 835 833 83653 Data processing, internet publishing, and other information services 122 139 158 188 220 258 301 362 41954 Finance, insurance, real estate, rental, and leasing 17879 22202 18874 20438 21353 21542 22187 23511 2329155 Finance and insurance 3732 3405 4029 4437 4593 4330 4451 4662 465656 Federal Reserve banks, credit intermediation, and related activities 354 367 385 419 493 538 494 562 47657 Securities, commodity contracts, and investments ... ... ... ... ... ... ... ... ...58 Insurance carriers and related activities 3378 3038 3644 4018 4101 3792 3956 4100 418159 Funds, trusts, and other financial vehicles ... ... ... ... ... ... ... ... ...60 Real estate and rental and leasing 14147 18798 14846 16002 16759 17212 17737 18849 1863561 Real estate 11199 15767 12320 13021 13242 13506 14145 14847 1542462 Housing 11194 15762 12315 13016 13237 13501 14140 14841 1541863 Other real estate 5 5 5 5 5 6 6 6 564 Rental and leasing services and lessors of intangible assets 2948 3031 2526 2981 3517 3706 3591 4002 321165 Professional and business services 5954 5776 6040 6490 6844 7870 8492 8096 116766 Professional, scientific, and technical services 1079 1091 1264 1393 1478 1614 1698 1753 81867 Legal services ... ... ... ... ... ... ... ... ...68 Computer systems design and related services 63 54 55 66 60 66 68 73 7469 Miscellaneous professional, scientific, and technical services 1015 1037 1209 1327 1418 1548 1630 1680 74470 Management of companies and enterprises ... ... ... ... ... ... ... ... ...71 Administrative and waste management services 4875 4685 4775 5097 5366 6256 6794 6343 34972 Administrative and support services 4874 4684 4774 5095 5364 6255 6792 6341 34773 Waste management and remediation services 1 1 1 1 1 1 1 2 274 Educational services, health care, and social assistance 2747 2743 2933 3043 3373 3600 3924 4188 303875 Educational services 2263 2269 2444 2533 2832 3032 3337 3555 240376 Health care and social assistance 484 473 489 510 541 568 587 634 63577 Ambulatory health care services 273 277 287 295 320 340 350 384 37378 Hospitals 160 147 152 163 169 173 181 192 19079 Nursing and residential care facilities 22 20 20 21 21 22 22 23 2380 Social assistance 29 30 30 31 30 33 34 35 4981 Arts, entertainment, recreation, accommodation, and food services 90217 90578 96215 103603 108572 115049 121989 129269 8684182 Arts, entertainment, and recreation 39668 41048 44115 45743 49312 52713 56601 60281 3951683 Performing arts, spectator sports, museums, and related activities 10512 11078 12146 12023 13349 14403 15112 15736 797784 Amusements, gambling, and recreation industries 29156 29970 31969 33720 35963 38311 41489 44545 3154085 Accommodation and food services 50549 49530 52100 57859 59260 62335 65387 68988 4732586 Accommodation 27949 29870 31360 35331 35309 37119 38994 41181 2360987 Food services and drinking places 22600 19660 20740 22529 23952 25216 26393 27807 2371688 Other services, except government 4673 4756 4976 5239 5494 5758 6013 6366 542789 Government 21024 22144 23445 24517 25581 26500 27121 27344 2703090 Federal 3138 3317 3133 3093 3230 3365 3573 2683 248291 General government 2611 2859 2710 2698 2841 2951 3159 2288 209392 National defense 0 0 0 0 0 0 0 0 093 Nondefense 2611 2859 2710 2698 2841 2951 3159 2288 209394 Government enterprises 527 458 423 395 389 414 414 395 38995 State and local 17886 18827 20311 21424 22352 23135 23547 24661 2454896 General government 18138 18773 20028 20926 21850 22609 23129 24096 2439197 Government enterprises -252 54 283 498 501 526 418 565 157
Table 6. Outdoor Recreation Value Added by Industry[Millions of current dollars]Bureau of Economic Analysis

2012 2013 2014 2015 2016 2017 2018 2019 2020 1 Total Outdoor Recreation 692024 703477 715592 734384 745172 766903 785084 791694 6540242 Total Core Outdoor Recreation 348534 357543 364111 374631 381224 396125 404039 402882 3540343 Conventional Outdoor Recreation 222095 229796 233196 240854 247823 254884 256709 255462 2496534 Bicycling 3283 3452 3511 3387 3475 3523 3442 3743 41325 Boating/Fishing 32256 32402 32728 34820 37927 39638 40135 40184 510516 Canoeing 108 103 107 112 121 126 122 139 1397 Kayaking 904 682 645 645 651 698 726 728 8448 Fishing (excludes Boating) 4865 4831 4975 5621 7693 8684 9152 8929 88209 Sailing 1778 1898 1977 2006 2141 2150 2112 2230 1592
10 Other Boating 24601 24891 25026 26436 27282 27930 27973 28102 3955911 Climbing/Hiking/Tent Camping 5473 5703 5801 5511 5495 6340 6303 6663 660712 Equestrian 6497 6908 7537 7764 8594 9190 10659 9352 812513 Hunting/Shooting/Trapping 11387 13005 12394 12700 14863 14798 14085 13604 1316914 Hunting/Trapping 5858 6639 6360 6575 7975 8524 7829 7675 756715 Shooting (includes Archery) 5529 6366 6033 6123 6879 6252 6240 5912 558316 Motorcycling/ATVing 17163 17579 17949 19084 18912 18920 18912 17929 1769417 Recreational Flying 2875 2855 2950 2949 2912 2848 2365 2442 309418 RVing 26683 28879 30376 31095 32671 33993 33704 33111 3224819 Snow Activities 10652 10722 11077 11302 11285 11207 11504 11993 898720 Skiing 2935 2982 3214 3319 3272 3220 3285 3461 222821 Snowboarding 2540 2629 2766 2859 2903 2965 3025 3197 200622 Other Snow Activities (includes Snowmobiling)1 5177 5111 5093 5112 5096 4994 5172 5299 490823 Other Conventional Outdoor Recreation Activities 17746 18007 18101 18681 18047 17824 17792 18970 1992124 Other Conventional Air and Land Activities2 14723 15042 14975 14916 14330 14157 13982 14450 1366525 Other Conventional Water Activities3 3024 2966 3123 3717 3658 3609 3733 4374 581526 Multi-use Apparel and Accessories (Conventional)4 88079 90278 90768 93569 93386 96186 97346 97154 8354227 Other Outdoor Recreation 126439 127746 130914 133791 133522 141248 147192 147258 10602528 Amusement Parks/Water Parks 12971 12244 12028 12460 12942 15025 16618 16722 744329 Festivals/Sporting Events/Concerts 20561 20849 21524 21671 21606 23141 23692 24258 1313430 Field Sports 5237 5243 5440 5689 5709 5832 6043 6242 576231 Game Areas (includes Golfing and Tennis) 32141 33197 32408 32341 32358 33928 34439 35504 2721332 Guided Tours/Outfitted Travel 24794 24667 26182 25353 23954 25471 28532 26301 2061433 Air and Land Guided Tours/Outfitted Travel 12465 12675 14216 14632 14538 14112 16296 15109 1178534 Water Guided Tours/Outfitted Travel (includes Boating and Fishing Charters) 12328 11993 11971 10732 9436 11360 12246 11202 883635 Productive Activities (includes Gardening) 9642 9910 11228 12839 13802 13641 13223 13502 1354736 Other Outdoor Recreation Activities5 14741 14948 15471 16815 16616 17138 17259 17441 1403637 Multi-use Apparel and Accessories (Other)4 6353 6714 6738 6938 6997 7082 6967 6929 661738 Supporting Outdoor Recreation 343490 345925 351470 359719 363851 370475 380784 388670 29868539 Construction 9049 8463 8743 9269 8917 7998 8396 8864 878440 Local Trips and Travel6 71503 72294 72238 72656 72215 73338 74972 75825 6791641 Trips and Travel7 230299 231557 236585 242082 244953 251182 259054 266031 18353042 Food and Beverages 38105 31500 32232 33618 34429 35335 36282 37326 3000743 Lodging 45208 50313 48653 50661 51506 51484 51470 51981 3208044 Shopping and Souvenirs 40608 41372 42092 42582 43088 44301 45000 44974 4660945 Transportation 106379 108391 113731 115205 115772 120199 126921 132690 7270846 Government Expenditures 32638 33614 33885 35544 37442 37808 38161 37656 3812347 Federal Government 3723 3942 3626 3613 3739 3689 3859 2739 258448 State and Local Government 28915 29673 30254 31926 33700 34121 34298 34965 35598
Legend / Footnotes:
Table 7. Real Outdoor Recreation Gross Output by Activity[Millions of chained (2012) dollars]Bureau of Economic Analysis
7. Travel and tourism expenses in the Outdoor Recreation Satellite Account are consistent with the Travel and Tourism Satellite Account, which includes only expenses for travel at least 50 miles away from home.
1. Consists of dog mushing, sleighing, snowmobiling, snow shoeing, snow tubing.2. Consists of air sports, driving for pleasure, geocaching/orienteering/rock hounding, ice skating, inline skating, land/sand sailing, races, running/walking/jogging, skateboarding, and wildlife watching/birding.3. Consists of boardsailing/windsurfing, SCUBA diving, snorkeling, stand-up paddling, surfing, tubing, wakeboarding, water skiing, and whitewater rafting.
4. Consists of backpacks, bug spray, coolers, general outdoor clothing, GPS equipment, hydration equipment, lighting, sports racks, sunscreen, watches, and other miscellaneous gear and equipment.5. Consists of agritourism, augmented reality games, beachgoing, disc golf, hot springs soaking, kite flying, model airplane/rocket/UAV, paintball, photography, stargazing/astronomy, swimming, therapeutic programs, water polo, yard sports.6. Trip expenses less than 50 miles away from home, including food and beverages, lodging, shopping and souvenirs, and transportation.

2012 2013 2014 2015 2016 2017 2018 2019 2020 1 Total Outdoor Recreation 692024 713411 733453 733925 742697 781958 825406 844968 6885732 Total core outdoor recreation 348534 363467 373332 383172 391541 412474 429354 436627 3856653 Conventional outdoor recreation 222095 233669 239102 243426 250266 261055 268248 271581 2632324 Bicycling 3283 3444 3527 3427 3584 3671 3651 4156 46945 Boating/fishing 32256 33058 34014 35803 39185 41632 43407 44730 566986 Canoeing 108 105 110 118 129 136 136 159 1657 Kayaking 904 701 685 691 710 773 830 866 10188 Fishing (excludes boating) 4865 5009 5201 5903 8076 9218 9711 9815 96519 Sailing 1778 1917 2032 2101 2273 2289 2318 2512 1841
10 Other boating 24601 25326 25986 26990 27995 29216 30412 31378 4402311 Climbing/hiking/tent camping 5473 5785 5997 5834 5692 6664 6782 7240 718612 Equestrian 6497 7052 7906 8054 8836 9677 11474 10330 917913 Hunting/shooting/trapping 11387 13380 12922 13331 15651 15841 15287 15311 1488814 Hunting/trapping 5858 6870 6708 6993 8485 9230 8542 8706 863715 Shooting (includes archery) 5529 6510 6214 6339 7166 6611 6745 6606 625116 Motorcycling/ATVing 17163 17685 17962 18381 18277 18880 19421 18547 1818117 Recreational flying 2875 2963 3004 2636 2489 2591 2290 2373 274618 RVing 26683 29398 31530 31911 33624 35587 36553 36463 3613319 Snow activities 10652 10749 11134 10754 10667 10971 11811 12384 920920 Skiing 2935 2993 3268 3439 3438 3403 3569 3849 254721 Snowboarding 2540 2643 2820 2977 3064 3146 3302 3568 230522 Other snow activities (includes snowmobiling)1 5177 5113 5047 4339 4165 4422 4940 4966 435723 Other conventional outdoor recreation activities 17746 18280 18290 17419 16446 16819 17439 18591 1910524 Other conventional air and land activities2 14723 15226 15058 13521 12568 12969 13354 13699 1234825 Other conventional water activities3 3024 3054 3232 3898 3878 3851 4084 4891 675726 Multi-use apparel and accessories (conventional)4 88079 91876 92816 95877 95817 98722 100131 101455 8521327 Other outdoor recreation 126439 129798 134230 139746 141275 151419 161106 165046 12243428 Amusement parks/water parks 12971 13013 13383 14464 15702 18823 21280 22401 1079229 Festivals/sporting events/concerts 20561 21324 22589 24084 24845 27138 28322 29561 1687430 Field sports 5237 5352 5614 5928 6006 6197 6502 6868 638531 Game areas (includes golfing and tennis) 32141 33293 32880 33380 33699 35177 36516 38521 3007932 Guided tours/outfitted travel 24794 25001 26948 26654 25565 27577 31616 29849 2391133 Air and land guided tours/outfitted travel 12465 12828 14577 15316 15418 15177 17924 16981 1350334 Water guided tours/outfitted travel (includes boating and fishing charters) 12328 12173 12371 11339 10147 12400 13692 12868 1040835 Productive activities (includes gardening) 9642 9921 10174 10932 11392 11614 11469 11895 1208136 Other outdoor recreation activities5 14741 15132 15843 17313 17017 17647 18186 18676 1525437 Multi-use apparel and accessories (other)4 6353 6761 6800 6989 7049 7246 7215 7274 705938 Supporting outdoor recreation 343490 349943 360121 350753 351156 369484 396052 408341 30290839 Construction 9049 8801 9507 10358 10274 9591 10537 11590 1182140 Local trips and travel6 71503 72435 72192 64207 61435 66009 71560 71556 6150341 Trips and travel7 230299 233973 242776 239339 241061 254223 272288 283772 18698342 Food and beverages 38105 32222 33743 36280 38106 40073 42256 44609 3786643 Lodging 45208 51469 51416 54797 57100 58470 60986 63207 3667744 Shopping and souvenirs 40608 41816 43335 43097 43081 45087 46821 47498 4940445 Transportation 106379 108467 114282 105165 102775 110594 122225 128459 6303546 Government expenditures 32638 34734 35645 36849 38386 39660 41666 41423 4260047 Federal government 3723 4009 3773 3799 3976 4029 4364 3171 302348 State and local government 28915 30725 31872 33050 34410 35631 37303 38251 39578
Table 8. Outdoor Recreation Gross Output by Activity[Millions of current dollars]Bureau of Economic Analysis
7. Travel and tourism expenses in the Outdoor Recreation Satellite Account are consistent with the Travel and Tourism Satellite Account, which includes only expenses for travel at least 50 miles away from home.
1. Consists of dog mushing, sleighing, snowmobiling, snow shoeing, and snow tubing.2. Consists of air sports, driving for pleasure, geocaching/orienteering/rock hounding, ice skating, inline skating, land/sand sailing, races, running/walking/jogging, skateboarding, and wildlife watching/birding.3. Consists of boardsailing/windsurfing, SCUBA diving, snorkeling, stand-up paddling, surfing, tubing, wakeboarding, water skiing, and whitewater rafting.4. Consists of backpacks, bug spray, coolers, general outdoor clothing, GPS equipment, hydration equipment, lighting, sports racks, sunscreen, watches, and other miscellaneous gear and equipment.5. Consists of agritourism, augmented reality games, beachgoing, disc golf, hot springs soaking, kite flying, model airplane/rocket/UAV, paintball, photography, stargazing/astronomy, swimming, therapeutic programs, water polo, and yard sports.6. Trip expenses less than 50 miles away from home, including food and beverages, lodging, shopping and souvenirs, and transportation.

2012 2013 2014 2015 2016 2017 2018 2019 2020 1 All Industries 692024 703477 715592 734384 745172 766903 785084 791694 6540242 Private industries 652717 663324 674973 691894 700615 722035 739800 746919 6091473 Agriculture, forestry, fishing, and hunting 13280 13614 14638 15495 17669 19402 18476 18407 178564 Farms 10327 10405 11558 12392 13180 13390 13301 13289 138005 Forestry, fishing, and related activities 2953 3207 3107 3160 4325 5545 4875 4829 40346 Mining 578 511 504 400 357 505 610 655 6577 Oil and gas extraction 194 199 228 213 210 229 284 378 5168 Mining, except oil and gas 331 263 219 150 125 247 287 245 1609 Support activities for mining 52 46 49 32 23 26 34 33 26
10 Utilities 2 2 2 2 1 1 1 1 111 Construction 8334 8044 8068 8496 8102 7217 7598 8117 804512 Manufacturing 147667 152538 151567 153401 152659 154691 155630 152044 15549513 Durable goods 43732 46468 46962 47611 46964 48662 50161 47252 4759014 Wood products 4 4 4 4 4 4 2 4 415 Nonmetallic mineral products 81 81 80 83 83 82 66 87 10816 Primary metals 13 10 12 11 10 10 27 23 1717 Fabricated metal products 3055 3456 3124 3249 3853 3174 3248 3073 306918 Machinery 4993 4707 4480 3715 2431 3079 4253 3493 340719 Computer and electronic products 818 798 906 1433 1103 984 1017 888 93720 Electrical equipment, appliances, and components 1297 1144 1181 1111 996 977 987 937 80821 Motor vehicles, bodies and trailers, and parts 11172 13245 14098 14263 15019 16540 16817 16041 1614222 Other transportation equipment 15020 15855 16582 17290 16975 16964 16919 15435 1469823 Furniture and related products 134 142 135 130 116 107 80 85 10624 Miscellaneous manufacturing 7146 7011 6369 6375 6326 6663 6696 7164 838625 Nondurable goods 103936 106045 104530 105690 105808 105552 104472 104564 10815926 Food and beverage and tobacco products 17643 17899 17922 18226 18770 18799 19066 18743 2011927 Textile mills and textile product mills 914 810 844 880 908 833 691 875 194128 Apparel and leather and allied products 4901 4749 4331 4102 4135 3971 3595 3673 405329 Paper products 732 713 686 707 687 672 612 639 74630 Printing and related support activities 209 203 208 235 233 212 215 215 30431 Petroleum and coal products 72349 74062 72642 73822 73202 72940 72666 73491 7047232 Chemical products 6574 7008 7283 7211 7007 7214 7057 6650 721733 Plastics and rubber products 613 611 593 605 631 635 511 519 62634 Wholesale trade 60497 57145 58578 58042 56465 57916 57919 57247 5169735 Retail trade 143548 150644 151410 157922 160537 165617 170626 171848 16472936 Motor vehicle and parts dealers 12752 12719 12713 14890 16866 16820 17311 16627 1737637 Food and beverage stores 8491 8323 8296 8285 8190 8473 8279 8373 901938 General merchandise stores 24413 26551 26056 27111 25402 26124 26907 26236 2822639 Other retail 97892 103072 104348 107609 109869 113967 117941 120334 10996240 Transportation and warehousing 72383 73905 81178 82137 82632 86516 91653 96578 4916041 Air transportation 47344 48087 54187 54922 55475 57508 60382 63568 2751842 Rail transportation 1106 1093 1117 1111 1125 1164 1209 1194 80143 Water transportation 9124 9474 10377 10211 10028 10869 12223 13328 731044 Truck transportation 8063 7963 8070 7973 7994 8349 8653 8989 825545 Transit and ground passenger transportation 2981 3371 3429 3546 3671 4083 4640 4783 262246 Pipeline transportation 560 560 574 621 603 574 589 599 62947 Other transportation and support activities 3160 3311 3394 3711 3706 3886 3839 4009 134348 Warehousing and storage 44 44 42 43 47 49 49 52 5149 Information 2137 2165 2273 2394 2476 2582 2668 2772 325350 Publishing industries, except internet (includes software) 764 720 710 716 678 684 651 632 53951 Motion picture and sound recording industries 74 68 68 77 79 74 88 119 50652 Broadcasting and telecommunications 1070 1141 1243 1294 1389 1436 1469 1503 152953 Data processing, internet publishing, and other information services 230 237 254 309 336 396 467 523 60754 Finance, insurance, real estate, rental, and leasing 24203 28345 23982 24969 25899 25872 25876 26988 2591055 Finance and insurance 7106 7000 7382 7708 7861 7849 7807 8310 799656 Federal Reserve banks, credit intermediation, and related activities 500 530 515 538 612 674 572 630 50357 Securities, commodity contracts, and investments ... ... ... ... ... ... ... ... ...58 Insurance carriers and related activities 6606 6470 6867 7171 7248 7174 7236 7680 749559 Funds, trusts, and other financial vehicles ... ... ... ... ... ... ... ... ...60 Real estate and rental and leasing 17096 21342 16618 17281 18058 18043 18090 18696 1792961 Real estate 11514 15599 11882 12020 12099 11923 12081 12225 1234262 Housing 11509 15594 11877 12016 12095 11918 12076 12220 1233763 Other real estate 5 5 5 5 5 5 5 5 564 Rental and leasing services and lessors of intangible assets 5582 5738 4734 5272 6039 6235 6094 6630 553365 Professional and business services 11174 11479 11981 12673 13605 14923 16412 15609 659366 Professional, scientific, and technical services 1400 1433 1574 1659 1743 1857 1890 1886 158967 Legal services ... ... ... ... ... ... ... ... ...68 Computer systems design and related services 66 52 52 63 58 61 62 69 6969 Miscellaneous professional, scientific, and technical services 1335 1382 1523 1597 1685 1796 1828 1818 152270 Management of companies and enterprises ... ... ... ... ... ... ... ... ...71 Administrative and waste management services 9773 10046 10406 11012 11863 13069 14530 13727 494772 Administrative and support services 9772 10045 10405 11011 11862 13068 14529 13725 494673 Waste management and remediation services 1 1 1 1 1 1 1 1 174 Educational services, health care, and social assistance 5518 5456 5632 5932 6343 6612 6841 6790 503975 Educational services 4952 4907 5070 5342 5717 5957 6155 6058 435176 Health care and social assistance 566 549 562 590 625 655 686 737 70677 Ambulatory health care services 338 338 347 368 403 430 460 507 47978 Hospitals 174 156 160 165 166 168 169 174 16079 Nursing and residential care facilities 24 21 21 21 20 20 20 20 1980 Social assistance 31 34 35 37 36 38 38 39 5381 Arts, entertainment, recreation, accommodation, and food services 157445 153805 159356 163947 167354 173298 177905 181077 12179982 Arts, entertainment, and recreation 70676 71747 73790 75060 76890 81651 85063 86525 5688583 Performing arts, spectator sports, museums, and related activities 19348 19576 20248 20485 20432 21934 22482 23009 1196684 Amusements, gambling, and recreation industries 51328 52171 53542 54577 56484 59731 62619 63547 4509585 Accommodation and food services 86770 82062 85566 88884 90461 91652 92866 94575 6496086 Accommodation 46525 48058 50449 52147 52819 52963 53083 53619 3105787 Food services and drinking places 40245 34007 35119 36740 37644 38687 39781 40958 3357488 Other services, except government 5951 5873 5961 6077 6212 6376 6469 6599 535089 Government 39307 40151 40622 42467 44483 44824 45261 44784 4451390 Federal 4469 4620 4282 4247 4349 4292 4460 3294 310891 General government 3743 3956 3644 3630 3762 3709 3875 2755 259892 National defense 0 0 0 0 0 0 0 0 093 Nondefense 3743 3956 3643 3630 3761 3709 3874 2755 259794 Government enterprises 726 663 639 614 579 576 574 550 52195 State and local 34838 35532 36332 38209 40122 40521 40789 41502 4142296 General government 33142 33639 34595 36460 38422 38910 39191 39976 4040297 Government enterprises 1696 1892 1735 1749 1707 1625 1613 1546 1059
Table 9. Real Outdoor Recreation Gross Output by Industry[Millions of chained (2012) dollars]Bureau of Economic Analysis

2012 2013 2014 2015 2016 2017 2018 2019 2020 1 All Industries 692024 713411 733453 733925 742697 781958 825406 844968 6885732 Private industries 652717 672026 690876 689879 696928 734837 775994 795657 6389373 Agriculture, forestry, fishing, and hunting 13280 13830 13989 14036 15239 17012 16395 16606 162434 Farms 10327 10495 10644 10600 10532 10879 10972 11030 115235 Forestry, fishing, and related activities 2953 3335 3345 3436 4707 6133 5424 5577 47206 Mining 578 510 504 313 263 445 599 524 4867 Oil and gas extraction 194 209 254 148 132 192 291 256 3108 Mining, except oil and gas 331 248 195 126 101 217 267 226 1429 Support activities for mining 52 52 56 39 31 35 41 42 34
10 Utilities 2 2 2 2 2 2 1 1 211 Construction 8334 8365 8772 9505 9352 8670 9550 10636 1085112 Manufacturing 147667 151589 148298 126663 118007 127200 137068 131029 12196413 Durable goods 43732 47443 48606 49854 49307 51692 54454 52564 5352314 Wood products 4 4 4 4 5 5 3 4 415 Nonmetallic mineral products 81 82 82 86 88 87 72 97 12116 Primary metals 13 10 12 11 10 10 28 25 1817 Fabricated metal products 3055 3722 3391 3523 4120 3501 3640 3568 347618 Machinery 4993 4783 4656 3910 2515 3195 4486 3780 375519 Computer and electronic products 818 782 889 1329 921 812 847 732 76420 Electrical equipment, appliances, and components 1297 1150 1198 1132 1014 999 1026 1004 88021 Motor vehicles, bodies and trailers, and parts 11172 13555 14704 15187 16213 18267 19221 18685 1913622 Other transportation equipment 15020 16086 16959 17903 17783 18081 18353 17230 1670023 Furniture and related products 134 146 141 139 128 118 90 99 12624 Miscellaneous manufacturing 7146 7124 6570 6631 6510 6617 6688 7340 854225 Nondurable goods 103936 104146 99693 76809 68701 75508 82615 78466 6844126 Food and beverage and tobacco products 17643 18186 18939 19080 19160 19382 19844 19771 2162827 Textile mills and textile product mills 914 851 902 944 980 905 761 977 216328 Apparel and leather and allied products 4901 4879 4514 4360 4417 4316 3970 4084 447929 Paper products 732 711 682 700 681 665 605 647 76030 Printing and related support activities 209 204 211 239 237 219 224 230 32631 Petroleum and coal products 72349 71583 66287 43268 35149 41534 49026 44921 3056232 Chemical products 6574 7114 7550 7602 7439 7838 7653 7294 786833 Plastics and rubber products 613 617 608 616 638 648 532 543 65534 Wholesale trade 60497 61363 63487 63673 62437 65342 66632 67597 6132635 Retail trade 143548 150631 154042 162306 166408 172134 178164 182762 17863336 Motor vehicle and parts dealers 12752 13002 13514 15678 17632 17240 18015 17711 1982637 Food and beverage stores 8491 8502 8777 9187 9386 9820 9900 10202 1145838 General merchandise stores 24413 25997 25182 25644 24279 25227 25902 25718 2737539 Other retail 97892 103130 106569 111797 115111 119847 124347 129130 11997540 Transportation and warehousing 72383 74317 82932 81132 81267 86630 94895 102436 4754441 Air transportation 47344 48227 55487 53409 52711 55852 60858 66398 2500442 Rail transportation 1106 1128 1168 1144 1155 1231 1333 1355 92543 Water transportation 9124 9444 10275 10191 10717 11569 13106 13993 718844 Truck transportation 8063 8079 8321 8067 8032 8574 9466 10074 920945 Transit and ground passenger transportation 2981 3458 3521 3679 3908 4403 5055 5226 280346 Pipeline transportation 560 584 637 721 716 687 718 753 81647 Other transportation and support activities 3160 3354 3480 3878 3981 4264 4306 4579 154248 Warehousing and storage 44 45 44 44 48 51 53 58 5749 Information 2137 2200 2324 2463 2552 2664 2745 2881 345850 Publishing industries, except internet (includes software) 764 735 735 749 720 738 719 723 66151 Motion picture and sound recording industries 74 76 78 90 92 92 111 148 66252 Broadcasting and telecommunications 1070 1149 1252 1309 1399 1428 1433 1456 147153 Data processing, internet publishing, and other information services 230 240 258 315 341 405 482 554 66554 Finance, insurance, real estate, rental, and leasing 24203 29034 25273 26625 28138 29064 30088 32142 3131555 Finance and insurance 7106 7142 7644 8130 8604 8975 9263 10078 984856 Federal Reserve banks, credit intermediation, and related activities 500 551 546 577 677 762 700 780 62357 Securities, commodity contracts, and investments ... ... ... ... ... ... ... ... ...58 Insurance carriers and related activities 6606 6590 7098 7553 7927 8213 8563 9298 922559 Funds, trusts, and other financial vehicles ... ... ... ... ... ... ... ... ...60 Real estate and rental and leasing 17096 21892 17629 18494 19535 20088 20825 22063 2146661 Real estate 11514 16039 12602 13205 13793 14109 14815 15546 1618662 Housing 11509 16034 12597 13200 13787 14104 14809 15540 1618063 Other real estate 5 5 5 5 5 6 6 6 564 Rental and leasing services and lessors of intangible assets 5582 5853 5027 5289 5742 5979 6010 6517 528165 Professional and business services 11174 11649 12309 13285 14525 16216 18174 17704 747266 Professional, scientific, and technical services 1400 1467 1644 1780 1922 2085 2169 2234 194067 Legal services ... ... ... ... ... ... ... ... ...68 Computer systems design and related services 66 56 57 69 62 68 71 75 7969 Miscellaneous professional, scientific, and technical services 1335 1411 1586 1712 1860 2017 2099 2159 186170 Management of companies and enterprises ... ... ... ... ... ... ... ... ...71 Administrative and waste management services 9773 10182 10666 11505 12603 14131 16004 15470 553272 Administrative and support services 9772 10181 10665 11504 12601 14130 16003 15468 553073 Waste management and remediation services 1 1 1 1 1 1 1 2 274 Educational services, health care, and social assistance 5518 5598 5900 6364 6932 7424 7820 7873 598875 Educational services 4952 5040 5316 5749 6278 6731 7101 7084 522076 Health care and social assistance 566 558 584 615 655 693 719 789 76877 Ambulatory health care services 338 346 363 383 418 447 465 523 49478 Hospitals 174 160 167 177 182 187 195 205 19979 Nursing and residential care facilities 24 21 22 22 23 23 23 24 2480 Social assistance 31 32 32 33 33 35 36 37 5181 Arts, entertainment, recreation, accommodation, and food services 157445 156892 166771 176955 184955 194745 206193 215329 14691882 Arts, entertainment, and recreation 70676 73040 76823 81111 85082 91265 97562 101974 7017383 Performing arts, spectator sports, museums, and related activities 19348 20013 21235 22730 23463 25684 26839 27999 1537684 Amusements, gambling, and recreation industries 51328 53027 55589 58381 61619 65582 70723 73976 5479885 Accommodation and food services 86770 83852 89948 95844 99873 103479 108631 113354 7674586 Accommodation 46525 49079 53189 56188 58204 59610 62311 64414 3452387 Food services and drinking places 40245 34773 36759 39655 41669 43870 46320 48940 4222288 Other services, except government 5951 6047 6273 6556 6850 7288 7668 8137 673689 Government 39307 41385 42576 44047 45769 47121 49412 49311 4963690 Federal 4469 4676 4397 4381 4543 4609 4936 3722 354591 General government 3743 4024 3791 3816 3999 4051 4380 3188 303792 National defense 0 0 0 0 0 0 0 0 093 Nondefense 3743 4024 3791 3816 3999 4050 4380 3187 303794 Government enterprises 726 652 606 564 544 559 556 534 50895 State and local 34838 36708 38179 39666 41226 42512 44475 45589 4609096 General government 33142 34757 36372 37796 39354 40697 42639 43810 4487797 Government enterprises 1696 1951 1807 1870 1872 1815 1836 1779 1213
Table 10. Outdoor Recreation Gross Output by Industry[Millions of current dollars]Bureau of Economic Analysis

TUESDAY, November 9, 2021
Total outdoor recreation value added (thousands of
dollars)
Percent of total value added1
Total outdoor recreation employment
Percent of total wage and salary
employment1
Total outdoor recreation compensation (thousands
of dollars)
Percent of total compensation1
United States 374,266,455 1.8 4,324,240 2.9 202,828,339 1.8Alabama 4,228,572 1.9 55,648 2.7 2,116,218 1.6Alaska 1,573,106 3.2 17,773 5.4 981,020 3.4Arizona 7,650,277 2.0 95,183 3.2 4,445,920 2.1Arkansas 2,909,717 2.2 37,089 2.9 1,528,988 2.0California 44,498,223 1.5 488,755 2.8 25,765,580 1.5Colorado 9,556,036 2.5 120,063 4.3 5,673,406 2.5Connecticut 3,297,520 1.2 41,721 2.6 1,862,133 1.3Delaware 1,140,846 1.5 14,347 3.2 548,758 1.6District of Columbia 1,214,706 0.8 12,809 1.7 750,662 0.7Florida 33,181,722 3.0 384,198 4.3 17,838,503 2.9Georgia 10,802,780 1.7 131,490 2.9 6,248,763 1.9Hawaii 3,160,049 3.8 43,808 7.0 2,107,002 4.4Idaho 2,243,621 2.7 29,867 3.8 1,195,526 2.5Illinois 13,659,718 1.6 147,565 2.5 7,747,245 1.6Indiana 9,845,722 2.6 95,249 3.1 4,799,989 2.4Iowa 3,567,939 1.8 42,877 2.7 1,719,445 1.7Kansas 3,032,363 1.7 35,247 2.4 1,451,874 1.6Kentucky 4,049,475 1.9 46,957 2.4 1,952,504 1.6Louisiana 5,507,208 2.3 55,729 2.9 2,504,459 2.0Maine 2,269,759 3.3 28,368 4.6 1,093,840 2.7Maryland 5,511,424 1.3 69,377 2.6 3,364,806 1.4Massachusetts 7,693,482 1.3 90,606 2.6 4,654,922 1.4Michigan 9,518,574 1.8 108,673 2.6 4,627,965 1.5Minnesota 8,405,894 2.2 89,331 3.1 4,322,553 2.0Mississippi 2,641,927 2.3 29,375 2.5 1,148,407 1.8Missouri 6,451,039 2.0 79,299 2.8 3,486,998 1.8Montana 2,236,881 4.3 26,169 5.4 1,117,116 3.8Nebraska 2,181,596 1.6 26,614 2.6 1,100,167 1.6Nevada 3,976,917 2.3 49,501 3.8 2,199,335 2.4New Hampshire 2,261,417 2.6 26,583 4.1 1,099,011 2.2New Jersey 8,711,262 1.4 103,850 2.6 5,177,853 1.5New Mexico 1,889,608 1.9 25,916 3.1 1,044,367 2.0New York 21,092,369 1.2 241,085 2.7 13,094,297 1.5North Carolina 9,958,597 1.7 123,647 2.7 5,236,274 1.6North Dakota 1,176,202 2.1 13,956 3.2 578,708 2.0Ohio 10,651,026 1.6 131,774 2.5 5,847,384 1.6Oklahoma 3,636,632 1.9 42,762 2.6 1,841,441 1.8Oregon 5,276,692 2.2 69,624 3.7 3,150,720 2.2Pennsylvania 11,805,349 1.5 146,127 2.5 6,355,777 1.4Rhode Island 1,130,344 1.9 16,337 3.4 646,015 1.8South Carolina 5,749,804 2.3 72,229 3.3 2,902,970 2.1South Dakota 1,164,228 2.1 15,299 3.4 586,699 2.2Tennessee 7,234,937 2.0 88,568 2.9 3,696,915 1.8Texas 31,654,421 1.8 299,940 2.4 14,187,861 1.5Utah 4,922,109 2.5 61,890 3.9 2,718,608 2.5Vermont 1,247,969 3.7 13,256 4.4 563,631 2.8Virginia 7,993,453 1.5 104,273 2.6 4,492,709 1.4Washington 10,274,679 1.7 113,933 3.3 5,802,181 1.8West Virginia 1,398,432 1.8 18,073 2.7 640,986 1.6Wisconsin 7,783,575 2.3 87,243 3.0 4,182,068 2.1Wyoming 1,246,258 3.4 14,187 5.1 627,761 3.4
Source. U.S. Bureau of Economic Analysis
Table 1. Outdoor Recreation Value Added, Employment, and Compensation as a Percent of Total, 2020
1. Based on state-level data published on bea.gov; GDP estimates were published on October 1, 2021, and compensation and employment estimates were published on September 23, 2021.
TUESDAY, November 9, 2021
Total outdoor recreation activities1
Conventional outdoor recreation
activities Boating / fishing RVing Snow activitiesOther outdoor
recreation activitiesAmusement parks /
water parks
Festivals / sporting events
/ concerts
Game areas (including golf and
tennis)All other supporting outdoor recreation
Government expenditures
United States 374,266,455 140,137,181 30,792,091 19,052,213 4,664,322 62,727,877 6,637,641 8,368,679 15,610,952 147,969,568 23,431,830Alabama 4,228,572 1,722,495 403,883 221,112 7,795 645,504 46,770 18,282 202,867 1,585,611 274,960Alaska 1,573,106 414,978 128,522 81,267 21,352 72,960 7,527 2,746 11,530 963,141 122,028Arizona 7,650,277 2,403,237 406,501 401,809 29,681 1,167,311 82,270 215,560 346,081 3,537,860 541,870Arkansas 2,909,717 1,188,691 281,431 132,403 4,258 368,555 28,215 34,124 108,657 1,182,499 169,971California 44,498,223 14,966,205 2,781,456 1,594,217 450,969 7,843,649 1,188,213 1,232,132 1,768,799 18,399,576 3,288,794Colorado 9,556,036 3,753,894 533,600 388,465 1,156,195 1,285,913 87,657 184,760 291,321 3,586,044 930,185Connecticut 3,297,520 1,411,402 358,779 103,596 41,068 572,081 35,420 30,739 188,574 1,158,308 155,729Delaware 1,140,846 334,147 82,435 37,079 5,015 122,880 12,073 7,294 44,377 640,882 42,937District of Columbia 1,214,706 140,225 33,082 9,752 557 145,250 9,485 85,927 12,417 642,529 286,702Florida 33,181,722 10,455,684 3,819,727 1,171,023 29,391 6,125,413 2,082,089 681,474 1,576,516 14,907,147 1,693,477Georgia 10,802,780 4,387,880 848,106 387,785 33,880 1,807,568 141,840 175,054 490,494 4,150,377 456,955Hawaii 3,160,049 621,481 224,515 23,599 3,366 298,615 21,611 7,119 136,992 2,055,550 184,403Idaho 2,243,621 1,006,271 175,098 197,611 48,681 257,504 23,506 6,033 67,317 856,472 123,374Illinois 13,659,718 4,493,202 816,814 335,357 42,240 2,889,228 202,373 375,476 696,645 5,098,678 1,178,610Indiana 9,845,722 5,873,113 701,448 3,432,889 32,450 1,491,970 70,971 163,285 234,119 2,255,362 225,277Iowa 3,567,939 1,527,407 200,961 393,966 15,585 719,063 33,381 23,387 153,784 1,128,548 192,920Kansas 3,032,363 1,228,482 223,391 92,817 16,018 469,177 28,710 10,200 134,476 1,128,082 206,622Kentucky 4,049,475 1,482,501 280,015 140,044 9,985 637,029 46,428 57,776 128,751 1,678,847 251,098Louisiana 5,507,208 1,993,416 555,255 218,758 36,736 612,831 45,759 139,454 121,733 2,476,285 424,676Maine 2,269,759 892,611 379,403 149,515 46,474 172,765 13,525 8,575 46,208 1,124,653 79,730Maryland 5,511,424 1,992,320 546,803 162,929 33,056 928,301 72,486 146,851 224,248 1,984,463 606,340Massachusetts 7,693,482 2,762,922 874,581 174,365 95,270 1,573,864 82,638 311,874 539,407 3,035,697 320,998Michigan 9,518,574 3,930,420 1,004,327 583,090 69,440 1,701,793 87,436 183,406 406,195 3,390,970 495,392Minnesota 8,405,894 3,412,751 774,559 358,150 127,394 1,586,989 72,245 219,387 397,709 2,571,839 834,315Mississippi 2,641,927 1,060,103 216,685 115,203 14,889 335,795 24,718 4,075 73,616 1,076,045 169,984Missouri 6,451,039 2,699,871 591,001 286,394 10,646 1,196,190 94,155 176,236 278,560 2,179,416 375,562Montana 2,236,881 943,174 288,337 139,070 49,342 365,848 10,960 7,091 66,180 833,756 94,103Nebraska 2,181,596 877,191 134,023 66,902 17,242 398,593 18,619 10,770 115,447 790,318 115,495Nevada 3,976,917 1,223,983 260,673 155,967 45,111 494,806 42,918 55,176 148,342 1,803,123 455,004New Hampshire 2,261,417 1,101,508 204,174 131,168 169,594 298,965 23,877 11,237 91,633 793,621 67,324New Jersey 8,711,262 3,029,268 751,524 234,606 83,970 1,654,005 144,738 336,406 407,270 3,674,336 353,653New Mexico 1,889,608 612,801 100,960 108,436 54,805 178,788 22,475 5,239 52,691 897,548 200,472New York 21,092,369 7,018,577 1,486,404 559,280 135,468 3,744,314 202,412 955,091 799,987 8,875,068 1,454,410North Carolina 9,958,597 3,420,603 807,259 368,854 45,416 1,715,793 129,423 234,721 481,649 4,312,872 509,327North Dakota 1,176,202 450,346 96,126 88,126 5,612 139,369 6,215 2,511 31,648 446,778 139,709Ohio 10,651,026 4,052,503 698,770 680,677 59,281 2,076,348 176,698 286,858 542,245 3,814,626 707,549Oklahoma 3,636,632 1,374,977 260,821 229,294 13,988 513,886 40,984 63,558 132,629 1,524,528 223,241Oregon 5,276,692 2,232,184 441,654 476,511 102,792 760,484 48,440 64,130 190,037 1,847,701 436,323Pennsylvania 11,805,349 4,419,261 712,361 577,002 169,039 2,375,394 148,685 389,378 634,141 4,289,220 721,473Rhode Island 1,130,344 383,413 184,777 24,203 4,028 138,161 9,949 10,150 46,333 553,874 54,897South Carolina 5,749,804 2,506,383 606,127 446,013 13,373 834,299 57,967 29,509 292,635 2,062,029 347,093South Dakota 1,164,228 466,602 83,505 78,020 9,986 143,310 8,866 2,956 33,999 434,608 119,708Tennessee 7,234,937 2,631,358 762,591 324,491 27,318 1,224,165 104,392 193,830 262,928 2,952,004 427,409Texas 31,654,421 12,536,235 2,758,022 1,717,880 199,365 4,899,835 468,337 618,164 1,137,087 12,970,088 1,248,264Utah 4,922,109 2,152,072 391,652 293,499 468,029 804,070 56,573 74,927 269,813 1,580,827 385,140Vermont 1,247,969 505,168 53,364 49,878 191,316 120,599 4,593 4,630 53,757 580,996 41,206Virginia 7,993,453 3,079,275 661,692 259,532 22,074 1,349,915 116,112 162,729 380,183 3,072,419 491,845Washington 10,274,679 4,269,184 916,644 429,603 237,611 1,898,848 77,264 154,859 370,221 3,419,072 687,574West Virginia 1,398,432 476,597 90,072 42,719 13,323 165,787 15,434 4,606 44,951 626,369 129,678Wisconsin 7,783,575 3,768,785 720,837 299,200 51,643 1,296,197 55,190 187,355 321,115 2,468,774 249,819Wyoming 1,246,258 450,023 77,343 78,085 92,204 107,900 5,022 1,572 22,640 550,128 138,206
Source. U.S. Bureau of Economic Analysis
Table 2. Value-Added Outdoor Recreation, by State, Selected Activities, 2020
1.Total outdoor recreation activities includes core activities, supporting activities, and activities with secondary production that are designated as outdoor recreation.
[Thousands of dollars]

TUESDAY, November 9, 2021
Total outdoor recreation industries Private industries Manufacturing Retail trade
Finance, insurance, real estate, rental,
and leasingArts, entertainment,
and recreationAccommodation and
food servicesAll other private
industries GovernmentUnited States 374,266,455 347,236,801 52,828,544 101,856,405 23,290,948 39,516,466 47,324,993 82,419,444 27,029,655
Alabama 4,228,572 3,908,415 453,281 1,496,051 290,970 248,820 521,716 897,577 320,157Alaska 1,573,106 1,245,093 60,990 298,743 124,330 140,799 307,391 312,839 328,013Arizona 7,650,277 7,047,842 411,699 2,296,785 715,763 830,976 1,318,603 1,474,015 602,436Arkansas 2,909,717 2,713,084 479,759 877,149 187,383 145,493 317,327 705,972 196,633California 44,498,223 40,802,322 5,655,815 11,600,889 2,057,508 5,029,460 6,772,803 9,685,847 3,695,901Colorado 9,556,036 8,489,746 486,394 2,297,906 694,130 1,479,006 1,484,344 2,047,966 1,066,290Connecticut 3,297,520 3,116,739 453,064 1,014,018 184,846 387,616 403,725 673,468 180,781Delaware 1,140,846 1,087,392 116,349 376,985 145,119 84,484 215,645 148,812 53,454District of Columbia 1,214,706 899,910 9,524 170,181 22,505 120,628 451,992 125,081 314,797Florida 33,181,722 31,282,915 1,316,476 8,820,278 3,282,533 5,179,467 5,297,501 7,386,659 1,898,807Georgia 10,802,780 10,278,441 1,308,995 3,094,035 487,670 1,093,701 1,368,243 2,925,798 524,339Hawaii 3,160,049 2,939,471 96,563 718,493 164,045 374,554 999,339 586,478 220,577Idaho 2,243,621 2,101,804 282,398 695,506 185,281 176,233 261,783 500,601 141,817Illinois 13,659,718 12,338,742 2,250,955 3,166,389 485,105 1,291,403 1,351,091 3,793,797 1,320,976Indiana 9,845,722 9,579,526 5,334,993 1,677,655 237,932 495,187 548,335 1,285,424 266,196Iowa 3,567,939 3,343,199 833,060 946,838 120,092 211,985 232,590 998,633 224,739Kansas 3,032,363 2,795,704 794,293 810,627 96,166 161,789 231,221 701,608 236,660Kentucky 4,049,475 3,759,757 813,657 1,188,130 182,050 263,254 433,284 879,381 289,718Louisiana 5,507,208 5,016,123 1,375,572 1,433,357 282,048 349,828 507,097 1,068,220 491,085Maine 2,269,759 2,176,415 260,282 571,299 401,093 161,233 463,640 318,868 93,345Maryland 5,511,424 4,833,779 318,458 1,625,548 334,264 616,843 738,004 1,200,661 677,645Massachusetts 7,693,482 7,315,558 1,020,961 1,950,854 540,916 1,055,372 1,114,732 1,632,721 377,924Michigan 9,518,574 8,960,709 1,188,144 3,029,236 1,024,975 902,843 826,465 1,989,044 557,865Minnesota 8,405,894 7,479,433 1,425,707 1,889,957 521,920 776,902 603,106 2,261,840 926,461Mississippi 2,641,927 2,443,803 661,129 784,988 142,115 124,430 222,641 508,499 198,124Missouri 6,451,039 6,028,033 1,209,405 1,865,396 368,339 571,387 635,299 1,378,206 423,006Montana 2,236,881 2,130,006 194,116 517,505 153,353 433,292 339,351 492,391 106,874Nebraska 2,181,596 2,044,857 457,747 552,914 86,956 142,711 178,534 625,994 136,740Nevada 3,976,917 3,469,456 110,228 1,166,446 234,973 482,733 642,250 832,824 507,461New Hampshire 2,261,417 2,173,970 273,113 576,876 271,794 276,322 321,953 453,912 87,447New Jersey 8,711,262 8,298,055 1,097,607 2,472,550 679,814 1,217,965 928,013 1,902,106 413,207New Mexico 1,889,608 1,650,244 131,078 573,768 174,375 110,172 312,391 348,460 239,364New York 21,092,369 19,349,844 1,537,228 6,138,901 1,421,707 2,753,438 3,469,096 4,029,477 1,742,525North Carolina 9,958,597 9,375,661 1,615,130 2,917,735 768,151 989,847 1,165,501 1,919,298 582,936North Dakota 1,176,202 1,018,009 78,698 332,035 55,188 70,261 106,785 375,043 158,193Ohio 10,651,026 9,838,898 1,871,650 3,239,721 371,127 1,028,549 972,673 2,355,178 812,128Oklahoma 3,636,632 3,361,850 482,193 1,161,387 227,971 245,202 322,888 922,209 274,782Oregon 5,276,692 4,786,034 574,889 1,597,835 266,996 468,621 712,240 1,165,450 490,658Pennsylvania 11,805,349 10,958,591 1,646,445 3,293,506 738,210 1,464,971 1,207,839 2,607,619 846,758Rhode Island 1,130,344 1,066,345 106,721 290,173 74,855 137,389 246,536 210,672 63,999South Carolina 5,749,804 5,357,380 885,512 1,629,864 453,098 463,600 868,529 1,056,778 392,424South Dakota 1,164,228 1,028,662 100,636 328,782 63,308 71,937 162,936 301,063 135,566Tennessee 7,234,937 6,764,716 1,104,186 2,023,779 349,793 715,192 1,087,197 1,484,569 470,220Texas 31,654,421 30,219,841 6,989,708 8,569,126 1,309,090 2,768,776 2,774,954 7,808,187 1,434,580Utah 4,922,109 4,480,260 610,180 1,315,036 404,722 596,340 535,834 1,018,150 441,849Vermont 1,247,969 1,195,137 126,639 267,927 214,472 134,591 246,049 205,458 52,832Virginia 7,993,453 7,402,242 743,374 2,342,811 384,555 831,366 1,070,385 2,029,751 591,211Washington 10,274,679 9,446,927 1,312,641 3,401,299 444,434 783,219 928,553 2,576,783 827,752West Virginia 1,398,432 1,252,488 102,487 450,406 138,535 98,010 162,007 301,042 145,945Wisconsin 7,783,575 7,495,393 1,930,974 1,766,887 661,832 832,591 650,720 1,652,388 288,182Wyoming 1,246,258 1,087,982 127,440 231,845 62,541 125,682 283,856 256,619 158,275
Table 3. Value-Added Outdoor Recreation, by State, Selected Industries, 2020[Thousands of dollars]
Source. U.S. Bureau of Economic AnalysisNote. The estimates are based on the 2012 North American Industry Classification System.

TUESDAY, November 9, 2021
Total outdoor recreation industries Private industries Manufacturing Retail trade
Finance, insurance, real estate, rental,
and leasingArts, entertainment,
and recreationAccommodation and
food servicesAll other private
industries GovernmentUnited States 4,324,240 4,050,097 250,326 1,417,246 44,196 846,393 819,933 672,003 274,143
Alabama 55,648 51,906 4,271 21,756 460 7,446 11,398 6,575 3,742Alaska 17,773 16,018 (D) 4,406 151 2,972 4,218 (D) 1,755Arizona 95,183 88,569 2,519 30,854 1,197 17,377 22,713 13,911 6,614Arkansas 37,089 34,423 4,830 12,822 229 4,296 7,217 5,028 2,665California 488,755 458,764 24,706 155,093 3,996 93,140 97,439 84,391 29,990Colorado 120,063 109,691 2,842 32,536 2,466 29,551 24,253 18,044 10,372Connecticut 41,721 39,170 1,627 14,834 545 9,628 7,092 5,443 2,551Delaware 14,347 13,796 384 5,628 131 1,984 4,425 1,245 551District of Columbia 12,809 11,372 (D) 2,601 33 1,398 5,724 (D) 1,438Florida 384,198 370,319 11,762 118,649 4,048 89,843 84,879 61,137 13,879Georgia 131,490 123,703 9,279 43,412 1,235 23,986 25,203 20,587 7,787Hawaii 43,808 41,071 467 11,226 308 7,375 13,483 8,212 2,737Idaho 29,867 28,186 2,123 9,733 381 6,069 5,698 4,184 1,681Illinois 147,565 132,642 8,266 46,243 1,575 25,835 23,737 26,987 14,923Indiana 95,249 91,005 31,137 23,659 635 12,830 12,359 10,385 4,244Iowa 42,877 40,334 5,812 14,762 396 6,935 5,800 6,628 2,543Kansas 35,247 31,767 3,170 12,583 234 5,275 5,599 4,907 3,480Kentucky 46,957 44,466 3,134 17,162 302 8,208 9,298 6,360 2,491Louisiana 55,729 51,978 2,452 20,760 399 7,880 10,039 10,448 3,751Maine 28,368 27,041 2,120 8,464 514 5,430 7,811 2,702 1,327Maryland 69,377 62,611 1,516 23,519 663 14,193 12,567 10,155 6,766Massachusetts 90,606 86,934 4,702 27,771 1,145 20,974 16,741 15,601 3,672Michigan 108,673 103,567 6,291 41,377 1,502 21,955 17,517 14,924 5,106Minnesota 89,331 81,842 7,274 27,761 900 18,114 12,506 15,286 7,489Mississippi 29,375 27,436 2,725 11,900 190 3,426 5,463 3,733 1,939Missouri 79,299 72,688 6,750 27,006 689 14,007 13,231 11,007 6,611Montana 26,169 25,228 730 7,529 268 6,021 6,429 4,250 942Nebraska 26,614 24,915 2,491 8,631 210 4,722 4,099 4,762 1,699Nevada 49,501 45,584 723 16,237 406 9,774 10,714 7,730 3,917New Hampshire 26,583 25,729 1,109 8,274 581 6,691 5,741 3,330 854New Jersey 103,850 97,217 4,472 34,872 1,276 24,774 14,568 17,256 6,633New Mexico 25,916 23,100 400 8,432 302 3,689 6,786 3,490 2,816New York 241,085 225,675 8,135 84,392 2,286 47,344 46,155 37,364 15,409North Carolina 123,647 116,454 7,418 42,612 1,149 25,367 23,678 16,230 7,192North Dakota 13,956 11,904 295 4,809 79 1,970 2,590 2,163 2,052Ohio 131,774 120,290 7,777 44,923 1,613 26,204 21,396 18,377 11,484Oklahoma 42,762 39,848 2,117 16,307 431 6,328 7,426 7,239 2,914Oregon 69,624 64,416 4,776 21,677 556 12,466 13,153 11,789 5,207Pennsylvania 146,127 140,268 8,169 48,207 1,702 36,120 23,285 22,786 5,859Rhode Island 16,337 15,871 704 4,453 178 3,655 4,839 2,043 467South Carolina 72,229 67,625 6,065 23,435 549 13,109 17,022 7,444 4,604South Dakota 15,299 13,713 688 5,003 91 2,339 3,526 2,068 1,586Tennessee 88,568 83,378 6,823 28,455 716 16,634 19,704 11,045 5,191Texas 299,940 284,564 14,327 112,849 3,062 58,098 47,807 48,423 15,376Utah 61,890 55,483 4,004 16,700 925 13,017 10,240 10,597 6,407Vermont 13,256 12,852 593 4,164 270 1,578 4,393 1,854 404Virginia 104,273 94,783 2,897 34,938 870 20,953 19,986 15,138 9,490Washington 113,933 107,523 6,720 36,601 953 22,028 16,171 25,052 6,410West Virginia 18,073 16,551 311 7,006 165 2,681 3,957 2,431 1,522Wisconsin 87,243 83,228 7,985 26,687 1,129 18,580 15,004 13,843 4,014Wyoming 14,187 12,598 199 3,536 104 2,127 4,852 1,779 1,590
Table 4. Employment, Outdoor Recreation, by State, Selected Industries, 2020
Source. U.S. Bureau of Economic Analysis
(D) Data are suppressed to avoid disclosure of confidential information.Note. The estimates are based on the 2012 North American Industry Classification System.

TUESDAY, November 9, 2021
Total outdoor recreation industries Private industries Manufacturing Retail trade
Finance, insurance, real estate, rental,
and leasingArts, entertainment,
and recreationAccommodation and
food servicesAll other private
industries GovernmentUnited States 202,828,339 179,637,066 20,020,280 54,073,795 3,485,085 29,395,217 26,331,947 46,330,742 23,191,273
Alabama 2,116,218 1,857,139 220,850 756,388 30,507 169,923 280,211 399,260 259,079Alaska 981,020 789,378 (D) 175,565 10,101 108,689 168,638 (D) 191,642Arizona 4,445,920 3,925,542 218,056 1,224,731 81,352 670,581 743,494 987,327 520,378Arkansas 1,528,988 1,338,565 235,085 453,804 13,060 120,101 174,227 342,288 190,423California 25,765,580 22,575,424 2,405,488 6,378,570 307,468 3,871,099 3,795,072 5,817,729 3,190,155Colorado 5,673,406 4,913,977 238,044 1,290,327 160,471 1,104,270 854,590 1,266,271 759,429Connecticut 1,862,133 1,672,169 166,735 567,022 73,526 289,806 228,130 346,950 189,964Delaware 548,758 498,598 29,033 200,640 9,187 61,551 122,820 75,368 50,161District of Columbia 750,662 592,899 (D) 108,769 2,479 112,003 272,477 (D) 157,763Florida 17,838,503 16,584,694 616,902 4,665,129 275,331 3,592,008 2,857,747 4,577,579 1,253,809Georgia 6,248,763 5,676,483 654,804 1,590,358 98,795 782,136 708,349 1,842,042 572,280Hawaii 2,107,002 1,898,628 30,338 464,317 17,652 264,131 571,610 550,581 208,374Idaho 1,195,526 1,076,668 138,756 372,916 19,011 147,613 145,617 252,754 118,858Illinois 7,747,245 6,668,700 868,780 1,734,781 182,740 989,709 775,292 2,117,398 1,078,545Indiana 4,799,989 4,517,878 2,275,265 854,607 45,319 392,729 300,123 649,836 282,110Iowa 1,719,445 1,535,056 342,567 514,225 35,718 150,361 132,520 359,666 184,389Kansas 1,451,874 1,241,804 227,740 440,702 20,720 118,427 133,034 301,181 210,069Kentucky 1,952,504 1,763,812 247,380 594,080 17,342 262,280 230,302 412,428 188,692Louisiana 2,504,459 2,178,568 286,526 746,920 26,390 278,536 268,044 572,152 325,891Maine 1,093,840 1,010,515 121,942 306,508 27,776 144,572 268,853 140,864 83,325Maryland 3,364,806 2,712,727 126,397 901,694 59,273 498,479 406,349 720,534 652,079Massachusetts 4,654,922 4,231,635 478,759 1,099,044 115,175 801,541 639,436 1,097,681 423,287Michigan 4,627,965 4,273,387 503,197 1,542,350 106,273 657,068 470,234 994,264 354,578Minnesota 4,322,553 3,789,499 640,959 1,005,493 71,591 593,202 352,929 1,125,325 533,054Mississippi 1,148,407 1,014,325 184,024 403,215 11,526 84,448 117,707 213,406 134,082Missouri 3,486,998 3,091,573 513,384 985,489 47,331 484,363 356,315 704,693 395,424Montana 1,117,116 1,038,048 57,504 280,754 13,983 254,310 198,957 232,541 79,068Nebraska 1,100,167 984,166 198,071 307,213 17,327 105,128 101,477 254,949 116,001Nevada 2,199,335 1,898,581 50,380 625,644 22,799 298,303 347,727 553,727 300,755New Hampshire 1,099,011 1,038,726 111,086 307,101 45,976 182,336 185,240 206,985 60,285New Jersey 5,177,853 4,541,373 398,454 1,359,488 133,503 905,405 498,575 1,245,950 636,480New Mexico 1,044,367 817,154 30,751 309,685 15,170 89,622 185,044 186,881 227,212New York 13,094,297 11,038,553 709,055 3,400,921 211,932 2,030,340 2,055,260 2,631,046 2,055,744North Carolina 5,236,274 4,673,413 487,472 1,535,889 81,125 875,343 629,592 1,063,993 562,861North Dakota 578,708 477,102 26,315 177,904 5,363 51,080 67,548 148,894 101,606Ohio 5,847,384 4,938,227 612,446 1,622,278 166,587 825,971 535,000 1,175,944 909,157Oklahoma 1,841,441 1,630,031 136,173 594,241 32,850 198,154 179,017 489,597 211,409Oregon 3,150,720 2,703,785 320,295 887,591 31,021 370,955 412,289 681,632 446,935Pennsylvania 6,355,777 5,773,695 737,155 1,732,062 139,800 1,081,768 654,967 1,427,943 582,082Rhode Island 646,015 600,590 40,867 169,756 16,474 108,896 146,422 118,173 45,425South Carolina 2,902,970 2,565,376 429,320 845,857 32,043 331,087 469,151 457,918 337,594South Dakota 586,699 493,972 55,333 171,611 5,865 51,716 86,283 123,164 92,727Tennessee 3,696,915 3,318,533 438,092 1,005,908 45,953 530,954 565,136 732,492 378,382Texas 14,187,861 12,867,556 1,260,250 4,310,377 279,677 1,948,936 1,421,484 3,646,833 1,320,305Utah 2,718,608 2,394,282 306,352 656,158 57,300 410,500 297,038 666,933 324,326Vermont 563,631 528,948 49,370 158,404 22,577 43,003 152,723 102,871 34,682Virginia 4,492,709 3,821,505 206,748 1,280,756 69,581 601,548 581,750 1,081,121 671,205Washington 5,802,181 5,143,285 519,742 1,651,306 71,191 655,358 548,345 1,697,343 658,896West Virginia 640,986 557,952 22,923 234,519 10,291 66,895 95,239 128,083 83,034Wisconsin 4,182,068 3,854,961 1,002,670 943,290 83,786 563,591 378,021 883,602 327,108Wyoming 627,761 507,608 26,178 127,441 6,793 64,391 165,545 117,261 120,153
Source. U.S. Bureau of Economic Analysis
Table 5. Compensation, Outdoor Recreation, by State, Selected Industries, 2020[Thousands of dollars]
(D) Data are suppressed to avoid disclosure of confidential information.Note. The estimates are based on the 2012 North American Industry Classification System.