outcomes tool selection committee - humanservices.arkansas.gov · children’s behavioral health...
TRANSCRIPT

Outcomes Tool Selection Committee
May 27, 2015
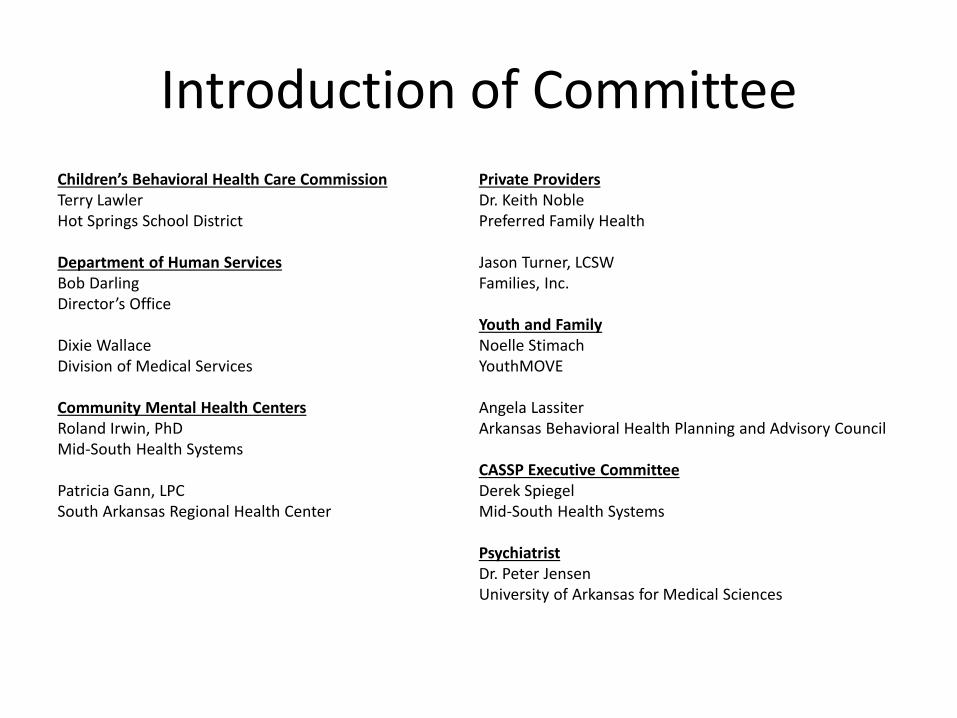
Introduction of Committee
Children’s Behavioral Health Care Commission Terry Lawler Hot Springs School District Department of Human Services Bob Darling Director’s Office Dixie Wallace Division of Medical Services Community Mental Health Centers Roland Irwin, PhD Mid-South Health Systems Patricia Gann, LPC South Arkansas Regional Health Center
Private Providers Dr. Keith Noble Preferred Family Health Jason Turner, LCSW Families, Inc. Youth and Family Noelle Stimach YouthMOVE Angela Lassiter Arkansas Behavioral Health Planning and Advisory Council CASSP Executive Committee Derek Spiegel Mid-South Health Systems Psychiatrist Dr. Peter Jensen University of Arkansas for Medical Sciences

Prepared by:
Elizabeth Childers, Ph.D., MPH
3

4
There are 3 age-specific Y-OQ®s:
Age 4-17 uses the (Y-OQ® 2.0*) which consists of 64 items (Parent) and is completed by the parent or caregiver.
Age 12-18 uses (Y-OQ® 2.0-SR*) which consists of 64 items (Youth - Self) and is completed by the youth.
Age 18-21 uses (OQ®-45.2.2) which consists of 45 items (Adult -Self) and is completed by the young adult.
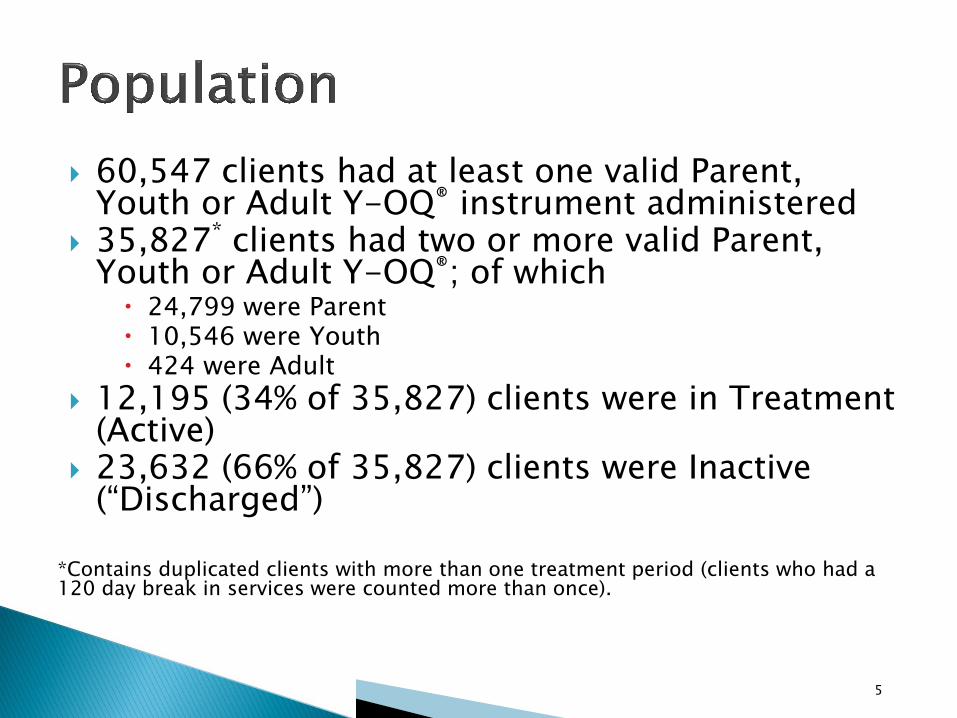
60,547 clients had at least one valid Parent, Youth or Adult Y-OQ® instrument administered
35,827* clients had two or more valid Parent, Youth or Adult Y-OQ®; of which
24,799 were Parent 10,546 were Youth 424 were Adult
12,195 (34% of 35,827) clients were in Treatment (Active)
23,632 (66% of 35,827) clients were Inactive (“Discharged”)
*Contains duplicated clients with more than one treatment period (clients who had a 120 day break in services were counted more than once).
5

Recovered
Improved
Stable
Deteriorated
6

7
N= 35,827

66.65
63.92
58.92
55.63
50
55
60
65
70
Active Inactive
Y-OQ® First and Last Score by Active
and Inactive Clients (Combined)
First Current Score
Last Current Score
The mean Last Current Score compared to the mean First Current Score is significantly lower for both Active and Inactive clients; lower scores indicate fewer problems
8
N= 35,827

9
N= 24,799
Y-OQ® 2.01 Youth Outcome Measure (Ages 4-17)
64 Items

68.8
65.99
61.61
58.07
50
55
60
65
70
Active Inactive
Y-OQ® First and Last Score by Active
and Inactive Clients (Parent )
First Current Score
Last Current Score
10
N= 24,799

11
N= 10,546
Y-OQ® 2.0 SR Youth Outcome Measure (Ages 12 -18)
64 Items

66.77 59.81
51.48 50.41
0
20
40
60
80
Active Inactive
Y-OQ® First and Last Score by Active
and Inactive Clients (Youth )
First Current Score
Last Current Score
12
N= 10,546

13
N= 482
OQ®-45.2.2 Adult Outcome Measure (Ages 18- 21)
45 Items

57.77
54.78
53
53.5
54
54.5
55
55.5
56
56.5
57
57.5
58
Overall First Current Score Overall Last Current Score
Overall First and Last Current Score
(Adult )
Similar to Parent and Youth YOQ, Adult YOQ also showed overall score improvement between first and last scores
14
N= 482

Outcomes were analyzed for clients with valid Parent, Youth, and Adult (and combined) Y-OQ®s Separate analyses were performed on the Parent, Youth, Adult Y-OQ®s, and the Combined group
In all groups the rate of stable outcome was significantly higher than any of the other outcome categories
Recovered rate was the highest among Youth Y-OQ®
Adult Y-OQ® had the highest rate of stable client outcome
Inactive Client outcomes were better in general compared to the Active clients
15
CY 2014 Medicaid Claims Data
16
8
3
5
1
7
1
3
2
8
1
1
2
2
2
4
6
7
7
4
8
5
4
2
6
8
4
2
6
4
3
9
8
2
2
5
11
1
30 (2)
2
8
4
1
5
8
1
1
2
3
6
5
3
4
4
2
1
1
3
4
2
3
2
4
4
1
3
4
3
1
(1)
1(1)
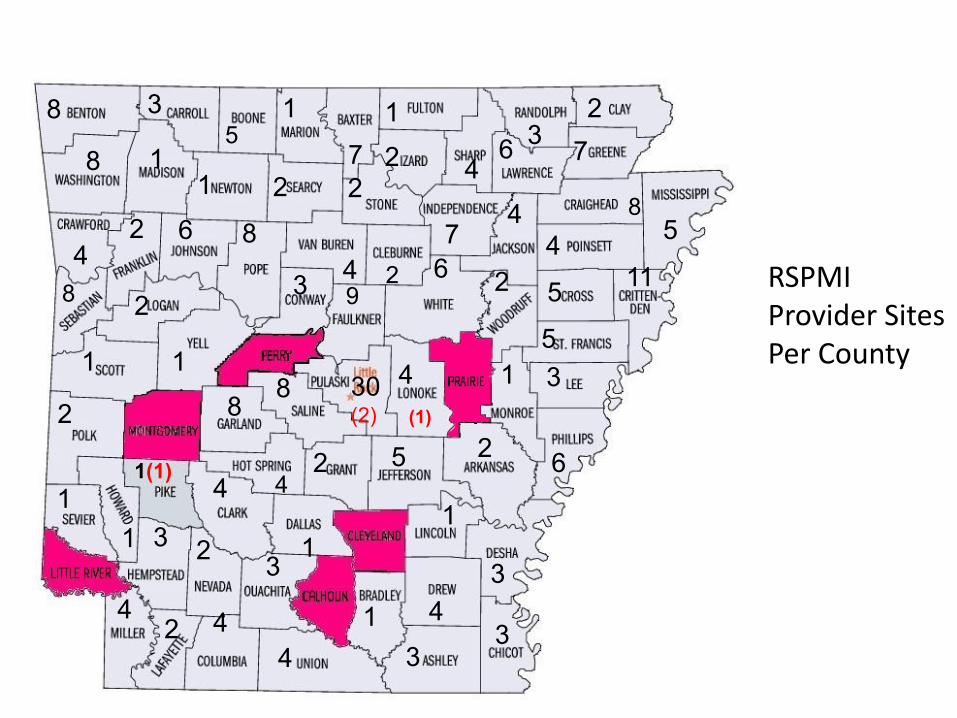
RSPMI Provider Sites Per County

There were 4,384,163 paid Medicaid claims billed by RSPMI providers.
106,146 unique individuals were served.
18

50,020 people used between 1 and 10 services.
31,978 people used between 11 and 50 services.
24,148 people used more than 50 services.
19

0-5 = 12,420 (338,678 claims)
6-10 = 24,425 (1,240,669 claims)
11-13 = 13,541 (624,504 claims)
14-17 = 17,647 (635,370 claims)
18+ = 38,113 (1,544,942 claims)
20

21

RSPMI covers wide population ◦ Age range
◦ Specialty population
◦ Service location
◦ Intensity of service
OQ Measures separate database ◦ Inability to determine beginning of treatment
◦ Inability to determine discharge
◦ Complexities involved in sorting by population
22
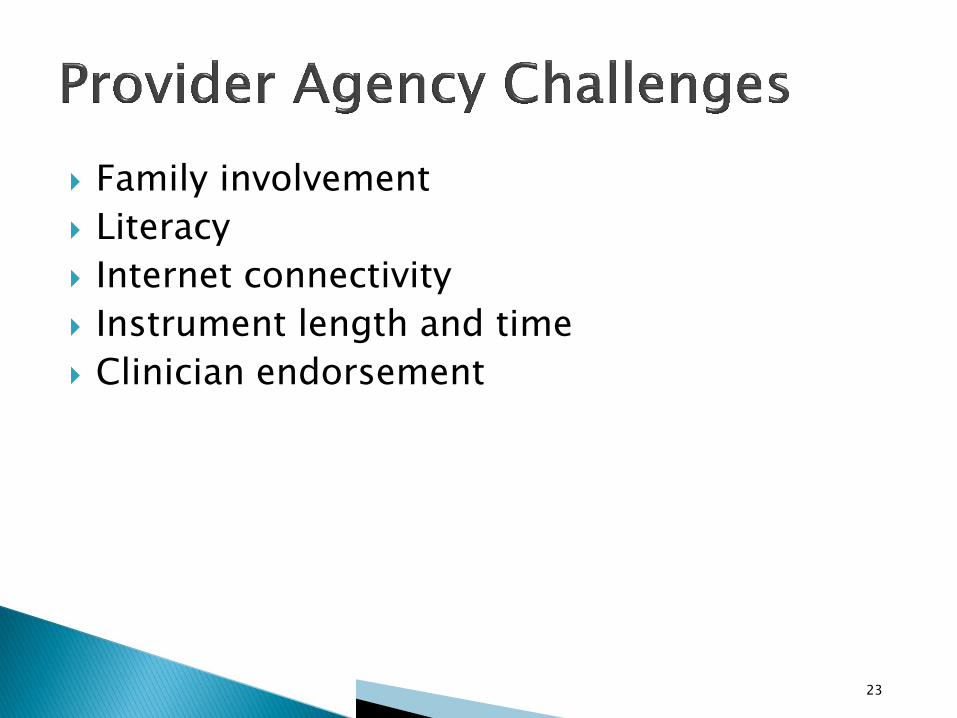
Family involvement
Literacy
Internet connectivity
Instrument length and time
Clinician endorsement
23

Presentation and use by agency staff
Repetitive questions
Instrument time
24

25

Frequency: Every 2 weeks (more frequently, if needed)
Location: Will be confirmed at least a week in advance of meeting
Teleconference / Video Conference: DBHS is looking into the availability of utilizing this to reduce travel time for committee members and the public
26
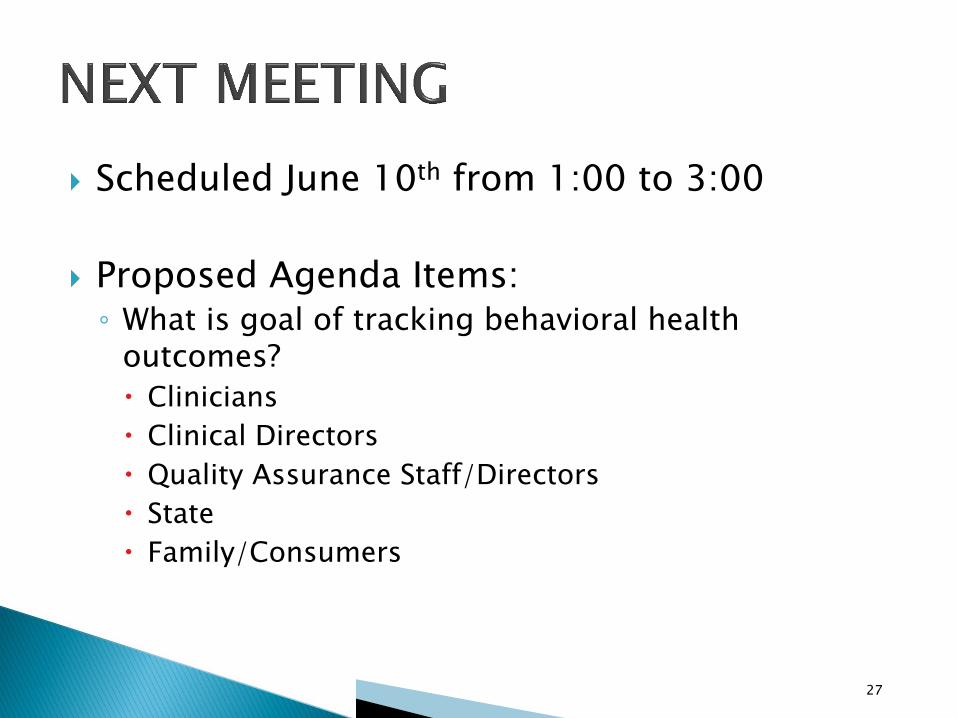
Scheduled June 10th from 1:00 to 3:00
Proposed Agenda Items: ◦ What is goal of tracking behavioral health
outcomes?
Clinicians
Clinical Directors
Quality Assurance Staff/Directors
State
Family/Consumers
27