outcomes of workplace training in essentials skills ...€¦ · outcomes of workplace training in...
TRANSCRIPT

Outcomes of Workplace Training in Essentials Skills – Results for New
Brunswick
Results from the Collaborative Project between Norway and Canada-New Brunswick
January 2015

Table of Contents
Page
1 Introduction 1
2 Data and methodology 2
2.1 Data and sample 2
2.1.1 The WES questionnaires 2
2.1.2 Objective assessment of prose, document and quantitative literacy 2
2.1.3 Sample 4
2.2 Methodology 4
3 Overview of New Brunswick WES training program and participating firms 5
3.1 Overview of the WES program 5
3.2 Brief description of participating firms and of the training provided 6
3.2.1 Ganong Bros. Ltd 6
3.2.2 Moosehead Breweries Limited 7
3.2.3 Home Hardware 8
4 Profile of participants 9
5 Skills and ability of participants before training 11
5.1 Self-assessed skills 11
5.2 Self-assessed abilities to perform tasks 12
5.3 Frequency of doing various tasks 13
6 Proficiency levels in prose, document and quantitative literacy 15
7 Association between self-assessed skills and PDQ proficiency levels 17
7.1 Skills in numeracy and reading and literacy proficiency levels 17
7.2 Literacy proficiency levels of participating by self-assessed skills 19
8 Outcomes of training 21
8.1 Effects of training on self-assessed skills 21
8.2 Effects of training on ability to perform tasks 22
8.3 Effects of training on how often do they do various tasks 22
8.4 Effects of training on self-assessed skills by PDQ proficiency level 25
i

9 Participants’ retrospective assessment of their skills
27
Concluding remarks 28
References 29
Appendix A : Tables A.1 and A.2 30
ii

1. Introduction
Lifelong learning is considered a key element of a knowledge-based economy. It goes beyond
the preparation of young people for formal education and recognizes the value of citizens
acquiring and updating their skills throughout their lives. Essential skills such as literacy have far
reaching effects and serve as a basis to the economic and social well-being of individuals. For
instance, high literacy skills are associated with positive labour market outcomes and help
individuals nurture a culture of learning.
In recognition of the strong employment-related needs in literacy and other essential skills, the
Government of New Brunswick has put in place the Workplace Essential Skills (WES) training
program for its citizens. Skills for which training is offered include reading, writing, numeracy,
computer use and communication. The WES program was designed to offer an alternative
pathway (i.e. an opportunity for training outside of the secondary and postsecondary systems) for
low-skilled adults to gain the skills they need to meet the rapidly changing demands of the labour
market. The WES training program is not only vital in addressing the literacy challenges that the
workforce of the province faces, but also in fostering a stronger culture of continuous learning.
The primary objective of this report is to examine whether workplace training, through the WES
program, had any positive impact on the skills and learning behaviour of participants. Findings
could be used to identify best practices, to build awareness of the different delivery methods, and
to facilitate improvements in essential skills training.
The report is structured as follows: section 2 describes the data and methodology; section 3
highlights the New Brunswick’s WES training program objectives; section 4 presents
characteristics of the participants; Section 5 presents the self-assessed skills of participants;
Section 6 presents their PDQ proficiency levels; section 7 examines the association between self-
assessed and the objective assessment of literacy skills (i.e. the Prose, Document and
Quantitative Literacy (PDQ) proficiency levels); Section 8 shows the outcomes of training for
participants, which essentially are the comparison between their self-assessment skills before and
1
after training. Section 9 contrasts participants’ skills before and after training with the
retrospective assessment of their skills before training. The report ends with some concluding
remarks in section 10.
2. Data and methodology
The analysis is based on two data sources: 1) the two questionnaires completed by individuals
who participated in the WES training program; and 2) their literacy results, which were assessed
through the PDQ test.
2.1 Data and sample
2.1.1 The WES questionnaires
Workers who participated in the training completed two questionnaires: one self-assessment
questionnaire at the start of the training; and another one at the end of the training period. They
were asked to rate their own reading, writing, numeracy, computer and oral communication
skills, and were also asked to assess their ability and confidence in doing various tasks and how
often they do those various tasks. Furthermore, they were asked to re-assess retrospectively their
skills in reading, writing, numeracy, computer and oral communication skills before the training
took place. In this post-assessment, they were also asked to give one specific example of how
the essential skill training has impacted their ability to do various tasks and their attitude towards
learning as an adult.
2.1.2 Objective assessment of prose, document and quantitative literacy
The three domains of literacy1 (prose, document and quantitative) were assessed using the PDQ
test. The test was developed by Education and Training Services (ETS) following the definitions
1 Literacy is using printed and written information to function in society, to achieve one’s goals, and to develop one’s knowledge and potential (Statistics Canada, HRSDC 2005).
2

of literacy used in the International Adult Literacy Survey (IALS) 19942. The three domains of
literacy are defined as follows:
Prose
Prose literacy measures how well an individual understands and uses information found in
newspapers, magazines, novels, brochures, manuals or flyers. Most adults use prose literacy to
answer questions, to learn how to do something or for entertainment.
Document
Document literacy measures how well an individual finds and uses information in forms,
schedules, charts, graphs and other tables of information. Most adults use document literacy to
find information they need or want or to give information to someone else.
Quantitative
Quantitative literacy measures how well an individual can use numeracy found in ads, forms,
flyers, articles or other printed materials. Quantitative literacy is a little different from prose and
document literacy because in addition to using a text to identify needed information, an
individual also has to add, subtract, multiply, divide or do other math to get the information the
individual needs. It measures numeracy skills to some extent although it is not as comprehensive
as the way numeracy is assessed in current large-scale survey such as the 2012 Programme for
the International Assessment of Adult Competencies or the 2003 Adult Literacy and Lifeskills
Survey.
Scores are provided in five-point increments, from 0 to 500, and proficiency levels: Level 1,
Level 2 or Level 3 or above, for each literacy scale (prose, document or quantitative). In this
2 The scores from the PDQ test can be interpreted on the same scale as the International Adult Literacy and LifeSkills Survey (ALL) 2003.
3

report, proficiency levels will be used. Levels have been used to facilitate the interpretation of
the scores and indicate generally the level at which an individual can use information as defined
in prose, document and quantitative literacy. Level 1 and Level 3 or above representing the
lowest and highest skill level, respectively.
2.1.3 Sample
As shown in Table 1, there were 71 participants, all employed, distributed into three firms that
participated in the WES program. While all participants completed the initial self-assessment
questionnaire (i.e. the self-assessment before training), three participants were not able to
complete the PDQ test due to disabilities. Out of the 68 participants who completed the PDQ
tests, a total of 55 participants completed the self-assessment after training (including the
retrospective self-assessment). The analysis on the effects of workplace training on skills (see
Section 8) is based on this sample of 55 participants. All other analyses use the sample of 68
participants who completed the PDQ.
Table 1: The number of participants
Firms
Self-assessment
before training
PDQ
assessment
Self-assessment after
training and in
retrospective
Ganong Bros Ltd 15 14 12
Home Hardware Stores Ltd 38 36 35
Moosehead Breweries Ltd 18 18 8
Total 71 68 55
2.3 Methodology
Analyses in this report are descriptive and based on a quantitative analysis of the two data
sources presented above. The general objective of the report is to examine whether training in
literacy, through the WES program, has any positive impact on skills of workers who
participated in the training. Specifically, it focuses on the following two questions: 4
1) What were the skills, from both their self-assessment and the objective assessment, of
participants before training took place?
2) What were the outcomes of training? That is, did participants rate their skills differently after
they went through the training in essential skills?
The first question is addressed by looking at participants’ self-assessed skills and ability to
perform tasks as well as their assessed prose, document and quantitative literacy skills. The
association between the self-assessment and the direct assessment is also examined, which to
some extent corroborates the validity of the self-assessment. The second question is answered
through a comparison of self-assessed skills before and after training and through a retrospective
assessment of their pre-training skills. The latter might provide a better assessment of their
‘actual skill levels’ before the training took place. Results of the data analysis are expected to
inform on participants’ learning outcomes and behaviour, which could in turn provide valuable
information to facilitate improvements in essentials skills training.
3. Overview of the New Brunswick’s WES training program and
participating firms
This section presents an overview of the WES Program and of the training offered by the three
firms that participated in the program.
3.1 Overview of the WES program
The Workplace Essential Skills (WES) Program targets employers and employees in both the
public and private sectors, regardless of size, or sector. It is aimed at helping adults who are
employed or seeking employment and requiring additional essential skills to succeed. It is also
available to employers who are experiencing skilled workforce shortages and in need of
5

recruitment support. Courses are offered in both official languages free of charge for adult
residents of New Brunswick.
The WES Program has been put in place by the New Brunswick Department of Post-Secondary
Education, Training and Labour (PETL), which provides leadership and expertise to help carry
the WES program forward. It is managed by seven regional offices. Furthermore, the WES
training program focus on the specific tasks associated with either an individual’s current job or
desired occupation, or those apprentices who have experienced difficulties with taking
certification exams.
The PETL provides an initial Training Needs Assessment3 prior entry into the program, which
identifies the essential skills required in the specific workplace. Based on the results of the
initial assessment of skill needs, training is customized to respond to the specific needs of
workplaces and employees (including apprentices).4 The WES training ends with participants’
evaluation of training impacts. Some recommendations for future learning opportunities are also
usually made.5
3.2 Brief description of participating firms and of the training provided
Data come from three firms that participated in this WES initiative: Ganong Bros. Limited,
Moosehead Breweries Limited and Home Hardware.
3.2.1 Ganong Bros. Ltd
The Ganong Bros. Ltd is a proactive firm that has a strong interest in creating a learning culture
in their workplace. It is committed to their employees and has a “promote from within” strategy
for the Production Supervisor positions.
3 Participants are assessed in the nine essential skills prior to entry into the program: Reading, document use, writing, numeracy, oral communication, working with others, thinking skills, computer use and continuous learning. 4 Essential Skills Assessment, Block tests or Red Seal Certification exams. 5 For more detailed information, see http://app.infoaa.7700.gnb.ca/gnb/Pub/EServices/ListServiceDetails.asp?ServiceID1=200971&ReportType1=ALL.
6
The training took place from December 14th, 2012 to May 21st, 2013. Learners attended one 4
hour class per week for a total of 84 hours. In order to respond to the skills need of its workforce,
the Ganong Bros. Ltd Company offered a variety of training opportunities, including (but not
necessarily limited to):
• Document use - to facilitate appropriate use of several production documents introduced over
the past couple of years aimed at increasing productivity and maintaining certification;
• Oral communication, thinking, and working with others - to improve leadership skills and
enable supervisors to better motivate and engage their employees;
• Computer use - to ensure supervisors have the digital skills needed to use tablets to enter data
electronically into the main company network.
3.2.2 Moosehead Breweries Limited
Moosehead Breweries modernized its manufacturing equipment resulting in changes to job
descriptions and job tasks. As a result of this modernization, the company needed skilled
workforce not only to run, but also to enable the troubleshooting of issues on their own in a
computerized environment. To meet this demand, the company provided its workforce with
following essential skills training:
• Computer use - to enable staff to use the new equipment which is significantly more
technologically advanced than their current equipment;
• Document use - to enable staff to follow a computer screen for instruction on how to
troubleshoot any issues that may arise on the manufacturing line;
• Thinking - to ensure employees can analyze and interpret information/instructions and make
minor adjustments as needed.
The training took place from May 8th to August 30th, 2012. Learners attended one 2.5 hour
class per week for a total of 60 hours.
7

3.2.3 Home Hardware
In order to respond to the training needs of its workforce, Home Hardware offered a range of
Hardware, Construction and Renovation materials as well as home decoration products related
training courses. The training took place from September 24, 2012 to June 28, 2013. Learners
attended one 2.5 hour class per week for a total of 60 hours.
It should be noted that results reflect only those for individuals among the three firms that
participated in the WES program. Two firms are from the manufacturing sector: Ganong Bros.
Ltd, and Moosehead Breweries; and one is from the “Retail Trade and Wholesale” sector: Home
Hardware. Results should neither be considered as representative of the New Brunswick
“manufacturing” sector, nor the “Retail Trade and Wholesale” sector.
8
4. Profile of participants
Table 2 shows the distribution of participants across firms and their socio-demographic
characteristics. Because of the small number of participants, and because they are not part of a
random sample of the New Brunswick population or labour force, their characteristics might
differ from the Census-based or large-scale survey-based population of New Brunswick. Hence,
these descriptive statistics have to be used with caution and cannot be generalized to the
workforce of New Brunswick.
Table 2 shows that the majority of participants (52.9%) worked at Home Hardware, while the
remaining participants were distributed between the Ganong Bros Ltd and Moosehead Breweries
- 20.6% and 26.5%, respectively. When compared to their counterparts, there were larger shares
of men, core-age workers (36 to 55 years old) and participants with high school as their highest
educational attainment. It also shows that the large majority of participants perceived that their
health condition was either good, very good or excellent (95.6% in total), and that most of them
were born in Canada (86.8%).
When they were asked what was the “first language they learned at home in childhood and still
understand”, roughly half (52.9%) of them said English and slightly less than half (45.6%) said
French, which reflect the bilingual nature of the province of New Brunswick.
9

Table 2: Proportion of participants across firms and selected demographic
characteristics
Per cent
Firm
Ganong Bros. Ltd 20.6
Home Hardware 52.9
Moosehead Breweries 26.5
Gender
Male 58.8
Female 41.2
Age group
16-35 23.5
36-55 66.2
56+ 10.3
Highest level of educational attainment
Less than HS 19.1
HS completion 47.1
Post-secondary education 33.8
Health status
Excellent/very good 66.2
Good 29.4
Fair/poor 4.4
Country of birth
Canadian-born 86.8
Abroad 13.2
First learned language at home in childhood and still
understand
English 52.9
French 45.6
Other 1.5
10

5. Self-assessed skills of participants before training
5.1 Self-assessed skills
Participants were asked to assess their skills in reading, numeracy, writing, computer/technology
and communication on the bases of five categories – “unable, poor, fair, good and very good”.
Because of small sample size, responses are aggregated into three categories– “Unable/poor, fair
and good/very good”.
As illustrated in Figure 1, participants reported having higher skills in numeracy and reading and
lower skills in computer/technology and communication. The proportion of participants who
reported having “good/very good” skills is 66.2% in numeracy and reading, 50% in writing and
below 50% in computer/technology and communication. Note that a quarter of participants
reported having “unable/poor” skills in communication. This is a much higher proportion than
what was reported for other skills.
11

Table 3 shows the proportion of participants who reported having “good/very good” skills in the
five competencies across firms.6 As shown in Figure 1, results indicate that participants in the
three firms reported having higher reading and numeracy skills and lower computer/technology
and communication skills. However, proportions vary in magnitude across firms, which is not
surprising given the different tasks that may be required of employees within each firm, as well
as the different skill sets that might be required to perform these tasks.
Table 3 – Proportion (in %) of participants with good or very good skills,
by participating firm
Moosehead Breweries Home Hardware Ganong Bros
Numeracy 83.3 58.3 64.3
Writing 61.1 41.7 57.1
Reading 61.1 61.1 85.7
Computer/technology 44.4 44.4 64.3
Communication 27.8 52.9 42.9
5.2 Self-assessed abilities to perform various tasks
Before training, WES learners were asked to assess their ability and confidence7 to perform the
following tasks: doing calculations, reading brief or large documents, working with what you
read, writing short messages and using technology.
Table 4 shows that the majority of participants reported “good/very good” ability to perform
these tasks, with the exception of reading large documents. Actually, over three quarters of
WES learners (77.9%) ranked their ability to read brief documents, such as notes, emails and
memos as “good/very good”, whereas 37.9% of them assessed their ability to read large
documents, including reports or manuals, as “fair”. Note that a large number of participants
6 Because the number of participants is small in each firm, especially in Ganong Bros. Ltd and Moosehead Breweries, only the proportion of participants who reported having good or very good skills is shown. 7 Results for self-assessed confidence in performing various tasks are very similar to those for self-assessed ability in doing tasks. Hence, results are not shown.
12

(26.3%) assessed their ability to use technology as “unable/poor”, which could reflect that the
use of technology is not necessarily or always required in the work participants did.
Table 4: Participants’ pre-training self-assessment of their ability in
performing various tasks
Various activities
Per cent
Unable/poor Fair Good/very good
Doing calculations 12.3 30.8 56.9
Reading brief documents 2.9 19.1 77.9
Reading large documents 16.7 45.5 37.9
Working with what you read 6.2 32.3 61.5
Writing short messages 9.1 30.3 60.6
Using technology 26.3 14.0 59.6
5.3 Frequency of doing various tasks
Participants were also asked to assess how frequently they perform various activities related to
literacy, such as reading emails, books, doing conversions (working with numbers), and using
internet or social media. The frequency of using these activities is presented in Table 5.8 In
terms of activities related to reading, the majority of participants read emails or the internet often
or regularly, and only a third of them read books often or regularly. In terms of activities more
closely related to quantitative literacy, a large proportion (43.8%) never or rarely do conversions
of numbers (e.g. metric-imperial conversion).
8 Table A.1 in the Appendix presents frequency of use for additional activities. 13

Table 5: Participants’ pre-training self-assessment of their frequency in doing various tasks
Various activities
Per cent
Never/Rarely
Little Regular/Often
Reading emails 26.6 18.8 54.7
Reading internet 15.4 21.5 63.1
Reading books 30.2 38.1 31.7
Conversions (working involving numbers) 43.8 26.6 29.7
Surfing the internet 19.4 17.9 62.7
Using social media 44.8 14.9 40.3
14

6. Proficiency levels in prose, document and quantitative literacy
This section examines participants’ skills in prose, document and quantitative literacy. As
mentioned in Section 2, these skills were assessed objectively through the PDQ test. Skill scores
are presented in terms of proficiency levels: Level 1, Level 2, and Level 3 or above. Level 1
corresponds to a low skill level, Level 2 to a low-intermediate skill level and Level 3 or above
corresponds to an intermediate or advanced skill level.
Figure 2 shows that the majority of participants are at Level 3 or above in the three domains of
literacy. Skills are greater in quantitative literacy than in prose or document literacy, as the
proportion of participants at Level 3 or above is the highest and the proportion of participants at
Level 1 is the lowest. Participants display very similar skills in prose and document literacy.
Figure 3 show that the proportions of participants at Level 3 or above vary across firms. Using
the proportion of participants at Level 3 or above as a benchmark, participants from Moosehead
Breweries and Ganong Bros. Ltd businesses, the two manufacturing firms, had greater skills
before training than those in Home Hardware.
15

16

7. Association between self-assessed skills and literacy proficiency levels
7.1 Skills in numeracy and reading and literacy proficiency levels
Participants were asked to assess their ability with numeracy and reading. These two “skills”
measure concepts that are similar to the assessed skills in prose, document and quantitative
literacy. Numeracy is related to quantitative literacy while reading is closely related to prose and
document literacy. Although not directly comparable, a look at the association between skills in
numeracy and reading and PDQ skills indicate to some extent the degree of consistency between
the level of skills reported by individuals and their actual skills as measured by the PDQ test.
Figures 4a and 4b contrast the proportion of participants who reported high skills in numeracy
with the proportion of participants at Level 3 or above in quantitative literacy, and the proportion
of participants who reported high skills in reading and prose with the proportion of participants at
Level 3 or above in document literacy, respectively.9 Both figures indicate that the majority of
participants have high skills, based on both the self-assessment and the direct measurement of
literacy skills. The direct assessment of quantitative literacy also indicates that participants may
have greater skills than what they perceive when dealing with numbers (based on their self-
assessment). Inversely, participants may have lower skills than what they perceive when
comparing skills in prose and document literacy to self-assessed reading. However the difference
is small.
9 High skills corresponds to reporting “good/very good” skills in numeracy or reading in the pre-training self-assessment and being at Level 3 or above in the direct assessment of literacy (prose, document or quantitative).
17
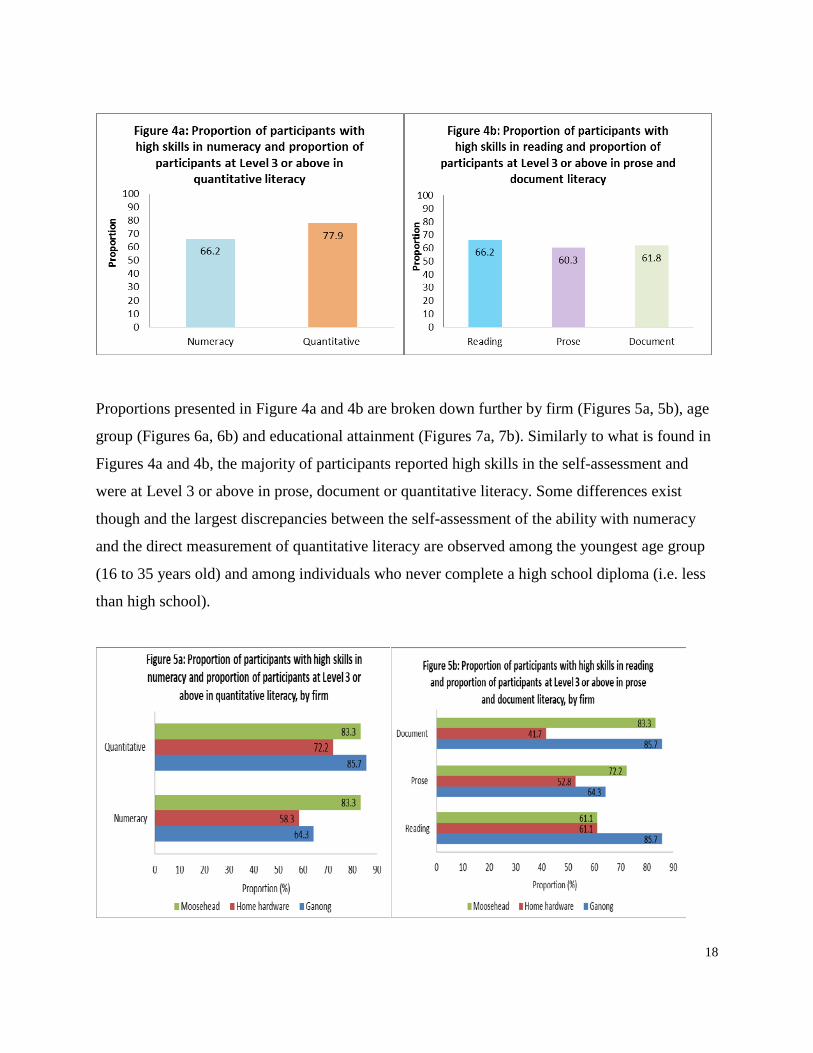
Proportions presented in Figure 4a and 4b are broken down further by firm (Figures 5a, 5b), age
group (Figures 6a, 6b) and educational attainment (Figures 7a, 7b). Similarly to what is found in
Figures 4a and 4b, the majority of participants reported high skills in the self-assessment and
were at Level 3 or above in prose, document or quantitative literacy. Some differences exist
though and the largest discrepancies between the self-assessment of the ability with numeracy
and the direct measurement of quantitative literacy are observed among the youngest age group
(16 to 35 years old) and among individuals who never complete a high school diploma (i.e. less
than high school).
18

7.2 Literacy proficiency levels of participants by self-assessed skills
Generally, findings above indicate a positive association between the two forms of skills
assessments - the self-assessment and the PDQ proficiency levels. Taking the analysis a step
further, Figures 8, 9a and 9b examine literacy proficiency levels among participants who
reported having “good/very good” or “unable/fair/poor” ability in numeracy and reading. Results
show that the proportion of participants at Levels 3 or above (Level 1) in literacy is higher
(lower) among participants who reported the highest ability in numeracy and reading, which is
further evidence of this positive relationship between self-assessed skills and the objective
measurement of literacy. This is particularly true for quantitative skills and numeracy.
19

20
8. Outcomes of training
This section examines the effects of training on learning outcomes, which are self-assessed skills
and ability to perform various tasks. The analysis in this section is based on the 55 participants
who completed the self-assessment of their skills both before and after the training took place. It
is expected that participants would report an improvement of their skills after the training.
Specifically, the section looks at the three following outcomes of training:
1) What is the difference between self-assessed skills of participants before and after training?
2) What is the difference between self-assessed ability of participants in performing various
tasks before and after training?
3) Is there any difference in how often various tasks are done by participants before and after
training?
8.1 Effect of training on self-assessed skills
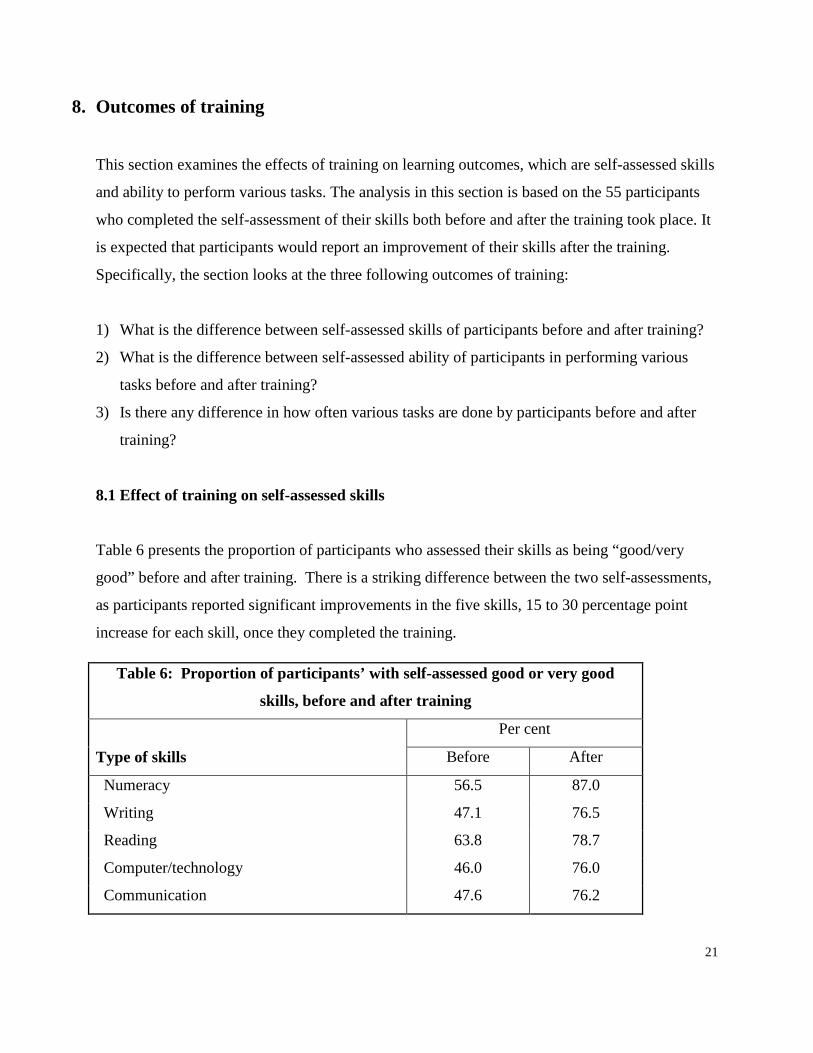
Table 6 presents the proportion of participants who assessed their skills as being “good/very
good” before and after training. There is a striking difference between the two self-assessments,
as participants reported significant improvements in the five skills, 15 to 30 percentage point
increase for each skill, once they completed the training.
Table 6: Proportion of participants’ with self-assessed good or very good
skills, before and after training
Type of skills
Per cent
Before After
Numeracy 56.5 87.0
Writing 47.1 76.5
Reading 63.8 78.7
Computer/technology 46.0 76.0
Communication 47.6 76.2
21

8.2 Effect of training on self-assessed ability to perform tasks
Large differences, 15 to 30 percentage point increases, are also observed between self-assessed
ability in performing various tasks before and after training (see Figure 10). Actually, more than
three-quarters of participants reported ‘good or very good’ ability in performing tasks related to
calculations, reading and writing after training.
8.3 Effects of training on how often do they do various tasks
The next series of figures, Figure 11 to 15, examines how training influenced the extent to which
participants performed various tasks related to reading, document, working with numbers,
writing and using technology. In other words, did the training change positively the frequency at
which they perform these tasks? Results show there were much larger proportions of participants
who reported doing these various tasks “often or regularly” after training than before training,
which may in turn have positive effects on the development of individuals’ ability and essential
skills now and in the future.
22

Reading activities
Using documents
23
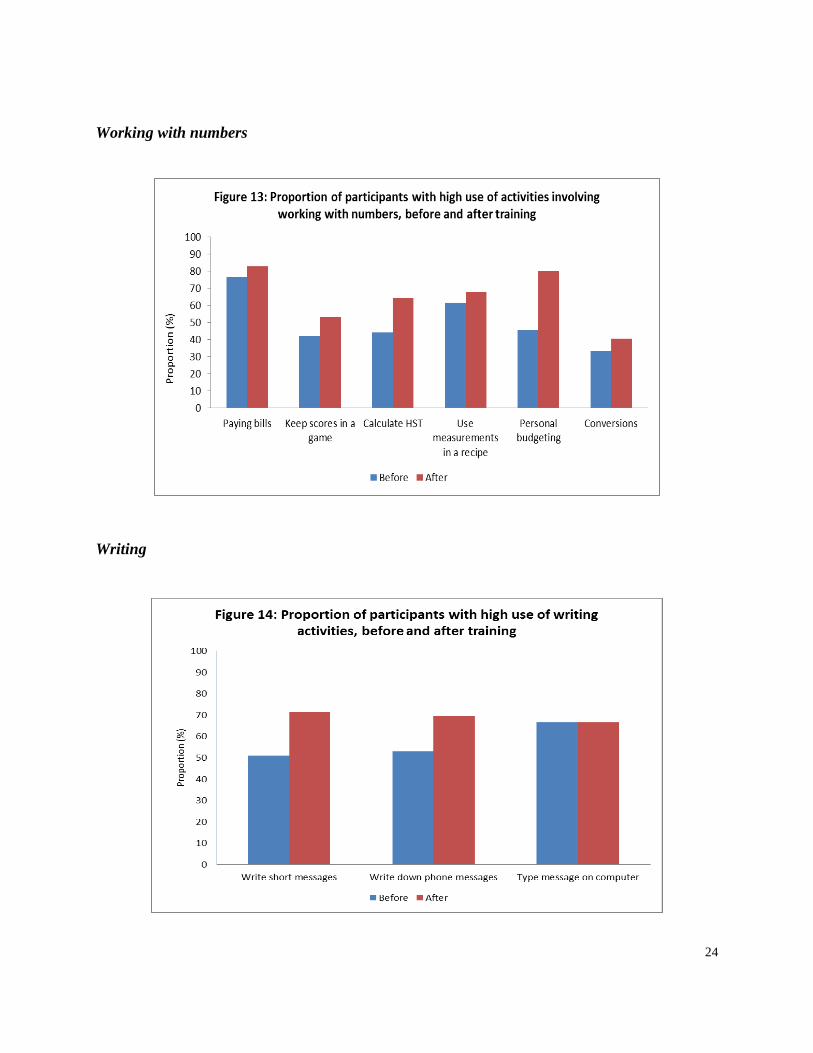
Working with numbers
Writing
24
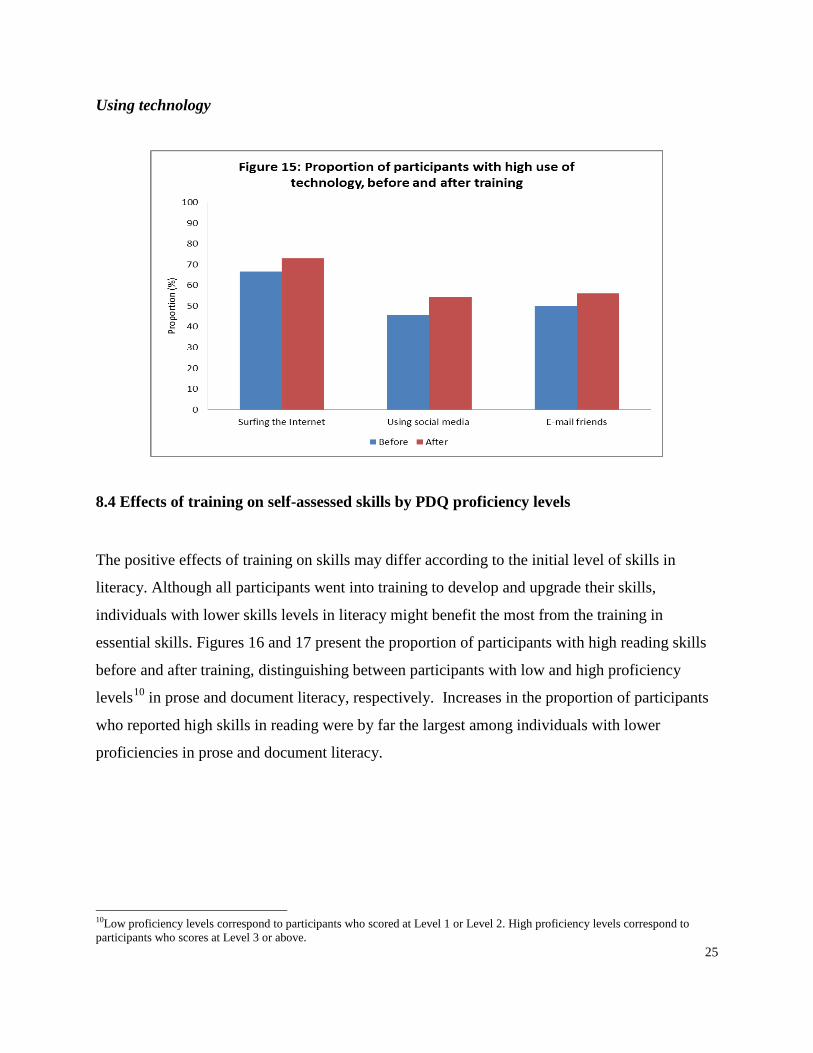
Using technology
8.4 Effects of training on self-assessed skills by PDQ proficiency levels
The positive effects of training on skills may differ according to the initial level of skills in
literacy. Although all participants went into training to develop and upgrade their skills,
individuals with lower skills levels in literacy might benefit the most from the training in
essential skills. Figures 16 and 17 present the proportion of participants with high reading skills
before and after training, distinguishing between participants with low and high proficiency
levels10 in prose and document literacy, respectively. Increases in the proportion of participants
who reported high skills in reading were by far the largest among individuals with lower
proficiencies in prose and document literacy.
10Low proficiency levels correspond to participants who scored at Level 1 or Level 2. High proficiency levels correspond to participants who scores at Level 3 or above.
25

Figure 18 presents the proportion of participants with high numeracy skills before and after
training, distinguishing between participants with low and high proficiency levels in quantitative
literacy. Similar to results from Figures 16 and 17, the proportion of participants with lower
skills in quantitative literacy who also reported high skills with numeracy saw the largest
increase after training (more than doubled). In contrast, the proportion of participants with higher
skills in quantitative literacy who also reported high skills with numeracy slightly decrease after
the training took place.
26

9. Participants’ retrospective assessment of their skills
As part of the WES program, participants were also provided the opportunity to rate their skills
retrospectively. Thus, knowing what they know about the main topics or knowledge and skills
covered in the training they took, participants rated for a second time what their skills were
before training. Because the training provided participants additional information about what
they did not know, it was expected that participants in retrospective would rate their skills before
training at a lower level than at the initial self-assessment. Results from Figure 19 show that the
proportion of participants who reported with ‘good or very good’ skills in retrospect is smaller
for all skills than in the initial self-assessment, with the exception of numeracy. These findings
are in line with what was expected. Usually, individuals are more critical of their skills after the
training took place or after they upgraded their skills.
27

Concluding remarks
The general objective of this report was to examine the impact of training on skills of workers
who participated in the WES training program. Results indicate that training had positive and
significant effects on self-assessed skills. That is, the proportion of participants who reported
‘good or very good’ skills (i.e. skills in numeracy, writing, reading, use of computer and
technology, and communication) was much larger, between 15 to 30 percentage points, after the
training took place than what was reported before training. Effects of training were also positive
on the self-reported ability to perform tasks related to essential skills and on how often they do
these various tasks. Another key result is that training had a larger impact for workers with
lower “assessed” prose, document and quantitative literacy skills than for workers with higher
skills. Hence, the program appears to positively impact workers who need it the most.
A limitation of the analyses is the fact that the impact of training could only be examined for
skills as they were assessed by a small number of workers. It was not possible to examine the
impact on prose, document and quantitative literacy skills, which are objective measures of
essential skills, because they were assessed once and before the training took place. Because of
the subjective nature of the self-assessment, the results on the effects of training could be biased.
However, a look at the association between the self-assessment of skills in numeracy with
quantitative literacy, and between the self-assessment in reading with prose and document
literacy, shows that the two measures are positively correlated. This finding suggests that results
from subjective measures are reliable in this report.
28
References
Government of New Brunswick. Workplace Essential Skills Program (WES) Post-Secondary Education, Training and Labour. http://app.infoaa.7700.gnb.ca/gnb/Pub/EServices/ListServiceDetails.asp?ServiceID1=200971&ReportType1=ALL
Government of New Brunswick (Be... in this place. Être... ici on le peut) : “Workplace Essential Skills: Train today for tomorrow’s opportunities”. http://www2.gnb.ca/content/dam/gnb/Departments/petl-epft/PDF/Publications/workplace-essential-skills.pdf
Holliman, Kim and Christie, Patrick (2011): "Workplace Essential Skills Training for the Employed and Employable", New Brunswick Post-Secondary Education, Training and Labour & New Brunswick Community College, Can nexus 2011.
Statistics Canada. 2005. Building on Our Competencies: Canadian Results of the International Adult Literacy and Skills Survey, Catalogue no. 89-617-XWE, Statistics Canada. www5.statcan.gc.ca/bsolc/olc-cel/olccel?catno=89-617-X&lang=eng.
Test Content for PDQ Profile Series. https://www.ets.org/literacy/about/content/pdq_profile_content
29

Table A.1: Use of various tasks, self-assessed by participants
Various reading materials
Per cent
Never/Rarely Little
Regular/Often
Reading Emails 26.6 18.8 54.7 Internet 15.4 21.5 63.1 Books 30.2 38.1 31.7 Newspapers 17.9 40.3 41.8 Workplace Documents/materials 16.7 27.3 56.1 Directions in a recipe 23.9 32.8 43.3
Using documents Instructions 12.1 37.9 50.0 Flyers/Ads/Signs 13.6 28.8 57.6 Schedules 16.7 28.8 54.5
Working with numbers Paying bills 7.5 14.9 77.6 Keep score 28.4 32.8 38.8 Use measurements 27.9 17.6 54.4 Calculate HST 30.3 25.8 43.9 Personal budgeting 22.1 29.4 48.5 Conversions 43.8 26.6 29.7
Write Short messages 22.1 32.4 45.6 Type a message on a computer 26.5 14.7 58.8
Use technology Using internet 19.4 17.9 62.7 Using social media 44.8 14.9 40.3 E-mailing friends and family 38.8 17.9 43.3
30

Table A.2: Proportion of participants reporting high use* of various activities
Various activities
Participating firms (Per cent)
Ganong Home
Hardware Moosehead Reading Emails 40.0 40.0 20.0 Internet 26.8 43.9 29.3 Books 10.0 55.0 35.0 Newspapers 21.4 46.4 32.1 Workplace Documents 29.7 51.4 18.9 Directions in a recipe 27.6 58.6 13.8 Using documents Instructions 30.3 51.5 18.2 Flyers 21.1 52.6 26.3 Schedules 16.7 50.0 33.3 Activities involving numbers Paying bills 21.2 50 28.8 Keep score 23.1 57.7 19.2 Use measurements 21.6 64.9 13.5 Calculate HST 24.1 51.7 24.1 Personal budgeting 21.2 51.5 27.3 Conversions 31.6 57.9 10.5 Writing Short messages 32.3 48.4 19.4 Type a message on a computer 35.0 50.0 15.0 Using technology Internet 23.8 50 26.2 Social media 29.6 55.6 14.8 E-mailing friends and family 34.5 51.7 13.8
*High is use is defined as participants reporting doing these various activities regularly or often.
31