outcome monitoring - animal pests - doc
TRANSCRIPT

SCIENCE & RESEARCH INTERNAL REPORT 170
Outcome monitoring – animal pests
Workshop proceedings
Edited by S.M. Frimmel and S.J. Turner Northern Regional Office
Department of Conservation Hamilton, New Zealand
Proceedings of a workshop on outcome monitoring convened by the Northern Regional Office, Department of Conservation, Hamilton, 1- 3 June 1999. Published by Department of Conservation P.O. Box 10-420 Wellington, New Zealand

Science & Research Internal Reports are written by DOC staff on matters which are ongoing within the Department. They include reports on conferences, workshops, study tours and also work in progress. Internal reports are not normally subject to peer review. © Copyright December 1999, Department of Conservation ISSN 0114-2798 ISBN 0-478-21882-6

Contents Forward ix Introduction to the workshop Keith Broome
1. What’s the point of all of this? 1 2. Why monitor outcomes? 2 3. Case study: Tawarau goat control 2 4. Workshop discussion/feedback 3
Outcomes: That’s what it’s all about Joseph Arand
1. Introduction 5 2. Decision-making framework 5 3. Draft proposal 6 4. Issues 7 5. Work programme 7 6. Final comments 8 7. References 8 8. Workshop discussion/feedback 8
PART 1. GENERAL PRESENTATIONS Forest health assessment for reporting conservation performance Rob Allen
1. Background 13 2. Discussion paper 15 3. References 16
Monitoring sika deer impacts in beech forest vegetation Sean Husheer
1. Introduction 17 2. Study outline 17 3. References 21 4. Workshop discussion/feedback 21
Draft procedure for aerial foliar browse monitoring Bill Fleury, Astrid Dijkgraaf and Paul Prip
1. Background 23 2. Proposed methodology 24 3. Field trials 27 4. Comments on foliar browse index scoring 29 5. Costs and comparisons 31 6. Statistical requirements 32 7. Summary tables 33 8. Conclusions 35 9. References 35

10. Workshop discussion feedback 36
Using permanent plots and exclosures to assess animal impacts Cathy Allan
1. Introduction 37 2. Measuring permanent plots 38 3. Animal impacts 38 4. What can be shown with an existing and an expanded network of plots? 39 5. Points to note 41 6. Into the future 42 7. References 42 8. Papers in preparation 42 9. Workshop discussion/feedback 42
Monitoring threatened plants as ecological indicators Nick Singers
1. Introduction 43 2. Methods 43 3. Case studies 43 4. Conclusions 59 5. References 50 6. Workshop discussion/feedback 50
Outcome monitoring for weeds Chris Buddenhagen
1. Background 51 2. Overcoming resistance 51 3. Outcome monitoring 52 4. Context for experimental work 53 5. Conclusion 53 6. Workshop discussion/feedback 53
Ecosystem monitoring at Waipapa: Where we’re at Hazel Speed
1. Introduction 55 2. Objective 55 3. Rat and possum control and monitoring in Waipapa 56 4. Indicator species monitoring 56 5. Conclusions 60 6. Acknowledgements 61 7. References 61 8. Reports in preparation 62 9. Workshop discussion/feedback 62
How the Mooloo team interprets foliar browse results Pete Corson
1. Introduction 63 2. What has been happening 64

3. Where the data is heading 65 4. When to control possums again 66 5. Workshop discussion/feedback 67
Sample size for foliar browse scoring
Mike Ogle
1. Introduction 69 2. Variation in data 70 3. Sample size 71 4. Case study: Waiomu/Te Puru 72 5. Discussion 73 6. References 73 7. Workshop discussion/feedback 74
Improving information transfer between research providers and users
Phil Knightbridge
1. Introduction 75 2. Is there a need to improve? 75 3. Currently used methods of information transfer 76 4. Case studies: Information transfer from research providers to users 76 5. Some possible ways to improve information transfer 78 6. Conclusions 79 7. Acknowledgments 79 8. References 80 9. Workshop 80
The involvement of volunteers in the Tongariro/Taupo Conservancy monitoring programmes Steve Deverell
1. Introduction 81 2. DOC conservation volunteer programme 81 3. Who are our volunteers? 82 4. Why use volunteers? 82 5. Level of accuracy required/achieved 83 6. Effective investment of staff resources 84 7. Options for monitoring staff requirements 85 8. References 86
The hows, wheres and whats of outcome monitoring Kate McNutt
1. Completing the information circle 87 2. Workshop discussion/feedback 89
Gap/non-gap monitoring: focusing on the forest Bruce Burns
1. Introduction 91 2. Background 91 3. 5 x 5 m plots 92

4. Monitoring plant populations 92 5. Case studies 92 6. Workshop 94
PART 2. CONSERVANCY PRESENTATIONS Northland Conservancy
1. Summary of pest control operations and outcome monitoring 97 2. Overview of outcome monitoring 98 3. Workshop discussion/feedback 101
Auckland Conservancy 1. Summary of pest control operations and outcome monitoring 103 2. Workshop discussion/feedback 103 Waikato Conservancy 1. Summary of pest control operations and outcome monitoring 105 2. Overview of outcome monitoring 105 Bay of Plenty Conservancy 1. Summary of pest control operations and outcome monitoring 113 2. Overview of outcome monitoring 117 3. References 120 4. Workshop discussion/feedback 120 Tongariro/Taupo Conservancy 1. Summary of pest control operations and outcome monitoring 121 2. Overview of outcome monitoring 126 3. References 137 4. Workshop discussion/feedback 138 East Coast/Hawkes Bay Conservancy 1. Summary of pest control operations and outcome monitoring 139 2. Overview of outcome monitoring 143 3. References 147 4. Workshop discussion/feedback 148 Wanganui 1. Summary of pest control operations and outcome monitoring 149 2. Overview of outcome monitoring 152 Wellington Conservancy 1. Summary of pest control operations and outcome monitoring 153 2. Overview of outcome monitoring 157 3. References 159 4. Workshop discussion/feedback 159

Nelson/Marlborough Conservancy 1. Summary of pest control operations and outcome monitoring 161 2. Overview of outcome monitoring 167 3. References 179 Canterbury Conservancy 1. Summary of pest control operations and outcome monitoring 181 2. Overview of outcome monitoring 181 3. References 186 Otago Conservancy 1. Summary of pest operations and outcome monitoring 187 2. Overview of outcome monitoring 187 West Coast (Tai Poutini) Conservancy 1. Summary of pest control operations and outcome monitoring 193 2. Overview of outcome monitoring 196 3. References 199 4. Workshop discussion/feedback 200 Southland Conservancy 1. Summary of pest control operations and outcome monitoring 201 2. Overview of outcome monitoring 205 3. References 208 PART 3. WORKSHOP DISCUSSION GROUPS Summary of Discussion Group Feedback 1. General discussion 211 2. Actions required 215 APPENDICES 1. Outcome Monitoring Workshop Animal Pests: Agenda and Participants 219 2. Analysis of participant questionnaire 223 3. Conservancy pest control operations and outcome monitoring summaries 227

Foreword Monitoring in the Department of Conservation is defined by Joseph Arand and Theo Stephens (1998) as the “... measurement of the change that occurred after the action".1 Outcome monitoring is defined as “…the measurement of change of the characteristic of interest of a heritage asset. This type of monitoring provides information about whether outcome targets have been achieved”. In June 1999, DOC staff met over 3 days at Pirongia Forest near Hamilton. The goal of this Northern Regional Office sponsored workshop was to advance outcome monitoring as an integral part of ecological management programmes (in particular pest control) undertaken within the Department. The objectives were: To provide a clear understanding of the need for outcome monitoring and how
outcome monitoring contributes to quality conservation management. To identify current practice and options available for outcome monitoring within the
Department. To identify issues, problems and opportunities, and what should be done to improve
and develop methods, skills, resources and management support, thereby improving the quality of outcome monitoring.
The intended outcomes were: Shared information and the exchange of ideas among staff involved in outcome
monitoring (especially pest management staff). A strengthened network of people involved in outcome monitoring throughout the
Department. These Proceedings provide a permanent record of the papers presented at the workshop and the resulting discussions. Information supplied by Conservancy participants provide a valuable 'snapshot' of the current status of outcome monitoring associated with animal pest management operations within the Department. At the end of the workshop we were able to make a number of recommendations and identify actions that will improve outcome monitoring and the Department's biodiversity conservation management as a consequence. This workshop represents a key step forward in the Strategic Business Plan's intent to have "better programmes for monitoring and reporting on the ecosystems, species, sites and facilities we manage and measuring our effectiveness".2
1Arand, J.; Stephens, T. 1998. Measuring projects: Definitions, and guidelines. Second Edition. Department of Conservation. 2Department of Conservation. 1998. Restoring the dawn chorus - Department of Conservation strategic business plan 1998-2002.


1
Introduction to the workshop Keith Broome Northern Regional Office, Department of Conservation PO Box 112, Hamilton 1. WHAT'S THE POINT OF ALL THIS? What is the point of having a workshop on outcome monitoring? Bringing people together from all over the country starts to cost serious money. If you cost out people's time and add overheads we reach around $85,000for this workshop. To put this into perspective though, our annual spending on animal pest control is around $29 million, so 0.3% of that on a workshop I hope you will agree is not over the top. So, what do we want to achieve here? Put simply, the goal for the workshop is to advance the cause of outcome monitoring and in order to meet that goal you will need to:
1. Understand the need for outcome monitoring. 2. Identify current practice 3. Identify issues, problems and opportunities
If we have not achieved the first objective for you by the end of today, we have failed. If collectively we can not satisfy the second and third objectives by the end of the workshop, then this gathering, while not a complete failure, will not be value for money in my opinion. The key to success is your participation. Collectively you people hold the answers to many of the issues, provided you share information, share the same goals, and work together. Our role, at Regional and Head Office level, is to understand your issues (effectively you are our customers), help you sort out the goals and provide the systems and science you need to operate effectively. In summary then, the point of this workshop is to get us all on the same wavelength; share our strengths; and organise how we are going to work on our weaknesses.

2
2. WHY MONITOR OUTCOMES? 2.1 Quality management Most of you will have probably by now that the Department is committed to quality management. Its 'Framework for Quality' specifies the need to design, run, continuously review and improve our programmes. If you apply this to animal pest management you start to get an idea of where outcome monitoring fits in. Notice the words 'monitoring' and 'review' mentioned in the continuous improvement circle (Figure 1). On a typical pest control operation you will recognise the need to plan the work before doing it; keep records of what you did and monitor the outcome or 'what happened'. Following this you should use the information to review what went well and what could be done better next time. It is critical that information coming out of the review is put to use in planning the next operation. Outcome monitoring information is to this process which is aimed at stating clearly what conservation benefits we want to achieve, and measuring whether or not we have achieved them. Another important use for this information is in reporting to Government and the public, the outcomes of pest control. Until we do this effectively, we'll have problems convincing the community that the risks with pest control are outweighed by the benefits. 2.2 Key steps to improving Set and monitor objectives. Did we achieve?
Communicate results. Does the boss know the real story?
Keep good records. What did we do? What was the cost?
Review. How can we improve?
3. CASE STUDY: TAWARAU GOAT CONTROL Objective To ensure the following species regenerate and persist within the browse range of goats as an indication of forest health: hangehange, pate, mahoe. Results Hunting began in 1992. By 1995, 3400 goats had been removed
Outcome monitoring was continued annually. Understorey improvement was
evident. Hunting frequency was reduced in 1995 from annual to every two to three years.
The resources saved were moved to increase effort in the Coromandel block which
was showing no recovery.

3
This simple example illustrates how outcome monitoring information can be used. By setting ourselves measurable objectives in the first place, then getting out and measuring them, we were able to influence the goat control programme and redirect the hunting effort to where it was needed more. In the next few days there will no doubt he lots of talk about scientific design and statistics to improve the quality of our monitoring information. I have nothing against this and I agree that this case study information is pretty basic. However it does illustrate my point that even the most basic form of outcome monitoring information is preferable to none at all. 4. WORKSHOP DISCUSSION/FEEDBACK Reporting of outcome results Next reporting year outcome results will he reported on in work plans and will be included in reports to Government. Status at present We are good at planning operations and very good at doing them, but not so good at recording the resulting information and passing it on. Level of information required It depends on the audience. At times photos will suffice, but some audiences will require more detailed information and good backup data will always be necessary.

4

5
Outcomes: that's what it's all about Joseph Arand Conservation Policy Division, Department of Conservation PO Box 10 420, Wellington 1. INTRODUCTION The following is a brief overview of some of the work being done to develop an overall decision-making framework for the Department. This is relevant because it demonstrates that 'outcomes' are something that the Department is attempting to focus on at every level of conservation management planning, not just for on-the-ground operations. 2. DECISION-MAKING FRAMEWORK 2.1 Background The Strategic Business Plan (SBP) identifies a need for increased integration of priority setting between functional areas. This reflects a long-standing concern that while the Department was generally able to prioritise within functional areas, it was not able to establish relative priorities across all its business. It was this concern that led Theo Stephens and Peter Lawless to begin developing an integrated priority setting system for biodiversity decisions. This work is being used as the basis for ongoing work on priority setting systems. Central Policy Division (CPD) was given the task of overseeing the development of the system. At an early stage of this work, it became clear that the design of the system would be affected by its function: i.e. the decisions it was prioritising. The General Management Team (GMT) therefore agreed that the first task to be completed was the development of a decision-making framework. 2.2 Responsibility for the work CPD is responsible for the overall project; Paula Warren is the project manager.
Science Technology and Information Services (STIS) provides technical support
Theo Stephens Science and Research (S&R) is developing priority setting systems.
Adi Brown from the Biodiversity Recovery Unit (BRU) is working on an improved
threatened species classification system. Discussion with the Business Management Division (BMD are ongoing to ensure
integration with the business planning system, in addition to targeted consultation, workshops and regular progress reports to GMT.

6
3. DRAFT PROPOSAL 3.1 Outcome and place focus It is proposed that decision-making would be focused on outcomes at places rather than on types of actions. The key product of the process would be 'outcome pictures' for the overall business of the Department and for each place. Places Imagine a jigsaw covering the entire area of New Zealand (out to the 200 mile Exclusive Economic Zone). Each piece in the jigsaw is a place. The pieces will be of different shapes and sizes. Each place needs to have a 'natural' identity. The boundaries will have to make sense. Relevant factors might include: geology and catchments, ecology, social identity, iwi boundaries, administrative boundaries and accessibility. From a data management perspective, it would be sensible to have less than ten places per Area Office. Outcome pictures An outcome picture is a statement of what a place would be like. They would be a general statement rather than being very detailed. Four types of outcome picture have been proposed:
1. Mandated national outcome pictures (i.e. the Crown's goals): based on legislation and other formal policy documents, and maybe other guidance as well.
2. Priority national outcome pictures: the priority outcomes to achieve within New Zealand over a specified time period.
3. Ideal place outcome pictures: outcomes at a place that collectively provide for all of the mandated outcomes.
4. Priority place outcome pictures: the priority outcomes to achieve at a place over a specified time period.
3.2 Process The core decision-making process would be: Define the mandated national outcome pictures which the Department is
responsible for achieving. Develop national outcome that will be the priority over a given period. Define the 'places' that will be the focus for decision-making. Develop a multi-year statement of ideal and priority place outcome pictures for each
place that collectively provide for all of the mandated outcomes. Design actions to achieve priority place outcomes (including 'holding' actions for
places that do not receive funding for the desirable outcomes, to prevent unacceptable loss of opportunities to achieve the desirable outcomes in the future).
Timetable the actions to generate annual work programmes and business plans. Implement the actions.
Monitor to inform future decisions

7
3.3 Monitoring Once outcome pictures and actions are determined, a monitoring programme to provide information for future decisions should be established. This should be in accordance with the publication 'Measuring conservation management projects: Definitions, principles and guidelines' (Department of Conservation 1998) and incorporate auditing, result monitoring, outcome monitoring and surveillance monitoring. 3.4 Business planning and work planning The multi-year outcome pictures and associated actions will provide a clear basis for annual work planning and budgeting processes. Business planning should become a simpler, almost mechanical process to ensure that the available resources are assigned to the highest priority actions. 4. ISSUES National mandated outcome pictures and national priority outcome pictures have been drafted. Some of the questions that have arisen include (there are a lot more): Should mandated outcomes be based on more than just legislation and formally
published Government policies, e.g. general ecological theory and the thinking that has come out of the Biodiversity Strategy process (Department of Conservation/Ministry for the Environment 1998)? Should they be linked explicitly to particular source documents?
Should the mandated outcomes and the national outcome pictures be binding? What about national outcome pictures?
To what degree should national outcome pictures be realistically achievable by the Department alone? Should the mandates include outcomes will be produced primarily by other parties (e.g. Ministry for the Environment in the case of water, Ministry of Fisheries in the case of marine ecosystems)?
Should there be an outcome relating to the involvement of the public (including iwi) in decision-making?
Is border control (which we will be calling 'biosecurity' instead) an outcome?
Is a single framework of places feasible? Or do we need different frameworks for different mandated national outcomes?
5. WORK PROGRAMME The current proposed work programme is: By the end of July 1999 Develop mandated national outcome pictures and priority national outcome pictures. These have been drafted, but are still subject to significant work within CPD. They have been provided to three reasons:

8
1. To give them a better idea of the way the project is shaping up.
2. To help them consider the proposed framework.
3. So they can redirect us if we are going in the wrong direction altogether.
Develop the methodology for generating place outcome pictures.
Continue development of the priority setting system. By June 2000
Finalise the overall Decision-Making Framework
Link with the review of the SBP.
Test the methodology for place outcome pictures.
Incorporate outcome statements within the business planning system.
Link national outcome pictures with the development of strategic and outcome-based performance measures.
Develop a new threatened species classification system.
Continue development of the priority setting system. 2000/2001 and beyond
Describe and rank multi-year outcomes for sites.
Phased introduction of the priority setting system 6. FINAL COMMENTS That is what going on in Head Office in relation to the Decision-Making Framework. I hope you can see that there is strong desire to identify outcomes and to clarify the desired outcomes on the ground. I emphasise that this work is nowhere near finalised. 7. REFERENCES Department of Conservation. 1998. Measuring management projects: Definitions, principles and guidelines. Department of Conservation/Ministry for the Environment. 1998. New Zealand’d Biodiversity to turn the tide (a draft strategy for public consultation). 8. WORKSHOP DISCUSSION/FEEDBACK 'Measuring conservation management projects: definitions, principles and guidelines' publication A request for information. Please provide feedback to Joseph: Does the publication need to he reprinted? Do Conservancies require more of the
booklets? If so, how many are needed? Do Conservancies have any spare copies?

9
Do the guidelines, as an overall strategic direction for the Department (as opposed to technical detail about measuring), need revision?
Links between the proposed Decision-Making Framework and existing systems If this proposal is accepted then the various Conservation Management Strategy documents and other national strategies would be used to help define national outcomes and action priorities. Outcomes will be specified for 'places', and 'ideal' outcomes will require information from Area Office staff. Links to the work on priority setting systems The system that Theo Stephens is working on would he used to help set the priority outcomes and actions if this proposed Decision-Making Framework is implemented. Links to reporting system It should make it easier and more explicit. It will be easier to clarify why certain management/financial decisions have been taken and the implication of such decisions. Examples of outcome pictures At this stage only mandated and priority outcomes have been drafted at the national level. An example of a mandated outcome (Crown goal) might be 'A network of protected areas that represents the full range of New Zealand's natural and historic heritage has been established'. Ideals, priorities and practicalities There are many variables yet to he decided. Amongst other things, there has discussion about whether the framework should cover only those outcomes that are practically achievable or include those that are 'ideal' as well. Ideally the process will help to ensure that opportunities are not lost to achieve outcomes at some stage in the future. For example, there may he a lot of local support for a track somewhere. It can not be done now, but steps should be taken to ensure that other actions do not prevent it happening at some stage in the future. Changing Government policies and mandated national outcomes The effect of changing Government policies will depend in part upon the sources we draw on to establish Crown goals. If we limit the sources to legislation only, then other more variable policies will have less effect on the Crown goals. However, it will have to be an evolving process; it would, for example, need to adapt to New Zealand's participation in new international environmental agreements. Boundaries of places There are several options for defining places: administrative, ecological areas or the new Research Environmental Domains. The framework of places needs to he administration boundaries may need to be altered to fit it.

10

11
Part 1. General presentations

12

13
Forest health assessment for reporting conservation performance Rob Allen Landcare Research PO Box 69, Lincoln 1. BACKGROUND In a general sense the Department of Conservation's need for reporting on conservation management is expressed through its mission statement:
"To conserve New Zealand's natural and historic heritage for all to enjoy now and in the future".
To make this possible there is a need to upgrade the quality of information about our natural heritage for appropriate conservation management. This need is also recognised in the recently published draft 'New Zealand's Biodiversity Strategy' (Department of Conservation/Ministry for the Environment 1998) which calls for methods to monitor biodiversity using consistent measures and methods to provide information on key changes in extent and condition. At the recent Manaaki Whenua conference (April 1999), Hugh Logan, Director General of the Department of Conservation, flagged the need for improved data on conservation assets. This need is also expressed in Paragraph (a) and (b) of Article 7 of the Convention on Biological Diversity (CBD) which calls for identification and monitoring of biodiversity important to conservation and sustainable use. There are more specific purposes for the Department collecting information relevant to its decision-making process indigenous forests: Evaluating conservation performance Since the fundamental conservation objective is to maintain our natural heritage assets, the proximate measure of conservation performance is the status of the asset base. The status of the asset base is influenced by human-related impacts for which, in some instances, there is no specific management action. Examples of human-related impacts include the influence of increasing CO2 in the atmosphere, wildfire, invasion of new weeds, and introduced ungulate impacts. It must be remembered that indigenous forests are continually changing due to natural processes and any assessment of status should be judged against the forests that would he present at the current point in time rather than what they were in the past. For example, extensive dieback n southern Fiordland coastal forest is attributed to storms, these areas have subsequently regenerated in coastal scrub species. It is these scrub communities that are being impacted by invading possums, and the former forest communities do not provide a useful baseline to gauge their impact.

14
Evaluating conservation achievement Assessment of the status of conservation assets with and without management to reduce human-related impacts can be used to determine what is being achieved from some components of conservation expenditure. This is a difficult, but critically important, area. For example, the long history of experimental manipulations to develop relationships between introduced animal densities and the status of forest communities have shown that it can be a challenging exercise to show benefits to long-lived tree species populations from animal control operations. Not all conservation expenditure can be judged in this way, for example, the gains from fire restrictions in protecting forests would not be bench-marked against areas without fire controls. In addition, although not part of the Department's decision-making process, information is also required for:
Reporting on assets. International, national and regional reporting requirements broaden the scope of natural heritage information required by the Department and other agencies. From a departmental perspective, as the lead agency on the 'New Zealand’s Biodiversity Strategy' (Department of for the Environment 1998) that responds to the CBD, there will likely be an increasing need for a more systematic approach to quantifying the distribution and dynamics of species and ecosystems.
Increasing the knowledge base. Changes in the composition, structure and
functioning of forest ecosystems occur over long time periods. For example, extensive apparently induced by possum browsing is a process taking several decades in southern forests. Quantifying and understanding the changes driven by such human-related impacts, a context of natural processes, requires improved data on patterns and rates of change. Although this may be viewed as a research function, increased knowledge is an important by-product of information gathering for other purposes.
Evaluating conservation achievement can be viewed as forming part of the Department's 'Achievement System'; evaluating conservation performance as part of a 'Status System'. The term 'surveillance monitoring' has been defined to describe the biological inventory component with a purpose of evaluating conservation performance, as well as for reporting on conservation assets and increasing baseline knowledge (Figure 1). The term outcome monitoring has been applied to the biological inventory needed, in part, for the purpose of evaluating conservation achievement. Surveillance monitoring can contribute to evaluating conservation achievement by defining the status of the 'without management' option (Figure 1). So that the types of measurements used in outcome monitoring may not always necessarily be different from those often used in surveillance monitoring. There is a distinct role for both forms of monitoring. For example, an experimental manipulation of local herbivore numbers and outcome monitoring will show the regenerative response that can be achieved by animal control at specific levels. More general surveillance monitoring will show that in the large proportion of conservation estate without control, such herbivores are a problem for regeneration. Surveillance will alert managers to new impacts such as those brought about by the invasion of new exotic weeds.

15
2. DISCUSSION PAPER In July 1998 Research was commissioned to develop a discussion paper on methods and indicators for describing forest condition and trend, or status of the asset base (conservation performance), as a basis for assessing the need for conservation management intervention and reporting at a national and regional scale. Condition can be assessed in terms of human-related impacts on composition, and functioning of forests, and trend as changes in indicators reflecting human-related impacts on composition, and function. These indicators can be selected to reflect human-related impacts, as well as natural processes, and thus provide a quantitative basis for assessing conservation performance and achievement. Under the Department's guidelines for measuring conservation projects there must be a project plan which specifies the conservation asset of interest, the characteristics of interest, and the outcome (Department of Conservation 1998). In this instance: The conservation asset is the indigenous forests of New Zealand.
The characteristic of interest is human-related changes in forest composition, structure and function.
The outcome target is departmental management intervention over coming decades that contains human-related changes in indigenous forest composition, structure, and functioning to levels consistent with retaining forest heritage values only by natural processes.
2.1 Selecting methods and indicators Methods and indicators for describing condition and trend in these forests are developed based on departmental needs and past experiences. What does experience tell us about selecting methods and indicators? Build on the past while accommodating new developments. This can ensure
compatibility of methods for decades, even centuries; stability of methods etc. Pay more attention to sampling design.

16
Select indicators that achieve goals. But, what is a suitable indicator and what does a change in an indicator mean?
Not to focus too much on today's immediate concerns
Allow for interpretation of indicators in monitoring designs
Not to expect that an indicator will necessarily return to some pre-disturbance state. 2.2 What may be useful indicators Six indicators are proposed: Forest area as a habitat indicator.
Mortality and recruitment rates of trees for maintenance of structural dominants.
Community composition as an indicator of species assemblages.
Exotic weeds as a measure of intactness.
Browsing indices for introduced animal impact.
Quantity and characteristics of dead wood as a habitat diversity indicator. Many of these indicators are currently best assessed through a network of permanent plots. 3. REFERENCES Department of Conservation. 1998. Measuring conservation management projects:
Definitions, principles and guidelines. Department of Conservation/Ministry for the Environement 1998. New Zealand’d
biodiversity strategy: our chance to turn the tide (a draft strategy for public consultation).

17
Monitoring sika deer impacts in beech forest vegetation Sean Husheer Tongariro/Taupo Conservancy, Department of Conservation Private Bag, Turangi 1. INTRODUCTION Deer have long been recognised has having a severe impact on forest vegetation in the Kaimanawa Ecological Region, which consists of the Kaimanawa, Kaweka and Ahimanawa Ranges. Recently a study of deer impacts on Kaweka Forest Park mountain beech (Nothofagus solandri var. cliffortioides) forest showed that at critical sites deer browse was preventing seedling regeneration to the extent that maintenance of a forest canopy was unlikely (Allen & Allan 1997). The East Coast Conservancy of the Department of Conservation (DOC) has obtained funding to undertake deer control and related monitoring work in Kaweka Forest Park. Department's Science and Research Division (S&R) has provided $100,000 for a four year PhD study to determine the impacts of sika deer on mountain beech forest vegetation. The study is required to determine and justify management practice. 2. STUDY OUTLINE This paper will list objectives and briefly outline methods for the study. The PhD is divided into five discrete but related studies, each intended to be published in a refereed journal. 2.1 Study 1: the relationship between deer abundance, site characteristics and mountain beech regeneration Mountain beech forest is failing to regenerate on some open canopied sites in Kaweka Forest Park, yet on many other sites profuse regeneration is evident. Survey work will measure the extent and intensity of regeneration failure occurring and what factors are common to sites with regeneration failure. Specific questions What is the extent of canopy breakdown throughout the study area?
What level of mountain beech regeneration is occurring at open-canopied sites?
What vegetation composition, environmental and site factors best predict critically
low mountain beech seedling regeneration?

18
Methods Surveys will be undertaken in western Kaweka Forest Park to characterise regeneration in open canopied mountain beech forest. Aerial survey and analysis of aerial photographs will determine the extent of mountain beech forest. Only large (more than 100 ha) areas of dominant mountain beech forest will be sampled. Existing randomly located mountain beech permanent plot and pellet count will be used. Approximately 50 plots will be in mountain beech forest on 14 transects. This will comprise of approximately 36 mountain beech 20 x 20 m survey plots spaced at 200 m intervals, and approximately 51 plots at low basal area sites. Canopy cover, soil and site parameters, and overstorey and understorey composition will be measured at 200 m intervals along transects and in areas of low canopy or basal area. Methods are based on Alien (1993). At 20 m intervals along transects the presence and absence of deer and possum pellets within a 1.14 m radius will be recorded and pellet groups will be counted within a 2.2 m radius. At 40 m intervals along transects, basal area will be measured using Cruise Master prisms and the canopy cover indexed using spherical crown densiometers. When the basal area is less than 25 m2/ha, and mountain beech is the dominant overstorey species, standard environmental characteristics will be measured in 20 x 20 m plots. Plots will also be established every 200 m along transects regardless of canopy cover or crown density so that comparisons can be made between open and closed canopy stands. 2.2 Study 2: changes in the regeneration dynamics of mountain beech forest in the Kaweka and Kaimanawa Ranges since 1940 Regeneration failure is not observed in mountain beech forest other than in the central North Island sika deer range. This suggests that sika deer are the cause of regeneration failure in Kaweka Forest Park. Sika deer have digestive physiology that probably allows them to have a higher level of browse impact than red deer (Fraser 1996). Since the 1950s sika deer have increased in abundance relative to red deer in Kaweka Forest Park (Davidson & Fraser 1991). A pilot investigation will be undertaken to test the feasibility of a study on the sequential history of regeneration using current and archived aerial photos and dendrochronology of even-aged pole stands. Other components of this PhD propose to test if there is a relationship between deer abundance and mountain beech regeneration failure. This would show that there is an apparent spatial coincidence between mountain beech regeneration failure and sika deer. Evidence that sika deer have been the cause of regeneration failure would be more convincing if it could also be shown that there was a temporal coincidence of regeneration failure and sika deer. That is, that an apparent change from successful regeneration after canopy breakdown being the norm, to regeneration after canopy breakdown being the exception, coincides with the time when sika deer became predominant over red deer. Specific questions What changes have occurred in canopy gap characteristics since the 1940s?
What proportion of canopy gaps arising in recent decades have successfully
regenerated?

19
Is there a relationship between the timing of a change in regeneration frequency/ prevalence and sika deer predominance?
Methods Intensive quantitative analysis of aerial photographs and field data will be used to compare changes in the size, location and quantity of canopy gaps over time. A trial of the feasibility of a study on demographic comparisons between recent and present regeneration will be undertaken. The fates of individual canopy gaps will be followed over recent decades using aerial photographs. Ground-truthing will be undertaken to validate results. Even-aged pole stands will be located from aerial photographs then aged using increment coring or biscuiting techniques. Suitable sampling and analysis techniques will be thoroughly investigated before a decision is made to continue with age structure analysis. Transparent grids of different sizes will be placed over photographs, any one square with no trees in that grid would he defined as a gap for that particular scale. This method will be repeated for grids of various scales to gain an understanding of gap size and distribution. Statistical methods such as spatial autocorrelation and frequency analysis will be used to analyse data. Random lines will be drawn on maps and the interception of trees used as a measure of intactness. The proportions of lines that cross gaps will show fragmentation. 2.3 Study 3: the effectiveness of deer control on restoring mountain beech regeneration at critical sites in the Kaweka Range East Coast/Hawkes Bay Conservancy is currently undertaking aerial deer control over approximately 10,000 ha (Te Puke-Makino) in Kaweka Forest Park. In this area, and the rest of Kaweka Forest Park east of the Ngaruroro River, the Conservancy is actively encouraging commercial and recreational hunters to kill deer. One area in Kaweka Forest Park (Manson/Otutu) and two areas in Kaimanawa Forest Park (Maungaorangi and Rangitikei) will act as experimental controls with no change in management practice. A series of monitoring plots is being established in these areas to show differences in growth, mortality and recruitment under the various management regimes and with the complete exclusion of deer. Specific questions Is there a difference in growth, mortality and of seedlings between areas with
different deer management regimes and deer densities? What happens to seedling growth, mortality and when deer browse is removed?
Are deer control treatments reducing deer densities to sufficiently low levels to
allow regeneration adequate to provide canopy replacement in areas of canopy breakdown?
Methods A series of paired monitoring plots (one fenced to exclude ungulates) is being subjectively located the treatment and non-treatment areas in Kaweka and Kaimanawa Forest Park. See Ward (1997) for design. Deer density will be indexed annually at each

20
exclosure site. Analysis will include comparisons of seedling growth, mortality and recruitment and deer abundance at each site. 2.4 Study 4: the effect of mountain beech germination and establishment of browse, soil type, vegetative cover, below ground competition, and canopy collapse and thinning The ability of plant species to compete with one another varies with nutrient and light availability, predation and vegetation community composition. Mountain beech regeneration may be reduced on some sites more by competition with other plants than by direct deer impacts. This study will determine the effects of deer browse, competition, soil fertility and site location on mountain beech germination and establishment. Specific questions What effects do the presence of herbaceous plants, ferns and unpalatable shrubs
have on mountain beech seedling establishment?
What effects do shading, root competition, soil nutrient status and browse have on seedling establishment?
What will be the effect of deer browse at future and collapse sites?
Methods At subjectively located exclosure sites, manipulative treatments will be randomly applied to systematically located understorey plots (using a factorial randomised design). Sites are in areas of low density canopies and low seedling regeneration with dense herbaceous turf communities. Treatments will be paired inside and outside of exclosure fences. At some of the plots, mountain beech seeds will be sown at various densities. Treatments will include herbicide spraying, deer and possum exclusion, quantified deer browse simulation, shading and root trenching. At each plot herbaceous vegetation composition, the level of shading, the proximity of rotting logs, soil fertility and the composition of nearby vegetation will be measured. 2.5 Study 5: the influence of deer on compositional changes in beech forest Specific questions What changes have occurred in beech forest and composition in Kaweka and Kaimanawa Forest Park in the last two decades? What trends might occur in the future? Methods Remeasurement and analysis of permanent plots established in the late 1970s and early 1980s in Kaweka (140 plots) and Kaimanawa (57 plots) Forest Parks. Methods will follow Allen (1993).

21
3. REFERENCES Allen, R.B. 1992. Recce: method for describing New Zealand Forest Institute Bulletin
176. Ministry of Forestry, New Zealand. Allen, R.B. 199.. A permanent plot method for monitoring changes in indigenous forests.
Manaaki Whenua – Landcare Research, Lincoln. Allen, R.B.; Allan, C. 1995. Mountain beech forest dynamics in the Kaweka Range and
influence of browsing animals. Manaaki Whenua - Landcare Research Report L9596/024 for Department of Conservation
Davidson, M.M.; Fraser, K.W. 1991. Official hunting patterns, and trends in the
proportions of sika (Cervus nippon) and red deer (C. elephas scoticus) in the Kaweka Range, New Zealand, 1958-1988. New Zealand Journal of Ecology 15: 31-40.
Fraser, K.W. 1996. Comparative morphology of sika deer (Cervus nippon) and red deer
(C. elephas scoticus) in the Ahimanawa and Kaweka Ranges, Central North Island, New Zealand. Oecologia 150: 160-166.
Ward, C. 1997. Kaweke mountain beech forest monitoring requirements. Unpublished
Department of Conservation Report, East Coast/Hawkes Bay Conservancy. 4. WORKSHOP DISCUSSION/FEEDBACK Cause of browse Mainly deer but possible some from possum and hare. The deer are 95% sika, 5% red. The percentage of sika has steadily increased since the 1950s. In the deer eradication areas it doesn't matter which species is seen-they are all being targeted. Environmental factors The environmental factors that will be studied as part of the research into beech back and regeneration haven't been defined finally. They will possibly slope, aspect, canopy closure, soil profiles, soil fertility and deer and possum abundance. Light sensitive paper Light sensitive paper is being used to assess canopy closure. Samples are put in full sunlight, on the site and in full shade, all at the same time, then percentage comparisons are made.

22

23
Draft procedure for aerial foliar browse monitoring Bill Fleury, Astrid Dijkgraaf1 and Paul Prip Wanganui Conservancy, Department of Conservation Private Bag 3016, Wanganui 1. BACKGROUND The Foliar Browse Index (FBI) methodology (Payton et al. 1997) has been developed to assess possum damage to forests. It uses a ground-based assessment of plant indicator species to determine the impact of possums and the response of vegetation to possum control. The ground-based version of FBI is a compromise between practicality, resource limitation and ideal sampling strategies. The sampling strategy recommended for the FBI methodology involves the selection of a number of randomly located transects, and the permanent marking of these transects and individual sample trees along their length. The clustering of sample trees on transects reduces the independence of each of the sample trees, reduces the representativeness of the sample, and theoretically requires each transect to be treated as a sample unit rather than each tree being an individual sample. To some extent, the repeated measurement of individuals overcomes several of the sampling problems, but this procedure does introduce some additional difficulties. Repeat measurements require observers to replicate the view of previous observers. Such replication is difficult to achieve as the observer location and/or process for obtaining the view is difficult to describe and can be complicated by changes in the understorey or subcanopy. Another limitation is that it is difficult to include emergent trees in any sample. The crown of emergent species cannot readily be seen from the procedure unless an elevated viewpoint is available. Limiting sampling to individuals that can be viewed from above inherently biases a sample towards trees growing in gullies or on lower slopes. In much of Wanganui Conservancy the terrain precludes the 'random transect' strategy as a sampling procedure. Deeply incised streams and steep papa faces impose severe obstacles to travel, other than along ridges. The outcome of this restriction is that any ground-based sampling will be biased towards ridge-top forests, which can be markedly different to slope vegetation because of differences in parent rock and soil type. Much of Wanganui Conservancy's forest cover consists of a relatively low canopy of hardwood species (tawa, kamahi, heketara, pigeonwood) topped by scattered emergents. The emergents provide much of the physiognomic character of the forest, and three or four species (northern rata, totara, Hall's totara and perhaps rewarewa) are severely impacted upon by possums. 1Underlining denotes person who presented paper at the workshop.

24
We propose an alternative approach using Global Positioning System (GPS) or Differential Global Positioning System (DGPS) navigation and a helicopter as a viewing platform. This approach eliminates many of the sampling problems, and all but one of the parameters recorded for ground-based sampling can be recorded from above the tree as well as or better than from the ground. 2. PROPOSED METHODOLOGY 2.1 Basic outline The proposed procedure utilises a helicopter fitted with a GPS navigation system linked to pilot guidance equipment. Such equipment is standard on helicopters used by the Department for possum-bait spreading operations. Initially two sampling strategies were considered. The first exploits the precision of DGPS (either base station linked or satellite linked) to set up randomly located transects and identify individual trees of each species on that transect. It was thought that DGPS would enable these individual trees to be located in repeat surveys. The other relies on GPS to locate the origin of a randomly located transect, then trees are selected on a randomly selected hearing. Trees found on GPS systems (unlike DGPS systems) are unlikely to he relocated in the future due to the 'wobble' in the system that can vary up to 60 m. The proposed methodology requires a helicopter that can seat a minimum of two observers with overlapping fields of view. We suggest that a smaller helicopter such as a Bell Jet Ranger or Hughes 500 would be most suitable. Both observers are seated in outer seats so that they have overlapping views on the same side of the aircraft. Removal of the helicopter doors allows observers an unimpeded view of the canopy. Observers are linked to each other and the pilot by internal communication. This allows them to direct the pilot to the next tree or sampling point and allows observers to reach agreement on variable scores. Both observers are harnessed beside open doors allowing them to lean out of the helicopter when necessary to get a clearer view and/or to take samples. The recording sheets for aerial FBI are similar to those shown in the FBI manual with a few modifications. Random points are pre-programmed into the GPS/DGPS unit, as are the randomly selected bearings of the transects originating from those points. Stratification is used to assign the sampling density for any discrete or distinctive sections of the overall study area (such as ridges, valley bottoms, etc.). A non-treatment site is included if available. Prior to sampling, the observers select the species they will include in their sample. Most species would he possum-preferred and have leaf/growth forms that show possum browse. One or two species that are not usually eaten by possums (e.g. pigeonwood) should be selected as internal controls.

25
2.2 Sampling and data collection process The pilot positions the helicopter directly over the first sample point (with DGPS this can be within a metre of the selected point). The outer observer (Ob.1) classifies the vegetation directly under the aircraft by height class and type, e.g. bare ground, turf, low scrub and ferns, shrubs less than 2 m, kamahi canopy. Observer 2 (Ob. 2) records the data. Data from this exercise provides an overall vegetation cover estimate that can be used to quantify the relative impact of changes brought about by changes in the possum browse impacts. Note that transects have a swath width of 40 m; 20 m on either side of the transect line. This is in line with the proposed 20 m maximum distance around the centre point for ground-based FBI monitoring. It might not be possible to cover the full 40 m swath since both observers will be seated on the same side of the helicopter (the right side). The pilot then proceeds along the transect until the first canopy or emergent individual of the selected indicator species is encountered. From a good viewing position above the tree crown Ob. 1 scores each of the parameters as described in the FBI manual and Ob. 2 concurs (or not) with the scores and records them. If necessary the pilot can be directed to get closer to the canopy or change position so that browse type and recovery can be identified. Ob. 2 also records the distance of the tree from the transect origin (from the GPS unit display) and the estimated crown diameter of the tree. These two data provide a density estimate for the species and an overall estimate of canopy area for the species. The helicopter proceeds along the transect until one individual of each selected species is identified and scored. The helicopter then proceeds to the next nearest sample point. Sample size Payton et al. (1997) suggest that, where repeat sampling of individuals is proposed, a sample of 50 individual stems is required to give an ability to detect changes of ± 10% or greater. Frampton (pers. comm.) suggests that a sample size of 30 would provide similar power if randomness, independence and representativeness could be maximised. If a repeat sampling regime is not planned (or feasible) Frampton recommends increasing the sample size by about 40%, i.e. a sample size of 42. Repeatability of individual samples Wanganui Aerowork advised that with DGPS technology they have been able to record the location of individual trees and return to them at 6-monthly intervals without difficulty. The DGPS unit employed gives a precision of ± 1 m (McLaughlin pers. comm.). This level of precision would allow individual tree crowns to be relocated with confidence provided that the crown was distinctive and the individual tree was not part of a stand of the same species. If the sample individual was one of a stand of the same species, repeatability could be assured by adopting a protocol whereby only individuals with a crown exceeding 2 m diameter were sampled and sample points were recorded directly above the centre of the crown.

26
2.3 Parameters The following sections look at recording standard FBI parameters from the air: Species A skilled observer should be confidently able to identify species from the air. A hovering helicopter also offers the possibility of sample collection in case of doubt. Abundance We believe that the sampling strategy described offers the opportunity for abundance to be estimated using distance techniques. Tier Differentiation between canopy and emergent tiers is more obvious from above than from the ground. The subcanopy would be difficult to distinguish and sample from the air unless individuals in canopy gaps were recorded. It would then be questionable as to whether these individuals were representative of the subcanopy. Foliage cover From the air, the 10-point Cover Scale can be applied to the entire crown of the selected tree. An observer's ability to estimate the cover from the air is likely to be similar or better than from the ground as the whole canopy can be viewed without interference from the subcanopy or branches. We believe that it is also easier to distinguish the extent of one tree's canopy, in a dense canopy, from above than it is from below. Hence the need to differentiate on the basis of segments or tree is unnecessary. Die back parameter can be scored, using the 5-point scale, more readily from above than below, especially if the helicopter can be manoeuvred to within a metre or so of the canopy. Recovery Similarly to it is likely that recovery can be better estimated from above than below. Possum browsed leaves With the ability to closely examine the outer crown of the selected tree, the observer's ability to collect these data is enhanced. In cases of doubt, possum browse could be distinguished from insect browse by collecting samples. Possum use It is unlikely that scratch and bite marks on the trunk could be seen from the air. Presence or abundance of flowers and fruit For most species this parameter is better judged from above. Species such as kohekohe would be the exception.

27
Epiphytes Scoring of epiphytes is possible under the FBI protocol provided the foliage of the plant can be seen. Species such as Pseudopanax simplex, P. edgerlyi and Pittosporum cornifolium can be included in the sample as sensitive indicators of possum browse. Scoring of epiphytes from the air would be limited only to those epiphytes that contribute to the canopy and it is possible that species such as those listed, would not be seen as they tend to occupy subcanopy positions. Conversely, the proposed technique gives the potential for including young northern rata and the crowns of lianes such as lawyer, supplejack and all of which have been noted as preferred possum diet (Fitzgerald 1976; Fitzgerald & Wardle 1979; Wardle 1984; Brockie 1992). Testing of the proposed methodology would need to assess the likelihood of encountering and identifying liane and epiphyte crowns, and the possibility of viewing and scoring flowering or fruiting on species such as Astelia and Collospermum. Mistletoes FBI is used (or planned for use) to monitor the response of the large leafed mistletoe species. It is unlikely that these species could be adequately monitored from the air. In Wanganui Conservancy, however, there are few individuals of these species remaining and those that are known, are usually monitored (and protected) in a more intensive manner. 3. FIELD TRIALS FBI ground lines, part of monitoring for the Stage Two Waitotara possum control programme, were remeasured in March 1999. We decided to use these areas to compare scores obtained by aerial and ground-based FBI. We chose Humphries (because it is most degraded) and the Waitotara Stage Two control (no possum control yet) as our initial sites to test the feasibility of helicopter-based FBI. Both areas cover about four to six 1 km grid-squares of a NZMS260 map. We wanted to compare the various aspects of the FBI ground-based method with the aerial method. Therefore we randomly located the origin of one aerial transect in each grid square with a randomly generated direction. This initial trial was limited to 6 km2 and thus there was a chance of transects overlapping and a smaller chance of sampling the same trees. This would not normally he a problem because the area to be covered would be considerably larger and stratified to prevent over-sampling particular areas or habitats. For this trial we rejected any directions that caused transects to overlap less than a kilometre away from the origin.

28
3.1 Species to monitor For this initial trial we wanted to find three individuals of each species per transect line:
Tawa ) Kamahi ) These species should be OK to find and monitor. Hall's totara ) Northern rata )
Hinau ) Maghoe, whiteywood ) These could be harder to find due to rarity Olearia, heketara ) or understorey status, especially toro and heketara Pigeonwood ) Toro )
3.2 Results Due to time constraints and a very busy helicopter season we only managed to fly two transects using a Hughes 500 helicopter. We could not get a helicopter with DGPS and
cannot therefore resample the same area. However, observations made during the trial flight indicate that relocating the same individuals would be very difficult unless the species have very discrete distributions and distinct canopies (such as northern rata, totara and possibly hinau).
Locating starting points and flight directions with GPS takes a bit of time but is quite feasible. It was very difficult to select the first three specimens of each tree due to overwhelming choice. A modification of the protocol, where the starting
point is the origin of a 20 m radius circle as well as the transect origin, will reduce the initial pressure of selection. There was also a tendency to score trees in chimps, because as you hover you spot more individuals of target species, especially the lower stature species such as whiteywood and pigeonwood. A 20 m radius circle around the origin will take advantage of this phenomenon and reduce the number of trees to be located while flying along the transect. The circle is flown 'on the spot' and the origin of the circle is facing the direction to be flown and rotating in a clockwise direction from that point (Figure 1). The FBI manual suggests that trees of the same species scored in clumps should be at least 10 m apart. This did not often happen in the ground-based operation but is more likely to happen with aerial FBI. We will still have to specify this ruling for lower stature species, since they tend to be scored in canopy gaps, and for very common, nearly universally occurring species, such as tawa. Sampling three species on each transect seemed quite easy (for the more common species) and feasible for the less common. Some criteria might have to be established (e.g. each transect should have a maximum length of 5 km; if no, or insufficient individuals of a particular species have been found by that stage, the transect is

29
aborted). The rare species can be targeted by stratifying to include more of their particular habitat - such as totara on ridges. We initially started sampling with the doors on, but decided that the doors definitely needed to be off since they obscure vision too much, especially when checking for possum bites. The helicopter can get really close to canopy and emergent trees; we often hovered with one skid nearly touching the target tree. However, lower stature species such as whiteywood and pigeonwood were only found in canopy gaps and viewed from higher (5-10 m) above the canopy. Binoculars are still very useful for these lower stature species and for double-checking whether foliar browse was due to possums or insects. It is important to brief the pilot on the ground with examples. Even so, there will be a practice effect as the pilot and work together to select origins, sampling transects, and trees and species on the transect. By the second transect we were working well together. Smaller helicopters, such as the Hughes range, are likely to be better. They can get closer into the canopy and do not produce as much downdraft to disturb the canopy. 4. COMMENTS ON FOLIAR BROWSE INDEX SCORING These are our general observations of the aerial FBI trial and also a comparison of the aerial set of data with a subset of the Humphries 1999 data and the total set of Humphries data. The subset includes lines 46 and 47 data only, which are the lines closest to those flown in the aerial survey. One observer (A. Dijkgraaf) took part in both the ground and aerial surveys. Species Once we got our eye in, and got used to flying slowly above the canopy, it was very easy to distinguish and identify species -especially when only looking for individuals of one or two species. When looking for the entire list it was easy to be overwhelmed by choice. It was also very easy to distinguish where the canopy of one tree finishes and another starts. However, the light conditions can make this more difficult. In winter, sampling flight times should be restricted to between the hours of 10 am and 3 pm to reduce excessive shadowing. Olearia rani was very hard to locate in the transects. This could partially be due to the lack of this species in the area, since no heketara were found on lines 46 and 47 either. No Myrsine salicina were sighted during the aerial survey. Abundance Most species, especially the common ones were found within a 20 m radius of the origin. This might not allow good density estimations, or distance sampling estimates to be made. It will allow species to be classified as common, occasional and rare as per current FBI protocol. For rare species the distance between the origin and sampling point might give good distance sampling estimates. It was not difficult to record the longitude and latitude co-ordinates of a tree or clump of sampled trees. These co- ordinates can be used to generate distances from origins.

30
Tier Trees can really only he scored as emergent or canopy trees during aerial surveys. Subcanopy trees are much harder to spot and only part of the canopy will be visible, eliminating them from the survey. Foliage cover It was very easy to score emergent and taller stature species (northern rata, tawa, hinau, totara and kamahi), and easier than from below the canopy. However, we felt that we were overestimating foliage cover density of lower stature species, and trees with dense canopies, because you are trying to score green against green - not green against sky. Comparing the results of aerial FBI with ground-based FBI does show this trend for pigeonwood (95%cover for all six trees) and whiteywood. However, this trend could also be due to only scoring these species from canopy trees whereas the ground-based FBI would have had a higher proportion of subcanopy trees. All species have means with overlapping confidence intervals compared to the subset (lines 46 and 47 only) or total data set for Humphries, showing that aerial sampling is quite comparable for this area. Most species have a confidence interval that spans only one or two cover classes. Observers should practice together on the ground and get their scoring refined before attempting an aerial survey; this reduces error and speeds up the sampling process. Dieback As for foliage density this was much easier to score from above than below, especially for the upper third of the tree. Dieback for tawa and kamahi appears more significant when scored from the air than from the ground. Dieback for the other species is comparable between the data sets. We were somewhat concerned that scores for the entire tree might not be comparable because of the difficulty of looking beneath the canopy, but the results do not bear this out. There is a tendency for aerial scores of to be higher than ground scores, however this varies considerably between species and needs a larger data set to confirm. Recovery It was very easy to score foliage cover and from It must be remembered however that Humphries is a severely impacted forest and the canopy is quite open, especially for kamahi. This could make it easier to score recovery at Humphries than at other localities. Browse Browse was easy to score from the top, but binoculars were still needed on occasion. Browse seems to he consistently scored higher when measured from the air. This may be because possums concentrate their efforts in the top of the trees, which are inherently harder to score from the ground, or maybe the 2-month lag between ground and aerial sampling contributed to elevated possum browse scores. Fruiting and flowering Flowering and fruiting can be easy to score; it depends somewhat on the species. Pigeonwood and kohekohe could he difficult because their leaves might hide and small-fruited species like whiteywood will be difficult. On the other hand, it was easy to see

31
tawa and hinau flowers that are generally hard to detect from the ground. Occasional gusts from the can assist in identifying fruits and flowers under foliage. Epiphytes It would he relatively easy to score epiphytes at Humphries because of the degraded and open nature of the canopy. However, this might not he the case for forests with more intact canopies. 4.1 Additional comments We did not attempt to estimate crown diameter of the trees or classify the vegetation directly under the aircraft by height class and type, e.g. bare ground, turf, low and ferns, shrubs <2 m, kamahi canopy. The vegetation survey would not add significant time to the sampling strategy, but estimating crown diameter could. Take a clipboard with clips at the top and bottom, otherwise paper and maps go flying. Maybe take a zip lock satchel that can be sat on for the stuff not immediately needed. If possible tape the foliage cover density and category explanation cards to a seat or area at eye height - one less thing to hang on to in a draft. Wear warm and windproof clothing and thin gloves. We used two observers, it might well be feasible for an experienced observer to score and record simultaneously. The area we sampled has a rather degraded canopy, and we are not entirely sure how scoring go in an area with denser canopy, but it seems promising. Once we pickup speed, we should be able to do a line (15-18 trees on these runs, but can probably handle more) in 30 minutes or so, including locating the origin. The only category that requires some discussion on occasion is the score category, the rest seems straightforward. We recorded GPS positions whenever we could, but for trees within a radius of 20 from the last recorded position merely noted 'within 20 m of last GPS’. The operation needs reasonably still days, otherwise hovering in one spot will become very difficult. 5. COSTS AND COMPARISONS To obtain a minimum of 42 individuals of each species (at 3 individuals of each species per would probably require up to 20 transects (including those stratified for specific species). This gives an estimate of about 10 hours flying for one sample. Charge-out rates for helicopters range from about $450/hr (H300) 70 $1200/hr (Jet Ranger), suggesting that the external cost of such an exercise would be between $4500 and $12,000. Adding the salary cost for two observers doing field work (2 days @ $80/hr) and one person to analyse and report on the data (3 days @ $80/hr) gives an all up cost of $8980 -$16,480. Past Research experience has shown that setting an area up to get 50 individuals of each species requires 4 people for a week. That is $12,800 (@ $80/hr) plus $675 -$1800 in transport, bringing the total cost to $13,475 -$14,600. Because Landcare was unable to sample the area in an appropriate random manner they had to sample four sites (three possum control and one untreated site) to obtain sufficiently robust data. In other words, they had to spend nearly a month setting up the area; total estimated cost $61,580 to $66,080.

32
In a recent quote, Research offered to undertake FBI monitoring (remeasuring lines already set up) in the Conservancy's Matemateaonga Stage Two area (13,000 ha) for $40,000 and Stratford Area Office estimated a cost of $20,000 plus salaries for the same task to be undertaken 'in-house'. Remeasuring an area already set up takes 4 people 2 days ($5210 @ $80/hr plus $675 -$1800 in transport, total cost $5885 -$7010). Remeasuring all the sites that are part of the Stage Two possum control scenario took 4 people 11 days. Total estimated cost $28,655 in personnel plus transport of $3375 to $9000, total cost $32,030 to $37,655. Total budget used, excluding staff wages for two people, was about $16,000. So, initial costs appear lower for aerial FBI, as do ongoing costs, depending on how many sites are involved. However, the cost needs to be balanced against a more representative, randomised sampling that could produce better quality data. 6. STATISTICAL REQUIREMENTS We still need further statistical advice on various sampling strategies. Including whether the next nearest point should be picked or the points should be sampled in the order of their selection. How many individuals of each species are required in a completely randomised design such as proposed here? Is it valid to sample three individuals per transect or should only one tree per species be selected? We need more advice on sample size, and the data collected thus far needs more rigorous checking for variability between data sets.

33
7. SUMMARY TABLES

34

35
8. CONCLUSIONS Pros Aerial FBI sampling is feasible and probably easier than ground-based FBI.
Results are comparable to ground survey and the data may be more robust since scoring for several categories is easier from the air.
Sampling is more random and representative, including more types and aspects of the forest than the ground-based strategy.
It is cost-effective, probably cheaper depending on number of sites. Cons Cannot score trunk usage (one of the linked indices -trap-catch, usage, browse,
density).
Harder to score subcanopy species and trees.
Probably not good for mistletoe Further work required More areas need to be flown and data collected
Statistical advice needed Various sampling strategies (e.g. next nearest point or in the order of selection).
How many individuals of each species?
Is three individuals per transect valid sampling?
Advice on sample size.
More rigorous checking for variability between data sets. 9. REFERENCES Brockie, R. 1992. A living New Zealand forest. David Bateman Ltd. Fitzgerald, A. E. 1976. Diet of the opossum (Trichosurus vulpecula Kerr) in the
Orongorongo Valley, Wellington, New Zealand, in relation to food-plant availability. New Zealand Journal of Zoology 3: 399-419.
Fitzgerald, A.E.; Wardle, P. 1979. Food the opossum (Trichosurus vulpecula Kerr) in the
Waiho Valley, South Westland. New Zealand Journal of Zoology 6:339-345. Payton, I.J.; Pekelharing, C.J.; Frampton, C.M. 1997. Foliar Browse Index: A
methodology for monitoring damage to forests and rare or endangered plant species. Manaaki Whenua – Landcare Research Contract Report LC9697/60 for Department of Conservation.
Wardle, J.A. 1984. The New Zealand beeches; ecology, uitilisation and management.
New Zealand Forest Service, Christchurch.

36
10. WORKSHOP DISCUSSION/FEEDBACK Differential Global Systems (DGPS) This is not practical for monitoring common species like tawa. Although it can place you quite accurately, it is difficult to tell in a group of trees which one it was you looked at last time. It is good for more distinctive, stand-alone species, e.g. northern rata.

37
Using permanent plots and exclosures to assess animal impacts Cathy Allan Southland Conservancy, Department of Conservation PO Box 743, 1. INTRODUCTION We all know that introduced animals have changed, and are still changing, the composition and structure of many forest types in New Zealand. The question is, how can we pinpoint the interactions and processes going on in order to make sound management decisions? The use of permanent sample plots has long been recognised as a robust approach for determining detailed changes in forests 1977; Allen 1993). There are over 15,000 permanent 20 x 20 m plots established in New Zealand's indigenous forests. I have been to over 300, so I know they are out there! A percentage of these, the exclosure plots, are located inside 22 x 22 m deer fences, and usually have unfenced 'control' plots nearby. Unfortunately, present and future resources will likely never be sufficient to maintain them all. Peter Bellingham recently came up with a model, using as an example, to optimise the number of permanent plots to keep monitoring 1996). As a guideline, he suggests that a minimum of 30 plots are needed to represent one forest type. This means a lot of work, and the resources to enable it, which is a big ask. As an example, in Southland we have 987 permanent plots! Of the nine forest types identified in Southland, only four forest types do not have the minimum suggested requirement of 30 plots. We may think our survey information is lacking, but really this data set is available to build on. The reason Peter Bellingham has suggested a minimum of 30 needs to he checked for different forest types, and could be done as a desktop exercise with subsamples of plots in the National Indigenous Vegetation Survey (NIVS) database. Minimum suggested number of plots in one forest type is "to maintain statistical confidence about changes in condition over time, but the actual number of plots required to give precise estimates of changes in forest condition in different forest types is unknown and is a topic that demands further research (Bellingham 1996).

38
2. MEASURING PERMANENT PLOTS What can we measure with permanent plots? What are the advantages over other, cheaper methods? Plot data allows us to determine the changes to plant species and community composition, frequency, density and structure over time (Burrows et al. in prep.). The information we get is site-specific, so change can be assessed on a site -by-site basis. Because the lines are mostly established at random start points along water courses, the results can be to discuss forests at large. Collecting the standard data will maximise future comparability of data, although there will also be reasons to change aspects of the methodology for specific objectives (Allen 1993): Tagged trees. Growth and mortality of canopy and subcanopy tree species.
Sapling counts. Recruitment of species through the browse tier.
Seedling counts. Recruitment through height tiers.
All this is necessary to develop our understanding of forest and dynamics over time. Recce plot descriptions usually accompany permanent plots (bounded within the 20 x 20 m area) and can be used as unbounded plots to supplement permanent plot series. A Recce consists of a full species list, each species being given a cover score for the different height tiers it occurs in (Allen & McLennan 1983). Some basic site information is also collected- slope, physiography, aspect etc. Records of browse on different species show up on Recces. 3. ANIMAL IMPACTS To understand the impacts of wild animals, we need to monitor the distribution, quantity and quality of pest-preferred food plants, and ecosystem processes which control them, to get key results to use in prioritising management actions. A sound way to monitor all these things is through permanent plots. The main reason for the early establishment of cruciform (Holloway & Wendelken 1957) and 20 x 20 m plots (Allen & McLennan1983) was to monitor the impacts of introduced browsing animals (Batcheler & Wardle 1976). Although the benefits and uses of this data now extend beyond animal impacts, plots are still a highly regarded tool for this purpose. When compositional variation is being specifically related to the distribution and abundance of introduced browsing animals, it is useful to record additional data on animal distribution and abundance (i.e. pellet counts). This has been done recently by the Department of Conservation (DOC) in the Kawekas, Waitutu, Murchison Mountains and Stewart Island.

39
4. WHAT CAN BE SHOWN WITH AN EXISTING AND AN EXPANDED NETWORK OF PLOTS? Data can be analysed and presented in a variety of ways to clearly show trends in forest structure and dynamics and how these relate to animal impacts. 4.1 Examples of questions that can be addressed in permanent plot studies Kaweka Range (Allen & Allan 1997) To what degree are mountain beech seedlings and saplings adequate for canopy
replacement? What are the impacts of deer on regeneration of mountain beech?
Murchison Mountains (Burrows et al. in prep.) Has the forest vegetation of the Murchison Mountains changed over the past 30
years? If there has been change, what are the likely causal factors?
Stewart Island (Stewart & Burrows 1988) What is the rate and spread of in the coastal strip of eastern Stewart Island?
What are the influences of introduced browsing animals on forest regeneration?
What are the differences in forest composition and structure, and regeneration
process, on Bench Island (not influenced by deer or possums) and Stewart Island (affected by deer and possums).
All these questions are quantitative and rely on repeatable data to give accurate answers. 4.2 Examples of results from data analysis and presentation Canopy structure changes Change in basal area on plots between years can be diagrammatically represented as a frequency histogram showing positive and negative changes in basal area. In the Kawekas, many plots had lost a substantial proportion of basal area over the 18-year study period. There was widespread evident in the canopy over large areas in the northern part of the range. In contrast, the canopy in the Murchison Mountains has shown almost the opposite-increases in basal area on many sites. Understorey changes In mountain beech forests, under a sparse canopy of low basal area, you would expect to find profuse regeneration-thickets of seedlings and saplings, as in the Craigieburn Range, where we were counting 400 saplings within a 5 x 5 m square. In the Kawekas, the sites with lowest basal area often had the lowest seedling densities-not a healthy situation! We believe that deer browse is the major causal factor here, deer have been preferentially feeding on open sites and continually browsing mountain beech seedlings, so that they are generally stunted, with thick stems. The reverse-J distribution

40
should expect between basal area and seedling density was not the case in the Kawekas, and seedling numbers were generally much lower than in similar forests in the Craigieburn Range. This work led on to my Masters thesis work, where I tagged individual seedlings inside and outside two exclosure plots to compare growth and mortality rates in the presence and absence of deer browse. At the time of my study, growth rates inside the exclosure at one open site were double those in an adjacent control plot. It was estimated that without deer management, seedlings at this site would take ten years to grow through the deer browse tier outside the exclosure. In the absence of deer browse (inside the exclosure), the estimated time for seedling growth above the browse tier was four years. This model has been developed to a larger scale project in the Kawekas to help managers determine the time needed for present seedling populations on open sites to grow through the deer browse tier. The forest understorey condition in the Murchison Mountains is very healthy in comparison. Highly palatable seedlings have increased in density between 1975 and 1998, and this is likely a consequence of continued deer control by the DOC. We commonly saw seedlings and saplings of highly palatable species-a treat to the eyes after working in the Kawekas, where the only broadleaf regeneration was occurring well out of the reach of deer browse. Permanent plots were also set up inside five existing exclosure plots, with one or two control plots adjacent. Results from these are quite interesting. Saplings of highly palatable species were in greater densities inside the exclosures. I have not included any information from Stewart Island, but within the next year you should see results from our most recent survey, where we will compare seedling and sapling diversity and density on pest-free Ulva Island, possum and deer-free Bench Island (where Polystichum vestichum was over 2 m tall), with Stewart Island plots. 4.3 Examples of conclusions and recommendations arising from plot studies Kaweka Range (Allen & Allan 1997) “If mountain beech forest cover is to be retained, the Department of Conservation needs a prompt management response to ensure that a pulse of regeneration, and recovery of forest biomass, will take place on as wide a range of sites as possible." Murchison Mountains (Burrows et al. in prep.) "Forest vegetation has changed over the past 30 years in the Murchison Mountains through stand development without major disturbance (decreasing mean tree density, increasing tree size and basal area), and reduced impacts by deer (increasing density of palatable trees and shrubs).” Stewart Island (Stewart & Burrows 1988) 'Numbers of white-tailed deer need to be drastically reduced if shrub hardwoods such as Griselinia littoralis, Pseudopanax simplex, Coprosma lucida, Fuchsia excorticata and

41
Caprodetus serratus and are to be retained as a component of the forest." "The effects of deer browsing are likely to become more severe unless deer numbers are reduced." "The proportion of understorey changes attributable to browsing by deer and possums could not be determined." So the impacts of possums and deer on forest understorey have not been teased out. As possums do feed inside deer exclosures it is possible to clearly show deer impacts, but it is more difficult to show possum impacts in the absence of ungulates. 4.4 Actions taken by DOC following these recommendations So far DOC has not carried out any animal control on Stewart Island, despite clear evidence from previous studies that deer were depleting the understorey. In the Kaweka Range, the results from the 1997 report prompted increased recreational hunting pressure, trophy hunt, aerial search and destroy by DOC. More intensive monitoring was set up to monitor the rate at which mountain beech seedlings were growing through the browse tier both inside exclosures and on unfenced plots. The Murchison Mountain forests, blessed with the presence of a threatened bird species (takahe), benefit from continued deer control to improve takahe habitat. 5. POINTS TO NOTE Permanent plots and exclosures are very useful in clearly demonstrating the impacts of browsers on the understorey. Although the foliar browse method was not developed around the permanent plot method, I believe there are benefits in using the two together. On Stewart Island and in Waitutu we have foliar browse plots set up at corners of permanent plots. Having long-term information on these trees will add to understanding of forest dynamics and the influence of possum browse on canopy Other benefits of permanent plots include being able to develop our understanding of natural forest dynamics, e.g. weed invasions, natural disturbance. Walk-through surveys may be cheap and easy, but a glance at a forest only gives you a snippet of the centuries-long processes going on. The best way to try and understand what is going on is to set up and continue long-term forest monitoring. We are lucky to have a good basis to work on from the efforts of previous conservationists, in the form of permanent plots which have generally been around for at least 30 years. I think it is well worth the effort and expense to build on this background, rather than come up with short-term half-pie ways to make management decisions. Without canopy tree information how can you comment on what you would expect in the understorey tiers, and whether these processes are affected by the impacts of browsers? 6. INTO THE FUTURE 6.1 Plot field techniques There are a few aspects of doing plots which are always in debate on the hill: as nature does not grow in straight lines there are often questions like 'does the seedling string sweep over the ground or do you count everything below it including what is under the

42
log?' I am beginning to compile these questions and plan to have a session on standardising plot and Recce techniques, so that remeasurement data is meaningful, and collected in the same way in the future. All contributions welcome. 6.2 Ministry for the Environment Carbon project This work is leading to a standard plot based on the 20 x 20 m plot that may be used for national reporting on forests for Ministry for the Environment, Ministry of Agriculture and Forestry and quite likely DOC (Allen pers. comm.). 7. REFERENCES Allen, R.B. A permanent plot method for monitoring changes in indigenous forests. Manaaki Whenua –
Landcare Research, Lincoln. Allen, R.B.; McLennan, M.J. 1983. Indigenous forest survey manual: two inventory methods. Forest
Research Institute Bulletin 48. Forest Research Institute Bulletin, New Zealand. Allen, R.B.; Allan, C.N. 1997. Mountain beech forest dynamics in the Kaweka Range and the influence of
browsing animals. Science for Conservation 44. Batcheler, C.L.; Wardle, J.A. 1976. Vegetation and animal condition assessment in National Parks. Science
in National Parks: 109-121. National Parks Authority, Wellington. Bellingham, P.J. 1996. Surveys and monitoring of vegetation. Manaaki Whenua - Landcare Research
Contract Report for Department of Conservation. Crawley, M.J. 1977. Plant Ecology. Blackwell Scientific Publications. Holloway, J.T.; Wendelken, W.J. 1957. Some unusual features of sample plot design. New Zealand
Journal of Forestry 7: 77-83. Stewart, G.H.; Burrows, L.E. 1988. Assessment of effects on forest regeneration in Stewart Island. Forest
Research Institute Contract Report for Department of Conservation. 8. PAPERS IN PREPARATION Burrows, L.; Coomes, D.; Allan, C.; Newell, C. in prep. Forest vegetation changes in Mountains, Fiordland
National Park, with special emphasis on takahe management. Maanaki Whenua -Landcare Research Contract Report for Department of Conservation.
9. WORKSHOP Seedling protection Mountain beech seedlings do better in browsed areas if there is some protection provided, e.g. other plant species or fallen logs. In places where other species appear to be replacing mountain beech due to browsing - perhaps they will eventually provide sufficient shelter that mountain beech might come back, it will depend on a whole lot of factors like the presence of browsers etc. Also mountain beech is a poor competitor so encroachment into shrub/turf communities will be a slow process.

43
Monitoring threatened plants as ecological indicators Nick Singers Tongariro/Taupo Conservancy, Department of Conservation Private Bag, Turangi 1. INTRODUCTION Monitoring of possum palatable threatened plants can provide information on:
Impact of possum browse on the particular species.
Assessment of plant and population health.
Outcomes (benefits) of possum control.
Ecosystem processes, e.g. regeneration and pollination of mistletoe species.
2. METHODS Historic records were often based only on the presence/absence of species with little quantifying data. Only occasionally was information on phenology, size, diameter at breast height, general health, mortality and recruitment recorded. Monitoring of threatened plants needs to be taken to the next level in order to accurately identify population status, threats, and aspects about their wider ecology. This can be achieved by: Using aspects of the Foliar Browse Index (FBI) method appropriate for the particular
species (Payton et al. 1997): foliar cover, possum browse, possum use, flowers/fruit. Monitoring phenology, size, recruitment/mortality and population structure
3. CASE STUDIES 3.1 Dactylanthus taylorii Root parasite of hardwood trees and shrubs. The flowers and buds are highly
palatable to possums and rats. Possums are generally more destructive than rats. Outside of protective cages this plant will never produce flowers or seed without
intense possum control (<3% Trap-Catch Index [TCI] depending on population size). The population is generally old aged with between 10 and 20% each year at some
monitored sites.

44
The two Pihanga sites are likely to be around <2-3% TCI though browse is still occurring.
In May 1998 the Kakaramea site had a TCI of 5%,when one female inflorescence
from potentially several hundred newly found plants was recorded. The goal is to produce female flowers and seed
3.2 Scarlet mistletoe (Peraxilla tetrapetala) Tongariro National Park is a North Island stronghold for the scarlet mistletoe. The
host is predominantly mountain beech (Nothofagus solandri var. cliffortioides). Surveys between 1991 - 1994 were undertaken to identify populations for pro-
tection. Plant size, flowering and presence/absence of browse were also recorded. An area that has had possum control for five years was intensely searched. All known
and new mistletoe were indexed.

45

46
Possume browse was very low. Probable explanation is that all sites naturally have
very low possum numbers <5% TCI and possum browse is infrequent, and perhaps intermittent.
Anecdotal reports suggest that most browse occurs in winter. These surveys
occurred during summer, and the plants may have partially recovered from browsing events.
3.3 Turner's kohuhu (Pittosporum turneri) Pittosporum turneri is a small tree with a densely divaricating juvenile stage and a
non-divaricating adult stage. Flowers and fruit are produced only on adult foliage. Both stages are browsed by possums, though the adult foliage is larger and by far
more susceptible. Total defoliation has been observed (Ecroyd 1994). Browsing of juveniles can inhibit maturation and therefore prevent reproduction.

47
Around diameters at base height of 4 cm and heights of 4 m, trees start to produce adult foliage (target this size-class for monitoring specifically for possum control).
Monitoring method was based on the FBI method (Payton et al. 1997), though foliar
browse scale is inappropriate for densely divaricating juvenile trees. A simple scale of 1-4 was used for health: 1 is very healthy, 5 is dead.
Most Pittosporum turneri are still juvenile
Mean possum browse on FBI scale was 0.1 and recent TCI was 1%, so trees should
now be able to mature. Continued monitoring should observe this.
3.4 Yellow mistletoe (Alepis flavida) The largest North Island population of Alepis flavida, occurring at Mangaehuehu, consists of approximately 80 known plants.

48
Possum control was established in 1994 to protect this population, as well as a substantial scarlet mistletoe (Peraxilla tetrapetala) population.
Plant size, presence/absence of possum and insect browse have been routinely
assessed since 1994, occasional monitoring of flowers and fruit has also occurred. This year all plants were indexed using aspects of the FBI.
Plant size has not increased greatly following possum control, in fact a decrease of
mean size has occurred which is due to more smaller plants being found (use of median size).
Presence/absence of possum browse appears to be minor. 1995 data may be
questionable. Possums appear to be having only a minor effect on this population
3.5 Pollination of scarlet mistletoe (Peraxilla tetrapetala) Loss of bird pollinators and dispersers through predation has been attributed to
mistletoe decline (Robertson et al. in press). Pollination of mistletoe is largely performed by nectar feeding birds, and the level at
which this occurs is likely to be related to bird density. Measuring flower and fruit abundance with the FBI scale can determine to what
pollination level this is occurring.

49
Two similar mountain beech sites, both between 1100 m and 1200 m above sea level and 20 km apart, were compared in 1998/99. 3.6 Yellow mistletoe (Alepis flavida) population structure The Mangaehuehu area was extensively searched (April 1999). All plants were
indexed using aspects of the FBI method. Additionally, the diameter of the host stem was measured in order to assess population age structure (Norton et al. 1997).
Regeneration appears to have been occurring and a range of plant ages and sizes are
present within the population. 4. CONCLUSIONS Threatened plants can be useful tools (ecological indicators) for monitoring the
effects of possum browse and benefits of control, as well as ecological processes. The precision of a plant as an ecological indicator depends entirely on its possum
palatability, the possum and plant density and aspects of the plant's ecology. Multiple effects can be occurring which can reduce precision (e.g. possum versus
rat browse of Dactylanthus taylorii). Often a high level of prior knowledge and experience about the particular plant
needs to have been collected so useful monitoring programmes can proceed. Monitoring often needs to at a specific time of year, which can change with seasonal
variation. Therefore an awareness of what the chosen plant is doing is essential. Often the use of threatened plants as ecological indicators is restricted because of
small sample sizes, so it is often better to incorporate them along with other monitoring programmes.

50
Increasing sample sizes may initially be very time consuming. For example, it takes 30 field days (approximately) to monitor 11 10 x 10 m Recce plots with 72 Pittosporum turneri present and 25 field days to find 47 new Alepis flavida. However, once undertaken they can often be monitored quickly. 5. REFERENCES Ecroyd, C.E. 1994. Regeneration of Pittosporum turneri communities. Forest Research Institute Contract Investigation TT3 for Department of Conservation, Tongariro/Taupo Conservancy. Norton, D.A.; Ladley, J.J.; .; Sparrow, A.D. 1997. Development of non-destructive age indices for three New Zealand loranthaceous mistletoes. New Zealand Journal of Botany 35: 337-343. Payton, I.J., Pekelharing, C.J.; Frampton, C.M. 1997. Foliar Browse Index: A methodology for monitoring possum damage to forests and rare or endangered plant species. Manaaki Whenua - Landcare Contract Report LC9697/60 for Department of Conservation. Robertson, A.W.; Kelly, D.; ladley, J.J.; Sparrow, A.D. in press. Loss of pollinators threatens endemic New Zealand mistletoes (Loranthaceae). Conservation Biology. 6. WORKSHOP DISCUSSION/FEEDBACK Dactylanthus There is still browse on caged plants as the cages only exclude possums not rats. The study populations are all old with no evidence of recruitment. A high percentage is male. This may tie into a theory that Dactylanthus are one of those plants that change sex as they age. They have not set up a non-treatment area as part of the Whakapapa study (insufficient resources), but other studies have been done in areas that have never had control. Results vary between areas, e.g. possum browse is low in one of the areas that has never been controlled. Pollination The study of mistletoe showed 63% pollination just before a mast year. It would be interesting to have data on pollination through the beech seeding process, i.e. to assess the impact of different levels of predators and birds. Divaricating trees and FBI Canopy cover/density assessments do not work on divaricating trees so have been using diameter at breast height (DBH). Historical data Although there is historical data available it is difficult to use. It includes DBH and height information, but plant health comments are too vague, e.g. 'good'.

51
Outcome monitoring for weeds Chris Buddenhagen Science and Research, Department of Conservation PO Box 10420, Wellington. 1. BACKGROUND For several years, it has been recognised that a weed monitoring manual or Standard Operating Procedure (SOP) was needed. Julie Geritzlehner was employed in September 1998 to do the job. The SOP will guide staff so that they can monitor the results and outcomes of their weed management. This is the first attempt to produce standard monitoring methods for weed control in the Department of Conservation (DOC). Methods described in the manual will be a happy compromise between practical and scientific requirements. The emphasis is on methods that are objective based, simple, and cost less, while being practical and scientific. We hope the users will agree it is a happy compromise. The manual includes ‘rules of thumb' and statistical principles to guide staff in their design and implementation of methods. We designed these rules of thumb in consultation with statistics experts. In a way, they are the equivalent to minimum standards to follow. Combined with a good understanding of statistical principles, staff should be able to understand and justify why they need to do what monitoring. The rule of thumb provide staff with short-cuts so that important decisions along the way are easier to make. For example, all projects with budgets over $20,000 should be monitored (result monitoring) and at least 15-20% of the budgeted time and money for weed control should be spent on monitoring. Note that these figures represent first-cut estimates and may be revised in the future. We also provide simple processes for deciding on sample size and other key decisions in the monitoring process. 2. OVERCOMING RESISTANCE Many people would rather be out killing the next weed, not monitoring the last weed control operation. However, selected monitoring improves the efficacy of control activities. For example monitoring can show: If the chemical used kills the weeds.
If control is consistent over the whole area.
If the operator applied chemical to all the weeds.
If there is a seed bank.
If there is reinvasion.
If there was any non-target damage.

52
The process of monitoring also helps people to clarify conservation objectives, control objectives, monitoring objectives, and to define the area that should be the focus of control. 3. OUTCOME MONITORING The focus for animal pest control monitoring has moved from looking at the pest, to looking at pest impacts, i.e. outcomes. Outcome monitoring is now widely regarded as integral to animal control programmes. In contrast, monitoring of any kind has not been an integral pan of weed management in DOC. Our Department's weed managers need to monitor both results and outcomes. Most people assume that weeds have a negative impact and thus some believe outcome monitoring is not necessary. However, the full impact of a weed on a native community is rarely obvious. It is not enough to know that you have killed the weeds. The desired conservation outcome is not always consequence. The question we want answered is 'Does the control of the invasive species help achieve the conservation objectives at the site?' Clarifying objectives leads to better management. Outcome monitoring is only relevant for site-led weed control programmes, i.e. those that focus on protecting valuable communities and native species. The bulk of our weed control is through site-led programmes. In the monitoring manual, we are focusing on plants (impacts to animals are not considered). The aim of monitoring for any given site-led control programme is twofold: to determine the change in weed abundance following control (result monitoring); and to assess changes in conservation value of the site (outcome monitoring). The desired outcome is the enhanced condition in the native plants that were adversely affected by weeds prior to control. Outcome monitoring: Determines how native species or communities respond to weed control Helps us to understand impacts of weeds on plant communities.
With such information, we can re-evaluate our actions and objectives. Outcome monitoring must be designed to determine whether weed removal is the cause of observed change in the native plant community. However, the impact of weeds on other plants is generally indirect, via competition for resources. Competition among plants is an important factor in community dynamics and plant succession. However, competition is a consequence of complex interactions. We have to measure plant community changes in response to resource availability. Responses are likely to be slow and will only be detected over relatively long periods. Work on succession and competition probably requires a higher investment than our field can afford and amounts to 'research', rather than routine monitoring. The cost of confidently knowing what changes were caused by weed control could easily exceed the cost of control! Experiments provide the strongest evidence of outcomes. Outcome monitoring gathers evidence to back up the cause/effect relationship that has been assumed between weed removal and the condition of the surrounding native plants. In order to gather strong evidence, one needs to use experimental designs with adequate spatial and temporal

53
controls. Likely alternative explanations for changes in condition could then be discounted. When it is not feasible to establish adequate controls, monitoring of condition at a site is still helpful. This would yield a description of change in the community/species, even if the cause and effect relationships were not proven. The evidence would be too weak for this. It is impractical to conduct rigorous outcome monitoring, i.e. using proper experimental design, for all weed control operations. We are looking for compromise solutions that will provide staff with the means to monitor trends and get some indication of the relationship between weed control and changes in community condition. 4. CONTEXT FOR EXPERIMENTAL WORK We are recommending that outcome monitoring is only carried out for a small proportion of site-led programmes. As a minimum, we recommend that Conservancy or Area staff undertake outcome monitoring on all the largest (most expensive) led control programmes. Outcome monitoring will also be where control aims to protect threatened plants. These are more rules of thumb. It may be more efficient to target our outcome monitoring on a national basis. Monitoring could focus on particular weeds in broad ecosystem types, to provide evidence about impacts for all similar control programmes elsewhere in the country. It might be sensible to devote a few research projects to this idea, which could take some of the pressure off field personnel. For example, pine invasions into tussocklands and shrublands and are the focus of a lot of control work. Pine impacts could be studied in one or two locations and any lesson learnt could be applied universally. 5. CONCLUSION The focus for animal pest control monitoring has moved from looking at animals, to looking at animal impacts, i.e. outcomes. Outcome monitoring is now accepted for animal control programmes. Outcome monitoring should show what happens to the native community after weed control. This probably requires experimental controls. Other more circumstantial evidence can be gathered to guide management. We hope to find methods that are robust, simple and cost effective. However, some outcome monitoring may have to be conducted as research projects. 6. WORKSHOP DISCUSSION/FEEDBACK Focusing effort You can not monitor everything all of the time. Outcome monitoring needs to be focused on big programmes. Experimental research can also be done in this type of programme, although it gives stronger data it is more expensive.

54
Result monitoring is used on smaller or weed led programmes(e.g. eradication). The most important thing is to be very clear about what the question/ objective is to start with. Measuring the impact of plants It is hard to assess the impact of plants - they compete for resources and often we do not know what they are. It is not a natural consequence that when you control a weed you will get what you want from the environment.

55
Ecosystem monitoring at Waipapa: where we're at Hazel Speed Pureora Field Centre, Department of Conservation Pureora Forest Park, RD7, Te Kuiti 1. INTRODUCTION The New Zealand Government ratified its signature of the Convention on Biological Diversity in December 1993. The Department of Conservation is the primary agency for implementing this convention in New Zealand and it has therefore adopted biodiversity as one of the predominant themes for its work. The Department has given priority to ecological restoration work. One of the sites chosen by the Waikato Conservancy for long-term intensive management is the Waipapa Ecological Area in Pureora Conservation Park. The three main vegetation associations found in Waipapa are podocarp forest, shrublands and mires. Approximately 70% of Waipapa is forest, more than a quarter composed of shrublands, and the remaining approximately 100 ha is mires. All vegetation types contain species and communities of high conservation value. 2. OBJECTIVE The project was designed as a long-term animal control programme with the objective of providing maximum practicable benefit with minimum risk to those species, biological processes and ecosystems under threat from possums and rats. It follows that these species, biological processes and ecosystems need monitoring in order to be able to assess whether desired outcomes are being achieved by the intensive control of rats and possums. While the monitoring of some species is achievable, we currently do not have the knowledge to monitor changes to biological processes and ecosystems, or know how to interpret any results if we could monitor the systems. We have limited understanding of ecosystem processes, the response of ecosystems to management and the negative impacts our management activities have on native species and processes. The identification of indicators to monitor ecosystem health is urgently required to be able to assess the efficacy of management. In the meantime, by default, we monitor single species as a measure of ecosystem health.

56
3. RAT AND POSSUM CONTROL AND MONITORING IN WAIPAPA In 1995, the Waikato Conservancy initiated an intensive possum and rat control programme at Waipapa Ecological Area. A 150 x 150 m grid system of bait stations was installed. Each line and bait station was marked with permanent markers. After an initial knock-down using 1080 baits in 1995/96 (either pollard in bait stations, or aerial application of 1080 carrot baits), baits in bait stations were used for sustained rat and possum control. Bait stations are now first filled in September each year. The baits are removed and stations refilled on a regular basis until April. In April, baits are removed and not replaced during the winter period, and the bait stations are cleaned. There is also a perimeter line of bait stations at 50 m intervals which is operational throughout the year. A relative index of abundance of rats is determined by the footprint tracking method at 6-weekly intervals. Rat tracking indices declined during the time baits were available, but did not always achieve the target of 8% tracking index for the duration of the operation each year. To monitor possum numbers, an estimate of the residual possum population was undertaken using Victor No.1 traps on random lines set on compass bearings, according to the trap monitoring protocol (National Possum Control Agencies 1997).
The bait station operation has been very in reducing and maintaining the possum population to below the target objective of a 5% Residual Trap-Catch (RTC) rate. 4. INDICATOR SPECIES MONITORING Robins, kokako, kuku/kereru and possum palatable trees were chosen as indicator species. 4.1 Robin monitoring Robins have been suggested as an indicator species to represent trends in distribution and abundance of other species and ecosystem processes (Froude 1998). They are a useful indicator species to monitor response to intensive rat and possum control because:

57
Robin eggs, nestlings and brooding females are subject to predation at the nest -a characteristic of rare forest birds. An increase in the number of pairs, and improved nesting success are good indicators of the effectiveness of pest control programmes.
Robins are reasonably abundant, therefore a good sample size can be obtained.
Robins are approachable and not secretive, therefore they can be easily seen and
monitored. Robins have small adjacent territories, therefore time is not spent walking long
distances between territories. Nests can be found, therefore nesting success can be monitored and chicks banded
in the nest. Robins can be trained to appear for a food reward, therefore little time is spent
searching for them. Objectives of the robin monitoring programme 1. To monitor the numbers and total breeding success of robins at Waipapa, and compare with a non-treatment area to assess whether the decrease in possum and rat numbers has had an effect on the robin population. 2. To monitor robins through the animal control programme to determine the risks associated with the use of poison baits in bait stations. Birds are banded with a unique combination of plastic colour bands and metal bands to: Enable positive identification of individuals.
Aid in the determination of territories.
Provide information on longevity, site and mate fidelity.
There is better nesting success in the treatment than the non-treatment area.

58
There has been an increase in the total number of birds, a decrease in the number of single birds, and a plateauing of the population increases since management commenced in 1995. This suggests that there has been recruitment of young birds into the population and reduced mortality of nesting females.
There is no significant difference between disappearance rates of robins within treatment and non-treatment areas. If there was a higher disappearance rate at Waipapa, then interpretation of the result would need to be made carefully. There are differences between the two areas other than the presence of baits in bait stations at Waipapa. For example, there is a higher density of birds at Waipapa, therefore, a higher disappearance rate may be due to density dependent factors, i.e. it may be more difficult for a bird to hold its territory in Waipapa than in an unmanaged site. Robins indicate ecosystem health by representing trends of distribution and abundance of other species or communities within Waipapa. They are monitored in a 20 ha study site within a treatment area that is now approaching 4000 ha in size, therefore, the robin study area represents 0.5% of the total control area. The monitoring protocols for rats and possums specify the effort required i.e. number of lines, placement of lines) for the size of the treatment area. There are no such guidelines for the robin monitoring work. Is a study area of 0.5% of the treatment area a fair representative of the response of robins to management, let alone the response of the entire ecosystem? 4.2 Vegetation monitoring Objective To determine whether a change in tree condition will occur with intensive possum control. With a reduction in the possum population, a change is expected in the condition of possum palatable species. Methods Standard Foliar Browse Index (FBI) monitoring methods (Payton et al. 1997) are used to give condition scores to canopy, possum damage to trees, fruit and flower abundance. The six possum palatable species chosen for monitoring are:
Five-finger (Pseudopanax arboreus). Raukawa (Raukaua edgerleyi) Fuchsia (Fuchsia excorticata). Kamahi (Weinmannia racemosa).

59
Pate (Schefflera digitata) Mahoe (Melicytus ramiflorus)
According to de Monchy (1998): "The condition of possum preferred species is excellent, and has shown little change since monitoring began in December 1996. An exception to this rule is fuchsia, which has shown an increase in foliage cover of approximately 10% and a decrease in possum browse. All six species monitored show high levels of foliage cover, and very low levels of possum browse and trunk use. Flowering and fruit levels have varied considerably between years, often showing no trend." Possums are having little impact on the possum palatable species (identified above) at Waipapa with the current level of possum control. Therefore, a reduction in possum numbers has resulted in an improvement in the condition of this aspect of forest health. Rats, however, are also one of the target pest species, but there is no monitoring of the impact of rats on vegetation. The bait station operation runs for approximately seven months over the spring and summer months. Possum populations have a slow recovery time and this control regime has shown to be adequate for maintaining the possum population at a very low density. Rat populations, however, are able to recover within four to six months after control. Under the current control regime, the rat population can increase and potentially have an impact on forest health. There is no monitoring in place to assess their damage to the fruits, seeds, Lizards, invertebrates and other animals in the forest. 4.3 Kuku (kereru) monitoring A national programme for monitoring kereru (or kuku), has started recently with annual monitoring in various sites throughout the North and South Islands, including Waipapa (treatment site) and Waimonoa (non-treatment site). As kuku are considered a 'keystone' species, their abundance is thought to be a measure of forest health because of their role in seed dispersal. However, kuku population trends and patterns are not considered to be representative of other species (Froude 1998). The objective of the kuku monitoring programme is to monitor population trends over time at Waipapa and Waimonoa, anticipating an increase in the population at Waipapa. Kuku population trends have been monitored at Waipapa and Waimonoa using a relative index of abundance at fixed listening stations since 1997. Distance sampling was incorporated into this programme last season (1999). Analysis of the 1997 and 1998 data by Rod Hay showed a significant increase in both sites, with the greatest increase at Waimonoa (non-treatment site) (Speed & Burns in prep.). Waimonoa study site was within the boundaries of an aerial 1080 operation in 1997. The biological meaning of the data from both sites is difficult to assess, and more information will be needed to interpret results. Given that this national monitoring is in its infancy, other monitoring techniques have been incorporated into our monitoring programme for comparative purposes. Walking transect counts are made between listening stations, and distance sampling is incorporated into the 5-minute counts at each station. With little extra effort, it is

60
possible to trial more than one method which may facilitate better assessment of changes in kuku abundance. Kaka counts are also made during the kuku monitoring to trial these monitoring techniques on another species. 4.4 Kokako monitoring The Waipapa Ecological Area has been identified in the Kokako Recovery Plan (Innes & Flux in prep.) as one of the key mainland sites to achieve the Plan's long-term goal of kokako recovery. Surveys in 1991 (Meenken et al. 1994) and 1995 (Dodgson 1995) noted the kokako population at Waipapa may be declining. This decline may have been halted under the current management programme as kokako have fledged young (Speed & Bums in prep.). A survey was undertaken in March and April 1999 to determine the status of kokako at Waipapa. A total of 16 pairs and 11 singles were located by the survey team (Speed et al. in prep.). At least nine juveniles were fledged by five of the 16 pairs.
Due to possible sources of error, and differences in survey methods and effort, comparisons between surveys must be made with caution. The proportion of territories held by pairs has increased since the last survey in 1995. The 1995 survey found 22% of the territories held by pairs, a decrease since 1991 when 50%of the territories were held by pairs. The 1999 survey found 59% held by pairs, which indicates that management has been sufficient to allow successful breeding and into the population (Speed et al. in prep.). However, 41% of territories are still held by single birds. Full recovery of this species has not occurred and may be several years away. This may be true of other components of the Waipapa forest ecosystem. 5. CONCLUSIONS Ecosystem monitoring at Waipapa is entirely species focused. Indicator species have been selected to represent trends in abundance and distribution of other species, which are vulnerable to the threats (possums and rats) currently managed at Waipapa. Results indicate there has been an increase in the abundance of the birds monitored (kokako, kuku and robins), and improved condition of possum palatable tree species. However, the effects of rats on the ecosystem during the time rats are not controlled, is not monitored. Furtherore, the impact of threats from other pest species (e.g. mice, hedgehogs, rosellas) is not addressed.

61
We need to develop other techniques for monitoring ecosystems. These techniques may be species focused, or could involve monitoring such as decomposition or nitrogen cycling. There are opportunities for research at Waipapa. We are currently trialing bait types and are involved with the development of techniques for monitoring weta, bats, lizards, kaka and kuku. Looking to the future, the restoration of ecosystems will depend not only on saving what remains, but also reintroducing missing components mistletoe) to restore the missing functional pathways. The challenge remains to understand ecosystems, develop techniques to control/ eradicate pests, to understand the impact control methods have on ecosystems, and, of course, to monitor outcomes to be sure we attain our objectives. 6. ACKNOWLEDGEMENTS Many thanks to all the people who have put their time, blood, sweat and tears into the fieldwork: Fiona Bancroft, Brent Beaven, Rhys Burns, Jaap Knegtmans, Andrea Lord, Ian Marshall, Caren Shrubshall, and Claudine Tyrrell. The bait station operation and rat monitoring was the responsibility of the 'possum crew'. Thanks guys! Special thanks to Ralph Powlesland for the use of his robin monitoring data. And, of course, I am very grateful to the 'Man Behind The Red Pen': Rhys Burns, who has a special talent for turning my chaotic jungle of words into coherent sentences. 7. REFERENCES de Monchy, P. 1998. Waipapa forest condition: 1997/98 season. Unpublished
Department of Conservation Report, Waikato Conservancy. Dodgson,J. Search for kokako in Waipapa Ecological Area 1995. Unpublished
Department of Conservation Report, Pureora Field Centre. Froude, V. 1998. Environmental performance indicators: An analysis of potential
indicators for terrestrial biodiversity. Technical Paper No. 47 Biodiversity. Ministry for the Environment.
Meenken, D.; Fechney, T.; Innes, J. 1994. Population size and breeding success of
kokako in the Waipapa Ecological Area, Pureora Forest Park. Notornis 41: 109-115. National Possum Control Agencies. 1997. Trap-catch for monitoring possum
populations. Version 4.0. Payton, I.J.; Pekelharing, C.J.; Frampton, C.M. 1997. Foliar Browse Index: A method for
monitoring possum damage to forests and rare or endangered plant species. Research Contract Report LC9697/60 for Department of Conservation.

62
8. REPORTS IN PREPARATION Innes, J.; Flux, I. in prep. Kokako Recovery Plan. Department of Conservation. Speed, H.J.; Burns, R.J.; Rufaut, C.; Clearwater, S. in prep. A survey of kokako in the southern portion of the Waipapa Ecological Area. Department of Conservation, Pureora Field Centre. Speed, H.J.; Burns, R.J. in prep. Waipapa Restoration Project. July 1997 - June 1998. Annual Report No. 3. Department of Conservation, Pureora Field Centre. 9. WORKSHOP DISCUSSION/FEEDBACK Measuring ecosystem health Whilst we use indicators to monitor the environment, you can not use that as a guarantee of ecosystem health-it can still keel over because of some unexpected factor. Not everything can be monitored and there is a lot we know nothing about, what are the impacts of hedgehogs; what happens in the winter when our monitoring stops etc. Robin disappearance rates This is high within the treatment area but this is not necessarily related to predation or poisoning, it may be because of increasing density and the bird’s need to move out of the area to get territory. Comparing control/non-control trends Specific numbers are not compared, just comparative trends, e.g. do they both increase, rates of increase/decrease etc. Deer control We have 24 permanent plots there and 3 exclosures. There are deer in the study area and they are an issue.

63
How the Mooloo team interprets foliar browse results Pete Corson Waikato Conservancy, Department of Conservation Private Bag 3072, Hamilton 1. INTRODUCTION
So, what does the table pictured above actually mean? The information is all but impenetrable. How can it be interpreted clearly and meaningfully? Waikato Conservancy presents its data using histograms it is always helpful to visualise the data. These can be used to look for normality, means and trends, and can be easily compared with non-treatment sites. This paper uses a series of graphed results to demonstrate the effectiveness of this type of presentation.

64
2. WHAT HAS BEEN HAPPENING Looking for trends (Figures 3 and 4).
Histogram of changes between years (Figures 5,6 and 7).
Looking at mortality. At what level were the trees that died at last year?

65
3. WHERE THE DATA IS HEADING Think about possum population dynamics (Figure 8).
Look at anomalies (Figure 9) and look for explanations (Figure 10)

66
4. WHEN TO CONTROL POSSUMS AGAIN The Conservancy is in the process of developing targets (trigger points) based on
best information. No more than 5%of trees with a Foliage Cover of less than 25%.
Mean browse score not to exceed one
Mean foliage cover of kohekohe to remain above 55%.

67
5. WORKSHOP DISCUSSION/FEEDBACK Monitoring regimes When trend patterns have stabilised it is possible to cut back on the regularity of record taking and rationalise resources so that they can be put into other areas. Using the results Trend information is valued and used by Waikato managers. They ask for specific information (for business and management planning purposes) and it can be provided by the monitoring team because of the length of time their systems have been in place. It is hoped that other Conservancies should be able to get the same level of support once they have enough information to demonstrate clearly what the outcomes of control/management are.

68

69
Sample size for foliar browse scoring Mike Ogle Waikato Conservancy, Department of Conservation1 Private Bag 3072, Hamilton 1. INTRODUCTION Using foliar cover (Payton et al. 1997) data from Waikato Conservancy, the sample size required to make statistically robust conclusions is considered. It is important to consider sample size for the following reasons. First, to be reasonably certain that you have done enough sampling to make good conclusions about the forest as a whole. Second, so that you do not waste time and money collecting more information than you need. There are six factors that influence what size sample to take:
1. Variation in data. With foliar cover, standard deviation is a useful measure.
2. The type of statistical test being used. We commonly use t-tests and ANOVA (Analysis of Variance).
3. The minimum difference you want to be able to detect. Ten percent was
considered a reasonable figure for this (see example in Payton et al. 1997). If a change of 10% occurs, and this is reflected in changing browse and use scores, and no significant non-possum effects have been observed, it is possible to be reasonably confident that the change is a result of possums. A change of less than 10% cannot be so confidently attributed solely to possums. However, this may change with experience with the foliar browse method.
4. Level of statistical significance used in the test. This is the probability of
committing a Type I error (the rejection of a null hypothesis when it is in fact true). Five percent is a commonly used figure (Zar 1996).
5. Power of the test. This is "the probability of rejecting the null hypothesis when it
is in fact false and should be rejected" (Zar 1996). This relates to a Type II error (failure to reject a false null hypothesis). Eighty percent and 90% are commonly used (Snedecor & Cochran 1989). Eighty percent is used in the following calculations, as it was in Payton et al. (1997).
6. How many hours and dollars you have available for collecting data.
1Present address: Chathams Islands Area Office. PO Box 114, Waitangi. Chathams Islands

70
2. VARIATION IN DATA To obtain an understanding of the variation in foliar cover scores, several forests and two tree species (kamahi and kohekohe), were considered (Figures 1 and 2). Where no possum control had been undertaken, or none for an extended period of time, and foliar cover was relatively low, the standard of foliar cover scores was high, usually around 25%. However, in one forest the standard deviation of the foliage cover was 35%.
In forests where possums have been controlled to low numbers for several years, or where there are no possums, the standard deviation of foliar cover scores was relatively low, usually around 10%. The standard deviations for kamahi and kohekohe ranged between 13-26% and 9-35% respectively.

71
3. SAMPLE SIZE To determine the sample size required to reliably2 estimate the mean foliage cover in one year (i.e. one sample), the procedure is undertaken as if a t-test is to be performed against the mean of the sample collected and a hypothetical population mean. The procedure in Zar (1996), Section 7.6, was followed for this and graphed (Figure 3). It can be seen from Figure 3, that if the standard deviation of the foliar cover is 18%, then the sample size required is 29 trees. The procedure in Zar (1996), Section 8.4, was used to determine the sample size required to reliably2 determine if there is a difference between two years of data (i.e., two samples) using a t-test (Figure 3). It can be seen from Figure 3 that, if the standard deviation of the foliar cover is 18%, then the sample size required is 54 trees.
Following Zar (1996), Section 10.3, the sample size required for undertaking an ANOVA for situations of 3-7 years of data (i.e. 3-7 samples) was determined and graphed (Figure 4). The same parameters for reliability2 as given above were used. It can be seen from Figure 4, that if the standard deviation of the data is 18%, and you wish to test for differences between four years of data, then 72 trees are required for an adequate sample size. Note that the calculated required sample sizes apply only to this data set. Use the computational steps outlined within the text to calculate your own required sample size on the basis of the variance of your own data set. 2 'Reliably', in this case, means to detect at least a 10% difference, at the 5% significance level with 80% power.

72
4. CASE STUDY: WAIOMU/TE PURU The Waiomu/Te Puru block is located north of on the west side of the Coromandel Range. It covers an area of approximately 5500 ha. The forest is a mix of coastal to upland mixed broadleaved forest and scrub, with occasional kauri, emergent podocarps and northern rata. The terrain is moderately steep with occasional bluffs and steep gullies. Foliar Browse Index (FBI) monitoring was undertaken in this block in early 1999. The number of trees sampled is presented in Table 1. The number of trees required to make reliable conclusions was determined and are also given in Table 1. The number of trees required is based on using an from four years of data, 5% significance, 80% power and the foliar cover standard deviations obtained in the first year of sampling (except for kohekohe). Kohekohe sample size is based on a standard deviation of 18%. The actual standard deviation for foliar cover was not used, as it was felt that the standard deviation would reduce following possum control. This would result in a smaller sample size being necessary.
4.1. Comparison of Costs and Effort To compare the cost of what was done, and what needed to be done to obtain a reliable sample size, hours and costs were totalled and compared (Table 2). Hours were valued at $35/hour. To obtain a reliable sample would require nearly $5000 more than was actually spent. The figures given for 'monitoring as a % of budget' are an indication only and require effort to be a thorough and correct analysis.

73
5. DISCUSSION An essential requirement for determining sample size is knowing the variation will occur, before you start sampling. This is a 'Catch 22' situation. However, observations from Waikato Conservancy indicate that the standard deviation for foliar cover will usually be between 9% and 27%, and on average are around 18%.Before possum control is undertaken, the standard deviation of the foliar cover is usually relatively high. This reflects that there is a wide range of foliar cover amongst trees. Some with very low, some in between, and some with very high foliar cover. However, once possum control has been undertaken and trees have had time to recover from possum damage, the situation changes. There become fewer trees with low foliar cover and more with high foliar cover. Consequently, the standard deviation of the foliar cover reduces. As the standard deviation increases, sample size needs to increase to maintain reliability. The more groups being tested using ANOVA, the larger the sample size needs to be to maintain power. If the sample size is insufficient to reliably detect a difference then it is important to note this in the report. This can then be used as justification for increasing the effort to obtain an adequate sample size. The figure given in Payton et al. (1997) for recommended sample size (i.e. 50 trees) is similar to that determined from Waikato Conservancy data (i.e. 54 trees), for two samples. 6. REFERENCES Payton, I.J.; Pekelharing, C.J.; Frampton, C.M. 1997. Foliar Browse Index: A method for
monitoring possum damage to forests and rare or endangered plant species. Research Contract Report LC9697/60 for Department of Conservation.
Snedecor, G.W.; Cochran, W. 1989. Statistical Methods. Eighth Edition. Iowa State University Press. Zar, J.H. 1996. Biostatistical Analysis. Third Edition. Prentice-Hall Inc.

74
7. WORKSHOP DISCUSSION/FEEDBACK Trunk use It is not that useful for assessing an individual tree, but it is useful when looking at trends over a forest. When looking at individual trees it can have more to do with density of the surrounding undergrowth than possum density. It can be less subjective too. You know that a possum has used the trunk, whereas sometimes it is hard to tell the difference between possum browse and insect damage.

75
Improving information transfer between research providers and users Phil Knightbridge West Coast Conservancy, Department of Conservation Private Bag 701, Hokitika 1. INTRODUCTION The Department of Conservation's (DOC’s) outcome monitoring should be based on scientifically robust methods. Much of the research on outcome monitoring is conducted by agencies outside DOC, mainly Universities and Crown Research Institutes. It is important that the results of this research are made available to potential users. This paper discusses whether that information is currently reaching end-users; uses two case studies to highlight particular issues; and concludes some suggested improvements. 2. IS THERE A NEED TO IMPROVE? Having spent three years working as a technician for Landcare Research on animal impacts in forests, and the past year as a botanist with DOC on the West Coast, I have noted a number of instances when better communication of science projects would have improved the way outcome monitoring was carried out. There have also been occasions when DOC staff have requested research, or spent time working on methods, that are already being addressed by DOC funded research projects. To confirm my perception that there is a need to improve information transfer, I asked the following questions of the DOC 'Habitat Monitoring' e-mail group Are you aware of the following DOC funded projects?:
1. Development of a method to assess the impacts of controlled goat
populations? Method being worked on by Peter Sweetapple and Bruce Burns, Research (Sweetapple et al. 1999)
2. Development of standard method for assessing hare abundance and impacts? Method to be worked on by John Parkes, Landcare Research.
Do you have any suggestions about ways in which information transfer between the
research providers and the users like yourself could be improved? The answers to the last question are discussed in the final part of this paper. The answers to the first question confirmed my impression that many DOC staff working in the outcome monitoring area had little idea of what relevant research was being carried out (Table 1). About half of the Conservancies knew of the goat impact project, which has been since 1992 and is due for completion in June 1999.

76
Most found out through direct contact with the researchers, rather than DOC sources. I was the only person who had heard of the hare work, and I found out about this by talking with the researcher as part of the preparation of this paper. Interestingly, the 'Habitat Monitoring' e-mail group had been queried by Conservancy in September 1998 for knowledge of hare exclosures and monitoring. At that stage no one commented that a research project had been funded for the current financial year. In addition to the answers to the specific questions, of the 17 individual respondents, 13 believed there is a need for improved dissemination of the results of research within DOC.
3. CURRENTLY USED METHODS OF INFORMATION TRANSFER Direct contact with researchers appears at present to be the most method of finding out about current research. Consulting the Advisory Scientist (CAS), an option for most Conservancies, can be but sometimes even they are not aware of some of the research being conducted. The DOC Science Project Summaries are also a useful source of information. However they do not include research commissioned by individual Conservancies, and are only useful once at least one year of a research project has been undertaken. Landcare Research's 'He Korero Paihama -Possum Research News' provides useful updates, summaries and a recent reference list of possum research. Of two more recent tools, the 'Habitat Monitoring' e-mail group has proven to be a useful way of finding out what other Conservancies are up to, but the information provided reflects the knowledge of those users of the group who find the time to respond. The e-mail list of new Science and Research (S&R) publications has enabled staff who wanted it, to be kept up to date with what is published without having to watch the library display or ask CAS. 4. CASE STUDIES: INFORMATION TRANSFER FROM RESEARCH PROVIDERS TO USERS The following examples are my view of the development of two outcome monitoring methods for DOC by Research. I have used these examples as I have a reasonable first-hand knowledge of both of them. It is possible that others involved with the

77
development of these methods may disagree with some of the statements that follow, but the limited number of DOC staff I have discussed this section of the paper with agree that the following is a fair and accurate summary of events. 4.1 Development of the Foliar Browse Index (FBI) method by Landcare Research Development of a repeatable, objective, ground-based method to detect possum impact on trees began in the early 1990s. Early prototypes of the method were by some Conservancies. During field-testing, by both Landcare Research and DOC staff, the method was revised. In 1997 produced a contract report for DOC that described the method and included Excel-based data analysis procedures (Payton et al. 1997). This report was sent to S&R at Head Office and also found its way to those Conservancies that requested it. At that stage, to my knowledge, there was no clear guidance from within DOC as to whether the method should be used in that form. Those Conservancies aware of the method continued to use it, and some modified the method and data analyses to suit their own needs. Other Conservancies that became aware of the method also began to use it. In 1998/99, S&R funded Landcare Research to review the FBI method following its use in the field over the previous two pears. This review included a workshop where users of the technique were given the opportunity to comment on their experiences with the method and the data analyses, and thus contribute to the review. An FBI data collection manual, in a format similar to that of the permanent forest plot manual (Allen 1993) is to be produced as a result of this review. This manual will effectively be a Standard Operating Procedure (SOP) for this method. This example highlights the need for some guidance to field staff as to whether they should trial a new method once it has been released. In this case the researchers ensured that the new method was widely known by providing Conservancies that asked with copies of a contract report. Thanks to the review, the end result will be a standard method for assessing one type of possum impact which users have had the opportunity to comment on. 4.2 Development of a thar impact monitoring method by Landcare Research One of the requirements of the 'Himalayan Thar Control Plan' was that thar numbers will he managed at levels which are "consistent with an ecologically acceptable vegetation and estate condition" (Department of Conservation 1993). Some research to determine thar impacts in tussock grassland had begun in the late 1980s when a few permanent tussock grassland plots were established in one catchment by Forest Research Institute plant ecologists (Rose 1990). Some was made available to (and later animal ecologists to conduct dietary studies to determine which plant species could be used as indicators of thar impact. In addition, monitoring was established on a somewhat ad hoc basis within a range of catchments on both the east and west coasts. The results of about five years of monitoring were summarised in a 1998 contract report on thar impacts (Parkes &Thompson 1998). The monitoring programme was

78
peer-reviewed and a number of improvements were suggested. Using the existing monitoring, and the suggested improvements, a revised monitoring programme was developed in discussions between and DOC. The revised method was field-tested in summer 1999 and has been submitted as a contract report by to S&R (Parkes et al. 1999). The method could be written up as an SOP for monitoring thar impacts in tussock grassland. This example highlights the value of independent review of the development of a new monitoring method. The review enabled significant improvements to be made to the method, and because DOC staff were closely involved in the development of the revised method they were able to implement it almost immediately. This example also shows the difficulty facing users of whose advice to take, e.g. should the users have listened to the plant or animal ecologists? In this case there was discussion between the two, but this is not always the case. Historic divisions between researchers focused on animals or plants should not preclude constructive discussion and debate in the development of new methods. 5. SOME POSSIBLE WAYS TO IMPROVE INFORMATION TRANSFER There were many useful suggestions of ways to improve information transfer made in response to the final question I asked of the 'Habitat Monitoring' e-mail group. This section discusses some of these, and other potential methods of improving information transfer. The DOC Intranet which is becoming available on the new computer system has the greatest potential to ensure information on outcome monitoring methods and new research is available, but only when needed. Thus there should be no information overload. Providing CASs with access to S&R databases of past and current research will enable them to fulfill one of their key roles in providing other staff with advice on the best way to deal with a research need. Currently CASs have access to some of this information, and the possibility of access to the remainder is currently being assessed. (During the workshop it was noted that each CAS is currently preparing a list of all research going on in their Conservancy). Were possible, DOC staff should be able to assist with relevant research field-trips. These trips provide invaluable opportunities to discuss the progress of research, learn new techniques with researchers who are often experts in the field, and maintain DOC staff interest in the work. Recent examples of such trips include: Waikato staff comparing FBI scores with staff in the Waihaha catchment; Pureora; East Bay staff assisting with a project in the Ikawhenua Range on intermittent possum control; and West Coast staff assisting DOC and researchers with of permanent plots determining the impact of cattle grazing in South Westland. Managers need to be made aware by staff of the benefits of such trips. The two case studies discussed highlight the need for clearer signals from within DOC on which newly developed methods should be adopted. This applies to both new methods written up as contract reports and new methods presented at workshops. In the case of DOC research this is probably the role of the Regional Office which is the project sponsor. In the case of work not by DOC, e.g. a new method of possum control

79
presented at a National Possum Control Agencies workshop, there should still be some guidance from Regional Office level as to whether the new method is appropriate to trial. A common complaint is that new research takes forever to be published in an accessible form. An example is a review of hare impacts which is still in the DOC editorial system approximately three years after initial submission. Thankfully over the past year the DOC publication process has been made considerably clearer, and the aim is to process new manuscripts into DOC science publications within an average of nine months. The Chief Science Editor has produced publications, including a 'Manuscript approval procedure and editorial process for DOC scientific publications' and 'Guidelines for DOC science publications' which make it clear the steps authors should take. There is still room for improvement in the speed with which results are released as DOC science publications. As moves towards developing more SOP’s for outcome monitoring occur, the production of these would be sped up if the research provider were required to produce the output in SOP format. The researcher's funding often ends with the submission of the report to S&R and there is no provision for make changes following revision by the DOC editorial process. This problem needs to be addressed by S&R. Although it already happens to some degree, I believe more account should be taken of the level of refereeing a manuscript has received prior to being received by DOC. If it is clear that there has already been independent review, this should automatically speed up the DOC editing process. 6. CONCLUSIONS There is a need to improve information transfer between research providers and
users in the field of outcome monitoring. The DOC will provide method to make information on current research and
available to staff if and when they need it. DOC staff should be encouraged to assist with relevant research field-trips which
currently provide the best method for information transfer. Clearer signals are needed from the project sponsors when newly developed
methods are ready for use. The results of research are becoming more quickly available via the DOC editorial
system but there is still room for improvement. 7. ACKNOWLEDGMENTS Thanks to the many DOC staff and others who took the time to discuss these issues with me during the preparation of this paper. Particular thanks to Campbell Robertson for lengthy discussions, useful suggestions and for timing his leaving so did not have to make the presentation.

80
8. REFERENCES Allen, R.B. 1993. A permanent plot method for monitoring changes in indigenous forests. Manaaki Whenua – Landcare Research, Lincoln. Department of Conservation 1993. Himalayan thar control plan. Canterbury Conservancy Conservation Management Series 3. Parkes, J.P.; Thompson, C. 1998. Impact of Himalayan thar (Hemitragus jemlahicus) on snow in the alps. Manaaki Whenua – Landcare Research Contract Report LC9798/128 for Department of Conservation. Parkes, J.P.; Thompson, C.; McGlinchy, A.; Ruscoe, W. 1999. Best practice monitoring of thar densities and impacts. Manaaki Whenua - Landcare Research Contract Report LC9899/51 for Department of Conservation. Payton, I.J.; Pekelharing, C.J.; Frampton. C.M. 1997. Foliar Browse Index: A method for monitoring possum damage to forests and rare or endangered plant species. Manaaki Whenua Research Contract Report LC9797/60 for Department of Conservation. Rose, A.B.; Allen, R.B. 1990. Impact of Himalayan thar on vegetation of the North Branch, Godley Valley, Canterbury. Forest Research Institute Contract Report FEW 90/32 for Department of Conservation. Sweetapple. P.J., Burns, B.R.; Parkes, J.P. 1999. Assessing the impact of feral goats on forest understoreys Manaaki Whenua – Landcare Research Contract Report for Department of Conservation. 9. WORKSHOP DISCUSSION/FEEDBACK Who do you listen to? Sometimes you get different information from a number of people Research plant and animal ecologists). Research is of most use when a combined approach is taken, and also if DOC has had input into the project too. That way we know where the information is coming from and are happier to take it up. It is an excellent idea to try and get out with the research providers at some stage of process if possible. It would also be useful to have better steerage from someone appropriate within DOC once the research becomes available, e.g. do we take up the researchers recommendation/use the process they developed etc. or not. Publications process The process is slow and it can be difficult to access information on what is happening, what is in the pipeline, interim results etc. The CASs have agreed to make summaries of all research, not just Conservancy research. Ray Pierce (Northland Conservancy) is currently developing the template, but the process will be dependent upon people feeding their work into the database. Reviewing Standard Operating Procedures A review stage is important after a period of trial and before Conservancies get into modifying the system to suit their patch.

81
The involvement of volunteers in the Tongariro/Taupo Conservancy monitoring programme Steve Deverell Tongariro/Taupo Conservancy, Department of Conservation Private Bag, Turangi 1. INTRODUCTION Over the past several years, Conservancy has utilised an increasing amount of volunteer assistance in several aspects of it's monitoring programme. The benefit for the Department of Conservation lies largely in reducing the costs of conducting surveys that otherwise have entailed a prohibitive cost. Other gains are more difficult to define, such as the enthusiasm and added skills that volunteers bring with them. Various concerns relating to the accuracy of data and the investment of time by supervising staff have been found to be less significant than the benefits that are achieved. The Department is becoming increasingly aware of the value of volunteer input over a range of activities and has drafted a volunteer manual - 'Conservation volunteers manual: Guidelines for conservation staff managing volunteers' (Department of Conservation 1998). 2. DOC CONSERVATION VOLUNTEER PROGRAMME GOALS
1. To provide volunteer opportunities so the community can assist in the conservation of New Zealand and historic resources.
2. To provide new opportunities for people to safely experience the natural and
historic environment and to become more sensitive to those values.
3. To support and strengthen links between the Department and:
- Tangata whenua. - Conservation and recreation groups - Community in general
4. To enable conservation tasks that otherwise would not have been done to be
completed through the assistance of volunteers.
5. To enable the Department to benefit from the shared expertise of skilled volunteers.

82
3. WHO ARE OUR VOLUNTEERS? Since 1996, volunteer numbers in the Tongariro/Taupo Conservancy monitoring programme have increased from a total of 6 in 1996 to 35 in the 1999 field season. The length of time involved, the level of expertise and skills required and necessarily acquired, means that not all of the goals outlined above apply to the type of volunteer suitable as part of a monitoring team. The advocacy role that is the basis of many volunteer projects is not a high priority in this instance. A significant number of the volunteers (50 - 60%) who have worked in Taupo Conservancy have been from overseas. Links have been established with universities and colleges in over a dozen countries and they have become the source of the majority of overseas volunteers. Most foreign volunteers are graduates in botany, ecological studies, forestry or related disciplines, who wish to broaden their field experience, New being noted for its conservation efforts. Others use the opportunity to fulfil practical requirements for their studies. The standard of work and skill level of many is impressive, with many displaying advanced plant taxonomy skills. This offsets any slight disadvantage that they might have facing a largely unfamiliar flora. The fact that they need to travel often halfway around the world is testament to their commitment and enthusiasm. Entry requirements for foreigners are covered under Paragraph 8, Visitor Visa Permit Policy for DOC volunteers (New Zealand Immigration Services Manual). New Zealand volunteers have also generally been students or graduates in related fields. For many it is an opportunity to gain first-hand experience with future employment opportunities, or help in deciding a direction of study. For graduates it is often the step beyond university where there is a chance to test, enhance and display skills and qualities with a view to employment at some level. 4. WHY USE VOLUNTEERS? The most quantifiable reason is one of economics. In the field season, over 160 20 x 20 m permanent vegetation plots were established or remeasured by the Tongariro/Taupo Conservancy monitoring team. The use of volunteers supported by up to three permanent and/or contract staff resulted in a per plot cost of approximately $300-400. The remeasurement of 57 permanent plots in the Kaimanawa Recreational Hunting Area in 1999 was conducted at this cost compared to $1000/plot in the 1987 remeasurement. This cost also includes other work carried out by volunteers that is not possible to evaluate on an outcome basis. Over 30 km of belt was assessed for possum and deer browse and insect damage; 48 5 x 5 m goat browse plots were established; and assistance with weed control and threatened plant monitoring was given. Expenditure is based on : The reimbursement of food costs, approximately $10/day/volunteer.
Accommodation costs <$30/week/volunteer.
Field equipment
Transport costs.
83
5. LEVEL OF ACCURACY REQUIRED/ACHIEVED How accurate is data collected by volunteer staff? There is a saying concerning the payment of peanuts and the evolutionary position of those paid. Our experience with the skills, enthusiasm and quality of work of volunteers generally refutes that argument. The accuracy of data collected by volunteers in surveys conducted over the past three years in the Conservancy compares very favourably with surveys undertaken by paid staff. There is no doubt that short-term consistency and accuracy suffers to a small degree. This can be alleviated as much as possible by a distribution of experience. Instead of a steadily increasing level of accuracy achieved by longer-term staff, there is a continual minor oscillation in accuracy. Correct identification of species is not guaranteed by the level of payment and has been noted in the remeasurement this year of several previous surveys. Difficulties with identification lie primarily with herbaceous plants-something not unique to volunteers. From the point of view of botanical value it is necessary to be as accurate and specific as possible. For determining species diversity and distribution it is obviously important to be able to do this. Understorey composition is the component of the standard vegetation monitoring plot that is most to inconsistencies in identification. But what is the most coarse level of identification acceptable for purposes of most monitoring goals? Previous surveys carried out by permanent and contracted staff of the former Forest Service and similar staff in DOC are the basis for many ongoing studies. Understorey data for many of these surveys show that woody plants alone were recorded. The recorded presence of 'moss' and 'filmy ferns' was often the extent of a journey beyond the higher species level. The ability to correctly identify species of 'moss' is to be encouraged and is botanically valuable, but ultimately, for the purposes of analysis, Acricladium auriculatum identified by a volunteer may well be reduced to simply 'moss' in order to make valid comparisons. The limitations of previous surveys are not being used to justify shortcomings in current surveys, but for the level of detail and accuracy to be placed in perspective. Detail in data achieved by teams of staff and volunteers by the Tongariro/Taupo monitoring teamand in many cases, surpass that of comparable surveys. Accuracy depends on the botanical knowledge, skill level and enthusiasm of the individual to learn, not the extent or absence of payment. A number of volunteers in the Conservancy monitoring programme have shown exceptional plant skills (as the Conservancy botanist would attest to), enhancing the skill level of staff and the quality of data obtained. The second component of plot measurement is the overstorey. Due to the more limited range of species it is regarded by most as repetitive and tedious. At the risk of turning volunteers into merely permanent plot fodder, the less experienced field worker is extremely valuable in this role. Because of significant changes that could result from inaccurate data (for instance, changes in basal area due to faulty plot layout or tagged trees not care is also needed. However, from experience of previous surveys, paid, longer-term staff are also not immune from such errors. Subjectively assessed data One situation where care should be taken is when gathering any subjectively assessed data, e.g. when using the Foliar Browse Index (FBI) method (Payton et al. 1997). Recognition of browse, and differentiating between possum and insect damage or attack is often difficult, frustrating and inaccurate. Payton et al. (1997) showed trained

84
observers were no more than 10% of cover, or one class, different 85% of the time. It does require training, practice and familiarity with the variation in the appearance of browse. Initially, a great deal of time is spent on recognition of browse and foliage density scoring, with frequent group assessments held under a tree to maintain consistency and prevent the gradual 'creeping' of scores. In this manner, levels of acceptable consistency can be attained. Monitoring measures change. Standardisation and consistency (stability) in the survey method and indices of measurement is essential. Accuracy in species identification and consistency in subjectively assessed monitoring methods such as FBI is important but, ultimately, the question is: How much inaccuracy is acceptable? Is a potentially slightly less robust result still preferable to no result at all if the survey was not conducted due to lack of sufficient funding)? 6. EFFECTIVE INVESTMENT OF STAFF RESOURCES A necessary component of any programme using volunteer resources is one of training. The level and extent of that training varies considerably with the skills and qualities each programme requires. The time for those skills to be attained also varies with the individual. In Tongariro/Taupo Conservancy, the investment of staff time in training volunteers is considered to be effective given the many aspects of the monitoring programme in which volunteers have been involved. Depending on the individual skills and experience of a volunteer, a new recruit can become a productive member of a monitoring team within several days. In the remeasurement or establishment of permanent vegetation plots there is a variety of roles that require varying degrees of expertise. Overstorey measurement is very effective with two or three people, enabling the training of new team members while they carry out a necessary, productive task. Skill levels are enhanced and degrees of accuracy ensured by a balanced distribution of experience and knowledge. There is undoubtedly an investment of time and energy by longer-term staff in training and supervision of volunteers. Depending on the number of volunteers, their skills and experience, the length of stay, and the frequency of new arrivals, there is constantly some level of instruction of monitoring techniques, plant identification, data entry and field skills. This can he instructive for all involved, as questions asked often lead to a refinement or clarification of methods. At the height of the 1998/1999 field season, there was a peak of 22 volunteers assisting with the Conservancy monitoring programme on several concurrent projects. This demanded a great deal of infrastructure support, from accommodation, transport and field equipment availability to immigration concerns. Ultimately the question needs to asked - is it worth it? Judging by the quantity of data produced, and the quality of that data, we feel that the utilisation of volunteer assistance is an effective and efficient use of resources.

85
7. OPTIONS FOR MONITORING STAFF REQUIREMENTS 7.1 Permanent monitoring staff Current staffing levels are ill-able to meet the demands of the monitoring work that is needed to determine the effectiveness of management practices. The labour intensiveness of collecting raw information often precludes the undertaking of many programmes due to staff and funding constraints. However, increasing levels of accuracy and reliability of data and monitoring methods can be achieved. 7.2 Area staff In many instances, this is little more than a token participation, more valuable in terms of broadening and enhancing the skills base of the staff than in a productive monitoring outcome. Infrequent involvement means that the consistency and accuracy concerns that are an issue with volunteer assistance in monitoring programmes are even more evident and valid. 7.3 Short-term contract staff An effective compromise that adapts to fluctuations in funding, with staff possibly experienced and familiar with survey methods and species. The concerns of consistency are greatly reduced. On the basis of the proportion of paid staff (permanent and temporary) to volunteers in surveys conducted in Conservancy over the previous three years, a five to tenfold increase in survey costs can be expected by the full use of short-term contract staff. 7.4 Volunteers
Pros
Economic feasibility of conducting work that would otherwise not be out due to funding constraints.
Input of sometimes extremely knowledgeable, skilled volunteers.
Accuracy of data. Skilled, trained volunteers obtain effectively accurate data, equalling and often surpassing that collected by more conventional means.
A group of enthusiastic, motivated people generates a stimulating working environment.
Cons
Mobile workforce. Flexibility is needed in scheduling work. Declared commitments of length of stay can vary enormously and be quite imprecise, 3-6 months. A positive way of looking at the mobility of this 'workforce' is that it teaches you to be flexible and improves your planning skills.
Continual process of training (depending on number of volunteers, length of stay
and pulses of recruitment) Accuracy of data. Potentially less reliable and consistent than from longer-term,
experienced staff. Subjective measurements, e.g. FBI, need to be re-calibrated regularly to prevent
'creeping' of scores.

86
The draft 'Conservation volunteers manual' (Department of 1998) describes the limits on volunteers replacing/supplanting staff. Does the use of volunteer assistance create an attitude of reliance upon volunteers at the expense of the need to develop a skilled, experienced staff level? Experienced, long-term staff are essential in a field that deals with the measurement of changes and long-term results, but there is definitely a place for volunteers in many aspects of the Department's monitoring programmes, for the benefit of both. 8. REFERENCES Department of Conservation. 1998. Conservation volunteers manual: Guidelines for
conservation staff managing volunteers (draft). Payton, I.J.; Pekelharing, C.J. Frampton, C.M. 1997. Foliar browse index: monitoring
possum damage to forests and rare or endangered plant species. Manaaki Whenua – Landcare Research Contract Report LC9697/60 for Department of Conservation.

87
The hows, wheres and whats of outcome monitoring Kate McNutt Northland Conservancy, Department of Conservation PO Box 842, Whangarei 1. COMPLETING THE INFORMATION CIRCLE
1.1 Setting outcome
monitoring objectives
For example, this was the objective we set for the Breamhead and Waipoua Vegetation Monitoring projects: "To achieve an improvement in ecosystem condition as measured by the Foliar Browse Index": 85% or more of sampled trees with no possum browse or possum use
90% or more of browse scores in the 'light' category.

88
1.2 Know your clients Who are your target audiences?
Field staff. Area Managers. Conservancy Advisory Scientist Media. Iwi
What role do you have with these clients?
Operational. Delivery. Strategic.
What information is most useful to your clients? Take the time to find out. Clarity is the key. 1.3 Establish informal communication networks Informal communication with key contact people can be very beneficial. It is an opportunity to provide and receive immediate feedback and this can help build sound working relationships. However, sometimes too much time can be spent dealing with personalities rather than issues, and issues raised do not necessarily progress. 1.4 Formal communication Formal communication, following up informal contacts, can take several forms. It is important to establish what are the correct and most effective reporting protocols.
Reports Presentations Memos Meetings.
Before you finish you may well have completed a whole 'package' of formal it can often take longer than you think! And that is just within your Conservancy. Information should also be communicated to:
Relevant agencies. Other Conservancies
1.5 Information storage Databases are excellent to store large volumes of information and are often easier than spreadsheets to manipulate (e.g. for analysis/identification of trends etc.). But:
The initial setup dictates how information is stored and how easily it is accessed. They require trained staff to establish and maintain. They also require a comfortable seat and patience.

89
1.6 Evaluating outcome monitoring objectives Evaluating outcome monitoring objectives provides the information you need to feed back into management systems. For example: The Breamhead vegetation monitoring objectives were reached in 1998. Vegetation monitoring can now be done biennially and bait fills have been reduced. But the Residual Trap-Catch (RTC) must be kept below 3%. At Waipoua the vegetation monitoring objectives were not met, despite the RTC being around 5% for most of the possum control blocks. The question was then: Were the objectives appropriate? Did they need to be changed? 1.7 The future The options for output monitoring can extend beyond influencing immediate management programmes. Monitoring has as important role in planning and strategic direction setting. For example, at Breamhead a range of ‘visions’ are being contemplated and out come monitoring has been identified as needing to become more sensitive (e.g. species specific). Waipoua is being used as a model to demonstrate how outcome monitoring can offer technical support. 2. WORKSHOP DISCUSSION/FEEDBACK Formatting The way your information is formatted is important – too much data presented in difficult-to-understand ways will turn people off reading/assimilating the information. The best thing to do is to find out in advance what tables etc. are useful. It is also a good idea to establish a formal reporting protocol that allows you to make the best of the system (i.e. that works with the limitations in the system, and to follow up all informal contacts with the information you have promised, otherwise you lose all credibility. Maintaining monitoring programmes If the information provided leads to management change it is important to maintain the monitoring programme to assess any change in outcome. Monitoring can be reduced if a management programme is ongoing and trends become clear. Using FBI data as a trigger At this stage Northland Conservancy does not have enough programmes using FBI alone to use that as a trigger without RTCs.

90

91
Gap/non-gap monitoring: focusing on the forest Bruce Burns Landcare Research Private Bag 3127, Hamilton 1. INTRODUCTION Monitoring systems must provide information directly relevant to the desired outcomes of management. For many forests subject to browsing by goats and other ungulates, management objectives may be to:
Maintain (and improve?) ecosystem structure.
-Ensure that most native plant biomass produced is available to native consumers.
-Ecosystemfocus.
Maintain (and improve?) forest structure
-Monitor mortality rates and ensure that forest regeneration is occurring.
-Plant population focus (canopy trees).
Maintain (and improve?) biodiversity
-Ensure that populations of susceptible (palatable) plant species remain viable.
-Plant population focus (understory shrubs and ferns) A method to monitor forest structure (regeneration) and diversity (viability of palatable species) is currently being trialled in a number of sites including Tawarau Forest in the King Country and Nydia Bay in the Marlborough Sounds. The method is not one that would replace the use of 20 x 20 m plots but could be used in addition to give information on specific factors relevant to plant populations. 20 x 20 m plots give information on broader ecological issues and structures, e.g. mortality. 2. BACKGROUND Forest understoreys represent a highly variable environment. A major component of that variablility is the forest growth cycle. A tree falls creating a canopy gap, regeneration then starts a building phase that eventually leads to mature forest. The regeneration strategy of most trees is to grow into the canopy in a gap. Tree fall gaps have:
High light levels and low root competition. Slips are different as all the soil usually goes too and the process is one of primary succession rather than regeneration.

92
A quick response time and a limited life-span. The canopy will eventually close
over and at that stage the site is of little use. For example, it can no longer be used triggers for renewed control.
A central role in forest regeneration. The survival and growth of seedlings in gaps
is important for regeneration, but note that not all seedlings are equal, many will he irrelevant to forest regeneration.
Features favoured by goats.
Note that non-gap areas are important too. 3. 5 X 5 M PLOTS Gaps are targeted to monitor effectiveness of regeneration as this is where most active regrowth will occur. 5 x 5 m plots were chosen as they fit into gaps in most instances. The plots are set up along a transect wherever gaps occur. The number of gaps set up depends upon what you are trying to achieve. At each site a comparison canopy plot is set up approximately 15 m from the gap and always on the same bearing. The plots are divided into four quarters. 4. MONITORING PLANT POPULATIONS Monitoring can tell us about plant population structure, survival, growth and reproduction. But: It is dangerous to assume that specific plants should be present. For example, more palatable species have been found in a non-hunted plot than one in a hunted area but this could be due to other factors such as rainfall gradients.
There may be uncertainty about what is a desirable population size or structure.
How do populations fluctuate with and without goat populations? 5. CASE STUDIES 5.1 Tawarau Five separate blocks were used:
- Two hunted at setup. - One had been hunted for 10 years. - Two had not been hunted.
Exclosures were established in all blocks.
Equal numbers of plots were established in gap and non-gap situations.
Seedling density and growth of tagged seedlings were followed over four years.

93
Seedlings smaller than 30 cm were counted in each quarter of the plots but this did not show up any consistent information. The dynamics did not seem to relate to browsing or the canopy cover. Pellet counts were made in each quarter but the total data set ended up quite small and inconclusive. Instead pellet counts were made along the line of the transect.
5.2 Nydia Bay All the blocks covered around Nydia Bay had been hunted. Seedling density and diversity increased over four years at all sites including those under the canopy, but growth was greater in the gaps. The canopy doubled over the gaps with no change where the canopy was already present.

94
6. WORKSHOP DISCUSSION/FEEDBACK Species diversity Diversity was greater in the gaps the composition very dependent on light Time required It took a day to establish and measure two-three plots if you were just measuring seedlings over 30 cm. Less time was obviously required for remeasuring the plots. Plots were reassessed every two years. Plot independence Since we were looking at the impact of goats it would need to be done in a huge forest to get independence - so it was not something that we sought.

95
Part 2. Conservancy presentations The aim of this part of the workshop was to gain an overview of the scope of the Department's pest control and restoration management programmes and the associated outcome monitoring undertaken as part of this management. All the presentations were divided into two sections. Section 1. Scope of Conservancy pest control and restoration management. Each Conservancy has provided an overview of their pest control and restoration management programmes and the associated outcome monitoring and/or a summary table for quick reference. Tables detailing Conservancy pest control operations and outcome monitoring are contained in Appendix 3. Section 2. Understanding the benefits of outcome monitoring - presentations of Conservancy results from outcome monitoring. In this section the Conservancies provide a broad overview summarising the results of their outcome monitoring programmes, present a case study, and discuss the issues and opportunities they face with regard to outcome monitoring.

96
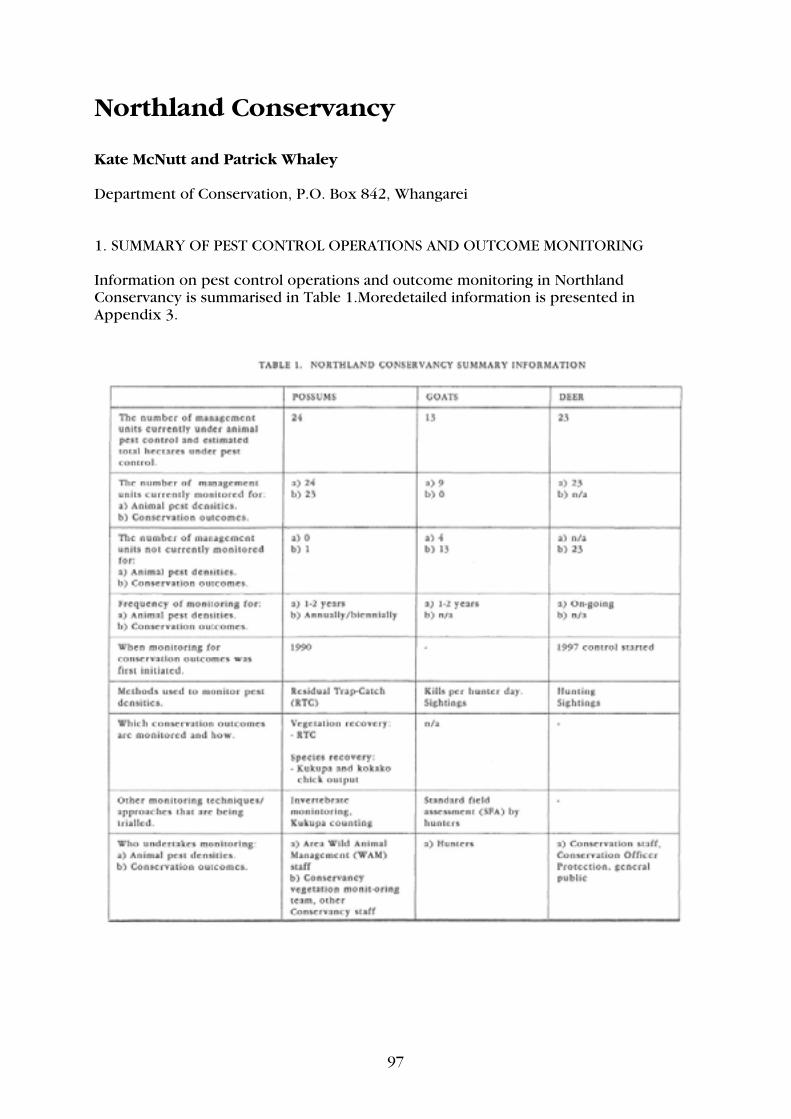
97
Northland Conservancy Kate McNutt and Patrick Whaley Department of Conservation, P.O. Box 842, Whangarei 1. SUMMARY OF PEST CONTROL OPERATIONS AND OUTCOME MONITORING Information on pest control operations and outcome monitoring in Northland Conservancy is summarised in Table 1.Moredetailed information is presented in Appendix 3.

98
2. OVERVIEW OF OUTCOME MONITORING 2.1 Introduction There are many examples of outcome monitoring occurring in Northland which can be generally classed into two types: Species monitoring
Kiwi. Chick survival and population census, e.g. operation nest-egg, nation-wide kiwi census.
Kukupa. Chick output and survival, e.g. Motatau, pest indices and chick output used to guide management.
Kokako. Breeding pairs and chick output, e.g. Mataraua, Puketi, pest indices and chick output used to guide management.
Seabirds and Population dynamics and chick survival, e.g. population response to removal of kiore
Kauri snails. Age structure and population census, e.g. population response to different possum and rodent management regimes.
Offshore Islands. Provide a baseline to management sites, e.g. Three Kings. Habitat (large-scale) monitoring
Forest Response "Health". Foliage Browse Index (FBI) is used to monitor status of palatable species in the canopy of 23 forests in Northland.
Bird populations. 5-minute bird counts broadly monitor bird
numbers/populations and trends in five large tracts of forest.

99
2.2 Case study: vegetation monitoring in Waipoua Forest
Objective Currently driven by pest densities, e.g. improve forest health through pest removal.
Outcome monitoring Forest Canopy, using FBI.
Northern rata.
Kokako.
Kukupa numbers (trial).
Bird numbers with 5-minute bird counts.
Kiwi populations with call counts. Vegetation Monitoring History
A programme was set up in 1990 to monitor a large-scale 1080 aerial operation.
Results were for five years with no additional possum management.
Management changed in with no change in vegetation monitoring. Monitoring review In 1998/99 the vegetation monitoring programme was reviewed. The conclusions of the review were:
Need to remeasure in summer.
Need to put in additional monitoring lines.
Ensure involvement of Area staff.
Need to relate vegetation monitoring to Residual Trap-Catch (RTC) and possum management.
Data should be representative of entire forest. Vegetation monitoring sampling Involved consideration of:
Aerial photos.
Vegetation types.
Current possum management.
Spatial distribution - altitudinal variation.
Accessibility.
The monitoring lines took 17 days to establish and remeasurement takes 8-10 days.
How is the information being recorded? Standard field forms:
-Transect details, e.g. location map. -Tree details, e.g. FBI information, plot details

100
Data entry/storage into database: -Field forms filed. -Current information on each forest stored in office. -Effort is being made to get Waipoua information onto GIS
Analysis/interpretation
Confined to the last two years.
Interpretation can be by possum block, vegetation type, or forest .
Looks for trends.
Communicating information Immediate informal communication
Reports targeted at: Wild Animal Management Supervisor, Field Centre Manager, Area and Technical Support Unit (TSU) Manager.
Geographic Information System: ARC view (RTC, kiwi numbers, FBI, bird counts, bird distributions, vegetation types).
How is the information used? To assess vegetation response to management
To guide possum management
To enable comparison of trends between forests
Using Waipoua as a model to demonstrate how outcome monitoring can support forest/habitat management.
2.3 Issues, problems and opportunities Historical problems and issues
Weakness in the experimental design: -Site selection, e.g. not in areas managed by the Department of Conservation (DOC) and along roads.
-Remeasurement timing, e.g. Bream Head moved from September to April over five years.
-Tree selection, e.g. large % non-palatable species.
-Observer variability, e.g. results unreliable from year-to-year.
-Limited history of communication, e.g. collection of data for collection's sake. Current problems and issues
Attitudes: -Changing Managers' focus from pest densities to conservation outcomes.
Fragmented nature of possum control in Northland:
-No aerial operations.

101
-Continually changing management, i.e. vegetation monitoring does not reflect management. -Restricted poison use in some areas, e.g. only Feratox used in Te Paki.
Outcome monitoring resources stretched too far
Solutions
Standardising experimental design: -Slow process of improving monitoring in each forest
Observer consistency:
-Vegetation monitoring team formed 1998.
Establish a reporting protocol: -Accept that it is a gradual process.
Resource limits:
- Realise there are limits.
-Provide quality not quantity data. -Sample subsets of representative forests.
3. WORKSHOP Reporting Main problem is reporting and using results effectively. Historically information was collected for information’s sake and not tied into management systems. That is why we are currently focusing on Waipoua as it has the most robust pest management strategy-a 5-year plan that we can tie in with. Trends Because previously collected data was inconsistent and the systems used were not sensitive enough to pick up changes, Northland does not have any good trend information. Therefore we are currently doing most monitoring annually, using current methods, at least until our trend information stabilises.

102

103
Auckland Conservancy George Wilson Department of Conservation, Private Bag 68908, Newton, Auckland 1. SUMMARY OF PEST CONTROL OPERATIONS AND OUTCOME MONITORING In Auckland Conservancy the focus is currently on actual pest control and there is little outcome monitoring done. What is done is not currently used to influence management decisions. Possum control in the Auckland Conservancy is undertaken in high priority reserves in conjunction with the Regional Council. The selected areas are primarily the larger blocks of less common and vulnerable forest types. The results of the possum operations are monitored, but currently the conservation outcomes are not. The sole goat control project is the eradication of goats from Great Barrier Island. Goats have been culled over the last 10 years moving in a southerly direction down the island. A project manager is about to he appointed to advance the programme through managing a hunting team, collaborating with the Regional Council and liaising with public. Results are monitored by rehunting areas with the target density being zero. Auckland Conservancy currently has no formal deer control policy. We are looking at moving toward a 'no wild deer' policy similar to Northland's but this is complicated the issue of the recreational hunting fallow deer herd at Woodhill. Multi-species pest control is undertaken as part of threatened species protection work (kokako, fairy tern and brown teal). At the kokako site, possum and rat numbers are regularly monitored to confirm pest densities do not exceed thresholds established via kokako 'research by management'. Breeding success of all the threatened bird populations is monitored, but currently this information does not influence the amount of control the site is to receive in subsequent years. 2. WORKSHOP Monitoring impact of predator control on specific species Monitoring of these species is based on chick survival but this information is currently not tied back into management planning. This should change in the next year or so. Buffers Control work done in association with the Animal Health Board/Regional Council includes large buffer zone around reserves. So, of the total area covered, only a small percentage might be public conservation land.

104

105
Waikato Conservancy de Monchy and Pete Corson Department of Conservation, Private Bag 3072, Hamilton 1. SUMMARY OF PEST CONTROL OPERATIONS AND OUTCOME MONITORING Information on pest control operations and outcome monitoring in Waikato Conservancy is summarised in Table 1. More detailed information is presented in Appendix 3. 2. OVERVIEW OF OUTCOME MONITORING 2.1 Introduction Waikato has three full-time, Conservancy-based monitoring staff. Monitor outcomes of Wild Animal Management operations. October-April field season. Mainly use Foliar Browse Index (FBI), 20 x 20 m plots, rata view, aerial photography and bird monitoring. The aim is to produce an interim report for Area Managers within three weeks of field-work and a full report with recommendations between May and September. 2.2 Case study: Whareorino Forest This 17,000 ha forest is the fifth priority of 30 Waikato forests. Objective Protect mixed forest from possums and restore forest understorey. Outcome monitoring
9 FBI lines, kohekohe and kamahi
14 rata view sites - 127 trees monitored.
12 aerial photography sites.
Three paired 20 x 20 m plots, fenced vs. open
Photopoints.
22 person/days field-work.
Did we over do it??

106

107

108
Results FBI worked well. Improved foliage cover in key indicator species (kohekohe) and
lowered possum impacts (note deaths were recorded).
Rata view monitoring showed no real changes in condition. Some trees died.
Aerial photography showed an improvement for two years after possum control.
20 x 20 m plots and photopoints showed small increases in goat preferred species since 1996 (when goat control began). Full remeasurement is due in 2001.
We achieved our general objective but we need to make it more specific for the
future. Project Review Outcome monitoring at Whareorino has:
Shown that animal pest control is working
Delayed the maintenance possum control until 2000.
Given a sound basis for Wild Animal Management decisions 2.3 Case study: Te Mauri o Moehau This 4000 ha forest is the highest priority of 30 Waikato forests. Possum numbers built up in the 1980s and they have been trapped since 1989. In addition, Talon has been used (biennially) in Philproofs since 1995. The possum trap-catch rate is about 1.5%. Goat control has been in place since 1981. Objective Ecosystem and threatened species recovery. Results
FBI and rata view results showed a healthy canopy, with little change. Similar scores to islands.
Understorey photopoints showed some improvement.
Vegetation now on biennial monitoring regime.
Bird counts were in 1999, alternating with FBI and rata view.
Co-target rodents from 1999/2000.
A 10-year plan (based on 'visions') is being prepared with specific objectives.

109

110
Project review Outcome monitoring at Moehau has:
Shown that vegetation is in good condition and stable.
Changed objectives (co-target rats to protect fauna).
Added more sensitive indicators
Justified high level of funding in the Business Plan.

111
2.4 Conclusions
FBI works well in the Waikato -2171 trees monitored!
Rata view monitoring does not respond as quickly as FBI but it is better for emergents. Averaging categorical data can be useful.
Ungulate impact monitoring needs improvement -5 x 5 m plots perhaps.
Fauna monitoring increasing.
Sensitivity – mahoe (low), rata (moderate) or kohekohe (high) ?

112
2.5 Issues and opportunities
Non-specific objectives.
Reporting: the monitoring team aims to produce an interim report for Area Managers within three weeks of field work completion and a full report with recommendations between May and September.
Data storage (7-year datasets).
Datasets are too small or not independent, random or representative
Opportunities to extend work into wetland areas.

113
Bay of Plenty Conservancy Dale Williams Department of Conservation, P.O. Box 1146, Rotorua 1. SUMMARY OF PEST CONTROL OPERATIONS AND OUTCOME MONITORING 1.1 Goat control Bay of Plenty (BOP) Conservancy administers a total of 171,000 ha of public conservation land. Sustained control for goats is carried out on approximately 70,000 ha (41%of the total area). About half of the management units (48,000 ha) received some form of control in 1998/99. In the BOP, goat numbers are low and we are dealing with them wherever they occur. To use the weed strategy terminology, we are treating our goat control as 'species led' rather than 'site-led' pest control. For this reason we have not put a great deal of effort into defining protection goals for goat control. We could use a general goal of protecting biodiversity or understorey regeneration, however we are not currently measuring these values. There is a need to monitor the outcome of goat control in terms of its on regeneration. Note Keith Broome's example (see these proceedings) of how goat hunting resources can be allocated on the basis of this information. At present we are hoping to improve the information we have on goat hunting effort (hours, days or weeks per goat kill or sighting) to get a better idea of goat density in each management unit. A year ago we worked with Wayne Fraser from Research who was testing a method to assess the percentage reduction in goat The technique involves using random grid-squares to start hunting. The time spent, area covered and the number of goats seen or killed during a minimum of five hours hunting is recorded. Ten percent of hunting hours is allocated at the start and at the finish of the operation, to the monitoring technique. Unfortunately, the method does not work in low-density goat populations (you get too many zeroes in the initial data set and can not get a percentage reduction). But the technique does have some merit as a standardised encounter/kill rate assessment. Over the last two years we have used the method in the Kaimai Range to assess goat density and distribution (maps that are completed by the hunters to show the area covered and goats encountered). This work was in showing that goat numbers are very low in the Kaimais. It also confirmed that no new areas of goat infestation had been overlooked during our normal hunting programme (i.e. goats were confined to the traditional ('hot spots'). The survey also provided useful baseline information on other pest species, including wild cattle and deer. A recommendation is that the Department should look into this method further as a standardised goat monitoring/indexing technique. If nothing else, the method of recording hunting effort should be adopted nationally as it is more refined than the system we used in the past that involved kills/unit effort.

114
1.2 Possum Control The BOP possum control programme covers only 9500 ha (6%of public conservation land within the Conservancy). The majority of our management units are less than ha and many of these aim to protect northern rata or pohutukawa. Trap-catch monitoring is carried out in most management units. We have Foliar Browse Index (FBI) plots in several management units but have not been collecting the data long enough for it to be used to influence management decisions. A lack of staff with the time and skills to carry out, document and analyse vegetation monitoring data is a major problem in this Conservancy. Our most recent FBI plots were established on contract by DOC Waikato staff. We have also tried a number of vegetation monitoring techniques, including aerial video (carried out by Gordon Hosking of Forest Research Institute) and photos of individual rata, but this work has largely remained unanalysed. Some useful work has been done with rata firstly by Gordon Hosking then by an Otago student. We have continued to collect the litterfall samples, but it is a very brain-numbing and time consuming task to sort and analyse the samples. Our most basic form of monitoring of forest health is an annual aerial inspection from a fixed-wing aircraft carried out by our staff from Whakatane. This Field Centre administers several sites which contain a high component of pohutukawa (canopy damage on pohutukawa is quite conspicuous from the air). Notes are recorded during the flight and areas of damage are recorded on maps or aerial photos. This may sound crude, but as long as at least one observer has carried out the survey previously it seems to be repeatable and provides a worthwhile overview. The protection of kokako has also been a major focus of our possum control. We have good information on the results and outcome of this work as part of our involvement in the kokako 'Research by Management' programme (see later case study presentation). 1.3 Other pest species Predator control work is carried at a couple of sites along the BOP coastline (to protect NZ dotterel) and we are currently investigating the impacts of predators on at two sites at Whirinaki. Kiwi occur in several of our possum control management units, including a dense population adjacent to our rata block at Minginui. Dama wallabies are a major pest in the BOP. We are in the process of developing a strategy for wallabies to help us to set control priorities. It would be designed along the lines of the 'National Feral Goat Control Plan' (Department of Conservation 1998). Sites will be ranked according to their conservation values and their proximity to the margin of feral range. We are currently planning a 1300 ha aerial poisoning operation for the Okataina Scenic Reserve. Monitoring techniques for wallabies are limited. We will be using cleared plot pellet counts for our result monitoring and permanent 20 x 20 m plots for outcome monitoring. The 5 x 5 m vegetation plots that have been used for monitoring goat impacts (Sweetapple et al. 1999; see Burns, these Proceedings) may be useful for monitoring wallaby impacts. This warrants further investigation.

115

116

117
2. OVERVIEW OF OUTCOME MONITORING 2.1 Case study: kokako 'Research by Management'
This case study comes from the kokako 'Research by Management' (RBM) experiment. I chose this example as I believe RBM or 'adaptive management' is an excellent tool, in that you can learn about and improve ways of doing things while getting out there and doing it. The results of this work are documented in Innes et al. (1999).
Every management action has the potential to act as a perturbation experiment provided some basic are followed:
First you need a sound hypothesis to test. In this case it was: "maximum practicable introduced mammal browser and predator control will (in the short term) increase kokako chick output and (in the longer term) density". In some cases the hypothesis may need to be amended part way through the experiment. The kokako RBM experiment originally tried to differentiate the effects of possums as competitors and rats as predators by poisoning only rats. This idea was discarded when we discovered possums were able to get the Talon bait of the Nova-coil rat tunnels. Shortly after this we discovered that possum have feet in both camps anyway (i.e. possums prey on eggs and kill kokako chicks and probably sitting adult females).
Then you need a site or sites to carry out the experiment. This is where the statisticians, scientists and managers start to tear their hair out. It is very hard to keep everyone happy, but a workable compromise is possible. Blocks should be comparable (if possible) and large enough to accommodate the management technique (i.e. it is no use trying to aerial poison 10 ha). Statisticians tend to get uptight about a lack of replication, but there are ways of achieving a reasonably robust yet practical experiment (Innes et al. 1999).
You must be to measure all of the variables that appear in your hypothesis and the monitoring methods must be the same at all sites.
Finally, once you start your management, stick to the 'game plan'. Managers tend to want instant solutions to problems. If things are not going as expected, there is a huge temptation to try out cunning ideas to fix the perceived problems. This will definitely cause the poor sod analysing the results to go grey overnight. If things need changing, wait until the end of the year or season. If you change things part way through you may risk learning nothing.
Meanwhile back to the case study. The kokako RBM experiment had two study areas in the BOP (Rotoehu and Kaharoa) and one in the King Country (Mapara). Hauturu (Little Barrier Island) was used as a possum and ship rat free comparison
(Figure 1).
AtMapara, pest control was carried out each spring/summer for eight years. At Kaharoa pest control ran for three years between 1990 and 1993. At Rotoehu we used remote time-lapse video cameras to monitor nests (without pest control) in an attempt to figure out who were the 'baddies'. A year after pest control stopped at Kaharoa, control started at Rotoehu (switching treatments greatly increasing the strength of inference from the experiment).

118
Animal pests were monitored using tracking tunnels for rats and mice and trap-catch for possums (100 traps, for 3fine nights, on wooden ramps). Mustelids were also controlled/monitored using Mark 4. Fenn traps. The results from monitoring pest numbers were interesting in their own right. For instance we learnt that 90%+ of the ship rats will get tipped-over following an aerial poisoning operation. That is the good news. The bad news is that inside six months the ship rat population will be back to square one. This has serious implications for aerial poisoning operations aimed at protecting birds. To achieve low rat numbers through the bird breeding season, the drop may have to occur during spring. There is still a lack of information about the effect of season/food abundance on the success of aerial poisoning operations, but the consensus of opinion has always been that possum control is most effective when timed to coincide with maximum food stress (i.e. midwinter). This needs further investigation. This is less of a problem with ground-based operations, as an extra pulse of bait can be chucked into the bait stations, mid-season, to keep rat numbers down. The next step is to relate the effectiveness of the pest control to the outcome in terms of kokako output or breeding success, i.e. 'dead furry things' resulting in 'warm fuzzy things'. If you refer back to the hypothesis you will see there are two key attributes of kokako productivity that need to be measured. These are chick and population density. Chick output (or breeding success) is measured at the end of the breeding season and is the most sensitive indicator (i.e. you may see an immediate response following pest control). It is also the best indicator to sell to the public (i.e. maximum benefit on the warm fuzziness scale) The definition for breeding success used during the RBM experiment was 'the percentage of kokako pairs that successfully fledge young'. Unlike a lambing percentage, there are no extra brownie points for pairs that fledge two or more chicks. At the end of three years pest control at Kaharoa, breeding success had reached 80% which is incidentally the same as we recorded on Hauturu where there are no possums or ship rats. As soon as control was switched off, breeding success declined. During the 1995/96 and 1996/97 breeding seasons no kokako chicks were fledged in the study area. In 1997 avolunteer group (the Kaharoa Kokako Trust) picked up the task of carrying out pest control - breeding success immediately picked up to 25%, followed by 50% over the last season. Things are not so straightforward when we look at the breeding success at all of the RBM sites. At Mapara the response was much slower than at Kaharoa. It took six years to reach the same peak that was achieved in three years at Kaharoa. On the face of things the situation at Mapara in 1989 did not appear too bad. However it turned out that most of the pairs (12 of 16) contained 2 males. As female kokako carry out all of the incubation they are much more vulnerable to predation. Hence the gender imbalance. So despite their best intentions (some pairs even built nests) it was biologically impossible for these pairs to raise young. I guess the take home message here is that things are not always what they seem. The results from Kaharoa alone would indicate that a 3-year pulse of management is all that is needed to inject sufficient young birds into the population to keep it ticking over. However the results from Mapara show that the amount of management required will be affected by the sex ratio of the population. As there are only slight morphometric (size) differences between male and female kokako, establishing the sex ratio is not

119
easy. Managers will therefore need to monitor breeding success to determine if they are getting the desired outcome from the control effort.
Though monitoring breeding success gives immediate feedback (and hopefully good news which is handy for public relations), the bottom line for the long-term survival of the population is adult density. Kokako are long-lived birds (approximately 20 years) and adult survival is good (predation has a big impact on breeding success but there is good beyond fledging). Therefore to sustain the population, killing pests and producing baby kokako is not needed every year. As we all know, resources are always limited, therefore carrying out pest control every year is not financially sustainable. The prolonged continuous use toxins at one site could also cause problems.
Monitoring adult density will provide information that is useful when deciding how long to 'switch off’ control.
To maintain the population, the objective of management must be to keep the total number of adult kokako above a predetermined bottom line. This is obviously dependent upon the size of the area being managed. Population viability analysis, being carried out by the likes of Ian Flux (Department of conservation, Science and Research) and John Innes (Landcare Research), will help to set priorities by determining which populations have good long-term prospects.
Note that pest control at Kaharoa not only increased adult density but also improved the ratio between paired and single birds. By the end of the third year of pest control no territories were occupied by single birds.
Despite my earlier warning about making assumptions, 'rules of thumb' are useful. By graphing pest abundance against the percentage of nesting attempts fledging young, you can determine appropriate target pest densities that are likely to produce the desired outcome.
To get more than 50% of kokako nests to succeed, pest numbers need to be less than 3% Residual Trap-Catch (RTC) index for possums and 3% tracking index for rats. Obviously to get this type of information (a range of outcomes corresponding to a range of pest densities), you have to collect data from a variety of sites or from the same site over a number of years. In the long-term we may be able to save money by monitoring some sites intensively, while using ‘rule of thumb' pest density targets at other sites.
In conclusion:
Adaptive management is a powerful tool that fits neatly with the Department's aim of continuous improvement.
'Learning by doing' is a major advantage, particularly for threatened species management where we do not have the luxury of figuring out all of the issues before we start work (as, the species rapidly disappears down the gurgler).
Science and monitoring are a continuum, and the cost usually increases towards the pure science end of the spectrum (the cost of the monitoring at Rotoehu was about the same as the cost of pest control). We do not always have enough dollars to keep the statistician happy, however with some appropriate scientific input during the planning phase, any management action can be set up to maximise the quality of the gained. In some cases there may be no extra cost; it may simply involve ensuring that monitoring is carried out to a similar standard as operations elsewhere in the country.

120
Most importantly, document what you did and what happened. This applies equally to failures as well as successes. Remember you learn from your mistakes, but how do you expect anyone else to learn unless you tell them about it.
3. REFERENCES Department of Conservation. 1998. National feral goat control plan, 1995 - 2004, a strategy or sustained protection of native plant and animal communities. Innes, J.; Hay, R.; Flux, I.; Bradfield, P.; Speed, H.; Jansen, P. 1999. Successful recovery of North Island kokako by adaptive management. Biological Conservation 87: 201 -214. Payton, I.J.; Pekelharing, C.J.; Frampton, C.M. 1997. Foliar Browse Index: A method for monitoring possum damage to forests and rare or endangered plant species. Manaaki Whenua – Landcare Research Contract Report LC9797/60 for Department of Conservation. Sweetapple, P.J.; Burns, B.R.; Parkes, J.P. 1999. Assessing the impact of feral goats on forest understoreys. Manaaki Whenua - Landcare Research Contract Report for Department of Conservation. 4. WORKSHOP DISCUSSION/FEEDBACK Baseline data Lack of baseline data is a problem. For example old Forest Service records are either missing or there are not enough resources to spend the time retrieving it from the National Inventory of Vegetation Survey (NIVS). FBI information is gathered but there is no baseline to measure it against. Litterfall traps The data analysed is quite useful, but it easier to manage if it is analysed as it comes in, rather than storing it all and it in one hit.

121
Tongariro/Taupo Conservancy Steve Deverell and Sean Husheer Department of Conservation, Private Bag, Turangi 1. SUMMARY OF PEST CONTROL OPERATIONS AND OUTCOME MONITORING 1.1 Introduction Animal pest control operations undertaken in Conservancy are focused primarily on goat and possum control in order to restore and/or improve habitat quality. The Conservancy currently funds possum control of 14 management units (totalling 13,580 ha or 6% of the Conservancy's conservation lands). Possum control operations undertaken by the Department of Conservation (DOC) are prioritised on the national system for funding based on the protection of high priority conservation values. The presence of Bovine Tb within much of the northern and western parts of the Conservancy means that significant areas of conservation lands (totalling 48,200 ha or 21% of the Conservancy's conservation lands) are under effective possum control regimes funded by the Animal Health Board and managed by the Waikato and Wanganui Regional Councils. Tongariro/Taupo Conservancy currently has 9 management units undergoing goat control operations (totalling 20,655 ha or 9% of the Conservancy's conservation lands). Control of historical herds of goats in Erua and Tongariro forests is ranked highly due to the limited distribution of many of the ecosytems protected there and the threat of encroachment into the Tongariro National Park. During the late 1980s the Conservancy sustained new feral populations as a result of escapes from adjoining farms. Major reductions have been achieved over the past 10 years with zero density in the Taupo lakeshore The large scale of the problem and the nature of the terrain in the Erua and Tongariro forests makes eradication an unrealistic option in these areas. Control is carried out by contract hunters with dogs. 1.2 Scope The following paragraphs outline of the scope of monitoring in areas of associated pest control conducted by survey and monitoring staff, Area staff and the Conservancy botanist. Karioi Rahui /Rangataua Forest Rangataua Forest is the focus of intensive possum control operations in a core area and has monitoring systems established throughout the entire tract of forest. The area contains possibly the oldest beech forest in the Conservancy and provides important winter resources for short-tailed bats, kaka, and kereru. A major restoration project (Karioi Rahui) is proposed for this area. The core area of 240 ha surrounding the

122
Rotokura Lakes Ecological Reserve has undergone annual maintenance using ground control techniques since 1993. An aerial 1080 drop occurred in August 1997 over 3100 ha with ground control operations extended to 2600 ha. A survey of 14 possum-palatable species that were of significance as rongoa (medicinal) plants was initiated in 1997/98 on 12 km of belt transects. In excess of 2000 trees of the indicator species were assessed for browse along the transects using standard Foliar Browse Index (FBI) methods from Payton et al. (1997). Ten 20 x 20 m permanent vegetation plots were established within the area currently undergoing control and in a comparable non-treatment area. Trees of all species within the plots were assessed for browse. Results from the survey conducted in 1997/98 showed a mean browse score of one-half or less in the treated area compared to that of a neighbouring untreated area (Martin et al. 1999). In 1999, the study area was extended to include the full sequence of the forest. A total of 40 km of belt transect and 30 permanent plots have now been established. The only naturally viable population of Alepis flavida remaining in the North Island occurs in the mountain beech zone of this forest. Peraxilla tetrapetala is also abundant. Possum control is being extended and monitoring of these populations is being substantially increased in conjunction with the Conservancy botanist. Erua/Mangamingi Forest Erua Forest in the Mangamingi Ecological Area has been monitored for possum impacts since 1996 with the establishment of 12 subjectively located variable area FBI plots. It is the only forest in the Conservancy that is located in the Matemateonga Ecological Area and contains significant stands of emergent rata (Metrosideros robusta). In February/March 1999, a total of 24 20 x 20 m permanent vegetation plots were established along 8 km of transect, with FBI assessment conducted on all trees within these plots. A total of 48 5 x 5 m goat browse monitoring plots were systematically established in association with the 20 x 20 m vegetation /possum browse plots. This method of tagged seedling plots is based on a technique currently being developed by Sweetapple et al. (1999) of Landcare Research (see Burns, these Proceedings). Data gathered for selected seedlings will be used to assess whether viable populations of the 21 indicator species are being maintained. The plots will be remeasured annually. Erua Forest Sanctuary and Buffer Erua Forest Sanctuary and buffer is the site of several Category B and C threatened species, including Pittosporum turnerii, Prasophyllum aff. patens, Ranunculus ternatifolius and Coprosma wallii. Pterostylis irwinii is being proposed for Category A status and a population distribution and abundance survey was initiated in 1999. Ground-based possum control has been undertaken annually since 1994. Browse assessment and monitoring of seed production of P. turneri has been conducted irregularly since 1993, initially by Chris Ecroyd (Forest Research Institute) and subsequently by the Conservancy botanist. Population abundances of Prasopbyllum aff. patens are monitored annually.

123
Kaiapo Bay Scenic Reserve Kaiapo Bay Scenic Reserve is located on the northern shore of Lake Taupo. The canopy of seral forest consists of kanuka (Kunzea ericoides), five-finger (Pseudopanax arboreus), and pohutukawa (Metrosideros excelsa).Possums have been intensively controlled since 1993 with aerial 1080, cyanide poisoning, Talon bait stations and leg-hold trapping. Possum monitoring to assess the response to sustained control was begun in 1997 using subjectively located variable area FBI plots. Aluminium banding was fitted to 21 trees and stems, and will provide comparisons on the effectiveness of possum control in the future. Waituhi/Kuratau Scenic Reserve Dactylanthus taylorii is located at 10 DOC-administered sites and many of the plants are caged. Since 1998, 40 ha of the Waituhu/Kuratau Scenic Reserve have been subject to ground-based possum control and aerial 1080 was applied in 1997. Plant phenology of caged plants has been monitored since 1995 when six plants were assessed. Currently, 28 caged and 12 uncaged plants are monitored biannually in order to establish flowering and seeding success. A survey in 1999 undertaken by the Conservancy botanist showed browse on 7% of caged and 8% of uncaged plants. Opepe Scenic and Historic Reserve Opepe Scenic and Historic contains one of the last remaining stands of largely intact podocarp forest in the Taupo Ecological District. It has been monitored for possum impacts since 1997, using 13 subjectively located variable area FBI plots on over 140 stems. Trapping and ground poisoning has been undertaken since 1993. Results from the 1997 and 1998 surveys showed that there was a general trend for possum impacts to have remained constant or slightly higher. The results from annual trap-catch assessments over this showed a similar trend. A recommendation to increase the control measures was effected in 1998. 1.3 Monitoring in areas currently without active pest control Red deer occur throughout the Conservancy, with sika deer occurring to the south and east. DOC undertakes no active control measures. While intense recreational hunting pressure (300 hunter days/km2, compared to 40 hunter days/km2 nationally) maintains numbers at low-to-moderate densities, deer impact is apparent in most areas, especially less accessible areas. The 57 permanent plots established in the Kaimanawa Recreational Hunting Area (1979/80) were reassessed in 1988, and remeasured in 1998 to quantify these impacts. An investigation of sika deer impacts on high altitude mountain beech (Nothofagus solandri var. cliffitioides) in the Kaimanawa Forest Park is currently being conducted in conjunction with a similar study in the Kaweka Forest Park. A total of six paired exclosures in three sites of low basal area and high deer impacts were established in 1999. Seedlings of mountain beech were tagged and assessed for deer browse. In addition, 33 standard 20 x 20 m vegetation plots were established along transects in mountain beech dominant forest. Paired exclosure plots established in the 1980s throughout the Conservancy are remeasured on a 10-year cycle. A baseline monitoring strategy for Hauhungatahi in the Tongariro National Park, initiated in 1996 was completed in 1998. This will provide information on the status and cause of massive dieback currently occurring in kamahi (Weinmannia racemosa) and totara (Podocarpus hallii).

124

125

126
1.4 Proposed pest control and associated monitoring Possum control is proposed for a core area of a Powelliphanta marchanti population in the southern Kaimanawa Ranges in Monitoring of the distribution and abundance of P. marchanti has occurred since 1992 with the establishment of a permanent monitoring plot in 1994. Surveys in 1997 and 1998 led to the establishment of a second permanent plot in 1998. Monitoring is based on methods developed by Kath Walker (1993). Similar monitoring methods will be used to ascertain the abundance of Wainuia clarki in the Waimarino River Recreation Reserve, and monitor the impact of possum control operations currently undertaken by the Waikato Regional Council. 2. OVERVIEW OF OUTCOME MONITORING 2.1 Introduction Currently, very little historical quantitative information existing within the Conservancy that can be used to monitor the impacts of introduced animals, or provide information on forest health (including biodiversity, forest condition and the mechanisms behind widespread dieback). A programme was initiated in 1996 aimed at addressing these shortcomings in order to provide an integrated approach to forest health monitoring and survey:
Provide quantitative ecological information for managers.
Determine the operational effectiveness of management.
Relate animal densities to impacts on vegetation
General information on ecosystem condition.
Once a comprehensive monitoring programme is fully established throughout Conservancy the focus will turn to remeasurement and maintenance rather than the establishment of new monitoring programmes. Field-workers over the summer of 1999/2000 will remeasure existing permanent plots and transects as a first priority and then establish new plot systems if resources permit. 2.2 Ruapehu Area Karioi Rahui The establishment of additional forest monitoring plots will be undertaken if data analysis determines this necessary. If resources permit a series of grassland monitoring plots will be established in the alpine grass and herb lands above Rangataua Forest. The Ohakune Field Centre will undertake trapcatch assessment for possum. Peraxilla tetrapetala monitoring lines will be remeasured if time permits. Waione Stream, Tongariro Forest A possum browse was established in November 1995, this will be remeasured in November 1999. Trap-catch assessment for possum abundance will be undertaken in May 1999 by a contractor.

127
Taurewa Forest Exclosure plots established in 1995 will be remeasured. A system of permanent monitoring plots will be established in the Corts Creek catchment. A detailed work-plan will be prepared prior to the commencement of field-work. Hauhungatahi Remeasurement of a 20 x 20 m paired exclosure plot last remeasured in 1994 will be undertaken. Remeasurement of a 15 x 15 m paired exclosure established in 1994 will be undertaken. The Ohakune Field Centre will undertake trap-catch assessment for possum abundance. A possum browse monitoring line established in 1996 will be remeasured. 2.3 Turangi/Taupo Area Kaiapo Bay Reserve The Conservancy monitoring team will remeasure a pohutukawa monitoring transect along the lakeshore. Taupo Field Centre staff will undertake trap-catch and provide boat transport for the monitoring crew. Opepe Scenic Reserve Operational monitoring of the effectiveness of sustained Talon bait station possum control using possum browse indexing and trap-catch will be repeated. Taupo Field Centre staff will undertake trap-catch assessment. Kaimanawa Forest Park Mountain Beech Forest Permanent plots and pellet lines established by the New Zealand Forest Service in 1981 in southern Kaimanawa Forest Park will be remeasured from October to December 1999. The series of mountain beech exclosure plots established in 1999 will have their tagged seedlings remeasured in 2000. Peraxilla tetrapetala monitoring lines will be remeasured if time permits. Pukepoto A monitoring team will remeasure a paired exclosure and several permanent plots last remeasured in 1994. Waimarino Reserve, Ketetahi, Pukepoto and Pihanga A monitoring plan for survey and permanent Wainuia clarkii monitoring plot establishment, will be prepared over the 1999 winter. This work will be undertaken if resources permit. If resources permit, large-scale surveys will be undertaken in these areas. This is unlikely unless substantial additional resources are found. The prioritisation order of these surveys will be determined with relevant staff if resources are obtained.

128
2.4 Case Study: monitoring the impacts of goats and ungulates at Mangamingi Forest Mangamingi Forest (approx. 1100 ha) occurs within Erua Conservation Area and is located 15 km northwest of Ohakune. The landscape of flat multidirectional ridges, with gorges incised into the recent mudstone parent material, is drained by the Mangamingi Stream. The podocarp/tawa/rata forest is different to Erua Conservation Area and other forests within the Tongariro/Taupo Conservancy. It is the only forest in the Tongariro/Taupo Conservancy that is located in the Matemateonga Ecological Region. Forest composition is similar to other widespread protected areas throughout the Wanganui Conservancy, for instance Wanganui National Park. Because there was a lack of baseline monitoring information project objectives have not been defined. It is hoped that when baseline information is gained in the future, managers will make higher quality decisions that will improve conservation management. A traverse established in 1997 passes through 12 subjectively-located variable area plots. The plots were designed to monitor the response of key possum palatable indicator species after sustained possum control by DOC. Results from remeasurement of these plots in 1998 indicated intense possum browse (Husheer and Luff 1999). It was recommended that possum control be increased and that the establishment of permanent plots to monitor forest composition would provide useful information. Both there recommendations have been acted upon in the last year. This paper describes a comprehensive baseline monitoring system that was established in Magamingi Forest during February and March 1999. Three transects have been selected from random bearings with origins located in the forest. On these three transects a total of 24 permanent vegetation monitoring plots (20 x 20 m) and 48 goat browse understory plots (5 x 5 m) were systematically established over 8 km. Two goat browse plots were also established in canopy gaps occurring within a 20 m belt along the transect. These gaps, with open canopies caused by tree fall, are important sites for forest regeneration and are vulnerable to goat browse (Atkinson 1963). Methods are based on an integration of techniques developed by Allen (1993) and Payton et al. (1997), and a method under development by Sweetapple et al. (1999) from Landcare Research (see Burns, these Proceedings). The methods section of this manual describes in detail protocols for remeasurement of the plots established in 1999. Objectives The specific objectives of this survey were to:
Describe the forest composition and structure and to est blish a baseline for future monitoring of the forest;
Assess the health and determine the mortality rates of canopy tree species, and
whether regeneration of these species is occurring;
Assess the population viability of a suite of palatable plant species.

129
Methods The methods described here should be used when re-measuring permanent plots at Mangamingi. Data on the composition and health status of vegetation can be used to determine the impact of possums on forest composition. Datagathered for selected seedlings can he used to assess whether viable populations of indicator plant species are being maintained. Goat browse is difficult to distinguish from deer browse in the field and the possible presence of deer browse is recognised. The presence of goats in this forest indicates the likelihood of understorey browse by goats and will be recorded as such. The primary interest of this survey was to describe a baseline for monitoring of animal browse which in the future may include the establishment of paired exclosure plots. Changes in forest composition and structure should be monitored at regular intervals, annually for 5 x 5 m seedling plots and 5-10 yearly for 20 x 20 m permanent plots. Three transect lines have been randomly selected. Plots are randomly located in quantities thought to be sufficient for a representative sample for inferential statistical analysis. This will include variable habitats (gullies, mid-slopes, ridges) and forest types. Transects will be marked by red permolat markers nailed to trees at regular intervals along the transect line. Twenty four permanent plots (20 x 20 m) were systematically located, at 400 m intervals; along the left hand side of the three transect lines (after Allen 1993). Along the same transect lines, 48 smaller goat browse plots (5 x 5 m) were also established (see Burns, these Proceedings). The 5 x 5 m plots will be located at 200 m intervals so that at every second goat browse plot there will be a permanent plot. Where the plots overlap, the 5 x 5 m goat browse plot will be established in quadrat ‘M’ of the permanent plot. Possum browse will be indexed using methods developed by Payton et al. (1997). To avoid an 'edge effect', the first plot will be located 100 m from the start of each transect line, and no plot will be within 100 m of the forest edge or any other plot. Goat browse plot procedure Goat browse plots (5 x 5 m) (Figure 1) are designed to measure, count and index for goat browse on established seedlings (between 15 cm and 200 cm high) of palatable plant species. Plots will be located systematically at 200 m intervals on the three transect lines, and within any canopy gaps occurring within a 20 m belt to the left of the transect line. Palatable species occurring at these sites may be particularly to browse and so are of key interest.

130
The tree and tree fern species included in this survey are:
Weinmannia racemosa Griselinia littoralis Melicytus ramiflorus subsp. ramiflorus Schefflera digitata Raukawa spp. Pseudopanax spp. Coprosma tenuifolia Coprosma grandifolia Coprosma rigida Coprosma lucida Carpodetus serratus Aristotelia serrata Beilshmiedia tawa Dicksonia squarrosa Dicksonia fibrosa Podocarpus hallii Alseuosmia turneri Nestegis cunninghamii Fuschia excorticata Melicytus lanceolatus Eleocarpus dentata
Inside the plots, all of the above existing seedlings are tagged (numbered tree tags are wired around the base of seedlings) and measured (fully extended height, 15-200 Each seedling is located with reference to one offour seedling plot comer markers (a, d, p, m) indicating which quarter it is to be found in. The goat browse on each seedling is indexed using the seven-point scale in Table 2. Data is recorded on a Goat Browse Data Sheet. For each plot, site characteristics will also be recorded based on Allen's Recce plot description procedure (Allen 1992), including: altitude, aspect, slope, physiography, canopy cover, mean top height and ground cover.

131
Permanent plot procedure Permanent plots provide a record of forest composition through measurements and observations of the overstorey, saplings and understorey, following methods by Allen
(1993). The overstorey is also assessed for foliage browse using canopy health indices developed by Payton et al. (1997).
Typically, four people can establish two permanent 20 x 20 m plots in under a day, although this time is variable depending on operators experience, terrain and forest composition. Data from plots are recorded on Plot Data Sheets. Where possible, adverse weather conditions should be avoided as this affects the ability of observers to accurately assess possum browse and tree crown density. The layout of a 20 x 20 m plot is shown in Figure 2.

132
1. Lay a 20 m tape on the bearing from the plot origin corner (M) to corner D.
2. Lay another 20 m tape perpendicular to this baseline at the 10 m mark. This establishes a plot centre line and creates another reference point to aid the accuracy of the plot perimeter.
3. Establish plot perimeter tapes. Tapes should be laid tightly, as well as following the contours of the ground surface. Compromises may have to be made in some plots, but an attempt should be made to keep quarter and plot size constant. In instances where large obstacles prevent the straight laying of tapes an estimate should be made of the straight line distance between plot corners.
4. Plot corners are then adjusted accordingly to maintain a constant plot area.
5. Lay running lines to define the 16 quadrats and to locate understorey subplot markers.
6. Mark the plot corners permanently with triangular markers attached to aluminium pegs. Markers are scribed with the appropriate corner letters (Figure 2). Nail a permolat strip with the appropriate letters on a tree near each corner peg, but outside the plot. Nails should be protruding at least 1 cm to allow for tree growth.
Overstorey Overstorey data includes all trees and stems over 135 cm height, greater than 3.0 cm diameter at breast height (DBH), and saplings (over 135 cm height and less than 3.0 cm DBH). Diameter measurements and health and browse assessments are to be observed and recorded for all trees. Saplings are counted and their abundance recorded. Data recorded on the Overstorey Plot Data Sheets includes: For trees ≥ 3 cm diameter at breast height (DBH), ≥135 cm height:
Tag number
Diameter.
Crown density
Possum browse.
Ungulate browse.
Insect browse
The presence or absence of boring insects.
For trees and stems ≥3 cm DBH, ≥135 cm height:
Sapling count. Diameter The diameters of all stems greater that 3 cm DBH (135 cm overhark) are measured at a fixed position using a diameter tape and recorded by species on the Overstorey Plot Data Sheet.
Attach a numbered 'cruising' tag to each stem to be measured, with a nail at breast height. Leave at least 1 cm for growth.

133
Move away moss or vegetation such as lianes from around the stem just above the tags without removing or damaging the bark. Measure the diameter 1cm above the tag. Keep the tape at right angles to the axis of the stem, as any deviation from this position will increase the measurement. When the plot is on a slope, measure breast height from the uphill side of trees.
Record quadrat code, species code, tag number, and diameter for each tree on
the Overstorey Plot Data Sheet. Record species by abbreviations of the generic and specific names. Usually this is the first three letters of the genus and the first three letters of the species, e.g. Nothofagus fusca becomes Not fus.
Occasionally, the diameter cannot be taken at breast height. Where malformation occurs, the diameter is taken at the nearest point, either above or below breast height, where the stem diameter becomes more regular (Figure 3). When crowning occurs below breast height, the diameter should be taken below the level of branching or nodal swelling. The 'cruising tag' should be attached 1 cm below the point where the measurement was taken in order to that later measurements are taken at the same position.
Record the diameters of dead trees, tag them, and if possible identify the species. If it is unidentifiable write 'Dead' in the species column. Record only trees substantially rooted within the plot. In the few instances where stems are fused or impossible to measure with a diameter tape (e.g. rotten trees), estimate the tree diameter using the standard scale on the reserve side of the diameter tape. Tag, measure and record any epiphytes rooted below breast height that are over the minimum diameter. Identify these by an ‘e’ beside each on the recording sheet. Multi-leader stems (two or three main leaders) are dealt with as groups of individual trees and measured and tagged as 'stems' (Figure 4). The group of stems is bracketed on the Overstorey Plot Data Sheet. In forest where the vegetation has a horizontal growth form, e.g. windthrow, the trees are tagged and measured 135 cm along the stem from ground level, rather than at breast height. These modifications to the standard method of tree measurement are indicated with appropriate comments alongside diameter measurements (Figure 4).

134
Nail the cruising tags and take measurements in a position where they are not likely to be overgrown. That is, do not nail a tag between two leaders that are likely to together in the future. Do not tag or measure tree ferns or lianes - they are recorded as saplings because of the difficulty of tagging these plants. Crown Density Within each plot, the density of each tree's crown and the extent of possum damage in the canopy are recorded using methods described by Payton et al. (1997). The dieback and recovery classes are not used in this survey as data obtained from these scores is only of limited use. Indices for possum use, and flowering have also been omitted to reduce the time taken to measure plots. Estimate foliage cover using the Crown Density Scale. To score crown density, stand near the base of the tree or stem in front of the trees tag, where you have a good view of the canopy foliage. Draw an imaginary line around all stems and branches in the trees crown (top tier only). Using the scale, first determine which of five broad classes (denoted by horizontal lines) best fits the foliage cover within this area. Do not include the trunk or major branches, or foliage below 2 m (i.e. within range of deer) in the assessment. Within that class, select the square which most closely resembles the foliage cover of the canopy. From left to right, the columns on the scale represent a more to less patchy distribution of foliage. Where a tree canopy can be clearly divided into several discrete tiers, score only the upper tier. If trees have been completely defoliated since the previous assessment, check they have died by cutting the bark with a knife to determine whether sap is still present and the cambium intact. Supposedly dead trees have been known to spring back to life. Where a tagged tree is alive but completely defoliated, or has died, record the crown density as indicated in Table 3.

135
Possum, insect and goat browse assessment Scoring browse in canopy and emergent trees requires a good pair of binoculars and an ability to distinguish possum damage to leaves from that caused by insects and other agents (e.g. wind, frost). For most indicator species, possum browsed leaves are characterised by torn edges and jagged leaf stubs. It may not be possible to correctly differentiate between possum and insect browse in every case. Torn edges are a good guide but when uncertainty exists browse can be unclassified (i.e. X). In species such as Pseudopanax arboreus and Schefflera digitata, where possums may eat only the fleshy base of the leaf petiole, look for a carpet of freshly discarded leaves as evidence of possum foraging. Insect damage typically consists of holes and wavy, clean-edged patterns (caterpillars) or straight, finely milled edges (stick insects). Spend no more than one minute looking for browse on any one tree to minimise bias. In contrast to crown density assessment, which is made close to the base of the tree by the tag, the tree can be viewed from several directions. Browsing damage can be more readily distinguished in larger-leafed, shorter species such as Melicytus ramiflorus than in small-leafed, tall species such as Prumnopitys ferruginea. Where possums typically remove whole leaves or young shoots (e.g. Weinmannia racemosa) the severity of browsing, but not defoliation, tends to be underestimated or impossible to detect. When factors other than possum browsing (e.g. frost, wind damage) are suspected to be causing damage to forest canopies, the use of a non possum-palatable indicator species can help determine the extent to which the observed damage is possum-related. Record the proportion of possum-browsed leaves (or in the case of small-leafed species such as Podocarpus hallii the severity of possum-related hedging) canopy using the categories shown in Table 4.

136
Record the proportion of insect-browsed leaves in the whole canopy and the proportion of goat-browsed leaves within goat browse range (<2 m) using the categories shown in Table 5. Record the presence or absence of holes left by boring insects. Saplings Count the number of saplings (>135 cm high, <3.0 cm DBH) in each quarter. When greater than 135 cm high, lianes, Phormium, Astelia, Dicksonia and Cyathea species are counted as saplings. To determine the height of saplings pull them up to their maximum height; that is, the longest branch or stem pulled up to the plants maximum attainable height. Record the numbers of saplings after the tagged tree data on the Overstorey Plot Data Sheets for each of the 16 quarters comprising the 20 x 20 m plot. Understorey Twenty-four understorey (seedling) subplots are measured on each 20 x 20 m plot. These subplots, which are circular with a radius of 49 cm and an area of 0.75m2, are located halfway between the intersection points of the tapes dividing the 20 x 20 m plot into 16 quadrants (Figure 2). The 49 cm radius is measured from the base of the understorey subplot peg and follows the contour of the ground surface (Figure 5). The seedling data are recorded on the Understorey Subplot Data Sheet. Mark each understorey subplot centre with a small aluminium peg stuck into the ground. Attach an orange triangular marker to each peg scribed with the subplot number.
Record separately all species occurring within each subplot. Records on the Understorey Subplot Data Sheet differ for a of height classes. Record woody species less than 15 cm high by present alone. For each woody species greater than 15 cm high, count and record the number of stems within each of the following height classes: 16-45 cm, 46-75 cm, 75-100 cm, and >135 cm trees). Count a woody stem that forms visibly above or on the surface of the ground as one stem, but for a woody plant that forks below the ground surface, try to determine if it is a single plant or not. Record any ferns, herbaceous plants, Carex, Microlaena, Uncinia, Phormium, Cordyline species, lianes, moss, fungi, lichen and grass species by presence in the <15 cm height class. Generally these plants are too difficult to count and ascribe a height class to.

137
Data Analysis Techniques Normal 20 x 20 m permanent plot understorey data does not follow the fate of seedling cohorts. This largely restricts the analysis techniques available to inferential statistics, when assumptions of age structure stationarity and constant recruitment and mortality rates cannot be made. Because the goat browse index follows the fates of individual tagged seedlings a greater variety of analysis techniques can be used. This includes various predator/prey, recruitment and mortality models, lifetable analysis and Leslie matrices. These techniques will allow a greater depth of understanding of the demographic status of plant populations being browsed by goats. Possum browse data is normally analysed with parametric and non-parametric tests. Plot data from permanent plots, and goat and possum browse plots can also be summarised and multivariate methods used to determine the interactions of seedling growth and browse with environmental factors. 2.5 Issues, problems and opportunities Issues and problems
There is a lack of baseline information at Tongariro/Taupo. DOC neglected monitoring for 10 years and is now demanding information. It will be some time before trends can be determined.
We have a lack of money. Monitoring seems to be one of the first things to get
cut-back. Although the Tongariro/Taupo monitoring budget grew from a few thousand dollars in 1994/95 to $85,000 in 1998/99, it will be 51% less in 1999/2000. No other facet of DOC’s work seems to get pruned so easily - even when monitoring is prioritised so highly in the Department's strategic planning.
There is a lack of communication and sharing of information between the
Conservancy monitoring team, other monitoring teams in New Zealand. Tongariro/Taupo Technical Support staff and Area staff.
Opportunities
There is more recognition at a national level of the value of monitoring information.
The number of enthusiastic and competent people available is increasing. These
include graduates, Area staff, Technical Support staff and volunteers.
Development of monitoring methodologies is continuing.
There is an increasing demand by managers for high quality information. 3. REFERENCES Allen, R.B. 1992. Recce - An inventory method for describing New Zealand vegetation.
Forest Research Institute Bulletin 176. Ministry of Forestry, New Zealand. Allen, R.B.1993. A permanent plot method for monitoring changes in indigenous forests.
Manaaki When – Landcare Research, Lincoln.

138
Atkinson, I.A.E. Relations between feral goats and vegetation in New Zealand. Proceedings of New Zealand Ecological Society 11: 39-44.
Husheer, S.W. 1997. Opepe Scenic Reserve, Mangamingi Forest and Taurewa Forest:
ecological survey and monitoring progress 1996-1997. Unpublished Department of Conservation Report, Tongariro/Taupo Conservancy.
Husheer, S.W.; Grove, E. 1999. A permanent plot surbey of forest health at Mangamingi
Forest 1998. Unpublished of Conservation Report, Tongariro/Taupo Conservancy. Husheer, S.W.; Luff, J. 1999. Possum and abundance monitoring at Mangamingi Forest
1998. Unpublished of Conservation Report, Tongariro/Taupo Conservancy. Martin, D.; Husheer, S.; Keys, H. 1999. The benefits of possum control for selected
(medicinal) plants at Rangataua Forest. Ecological Management 7: 23-34. Payton, I.J.; Pekelharing, C.J.; Frampton, C.M. 1997. Foliar BrowseIndex: A method for
monitoring possum browse to forest and rare or endangered plant species. Maanaki Whenua – Landcare Research Report LC9697 for Department of Conservation.
Sweetapple, P.J.; Burns, B.R.; Parkes, J.P. 1999. Assessing the impact of feral goats on
forest understoreys. Manaaki Whenua – Landcare Research Contract Report for Department of Conservation.
Walker, K. 1993. Techniques for monitoring populations land snails. Unpublished
Department of Conservation Internal Report 11. 4. WORKSHOP Monitoring frequency This depends on the methodology used and the pest species concerned. For example, Dactylanthus plots are checked biennially, but other plots are checked every 10 years. Other programmes are operationally dependent. There is very little baseline data as most programmes were only set up in 1996/97.

139
East Coast/Hawke’s Bay Conservancy Andrew Harrison Department of Conservation, P.O. Box 668, Gisborne Lindsay Wilson and Dave Wilson Department of Conservation, PO Box 326, Opotiki 1. SUMMARY OF PEST CONTROL OPERATIONS AND OUTCOME MONITORING 1.1 Introduction The Conservancy has an extensive pest control programme for possums, goat, deer, and rats. Some of the larger programmes, that manage the full suite of pests, include:
Sustained possum control over 55,000 ha of Northern Te Urewera National Park.
Two Mainland Island projects.
Boundary Stream and Northern Te Urewera Ecosystem Restoration projects. Other more specific work includes:
Sika deer control in Forest Park.
Puketukutuku Peninsula (Lake Waikaremoana) kiwi recovery project: mustelid control.
Te Araroa Dactylanthus recovery project: possum and rat control.
Goat control in Raukumara Forest Park. 1.2 Monitoring Outcome monitoring was initiated in the 1960s for deer and goat control, and in the early 1990s for possum control. The formation of the Mainland Island has resulted in extensive monitoring being undertaken in these areas including: Vegetation monitoring
Foliar Browse Index (FBI) lines.
20 x 20 m plots.
Seedling/pellet transects.
Rata photopoints (aerial and ground).
Mistletoe recovery
Exclosure plots.

140
Species monitoring Kokako nesting success
Kokako census.
Robin nesting success.
Kiwi chick survival.
Invertebrate and lizard monitoring.
5-minute bird counts.
Outside the Mainland Islands and the Puketukutuku Kiwi Project, most outcome monitoring focuses on vegetation recovery, e.g.; Possum control
FBI lines (replacing older canopy loss transects)
Dactylanthus flowering and recovery.
Rata photopoints.
Litterfall traps.
Goat and deer control
20 x 20 m plots.
Exclosures
Photopoints
Seedling/pellet transects
Some species monitoring has been carried out but fairly limited, e.g. kokako census, 5-minute bird counts. 1.3 Surveillance monitoring Monitoring of areas without pest management is undertaken on a small scale. Such monitoring has included:
Remeasuring exclosure plots.
FBI lines.
Species census including kokako, kiwi
Assessing pest densities with pellet lines (deer), trap-catch (possums) and
tracking tunnels (rats).

141

142

143
2. OVERVIEW OF OUTCOME MONITORING
2.1 Introduction
Outcome monitoring in the East Coast/Hawkes Bay (ECHB) Conservancy can be classified into three aspects, as follows:
Intensive outcome monitoring There are presently three programmes with associated intensive outcome monitoring: Northern Te Urewera Ecosystem Restoration Project (NTUERP), Boundary Stream Mainland Island (BSMI) and the Kaweka Beech Deer Monitoring Programme. A fourth programme has only recently been established, an ecosystem restoration programme based at Lake Waikaremoana (Aniwaniwa Area Office).
Northern Te Urewera Ecosystem Restoration Project (NTUERP)
At this site we focus on linking outcome and result monitoring as a way of measuring and assessing the effectiveness of pest control techniques we use or have developed.
Table 2 lists indicator species monitored to test the effectiveness of pest control or ecosystem recovery.
Boundary Stream Mainland Island (BSMI) Outcome monitoring is similar in structure to NTUERP, with several key differences, including:
BSMI has a broader monitoring focus (including invertebrate and amphibian monitoring).
BSMI staff/researchers control or study additional pests (e.g. ferrets, goats and hedgehogs).
Kaweka Beech Deer Monitoring Programme This entails measuring the response of different forms of beech forest to various regimes of deer control in the Kaweka. Preliminary outcome monitoring results were discussed in Sean Husheer's presentation 'Monitoring sika deer impacts in beech forest vegetation' (see these Proceedings).

144
Rapid assessment of ecological condition First steps have been taken to develop and implement a technique for rapidly assessing the ecological condition of public conservation lands. This was undertaken on contract by Geoff Walls (1998). The intention is to enable staff with limited monitoring expertise to provide information quickly as a basis for prioritising management across the Conservancy. A preliminary assessment was carried out across nine sites and reported in December 1998. It will be formally assessed and potentially trialled in the coming financial year. Other East Coast/Hawkes Bay lands There is some, limited outcome monitoring across the remainder of the Conservancy. Main techniques used in these outcome monitoring programmes include exclosure plots, FBI, 5-minute bird and photopoints. Most outcome monitoring programmes have a two year history, with data gathered but not analysed to date. There are several new outcome monitoring programmes underway (e.g. Waikaremoana and further sites for rapid assessment). Some past exclosure plot and 5-minute bird count data has a longer history. Some of this has been analysed but has not been actively utilised for decision-making to date. 2.2 Case study: deer and pig control in the Otamatuna Study Area Objective To reduce deer and pig densities within 2500 ha of the Otamatuna Study Area by hunting, and monitoring any changes in seedling establishment and survival, and forest composition. Outcome monitoring Monitoring has been undertaken in the treatment area and a nearby area (Onepu) that has similar control but no Department of Conservation (DOC) hunting. This is the non-treatment block.
Permanent 20 x 20 m vegetation plots (Allen 1993)
Ten established at each of Otamatuna, Onepu and Otere (another non-treatment area that has no pests controlled). Changes in forest composition and seedling survival are after two years, then every three years.
Pellet lines
Four lines (each 800 m long) measured annually in the treatment area, and four treatment area. Uses presence/absence method. Provides an index of deer density through pellet frequency.
Exclosures.
Two in treatment area. Too small in number to be really meaningful, but have an advocacy function and may indicate gross change. Numerous other exclosures exist outside the treatment area throughout Northern Te Urewera.

145
Seedling/Pellet Transects. New method developed by Opotiki Area Office with input from Landcare Research. Designed to be simple effective system for monitoring short-term changes in seedling establishment and survival, and densities. Intensive monitoring using short 200 m transects, randomly located and along random compass directions. Each line bas 20 plots at 10 m intervals. Plots have a 1.26 m radius and total 100 m2
per line. Within each plot the of deer, pig and possum pellets was recorded, plus all hardwood seedlings and selected ferns/vines were counted. Seedlings measured in 5 size-classes. Between each plot a record was made of any animal sign within 2 m either side of the transect. Twenty transects are located within 800 ha in Otamatuna (deer control area) and 10 transects within 400 ha of the non-treatment area. Both areas have similar possum and rat control regimes. Initial measurements were made last year and the lines will be measured annually. Data is collected on a simple field check form. The seedlings/pellet transects appear to have considerable potential as a means of monitoring short-term changes in seedling establishment/survival and low deer/pig densities. The 20 x 20 m plots were not seen as ideal for monitoring seedlings as the 24 seedling plots are all clumped within a small area. Numerous short transects provided excellent and representative coverage of all habitats within the study area. It is hoped that this coverage will be sensitive to short-term changes that might not be detected by other methods. The method is quick (4-5 lines/person day). Pellet count is thought to be accurate because of the large number of lines and consistent search in conjunction with seedling count. The activity record was particularly useful for recording pig rooting. This method may also have application for monitoring goat populations and impacts.
2.3 Issues and problems Staff representing Area and Field Centres in the Conservancy were contacted (as available) and contributed to the following list of problems issues and opportunities. Resources/skills All staff commented on lack of resources. There are also a number of resource 'tools' which the Conservancy lacks and requires, particularly GIS capability. The Conservancy has a strong field skill-base for outcome monitoring, but lacks adequate expertise in or support for statistical analysis. Culture There is a need to create a culture of outcome monitoring in the Conservancy. Many staff see their intuitive skills (which are of great value) as an adequate base for monitoring. Appropriate analysis and reporting will require encouragement and some training. Tools/techniques There is considerable doubt within the Conservancy about the accuracy/value of particular outcome monitoring tools which are touted nationally-particularly FBI and 5-minute bird counts. Outcome monitoring is only as good as the tool/technique and its application in the field. If we are starting with the wrong tools, then we risk a misdirected monitoring system at great expense.

146
Bias/appropriateness of indicators Outcome monitoring in the Conservancy is focused on forest ecosystems. We are generally not thinking about biodiversity values as they are dispersed across the range of ecosystems in the Conservancy and under-allocate management effort (let alone a specific monitoring effort) to other systems, such as alpine or wetland systems. There is some/considerable relationship between our chosen indicators and the information they provide in relation to health/integrity/resilience or overall biodiversity conservation. If these are the goals of management, then this is where we should be directing research effort. Unclear goals Where are we going? In all honesty I suspect we are not sure. We need to be heading in a clear direction, mindful of desired outcomes, with measurable outcome targets. We also need to make sure that we are asking the right questions to answer management goals. Rob Allen (Landcare Research), in his 'Forest health assessment for reporting conservation achievement' presentation (see these Proceedings), introduced the idea of moving toward 'new communities'; that is, evolving ecosystems will always differ from their previous state thus bringing into question notional 'restoration' as it is touted as a goal for many of our conservation programmes. This highlights the need for further thinking and clarification in our god-setting process. 2.4 Opportunities Within ECHB Conservancy, we need to:
Review the current state of our monitoring (learning the lessons we can from the past).
Review the information we are collecting to ensure it is purposeful (asking the
right questions) and that we know how the information will inform management.
Co-ordinate monitoring across the Conservancy (within a national context), including establishment of appropriate information systems to store information and better co-ordinate the planning and management of monitoring programmes.
Opportunities we might consider to strengthen outcome monitoring nationally include: Providing for national leadership and co-ordination We need to be developing Conservancy programmes within a clearer national framework. This might include that we:
Ensure that questions we are asking as a Department will best provide for conservation outcomes in the term. That is, the methods used, the way in which monitoring is implemented, the distribution of monitoring across New Zealand and the way in which that information is collated and reported between Conservancies, must meet our internal information needs in the to-long term (including integration of information between DOC and external agencies).

147
Identify and core components of monitoring between Conservancies that will provide for our external information requirements (particularly in relation to international reporting requirements), and notably co-ordinating our role in implementing environmental performance indicators when these are finalised.
Establish a mechanism (e.g. a national survey and monitoring group) to provide
leadership and a focal point for our 'thinking' as a Department, for example, in relation to research needs and cultural aspects of monitoring.
Clarifying relationships We need to clearly define the relationship between specific 'biological indicators' used in monitoring and 'ecosystem health/integrity/resilience’ or 'broader biodiversity conservation gains'. This is critical so that we can be sure we are working with an appropriate set of pieces for our 'monitoring puzzle'. If we are playing with the wrong pieces, we will build a distorted picture. If we lack all the pieces, we will build an incomplete picture. We need to be visualising the picture we will need in 5-20 years time and channelling resources to ensure that we are collecting the right pieces now. Exploring the bicultural context and the Environmental Performance Indicators Programme What does outcome monitoring mean when considered in a New Zealand-specific context - a bicultural society in which the Treaty of Waitangi has been ratified. This is being considered within the Environmental Indicators Programme, where Maori indicators for the state of our biodiversity (amongst others) are being developed. There may he an opportunity to learn from Maori systems of monitoring (included within the form of environmental management termed 'kaitiakitanga'). For example, Alan Saunders earlier identified the saddleback as a sensitive species used by Maori to measure change in the environment. There may be some responsibility, ethically or legally as a Crown agency, which we should consider. Practical opportunities Two practical opportunities which would benefit outcome monitoring are:
1. Providing support for, or appropriate training in, statistical analysis.
2. Providing a focused programme for upskilling staff, or encouraging upskilling through staff exchange within or between Conservancies, or with other appropriate agencies.
3. REFERENCES Allen, R.B. 1993. A permanent plot method for monitoring changes in indigenous
forests. Manaaki Whenua - Landcare Research, Lincoln. Walls, G. 1998. Reading the signs. Rapid assessment of ecological condition and trend of
conservation areas in Hawke's Bay. Contract report for Department of Conservation, East Coast/Hawkes Bay Conservancy.

148
4. WORKSHOP DISCUSSION/FEEDBACK Impact of monitoring programme in the Mainland Island The programme in the Mainland Island has been very intensive and effective and has helped with decision-making in other areas as well. For example, the study of kokako fledgling survival has given us a handle on what we could expect elsewhere in the Conservancy. Likewise studies into different bait station intensities and locations will prove useful for planning management in other areas.

149
Wanganui Conservancy Astrid Dijkgraaf1, Dean Stronge and Bill Fleury Department of Conservation, Private Bag 3016 , Wanganui 1. SUMMARY OF PEST CONTROL OPERATIONS AND OUTCOME MONITORING Forty percent of the public conservation estate managed by Wanganui Conservancy has some sort of possum control and 26% has goat control. The large possum control operations were undertaken because there was significant damage to the forest canopies. In some places, such as the Matemateonga Range and pans of Mt Taranaki, the canopy was in the process or in danger of collapsing. These areas have a high kamahi component in the canopy. Other species with significant damage are Hall's totara, pahautea (earlier called kaikawaka), and northern rata. Most of the large possum operations are on a 7-year rotation; that is, they undergo aerial 1080 every seven years or so, unless monitoring indicates that an earlier treatment is required. The 7-year rotation is because the then-available data indicated that it would take seven years for the possum population to recover and to start to have a significant impact on the forest canopy again. The goat operations occur annually. Wanganui Conservancy maintains a permanent team of goat hunters that rotate throughout the Conservancy. The chance of actually eliminating goats from any area are remote at the moment due to constant reinvasion from neighbouring properties. Some areas of the Matemateonga Range, that have undergone 1080 possum treatment but have no regular goat hunting, are still deteriorating. Despite increases in foliage cover and fruit production, very few seedlings make it past browse range to replace moribund trees. The forest is showing partial canopy collapse and invasion by unpalatable species, such as pepperwood, with very few canopy species in the seedling or sapling ranges. 1Underlining denotes person who presented paper at the workshop.

150

151

152
2. OVERVIEW OF OUTCOME MONITORING 2.1 Introduction It is very difficult to summarise the current situation in Wanganui Conservancy because we are only just starting up monitoring. In general terms, aerial 1080 drops and other possum control operations have resulted in improved canopy and fruit production. Hunting of goats has increased the density and complexity of the understorey on Mt Taranaki and along frequently hunted areas in Whanganui National Park. Exclosures in the Range still show a difference to the surrounding bush; whether this is due to continued browsing or past history is unclear. Reducing horse number has allowed some improvement in sensitive vegetation areas and healthier horses. Monitoring of pest species at Paengaroa Mainland Island indicated pest species there were lower than the area proposed as the source of North Island robins; hence the transfer of robins could take place. Population monitoring of the highly endangered Sebaea ovata shows a continuing decline, but some possible measures to slow the decline have been identified. 2.2 Case study: rodent monitoring in Waitotara Astrid Diikaraaf, Jim Campbell2
and Norm Marsh2
Objective To monitor rodent density as part of a study on North Island robin survival through an aerial 1080 drop. Outcome monitoring Relative rodent population densities were assessed before and after the 1080 drop using tracking tunnels placed at 25 m intervals. Tunnels were baited up with a peanut butter oil mixture for one night per month. Tracking papers were removed from tunnels the next day. Tracking was only initiated on fine nights. Recording Results were recorded in Excel and updated every month. Data was discussed within the Area Office and Conservancy, in addition to liaison and consultation with Science and Research at Head Office. Project review Science and Research undertook a review of materials and spacing used for tracking tunnels, and included the findings from this study. The data collected also showed that, unlike other studies, the1080 drop in March did not have much effect on the rodent density. It has been postulated that rodents did not consume enough of the Wanganui #7 baits to be lethal. The lack of bait take could be due to a number of factors, including composition, bait availability and time of the year. A new project has been initiated which will test the hypothesis that rodents are more amenable to consuming Wanganui #7 baits in particular seasons. This will involve dropping rhodamine impregnated baits and snap-trapping on a grid once in each season (spring, summer, winter, autumn) for at least two years. The density of bait spread will be kept constant as will the composition of the baits. Rodents caught in snap-traps will be analysed for the presence of Rhodamine. 2 Department of Conservation, Private Bad, Wanganui

153
Wellington Conservancy Philippa Crisp1
and Phil Brady Department of Conservation, P.O. Box 5086, Wellington 1. SUMMARY OF PEST CONTROL OPERATIONS AND OUTCOME MONITORING The main pest species targeted are possums and goats, but do have some rat operations. Control occurs in 29 management units, which cover 188,000 ha. 1.1 Possums
The Department of Conservation (DOC) runs one aerial 1080 operation in the Forest Park each year and 23 maintenance operations in smaller reserves, using brodifacoum in bait stations.
There are also two Regional operations, which use aerial 1080 in two larger reserves - Mt Bruce and Rocky Hills.
Fifteen of the smaller reserves are on the Chathams Islands. The operations there are not fully underway due to staff changes.
Trapcatch monitoring is undertaken in all except one of the management units, in the majority of cases on an basis.
Bait-take is recorded in all the mainland reserves.
Foliar Browse Index (FBI) transects or permanent plots have been set up in all the mainland management units.Chathams Island reserves have a mixture of permanent plots, FBI transects, and areas where walk-through surveys have been undertaken. The five management units without monitoring for conservation outcomes for possums are in the Chathams Islands.
Permanent plots were initially set up in 1994. FBI monitoring started in 1996. Most of the mainland FBIs are assessed annually.
Aim of the 1080 operation is to protect fuchsia; conservation outcome monitoring has centred around permanent plots and FBI.
Control on the Kapiti Coast reserves is mainly to protect coastal kohekohe forest or the Powelliphanta snails; while the reserves controlled in the Wairarapa have rare plant species or titoki that have been impacted by possums.
Chathams Island possum control is to protect the food supply of the Chatham Island pigeon and to improve ecosystem health.
A new, promising technique being trialled is analysis of tawa fruit possum damage.
Main focus of the outcome monitoring is to provide a feedback mechanism for management and this information regularly influences future planning.
1Underlining denotes person who presented paper at the workshop.

154
1.2 Goats
Ground hunting with dogs, mainly in the Conservancy's two largest forest parks: Tararua and Rimutaka.
There has been some success in lowering goat numbers in Tararua Forest Park,
but there are still high numbers in the Rimutaka Range.
At present there is no conservation outcome monitoring undertaken for goats. The main reason for this is that deer are present in all the areas that we have goats. It is hard to determine the outcome of a goat operation while deer continue to browse the area.
Interested in trialling qualitative assessment surveys, but are basically still relying
on kill-rate analysis and hunter knowledge for management decisions. 1.3 Rats
Seven rat management units include three islands that have been cleared of rodents and have contingency plans and annual audits.
Two rat control operations are to protect Powelliphanta snails, while there are
also operations to protect a Whitaker's skink population and taiko burrows on Chatham Island.
Rat numbers are monitored using rat trap-catches, tracking tunnels and bait-take
analysis.
Powelliphanta survival is monitored, as is the success of taiko chicks and eggs.
Pitfall traps, baited with pear, are used to assess lizard numbers
Results used as a feedback mechanism for management

155

156

157
2. OVERVIEW OF OUTCOME MONITORING 2.1 Pre-control Tararua Range fuschia Fuchsia trees are being lost at a rate 25% per decade in the Tararua Range. This follows the loss of fuchsia as a seral vegetation type in lowland forest in the region. Kapiti coast kohekohe No obvious damage to kohekohe forest prior to possum control but low fruiting levels apparent. Its history as a sought after possum food is the main justification for control. Horowhenua Powelliphanta Three endemic sub-species of snails show a trend of decline in numbers. Conservation management over the last decade has included: progressive legal protection of habitat, exclusion of grazing stock, rat control and possum control. 2.2 After control Tararua Range fuchsia
Have had insufficient time to assess survival, but there is some evidence of continued decline in fuchsia in non-treated area (e.g. 1 plot out of 10 showed obvious decline).
FBI is apparently not sensitive enough to detect differences when measured mid-
season before control, after control, or in non-treated areas. Kapiti coast kohekohe
FBI used: -Nil changes in foliage cover. -Kohekohe flowering and highly variable between areas and between years, no conclusive result. -Some reduction in browsing.
Horowhenua Powelliphanta
Snails showing a trend of increase in numbers and size. 2.3 Case study: Paraparaumu kohekohe Objective
To compare flowering and fruiting levels, and tree condition between treated and non-treated areas (in terms of possum control), using FBI.
A reasonable SMART objective has only been proposed after analysis of that data
showed high variability between areas.
This objective is to reduce the percentage of monitored kohekohe trees with browse levels greater than 1, to less than 5%, and to maintain average foliar cover of these trees at greater than 70% by 30 June 2000.

158
The conservation goals are: to ensure the regeneration of kohekohe for its continued existence and to minimise the effect of possums on kohekohe flowering and fruiting.
Outcome monitoring
FBI on kohekohe trees on transects to the permanent plots, and trees on the boundary of the permanent plots. Transects were started 20 m from the forest edge and used the sampling design described by Payton et al. (1993).
-Total and upper canopy browse, total and upper canopy dieback, trunk use, foliage cover.
-Degree of flowering, degree of fruiting.
-Number of flowers on tree trunk below 2 m were counted in 1994 and 1996.
Permanent plots set up in 1994 to evaluate tree growth, tree mortality and regeneration. Initially the permanent plots were set up using randomising methods.
Recording
All data recorded in paper form set up to input into Excel worksheets.
Draft report written on data accumulated up to 1998.
Total flowering and fruiting estimates, as well as tree condition data, analysed using Chi-squared tests.
Where data for two years available, mean FBIs tested using paired t-tests, and degree of flowering, fruiting, dieback, browse and trunk use, by Wilcoxon signed-rank test.
Project review
Used FBI information, in combination with trapcatch and bait-take data, to decide the level at which possum control would continue to be implemented in the reserve.
Found variability between years and areas for fruiting and flowering overshadowed any effects due to possum control.
A change in upper canopy browse (especially at Level 2 and greater) appeared to be a good short-term indicator of kohekohe response to possum control and is closely related to the fruiting response.
Decided to assess browse at greater frequency than flowering/fruiting. 2.4 Issues, problems and opportunities Size of monitoring programme
It was set up pre-DOC restructuring for 1.5 to 2 staff; now there is about 0.2 of a person to continue it.
We are reviewing monitoring to scale it down to better reflect current resources.
Manipulating field staff resources to 'free-up' more time for monitoring.

159
Lobbying for more operating dollars during Business Planning from the Conservancy pool and from the national pool.
Type of indicators or timing of measurement
Responsive ecological indicators: focus on those showing the most possum impact may not be the most appropriate, i.e. project objective may not turn out to be the point -if we target browse, may not reflect tree regeneration.
May be other/better indicators, e.g. possums may target fruit more than leaves in
plentiful years.
Timing of measurement may be critical to detect response, e.g. measuring fuchsia at spring leaf emergence may be more responsive than mid-growing season.
More detailed studies
Research on identifying appropriate possum density for a range of vegetation types may be more appropriate than variably funded, often poorly technically supported Conservancy monitoring exercises.
3. REFERENCES Payton, I.J..; Pekelharing, C.J.; Frampton, C.M. 1993. Monitoring possum-related damage in native forests. Draft of method prepared by manaaki Whenua - Landcare Research, Lincoln. 4. WORKSHOP DISCUSSION/FEEDBACK Tawa berry technique Possums do not eat the kernel of tawa and leave the husk. The presence/absence of husks is used to monitor possum impact. Seems to be more sensitive than using the FBI. Deer/goat issues There are difficulties monitoring goat damage when deer are present as it is hard to tell the difference between their impacts. The possibility of single and double layer fences for exclosures was briefly discussed. The following question was also raised "why control goats, if deer are present and uncontrolled?"

160

161
Nelson/Marlborough Conservancy Judy Dix Department of Conservation, Private Bag 5, Nelson Greg Napp Department of Conservation, PO Box 53, Takaka 1. SUMMARY OF PEST CONTROL OPERATIONS AND OUTCOME MONITORING Major pest control work is done for possums and goats. Funding for other pest species is quite small in comparison, but includes pigs, mustelids, rodents, chamois deer and wasps. 1.1 Possums
Two-thirds of the Conservancy's possum control funding is because of the impact on threatened species of snails.
Ecosystem approach to control work and need for more than one indicator
species so impacts on vegetation assessed (also uncertainty about response time of snails).
Landcare Research has produced reports (which review known distribution of
possums and impacts on fauna and vegetation) and surveyed current vegetation impacts with recommendations for further survey and monitoring work (Rose 1994, Rose et al. 1995a, 1995b).
Conservancy and Field Centre staff undertook survey work to monitoring
requirements and set up monitoring for control operations that would be taking place (most sites visited between 1994 and 1996).
Animal pest densities are assessed annually in most areas with annual ground
control and where contracts have been let. Outcome monitoring is done 5-yearly if the control regime is aerial and 5-yearly.
Outcome monitoring for snails determined by Kath Walker (Science and
Research, Nelson/Marlborough); mostly 500 m2 plots.
Outcome monitoring for vegetation mostly uses the Foliar Browse Index (FBI)
method and is undertaken annually for the first five years to ascertain variations in annual foliage density (review period after five years).
1.2 Goats Annual kill/effort recorded for all sites.
The 'South Marlborough Goat Management Plan' produced for South Marlborough (Harding 1998) identifies priorities to ensure resources are spent on the most ecologically important and vulnerable sites, within previously large blocks. A similar plan is being done for Golden Bay, and is being considered for

162
other large blocks, e.g. Mt Richmond.
Outcome monitoring: although it dates back to the 1960s it is mostly exclosure plots. is being asked to review our network of forest plots in the next financial year. This should help determine the need for permanent plots and exclosures for surveillance work and current ungulate control.
There are two sites in the Sounds where trialed techniques for goat control
outcome monitoring. This monitoring is being taken over by Area Office staff. Monitoring has been set up this year at one other site (East Takaka). The Conservancy will be putting more effort into establishing outcome monitoring for ungulate control in the next financial year on the basis of recommendations in the Landcare report due out end June (Harding 1998).
1.3 Multiple species management Rotoiti Nature Recovery Project (Mainland Island) St Arnaud
Controlling possum, red deer, ship rat, mouse, stoat, wasps.
Outcome monitoring using a variety of techniques: snail plots, FBI, mistletoe, exclosures, Recce plots, pitfall trapping, kaka, honeydew.
Mt Stokes
Controlling mustelids, rodents, possum, pigs, goats.
Outcome monitoring: yellowhead, snail plots, forest photopoints .
Draft Management Plan for project Islands
Eradication programmes for various islands in the Marlborough Sounds (mainly rodents and mustelids with continual checks on some islands, e.g. Maud and Moutere Inlet (rabbits)
Outcome monitoring for threatened species: saddleback, kakapo, various seabirds, tuatara, frogs, snails, various plants.
1.4 Other species
Pigs Mainly a problem in the Sounds. Outcome monitoring centred around impacts on
snails.
Mustelids Mt Stokes and Mainland Island.
Chamois Are controlled if seen during goat control operations
South Kahurangi: currently determining extent of populations and management
actions required, i.e. to control at key sites, all sites, or as part of goat control operations.
Mt Owen: established population, possibly the only site for chamois control per
se.

163
1.5 Techniques being trialled
Snail monitoring methodology under review: smaller plots along transects, fenced areas and translocations possible.
Landcare: Mt Robertson (three to four different levels of sustained possum control on the canopy condition).
Landcare: Richmond Range (annual vs. intermittent possum control/maintenance over 10 years).
East Takaka: 20 m2 seedling/sapling plots.
Broadleaf epicormics at Rotoiti: may need a site with more impact for trial, e.g. South Marlborough.
1.6 Monitoring staff
There is no Conservancy team. Area staff were trained to manage the field-work for possum control outcome monitoring between 1994 and 1996. Statistics training was provided in 1997 to help staff with data analysis.
Pros of Area staff conducting work Area staff own the work they do.
Area staff gain increased knowledge about their patch.
Skills base of Area staff is increased.
Participation in any monitoring work has meaning if staff are involved up to the point of analysis and decision-making.
Staff turnover may be less than for a Conservancy team, so more consistency.
Follows Department of Conservation (DOC) recommendations -Conservancy staff provide advice and support, and get involved in fieldwork for training etc.
Pros of Conservancy-based staff conducting work
Conservancy team get to see all sites and can make comparisons about impacts.
Less variability throughout Conservancy, e.g. FBI scoring.
Dedicated staff may be better at setting aside time for field-work, analysing data, writing reports etc. compared to Area staff who have many demands on their time.
Area staff may get overloaded and either fail to do work, or decide to contract the work out - so the advantages of Area staff doing the work are lost.
1.7 Information
Report formats and trend summary sheets have been produced to help staff convey work and results.
Ecological Survey and Monitoring Database -stores information and plans when
work is to be done.

164
Guidelines for all ecological survey and monitoring will be produced by the end of June providing a survey and monitoring process to follow (whether to do it and if so what recommendations to follow).
1.8 Project review All possum outcome monitoring has outcome targets that have been set and a time frame for review, usually five years. Goat outcome monitoring will follow suit. 1.9 Non-pest site monitoring
Non-treatment sites are being monitored for the Mainland Island programme
Possum control outcome monitoring relies on Before-After-Control-Impact (BACI), except for Blumine Island, which is a non-treatment site for the possum control at Ship Cove.
Various threatened plant species monitoring includes fenced areas and banded
trees, hut a lot is in the surveillance stage-determining what management actions need to take place. Similar with possum exclosure plot for fuchsia in the Roaring Lion to determine impact.
Census work on a number of bird species or communities, e.g. wader birds.
1.10 Issues
Do we need to monitor pests at the same frequency as outcome monitoring? Issue for snail monitoring: Kath Walker would like this data to know whether we are using the best techniques for snail recovery. Statisticians say we need this information to prove cause-and-effect.
Effectiveness of goat control if deer present and not being targeted. Integrated
ungulate/ground browser control?

165

166

167
2. OVERVIEW OF OUTCOME MONITORING 2.1 Outcome monitoring for possum control operations
Table 2 the Conservancy's progress towards achieving outcome targets. In some cases there has been insufficient time gap to assess this and with some programmes of work the information process is poor.
Many vegetation species have reached target or are moving towards the target.
Where no progress has been made (e.g. Ship Cove) the operational area has been decreased and control has been intensified.

168

169

170

171
Table 4 shows an example of the brief overviews that Area staff produce annually for a workshop. You can see that although the outcome target for toro at Tennyson Inlet had been achieved, in 1999 the species is again below the target. Also the outcome target for canopy foliage density (CFD) for toro and kamahi appear to have been set too low so will need to be increased. Impacts on toro are appearing before tawa. Toro and titoki show a rapid response and indicate possum impacts sooner. Tawa has a slower response and later impacts in this forest mix. As our knowledge increases at each site, we will be able to determine realistic CFDs etc. for healthy plants, over a range of indicator species. This type of information is used to give us a lead in to further possum control required at each site. 2.2 Results from some Powelliphanta monitoring
In contrast to most of the vegetation, Powelliphanta snails have not reached their outcome monitoring target at most sites.
If outcome targets have not been achieved we need to ask if the control
operation been successful. It may be difficult to assess this if we do not have annual catch rates, but from trap-catch results post-control and vegetation response, we believe that possums at most sites are still at low numbers. May require lower possum densities for snails than for vegetation.
Figure1 gives the results of snail work at Flora where a positive response was
achieved.
Is the outcome target that has been set realistic? From Kath Walker's knowledge gained over 20 years of snail research, she believes that snails were at very density in a number of areas in the 1970s and early 1980s. In 1978 she collected 400 freshly possumed snail shells at Bock Peak; 1999 monitoring found less than at a handful of live snails.

172
Does 'chance encounter' when monitoring affect numbers of snails counted and are searchers finding snails? Kath Walker's work at Gridiron over a number of weeks found variability of 5 snails (highest count 19). Techniques used to test effectiveness of searchers: experienced vs. non-experienced showed no difference, but there were definite individual differences.
If initial numbers are low, it may take a long time before the outcome target is
achieved and may require more intense control work.
Kath Walker would like snail monitoring frequency to be every two years instead of every three, and have two sites where annual monitoring occurs (such as Charming Creek) to see variations in annual trends.
2.3 Case study: mohua (yellowhead) outcome monitoring at Mt Stokes This species has been at low numbers for more than 10 years. As active management has increased the mohua population has also increased dramatically. The challenge for all threatened species is to get populations to levels where encounter rates are high and so breeding occurs more frequently. The increase in mohua numbers at Mt Stokes has been steady, though the last two seasons have seen a slightly larger increase. A number of different factors may have contributed to the increase: an increase in funding (meaning more staff, equipment and time), warmer weather patterns (resulting in a longer breeding season), more food available during beech seed mast, and a decrease in predators. Mustelid and rodent populations over the seasons have fluctuated, increasing during beech seed mast years. In the intervening years mustelid numbers seem to be slowly reducing, perhaps this can be attributed to a more extensive trap-line, covering a larger area. Each year more traps have been added to the line. In 1990/91, when trapping began, 19 traps were in action, today there are 116. Data showed a huge increase in rodents during the last mast year, results of next season's index line will be interesting as all the signs point to another mast year.
2.4 Case study: Mt Burnett possum control operational area Background An aerial 1080 possum control operation was carried out along the Burnett Range in July 1994. This winter will be five years since the control operation. The intention of the 'National Possum Control Plan' (Department of Conservation 1994) was for five-yearly

173
control operations. So now is the time to decide whether to repeat the operation or to delay one or two years. However, the business planning cycle required that the decision whether or not to carry out the follow-up operation in 1999/2000 should have been made in February 1999. At that time only 4 years of outcome monitoring data was available. Another factor is that the Tasman District Council is intending to do a large possum control operation over the bottom of the Aorere Valley which is adjacent to the Burnett Range in the 1999/2000 year. This is an additional reason for us to tie in with their control work.
Outcome monitoring Nine monitoring transects for FBI monitoring:
57 Hall's totara at Mt Burnett.
55 Hall's totara above Aorere River.
44 toro above Aorere River.
43 Melicytus ramiflorus at Mt Burnett
49 southern Rata at Mt Burnett.
In addition:
12 northern rata from Quarry Road.
1 Peraxilla colensoi.
500 m2 Powelliphanta snail plot.
Outcome targets Toro (Myrsine salicina) above Aorere River: met foliage cover objective of 55%
after 2 years (Figure 3).
Toro browse: met browse objective (95% of trees with 0 or 1 browse) after one year. Still meeting objectives after four years (Figure 4).

174

175

176
Trees on Mt Burnett are exposed and show wind hedging so are unlikely to meet the browse objective. Possum densities are low on Mt Burnett so trees never showed a great deal of possum damage.
Southern rata at Mt Burnett: met foliage cover objective of 65%after three years
(Figure 8); always above browse objective. There is a large amount of present in southern rata population on Mt Burnett. Most is likely to be due to physical factors (wind, drought etc.). Trees are still recovering from past major dieback event.
Melicytus obovatus at Mt Burnett has not met 45% foliage cover objective
(Figure 11), but met browse objective after one year (Figure 12). Very positive recovery trend in this species. Foliage cover objective may be unrealistic for this species. Browse, although still low, has been increasing over the past two years.
Speed of recovery: most species show a less than 5% annual increase in foliage cover scores (Figure 13). The best performer was Melicytus obovatus with over 20% increase per annum over four years. This rate of increase would be expected to drop with further years of monitoring. The worse the condition of the population, the better the expected rate of increase, and therefore the likely statistical significance of the result.

177
Northern rata: continual deterioration of the fringes of tree canopies since 1994. This is likely to be a wind effect.
Mistletoe: one large Peraxilla colensoi defoliated by possums in 1998 on top of
Mt Burnett.
Snail monitoring: very slight increase in live snail densities since 1994 (Figure 14). Continued low level of predation of snails by possums despite possum control.

178
Is it time to undertake further control according to outcome monitoring?
Toro: No.
Southern rata: No.
Hall’s totara (both sites): No.
Melicytus obovatus: Maybe (foliage cover okay but browse increasing).
Mistletoe: Yes (defoliated).
Snails: Yes (ongoing predation).
The trap-catch rate for possums on Mt Burnett in 1998 was 0.8%. A line on the west side of the summits area recorded 5% trap-catch rate. This density of possums is still too high for sensitive species - Powelliphanta snails, mistletoes and Melicytus obovatus. In contrast the trapcatch rate at the site has fluctuated from 0.5% to 18% between 1994 -1998. There has been almost annual ground control of possums along the pasture margin of the operational area. Despite moderate densities at times, the monitored species have recovered over the last 4 years. These results suggest that more than one regime of possum control may be necessary to protect all values. Annual possum control over 100 ha centred on Mt Burnett, and aerial 1080 over the whole of the control area every 6 or 7 years. 2.5 Issues
Variability of data when different people scoring for FBI - despite standardised training. Staff are encouraged to keep the same observers/scorers, but this has not happened at all sites. Non-treatment site on Blumine Island has seen canopy density (CFD) go from 63% to 80% in five years. Is this real, or a consequence of three different people scoring? There is also a 'tedium' factor if staff are doing this work for a long time. Variability of searchers and the tedium factor are issues for snail monitoring too.

179
Concerns about having different people scoring, to those it is better if people realise the significance of what they are doing in the field, and this is gained when data is analysed. Some Area Offices contracting this work out.
Concerns about overload of work for Area staff - work may not get done, or not done at the best time.
Southern rata at all sites has heavy to severe low CFD but hardly any browse. Obviously not a good indicator species, but from a PR point of view it is a species that stands out. May take many years for recovery of dieback, even if possums are not impacting.
Outcome monitoring for possum control operations in Beech forests -Mainland Island (gut sampling).
Environmental factors, e.g. drought Marlborough (snails).
2.6 Opportunities
Ecological Survey and Monitoring database: picked up nationally?
Pest database.
Links to other information like Visitor Asset Management System?
Guidelines for survey and monitoring process.
Dataloggers: need national focus to develop/source waterproof, robust hand-held units for collecting data in the field. Suitable equipment does not exist at present. Major amount of time is being wasted by having to enter field data into computers and verify. In case of Mainland Island sites this is a major reason why results are not to hand.
Statistics training. Conservancy support for national DOC-focused statistics training.
3. REFERENCES Department of Conservation. 1994. National possum control plan. A strategy for the sustained
protection of native plant and animal communities 1993-2002. Harding, M. 1998. South Marlborough goat management. Internal Department of Conservation
working document. Rose, A.B. 1994. A renew of possums and species in Nelson/Marlborough Conservancy. Manaaki
Whenua – Landcare Research Contract Report LC1394/119 for Department of Conservation.
Rose,A.B.; Pekelharing, C.J.; Platt, K.H.; Moore, T.J.; Savage, T.K.; Suisted, P. 1995. Forest
dieback and the impacts of possums in Nelson/Marlborough Conservancy. Manaaki Whenua – Landcare Research Contract Report LC9596/12 for Department of Conservation.
Rose, A.B.: Pekelharing, C.J.; Platt, K.H.; Savage, T.K. 1995. Priority areas for control in
Nelson/Marlborough Conservancy. Manaaki Whenua – Landcare Research Contract Report LC9596/13 for Department of Conservation.

180

181
Canterbury Conservancy Chris Woolmore and Neil Bolton Department of Conservation, Private Bag 4715, Christchurch 1. SUMMARY OF PEST CONTROL OPERATIONS AND OUTCOME MONITORING Information on pest control operations and outcome monitoring in Canterbury Conservancy is summarised in Table 1. More detailed information is presented in Appendix 3. 2. OVERVIEW OF OUTCOME MONITORING 2.1 Case study: Hurunui possum control Goal To protect the beech forest ecosystems of the South Branch of the Hurunui River and restore them, as much as is possible, to their original states, and secure their species assemblages and unique habitat character. Objective To determine the most effective bait station configuration to control possums in a valley-based beech forest ecosystem. The hypothesis being tested is that bait stations positioned 100 m apart along the bush edge adjacent to the river terrace will reduce possum densities to a level where forest condition will improve and vulnerable species recover. Target density is <0.3 possums/ha. Monitoring
Possum densities: trap-catch, bait-take.
Possum movements: radio telemetry.
Mistletoe health: foliar cover.
Possum Density Trap Catch:
Ten permanent monitoring lines.
Twenty-five traps/lines located approximately every 25 vertical metres.
River flat to tussock margin.
Elevated board sets.

182

183

184
Five lines run pre and post-poison. Of each five, four lines are located in the treatment area, one in the non-treatment area.
Results - Possum catch rate:
Decline in catch rate 1995/96 to 1996/97, little change 1996/97 to 1997/98.
Decline in catch rate from pre to post-poison in 1995/96 and 1996/97, little change 1997/98.
Increase in catch rate in non-treatment area since 1995/96.
Results - % kill.
No meaningful result using possum monitoring protocol.
But note non-random location of monitoring lines, very low possum densities with many zero values, few replicates, large number of 'sprung no possum' results, giving rise to a possible trap shy residual population.
Bait take:
Treatment area only.
222 bait stations along valley floor forest edge.
100m apart.
Baits loaded early March, cleared late May.
Baits topped up at least twice and bait removed and estimated to the nearest 1/4 (0,25%, 50%, 75%, 100%).
Small bait takes recorded at 25% (lethal dose two pellets).
Results:
Progressive reduction in number of bait stations where baits taken over three years.
Distribution of bait take becoming clumped by end of third year.
Possum movement
Telemetry:
First season used 1997/98, difficulty catching possums due to low density.
Four possums fitted with radio transmitters.
Three valley floor, one tussock tops.
Results:
Two out of the three valley floor possums were poisoned after taking baits, the third had moved to a mid-slope location prior to poison being presented.
The possum on the tops moved throughout the altitudinal range (valley floor to tussock tops).
But note, need to watch for poison shyness.

185
Mistletoe health - foliar cover
59 permanently marked sites.
282 mistletoe sites.
32 sites in non-treatment area.
27 sites in treatment area
Two species (Alepis flavida and Peraxilla tetrapetela) monitored
Assessment of foliar cover and health using subjective 8-point scale.
Measurements annually each March by same observer from 1997.
Results:
Foliar cover of mistletoe at 88%of sites in treatment area have improved or remained the same. 12% have declined.
Foliar cover of mistletoe at 42% of sites in non-treatment area improved or remained the same. 58% have declined.
Information management
Information recorded in field-books, plot-sheets and day-logs.
Data collected and stored in a central location.
Single person responsible for data analysis and interpretation
Annual report analysing and interpreting results.
Post-season staff debriefs and pre-season meetings to discuss programmes.
2.2 Issues, options and opportunities
Standard operating procedures (SOPs) can not always be applied. Random location of lines, number of replicates in low density populations required, combined with elevated in challenging terrain and limited resources, all mean the standard possum monitoring protocol was not practical in the situation.
Outcome monitoring in particular is often complex, expensive, time consuming
and requires expertise to analyse and interpret results. Need regional and national networking to ensure getting best value for monitoring effort, no unnecessary duplication of effort and efficient transfer of information.

186
What level of outcome monitoring? Should outcome monitoring be obligatory for every control operation? Arguably not if sufficient work has already been done, i.e. monitoring can confidently predict an outcome from the results of previous monitoring.
Information transfer. Field techniques and methodologies, building on and
improving protocols and operating procedures, development of research initiatives and application of findings.
3. REFERENCES Parkes, J,;Thompson, C.; McGlinchy, Ruscoe, W.; Knightbridge, P. 1999. Best practice
monitoring of thar densities and impacts. Manaaki Whenua - Landcare Research Contract Report LC9899/51 for Department of Conservation.
Rose, A.B.; Allen, R.B. 1990. Impact of Himalayan thar on vegetation of the North
Branch. Godley Valley, Canterbury. Forest Research Contract Report FWE90/32 for Department of Conservation.

187
Otago Conservancy Bruce Kyle Department of Conservation, P.O. Box 5244, Dunedin 1. SUMMARY OF PEST CONTROL OPERATIONS AND OUTCOME MONITORING Information on pest control operations and outcome monitoring in Otago Conservancy is summarised in Table 1.More detailed information is presented in Appendix 3. 2. OVERVIEW OF OUTCOME MONITORING 2.1 Introduction Outcome monitoring has been limited in Otago Conservancy as funding has generally directed towards control operations. However, significant funding was found in 1996/97 and 1997/98 to contract Landcare Research to carry out extensive aerial surveys of conservation lands to:
Assess possum impacts on canopy vegetation following varying levels of control.
Identify areas of canopy collapse. This monitoring work identified a small of areas which have suffered from reduced possum control. These areas comprise Hall's totara/pahautea remnants near the main divide, and some areas in the Catlins coastal rainforest. Beech forests were generally unaffected by a lack of control, except for some patches of seral forest. 2.2 Outcome monitoring Ground monitoring, using photopoints, has identified only a small number of native mistletoe sites which are threatened by possums; mistletoe generally appears to be in good health throughout the Conservancy, despite limited control. Foliar Browse Index (FBI) monitoring has not yet been adopted by Otago Conservancy, but is being considered in the Catlins, along with 20 x 20 m permanent plots and possibly fern browse (Catlins possums impact heavily on ground and tree ferns in some reserves). Forty-nine New Zealand Forest Service (NZFS) 20 x 20 m permanent plots in the Recreational Hunting Area (RHA) are currently being remeasured to assess conservation outcomes since the plots were last measured in 1989. Fallow deer hunting pressure has been relatively light during the intervening period, and the monitoring results will be used to provide recommendations for future hunting activity. A MSc student is monitoring fallow browse in the Caples valley with 5 x 5 m plots, using natural

188

189

190
exclosures in bluff systems to provide control data. This work will also be able to measure conservation outcomes over 10 and 16-year periods. Goat outcome monitoring has been very limited to date, comprising mainly photopoints in some Coastal Otago reserves. More recently, vegetation transects have been established in the Shotover/Moonlight Range country to measure vegetation response following goat removal. This work, however, may be compromised by an inability to separate the effects of hares in the area. Moreover, monitoring should probably have begun when goat numbers and impacts were high, not one to two years after intensive control had reduced numbers. Future outcome monitoring for goats will probably relate to lighter densities than in previous years, and it will be difficult to find a sensitive technique that can separate the effects of other browsing animals, particularly in tussock country. A method of campsite browse assessment may be used for both surveillance and outcome monitoring. Rabbit outcome monitoring is limited to photopoints at a few ecologically sensitive sites, such as threatened cushion-plant communities and herbfields. Generally, Otago Conservancy is aware of the need to increase its level of outcome monitoring. Exclosures, 20 x 20 m permanent plots, vegetation transects, foliar browse, walk-through browse assessment, and further aerial survey are all under consideration. 2.3 Case study: possum impacts on pahautea The study area is the upper East Matukituki valley. Note that this monitoring programme is still under development and some changes are likely. Objective To monitor changes in pahautea possum use and possum damage following a period of possum control in an alpine coniferous-broadleaved forest. Monitoring Possum kills (cyanide), possum distribution, possum gut contents, possum faeces, trunk use and canopy condition. Method 1. Twenty bait stations placed in each of four habitat strata (grass, beech, pahautea and
mixed scrub). 2. Record the number of kills for each stratum over five November nights 3. Field gut analysis of each possum to assess whether gut is ¼, ½, ¾ full, and if
possible, record approximate percentage of pahautea leaf. 4. Establish representative transects on compass bearings. Tag all pahautea trees in the
3-10 m cohort and assess the following:
Trunk use (score 0-3).
Fresh possum sign within 3 m of trunk (score 0-3)
Climb tree to assess possum browse in upper tier (score 0-3).
Band any isolated trees in the cohort for control purposes.

191
On steep sites, establish upper canopy photopoints of some individuals, if possible.
N.B. Dying trees of any age are tagged and noted along the transects. Bait stations will be monitored in buffer zone to detect possum reinvasion Data storage and analysis Data is recorded on Excel spreadsheets by Area staff. Technical Support Unit staff analyse data to create indices of possum abundance, pahautea utilisation and pahautea browse damage. Reporting File report, status report, Conservancy report. Project review Data obtained from gut samples in 1998 has confirmed that possums are mainly (77%) inhabiting the pahautea and have significant amounts of pahautea in their stomachs. Field observations have also confirmed that pahautea is being browsed and is suffering dieback, but this has not yet been quantified. The work to date has highlighted the need to use simple, semi-quantitative and photographic methods to relate pahautea use, damage and recovery to possum abundance and removal at this site. 2.4 Issues, problems and opportunities
Resources: personnel, time.
Statistical experience.
Measuring outcomes across large-scale management units.
Separating effects of browsers (e.g. goats/hares/deer/sheep).
Lack of specialised monitoring staff.

192

193
West Coast (Tai Poutini) Conservancy Phil Knightbridge, Tom Belton and Campbell Robertson Department of Conservation, Private Bag 701, Hokitika 1. SUMMARY OF PEST CONTROL OPERATIONS AND OUTCOME MONITORING 1.1 Introduction
90 management units total.
44 management units currently under pest control (possums 31, goats 14, thar 5, stoats 2).
46 management units currently for pest control and not monitored.
500,000 ha (approximately) total area controlled.
All 44 management units controlled are monitored for animal pest densities.
32 units are monitored for conservation outcomes (some with >1 method). 1.2 Monitoring animal pest densities
Possums by trap-catch (National Pest Control Agencies 1997).
Goats by hunter kill returns.
Thar by census and recreational hunter kill returns.
Deer by Wild Animal Recovery permit returns.
Stoats by tracking tunnel rates and numbers of trapped animals
1.3 Monitoring conservation outcomes
Foliar Browse Index (FBI).
5-minute bird counts.
Snail plots.
Weta shelter lines.
Goat exclosures and 20 x 20 m vegetation plots.
Deer exclosures and 20 x 20 m vegetation plots.
Deer faecal pellet lines.
Birds: 12 radio transmitters on kaka and 50 on kiwi; Westland petrel productivity studies; mohua 5-minute bird counts.
Thermal imaging
Photopoints (rata for possum browse and panoramic photos for goats).
Burns et al. (1995) method to assess impact of feral goats on forest understoreys.

194

195

196
2. OVERVIEW OF OUTCOME MONITORING 2.1 Case study: monitoring mistletoe in South Westland silver beech/podocarp forest Background Outcome monitoring of mistletoe (Peraxilla colensoi and some P.tetrapetala) in the Moeraki area begun in 1990/91. Other work in the area includes kaka research. Since then there has been a decline in the mistletoe population despite ongoing possum control. The rate of death probably partly reflects the history of possum colonisation. This result has implications for other possum control operations in South which also have the objective of protecting mistletoes in areas where possums have colonised only relatively recently. West Coast Conservancy put forward a piece of work to determine intervention densities for possum control to protect mistletoes as a research bid for the last two years, but were informed that this work should be done in-house.
* Not measured in 1999. ** Dead mistletoes tagged to see if they would recover - none did. Objective To determine an intervention density and target density for control of possum populations that will ensure protection of mistletoe populations in South Westland silver beech/podocarp forests. Method Mistletoe monitoring was first established in the Moeraki and Windbag Valleys in 1991 and further lines added in 1993/94. During this survey, plants were scored according to a 4-point defoliation scale. Remeasurement of these lines in 1996 used the defoliation scale, as well as parts of the Foliar Browse Index (FBI) method (Payton et al. 1997). The FBI method separates defoliation into two measurements: percentage foliar cover and amount of possum browse. Hence it is a more sensitive measure of possum impacts. In order to reliably assess the impacts of possum populations on mistletoe in the Windbag-Moeraki area, the monitoring effort of both possum populations and mistletoe condition had to be increased. Four treatments were proposed:

197
No possum control probably Jackson Valley.
Ongoing maintenance control: 5% Residual Trap-catch (RTC) target, control every three to four years (typical of most West Coast operations to date) - Moeraki Valley.
Ongoing maintenance control at increased intensity: 5% RTC target, control once
possum population exceeds 8% RTC -Windbag Valley.
Ongoing maintenance control: 2% RTC target, control once possum population exceeds 5% RTC - Lower Moeraki Valley.
During January 1999 some new mistletoe monitoring lines were established, and only one randomly selected clearly identified (using photos) mistletoe was scored per host tree. Additional notes were taken describing where the mistletoe were scored from to ensure each will be scored from the same position in future measurements. To increase the reliability of the data, two people scored each mistletoe then compared scores. Sample size still needs to be increased in some treatments. Monitoring of mistletoe condition will occur in August for at least the first two years of the study. Monitoring in August will detect the greatest level of browse. Monitoring in January will measure the level of flowering, and is an easier time to locate mistletoes. Possum will be done annually in some treatments, biannually in others. Recording, analysis and reporting The possum control history has been entered into GIS. FBI data is recorded on a Hewlett Packard palm-top in the field. This is downloaded to Excel spreadsheets in the office. The data collected to date has been analysed in SYSTAT using standard FBI statistical analyses (as recommended by Chris Frampton at FBI workshop, Craigeburn, November 1998). Comparisons with trends from original data have also been made. This determined that mistletoe condition continued to decline despite the current possum control regime. There have been some anomalies in the foliage cover scores because as mistletoe die they are removed from the analysis and the scores improve. Mistletoe condition also appears to decline with increased altitude. Future analyses will be made in SPSS using standard FBI statistical analyses. An interim report has been sent to South Area to inform them of the current trends and the establishment of the increased level of monitoring. The Area Office is the possum control operations in the Moeraki area. The results will also be Moeraki to the Mistletoe Recovery Group. Best practice and continual review The method of monitoring mistletoes was reviewed in 1998 with assistance from Suzan Dopson (Biodiversity Recovery Unit, Department of Conservation) who is also currently preparing the 'Mistletoe Recovery Plan', and has co-ordinated a national survey of current mistletoe monitoring practices with the aim of producing a Standard Operating Procedure (SOP). This was further discussed at the threatened plants workshop at Miranda in May 1999, and general agreement that there was a need for national standardisation to ensure a minimum amount of information was collected in each Conservancy with mistletoes in the family Loranthaceae. The numbers of mistletoes monitored, location of existing lines, and selection of which individuals to monitor, was reviewed in 1998. Some new lines were established.

198
The results will be used to inform decisions on how frequently, and to what level to control possums to protect mistletoes in South Westland. The project will be reviewed after two years to determine the intensity at which monitoring needs to continue. Conclusion The benefits of outcome monitoring are clearly shown by this study because we found the current level of possum control was inadequate to protect mistletoe. 2.2 Issues, problems and opportunities Fundamental question What is our management trying to achieve and is the outcome monitoring we are doing measuring this? In some instances our objective is relatively clear, e.g. improved health (as by size and foliage cover) and abundance of mistletoes to ensure a self-sustaining mistletoe population is maintained following a possum control operation. There may be some instances where we want to maintain a particular type of habitat that would otherwise be lost due to natural processes, e.g. continue to burn a pakihi area to prevent succession to forest in order to maintain habitat for a rare orchid. Again in this case, the outcome monitoring is relatively straightforward-survey for orchid abundance. In other cases, we are aiming to maintain a rather ill-defined state of forest health. In many cases the objectives need to be considered in terms of maintaining the processes that define forest, e.g. species turnover, habitat change. Currently we may use FBI as our outcome monitoring tool. We need to question what does it mean that 90% of have a foliage cover of at least 65%? How much effort should we put into monitoring? A review paper prepared suggested 20% of control effort for possum control operations should be used for monitoring (Choquenot & Warburton 1998). A similar level has been suggested for weed control operations (Timmins pers. comm.). These suggestions were based on theory rather than practice, and it would be useful to know whether there are any plans to validate these results with real data. Currently, West Coast Conservancy conducts operational and outcome monitoring on virtually every pest control operation. This provides some useful information about each operation. An alternative strategy may be to carry out more intensive monitoring of some operations, and none on others, to provide more detailed information to assist with future management decisions, i.e. 20% of monitoring effort may not be enough to give a definitive answer on whether the level and frequency of possum control is adequate to protect mistletoes in South Westland beech forests. Increased effort to link operational and outcome monitoring may provide information to reduce the amount of monitoring needed in the long term, e.g. the Department of Conservation (DOC) funded Research project at Mt. Robertson attempting to index possum densities to the FBI (Department of Conservation, Science and Research Investigation #1977 'Using possum densities to index control targets?.

199
Advice Many of the issues relating to advice have been addressed in the talk given by Phil Knightbridge 'Improving information transfer research providers and users' (see these Proceedings). To briefly reiterate, there is room for improvement in the delivery of quality advice on which monitoring method to use, project design, and data analysis. There needs to be quicker dissemination of the results of relevant research, and some guidance at that time as to how the results should be used to change the way we do things. The 'Habitat Monitoring' e-mail list provides an excellent monitoring related issues, dissemination of information, and finding what pieces of work other Conservancies are doing. There needs to be greater national or regional leadership of the discussions that occur. It should not be used as the forum to make a decision on which piece of advice to take. Staff turnover It can be to maintain staff interest in what can be boring, repetitive work. Staff exchanges, both within and outside DOC, are one way of creating some diversity in the job. For example, Southland and West Coast Conservancies swapped staff with strengths in particular types of monitoring; and West Coast staff have assisted with Landcare Research forest ecology field-trips. Another way of maintaining interest is to provide staff training opportunities, and opportunities to assist with other pieces of work not directly in their field. In the event that there is high staff turnover, maintenance of data standards is critically important. This means maintaining practices including:
Clearly marking plots and study sites
Keeping good records, and storing them safely so that someone unfamiliar with the operation can repeat it in future.
Using objective, repeatable methods 3. REFERENCES Burns, B.R.; Thompson, C.; Parkes, J.P. 1995. Assessing the impact of feral goats on forest understoreys. Manaaki Whenua - Landcare Research Contract Report LC9596 for Department of Conservation. Department of Conservation. 1993. Himalayan thar control plan. Conservancy Conservation Management Series 3. Department of Conservation. Using possum densities to index control targets, 1994/95 – 1998/99. Science and Research Investigation No. 1977 (Leader: G. Nugent). Choquenot, D.; Warburton, B. 1998. How much pest monitoring is enough? Allocation of resources in pest management programmes. Manaaki Whenua - Landcare Research Contract Report LC9899/05 for Department of Conservation. National Possum Agencies. 1997. Trap-catch for monitoring possum populations. Version 4.0.

200
Parkes, J.; Thompson, C.; McGlinchy, A.; Ruscoe, W.; Knightbridge, P. 1999. Best practice monitoring of thar densities and impacts. Manaaki Whenua - Landcare Research Contract Report LC9899/51 for Department of Conservation. Payton, I.J.: Pekelharing, C.J.; Frampton, C.M. 1997. Foliar Browse Index: A method for monitoring possum damage to forests and rare or endangered plant species. Manaaki Whenua – Landcare Research Contract Report LC9797/60 for Department of Conservation. 4. WORKSHOP DISCUSSION/FEEDBACK Thermal imaging The Conservancy has experimented using imaging to monitor thar. Thar are monitored at night with heat sensitive systems. Success is not assured: the resolution is apparently not very good-possibly explained by the extremely good insulating properties of their coats. Weta shelters Wooden shelters were provided for weta within and outside the treated area and numbers increased at both sites, possibly because of the provision of new, safe habitat. Rata photos Photos of specific trees are the ground and compared over time. They are not scoring the trees and are not sure about the effectiveness/usefulness of the method. Grassland plots Five areas are monitored as part of the thar control programme. They were set up in 1991/92 and two have been remeasured. There are few other monitored grass sites except perhaps in the Kaimanawa Ranges. Best practice A Landcare Research contract report on best practice for thar impact monitoring has been prepared (Parkes et al. 1999).

201
Southland Conservancy Cathy Allan Department of Conservation, P.O. Box 743, Invercargill 1. SUMMARY OF PEST CONTROL OPERATIONS AND OUTCOME MONITORING 1.1 Introduction In Southland Conservancy we have 1.8 million ha of land administered by the Department of Conservation (DOC); that is 53% of the total land area. Pest control occurs in 96,289 ha. It is a big job, and we have got a long way to go! The conservation land area has been divided into 81 ecological units. Only 17 of these are managed for pests. Some do not have pests like possums (Subantarctic Islands, remote pockets of Fiordland), but most do, and we do not really have the survey information to know exactly what is where and in what densities, and what the impacts are. Out of the 17 management units which have pest control, 12 are monitored for pest densities, and only seven monitored for conservation outcomes in the current financial year. Six of these are possum-related monitoring using the Foliar Browse Index (FBI) method (Payton et al. 1997), and the Murchison Mountains project has deer control impacts monitoring being written up by Landcare Research. 1.2 Goats No outcome monitoring for goats is being done. Goats are generally in low densities in so money is best spent on control. 1.3 Possums Possum control has only recently been initiated in many sites, so the recent establishment of vegetation monitoring reflects this. We have had mistletoe monitoring in five sites since about 1994. As yet this information has not been analysed or directly used to steer possum control. Mistletoe monitoring is done annually in for most sites. Frequency Foliar browse monitoring was initiated in 1998, and remeasurements are planned on rotations, except in Pembroke where we will remeasure within one year of possum control. Trap-catch monitoring Generally done by the protocol method (National Possum Control Agencies 1997) but we have had problems with this in low possum density areas, so we just trap and Feratox poison in favoured sites in Waitutu.

202
Conservation outcomes monitored Forest health -improvement in condition of indicator species, including mistletoes, using foliar browse method. 1.4 Deer We are lucky enough to have some deer-free valleys in Fiordland which are surveyed to check whether they are still deer-free. Pellet count surveys have also been undertaken in the Murchison Mountains and Waitutu (results are currently being written up) and on Stewart Island (results to be written up next financial year). The only deer control by the Department is happening in the Murchison Mountains for improvement of takahe habitat, and this control has been ongoing since the 1970s. Frequency Pellet count surveys have been done in many areas of Southland where there are permanent plot lines. Most were set up in the 1970s to early 1980s and have not been remeasured since. The Murchison Mountains survey was a repeat of a 1979 and 1985 pellet survey. Stewart Island lines were established in 1981. Waitutu work was also initiated in 1970s. Conservation outcomes monitored Forest health: structure and composition are monitored using fenced and non-fenced permanent 20 x 20 m plots. 1.5 Other species
Stoats are controlled in Eglinton Valley, and Science and Research (S&R) scientists are monitoring mohua.
Rats have been monitored for species and densities on Stewart Island. There are
no current rat control projects. 1.6 Storage and communication of monitoring information No central storage system set up. Information is often communicated by internal or contract reports, but much information has yet to be analysed and communicated. 1.7 Monitoring undertaken in non-animal pest control sites Our largest current monitoring project, Stewart Island forest health, is not based on a pest control operation. We are assessing animal numbers and impacts in order to prioritise control. The vegetation and animal density monitoring work in Waitutu is also being written up, and will hopefully be used to prioritise areas for pest control.

203

204

205
2. OVERVIEW OF OUTCOME MONITORING 2.1 Pre-possum control - foliar browse results: Pembroke Wilderness Area Response to possum control After possum control we expect for the more heavily browsed species like Hall's totara, mahoe and southern rata: foliage cover scores to increase, to be less prevalent, and possum browse and use scores to go down. Fruits should have been present on most species at this time (e.g. we saw many fruits on lancewood and three-finger on possum-free Bench Island in mid-April). We should expect fruit and flower scores to increase after possum control, but considerations of mast years must be made. Dieback Generally, scores and possum browse scores were fairly low (Figure 1). Often, scores implied moderate possum use, yet little sign of possum browse was evident. Summer sampling has been reported to underestimate possum damage to foliage, due to the abundance of other foods at this time (fruits and flowers), and the presence of spring growth flush being present and 'hiding' old possum damage (Pekelharing et al. 1998). Winter monitoring would give higher scores for browse, but this field-work is not practical in winter. Absence of fruits and flowers this argument. There is no doubt that removal of possums will improve foliage cover, and fruit and flower abundance. Canopy species such as southern rata and Hall's totara had higher mean dieback scores than subcanopy species such as five-finger and lancewood. For subcanopy species, whole dieback scores, are generally lower than top dieback scores, as lower branches die back from shading. No species showed generally moderate-high dieback throughout the survey areas, as might have been expected from initial observations. However, if dieback was related to distance to coast they would likely be strongly correlated: the closer to the coast the more and the higher the possum densities. This test will be done after remeasurement. To associate dieback with possum damage, there should be clear relationships between mean dieback scores, and browse and stem use scores. Some species show this relationship clearly, e.g. mahoe, Hall's totara. Those species with high scores do not necessarily reflect high possum use, southern rata. 2.2 Post-possum control - foliar browse results: Murihiku small reserves Data analysis is not yet complete for the first measurement of this data. Shown here is a comparison of mean scores from two Murihiku reserves (post-possum control) and the Pembroke Wilderness Area (pre-possum control) where southern rata was monitored. Care must be taken in interpreting the and browse scores, as dieback class1was split into two at Pembroke to allow for very low scores (1 – 1.5%, 2 - 6.25% etc.). Foliage cover scores are higher where possum control had occurred, and possum browse scores and stem use were much lower in post-possum control areas.

206

207
2.3 Case study: small reserve possum control Murihiku Area Cathy Allen and Mark Mawhinney1 Objectives:
Maintain possum densities below a 5% Residual Trap-Catch (RTC).
Monitor vegetation condition to ensure the 5% RTC is sufficient to achieve vegetation recovery.
Monitor possum densities to check that the baiting regimes and bait station spacing are sufficient to maintain possum numbers below 5% RTC.
Monitoring FBI in three of five reserves. FBI lines were established in three reserves: Forest Hill, Croydon, Hokonui Scenic Reserve, in the summer of 1997/98. Contract staff were employed who had experience in foliar browse assessment in Waitutu Forest, Southland. Recording Data sheets were stored and have now been entered and the data summarised. Now requires writing up as an internal report, including trap-catch rates and operational monitoring. Project review The project has recently been audited by the Biodiversity Supervisor, who found that a basic operational plan had been written, but it bears little resemblance to the project plan, and does not specify any monitoring or operational targets. Outcome monitoring was started after possum control had been going for a number of years, so no 'before-and-after' test was done. It was therefore difficult to specify detailed monitoring objectives, e.g. operation will be revised after foliar browse results are summarised and written up. Operations have been discontinued due to Southland Regional Council Tb vector possum control in all areas.
1Department of Conservation, P.O. Box 743, Invercargill.

208
2.4 Issues, problems and opportunities Issues
Is science part of the role of DOC monitoring staff?
Landcare Research has been contracted for $15,000 by Science and Research (S&R) to analyse and write up the Stewart Island forest health project.
As it is seen as a politically sensitive deer issue, no DOC names are to be
associated with the report, for a project designed and run by DOC Southland.
The Conservancy's Conservation Management Strategy states that deer will be eradicated from Stewart Island; 'independent' science is needed to back this statement.
Problems
No Conservancy survey and monitoring strategy.
No Conservancy pest control strategy (a goat plan is in preparation)
No national steer or support for deer control. Opportunities Southland Regional Council Tb vector control occurs over much of the Murihiku Area in effectively free possum control for DOC where we will set up outcome monitoring to benefit DOC and Southland Regional Council. But, does it reach the standards required for conservation gains? 3. REFERENCES National Possum Control Agencies. 1997. Trap-catch for monitoring possum
populations. Version 4.0. Payton, I.J.: Pekelharing, C.J.; Frampton, C.M. 1997. Foliar Browse Index: A method for
monitoring possum damage to forests and rare or endangered plant species. Manaaki Whenua – Landcare Research Contract Report LC9797/60 for Department of Conservation.
Pekelharing, C.J.; Frampton, C.M.; Suisted, B.P. 1998. Seasonal variation in the impacts
of possums (Trichosurus vulpecula) on five palatable plant species in New Zealand beech (Nothofagus spp.) forest. New Zealand Journal of Ecology 22: 141-148.

209
Part 3. Workshop discussion groups

210

211
Summary of discussion group feedback 1. GENERAL DISCUSSION 1.1 Data storage/computers
Field Centres need access to the new Department of Conservation (DOC) computer system. Full access viewed as essential, particularly if databases are to conform to a Department-wide standard and be maintained on the Intranet.
Data needs to be stored and archived appropriately to facilitate continuity of data
collection, e.g. National Indigenous Vegetation Survey (NIVS) database or a DOC developed standardised system (e.g. an animal/pest database). Issues that will need to addressed include: ownership, management and updating of database.
There is a need for a national standard for databases, and specifically a more
encompassing national database for monitoring information. This would encourage greater consistency in application of monitoring methods and data collection, standardise procedures for storing data and ensure better data security. It would also facilitate across-Conservancy comparisons in outcome monitoring. Any database would need to:
-Include (as a minimum) Foliar Browse Index (FBI) information.
-Be well designed. Existing databases could be used as a base for development.
-Take into account that historical data may not be compatible, but it needs to be accounted for in some way.
-Capable of linking monitoring and surveillance data management.
-Be accompanied by adequate staff training.
-Be on-line and available to all Conservancies and staff at all levels (at a read-only level outside the Conservancy/Area of origin).
Standard Operating Procedure (SOP) needed for data recording - perhaps
initiated by the proposed 'National Monitoring Group'?
Utility of field recording devices/tools discussed. Dataloggers identified as potentially very helpful, but direction required regarding national compatibility with new computer system etc.
Concern expressed regarding disadvantages of the new DOC computer system:
-Locked access to A: drive. -Potential difficulties using Access databases. -Problems experienced accessing files through the Document Manager (DME)

212
- Access/compatibility issues with Landcare Research computer programmes.
Access to GIS required as soon as possible. Any database developed needs to be capable of GIS linkage.
1.2 Reporting
Identified need to standardise and prioritise work so that field data is not only collected, but there is also time for its analysis, interpretation and reporting. General consensus that if money is available for monitoring, then a report should be produced. There was support for a RGM directive to ensure this occurs.
A standardised reporting framework or guidelines outlining 'best practice' by using case studies/examples considered useful.
Discussed feasibility generating reports from monitoring database. Suggested that if a new database system is developed it should be driven by outputs/reports.
Reports (which may be of an interim/summary nature) need to be available to
feed into the Business Planning process at the correct time if they are to have effective input into control operations. Emphasised need for sound and timely advice to support management decisions and planning.
Discussed possibility of introducing standardised naming conventions of files on DME to allow viewing by staff in other Conservancies/Areas.
1.3 Quality control
Identified need for standardised approaches to monitoring methodology. Discussed whether 'frameworks' may be more useful than SOPs to provide guidance on monitoring methodology while allowing greater flexibility to fit methodology to particular circumstances. Recognised that some methods (e.g. 20 x 20 m plots) will need to be done using identical methodology. Discussed issue of transferability of methodologies between localities (e.g. is the FBI adopted in one locality necessarily transferable to another locality?). Need to maintain some degree of flexibility to take into account local factors (e.g. terrain, presence of kiwi preventing normal trapping protocols) – i.e. compulsory vs. optional components. Variations on standard methods may be acceptable if they are add-ons rather than replacements for other parts of the method. Need to standardise survey and analytical methods, and develop standard approaches before database development.
Peer review of monitoring proposals, analysis and reporting discussed. Identified need for a SOP for a peer review system, or some form of decision support model with peer review becoming necessary if it is not possible to identify options through that model.
Need to keep detailed records of methods used. Need to produce field manuals (e.g. Tongariro/Taupo produces a field manual for each monitoring project outlining the methods as individual projects vary in application).
Need for a 'National Monitoring Group' to be set up along the lines of a Recovery Group to provide support for monitoring. Potential roles include:
-Peer review to ensure sound science underpins monitoring programmes and quality data gathering, and to ensure that there is some co-ordination between

213
programmes. This is currently undertaken to varying degrees within different Conservancies. Any peer review process would need to ensure quick turnaround of response.
-Guidance on new methods - perhaps the development of SOPs? -Advocate the case for surveillance monitoring within DOC - Leadership/networking/communication -Ensure quality of advice given to monitoring groups. Concern expressed about the quality/consistency of advice that has been provided in the past, which has led to reduced confidence in that advice.
These roles need to he further refined and clarified before an approach can be made to set up such a national group.
Recognised that while there is a need to be aware of new methodologies/ approaches to outcome monitoring, it is important the questions being addressed are clearly identified from the outset, and that the outcomes required from the objectives of the control work in question are achieved.
1.4 Statistical training and support
Identified need for 'sound science' to underlie monitoring programmes and the need to ask 'good questions'. Generally felt that most help is needed for experimental design and statistical tests. Identified need to address power issues in the design of monitoring programmes. Identified that a national framework would be useful, but that flexibility was needed.
Some funds are available in Science and Research Unit. These might be accessible
if a group like the proposed 'National Monitoring Group' made a combined approach, but it would need to be clear exactly what the issues are to be addressed. A survey of staff useful to identify specific statistical training and support issues.
Identified that if staff are seeking advice from outside the Department, it would
be better to make a co-ordinated approach so that people are not getting different advice from different people for the same issue, thereby ensuring consistency of information available.
DOC is about to employ a biostatistician, requested should be available to assist
Conservacny/Area staff as well as Head Office/Regional Office staff. Biostatistician unlikely to be readily available to provide Conservancies/Areas with advice at least until a number of priority projects have been completed.
PRSs co-ordinating the preparation of a statistics workbook and a training
workshop that is aimed at DOC technical staff with some statistical background. The proposed training workshops will be able to expanded or targeted to suit specific needs, but it is envisaged that they will be broad enough to be widely useful to staff.
SPPS is now the DOC standard statistical package - the workbook and training
workshop will be based on SPPS. Identified that staff will need training in SPSS.

214
1.5 Staffing
Discussed differences between Conservancy and Area Office responsibilities with regard to outcome monitoring. Support for the concept that a dedicated monitoring team 'model' needed to be adhered to. Examples of different scenarios currently exist within DOC (e.g. monitoring teams affiliated with a Conservancy or an Area Office). Agreed that there is a need to ensure greater commitment to monitoring within the Department, as well as more consistent approaches to monitoring.
Discussed potential benefits of having someone co-ordinating the Conservancy
monitoring programme -to ensure consistent reporting, good data storage etc.
Staff need a variety of work to keep interest up (and reduce high staff turnover) and to allow for skill development.
Monitoring staff need to be independent of the control operation but other staff
can be brought in to help. Under circumstances where the same individuals are responsible for pest control operation and monitoring, there may be benefits to using the services of an independent auditor/monitor for individual jobs/operations. If monitoring is prescheduled (as much as the weather will allow) that helps if calling on Area staff.
Need for more skill sharing between Conservancies and other agencies
People with specialist skills need to be able to cross boundaries between
Conservancies and within Conservancy. More flexibility needed regarding their placement.
Monitoring staff based at Field Centres need to be considered for placements not
just Conservancy staff, even if they do have a wider focus.
Monitoring staff should try to spend some time with outside researchers working in their area -to keep in touch with the work and increase their understanding of its relevance.
The usefulness of establishing a skills register (e.g. on the Intranet) among DOC
monitoring staff was discussed. It was generally felt that it would have limited use as: a) it is difficult to maintain, and b) the situation can easily arise where people are being asked to have input into a variety of tasks that are not in their job descriptions and that they do not have the time to do.
1.6 Surveillance monitoring
Currently there is a greater focus on operational outcome monitoring within DOC, with little consideration of need for the long-term national information. Recognised that there is a need for a balance. Identified a need to establish a business case/support for funding for surveillance monitoring. Questioned how this could be started and identified that these was a need for direction from the Regions, and Science and Research. It would still be dependent on Conservancy commitment of funding for monitoring in non-managed areas.
Rob Allen's (Landcare Research) work may filter down into the system but it
needs to be advocated from within DOC as well.

215
1.7 Future of outcome monitoring
Rationale for animal pest operations and monitoring needs to be clearer. Situations were described where Area Managers have observed canopy collapse and specified that work is to be done in those locations. Acknowledged that in certain cases the work might not be justified.
Guidelines required on the appropriate level of monitoring for specific types of
project (upper and lower $ limits) and the percentage of the management budget that should be allocated to it. For example: if a control programme will cost over $x, then y-level/type of monitoring required. There is a draft Landcare Research report that gives some guidance (David Choquenot). Questioned whether all sites need to be monitored to the same level and what are the criteria on which these decisions should be based.
The Business Planning culture needs to accept that monitoring is an essential and
integral part of the management process and not something that might be done if there are spare dollars/resources. Specific monitoring outcomes should be included in business planning. Separate accounting would increase flexibility and control.
Need for sustainable funding to be allocated to outcome monitoring. In particular
need to ensure that in the event of cutbacks, operations need to be cut back rather than monitoring being cut back. Monitoring needs to be part of any operation. Need for long-term planning of monitoring - especially when working with Regional Plans or Recovery Groups.
Monitoring results could 'trigger' management actions - but trigger levels will
need to be pre-set and accepted by managers. 1.8 Information transfer
Information on what is happening out there, new approaches etc. needs to be easily available to all monitoring staff. Various options available: research summaries, the new database being developed by the CASs, Rarebits, perhaps a separate Monitoring newsletter. Or a chat-room or bulletin board accessible through the DOC Intranet.
2. ACTIONS REQUIRED 2.1 Standard Operating Procedures Identified a need for national guidance on outcome monitoring in the form of to standardise methodologies where appropriate. Action (and responsibility)
List of current SOPs on Register to be distributed to the monitoring network. (Astrid Dijkgraaf to action)
If not currently listed, need to register intent for the following SOPs:
- Ungulate monitoring, including exclosure plots (Sean Husheer to action)

216
- FBI *1 (Pim de Monchy to action)
- 20 x 20 m vegetation plots *2 (Cathy Allan to action).
Other potential SOPs include one for standard field assessments, bird monitoring, reporting procedures.
Need national guidance regarding when SOPs are appropriate, and agreed
procedure for setting up SOps for outcome monitoring (they should include workshops with input from field staff and allow for reviews, improvements etc) *3
*1 Much of the background work/research for this SOP will be contained in the Landcare
Research report on FBI. The report will need to be captured quickly once it is finished so that there are no unnecessary delays in the development of the SOP. (PRS to action)
*2 This will require wide national input including a national workshop to address the
methodology and what to do with the data/reporting etc. and a field assessment component.
*3 The work of setting procedures will rest primarily with Conservancy staff. 2.2 Staff and resources Action (and responsibility) Increase skill-sharing between Conservancies and outside agencies. Ongoing lobbying to arrange relevant staff transfers and exchanges and to work with 'outside' researchers/agencies. (All monitoring staff to action) Ongoing education/lobbying of line managers etc. with convincing reasons to ensure that outcome monitoring is included in workplans and that it is adequately resourced so that work can be completed, including 'new' surveillance monitoring projects. (All monitoring staff to action, especially those in Conservancies with historically low levels of monitoring) Recognised need to establish priorities; link in with Theo Stephens' work. (All monitoring staff to action) Monitoring staff to maintain knowledge-base of ongoing research and not to become complacent about 'established' methodologies. Managers encouraged to incorporate research into management ('adaptive management'). (All monitoring staff to action; possible involvement of 'National Monitoring Group' in co-ordinating overview of research undertaken) 2.3 Information requirements and information transfer Action (and responsibility) A 'National Survey and Monitoring Strategy' (see CPD policy for survey and monitoring) should be reconstituted. (PRS to action).

217
Define need and roles for a 'National Monitoring Group' (see feedback from discussion groups) and its relationship to DOC line-management structure. Draft discussion document to be prepared and distributed to monitoring staff for comment. (PRS to action). Determine what monitoring information (nationa/international; e.g. EPI Indicators Programme) is needed, their links with current work programmes, and set up process for ensuring consistent/quality information is accessible to monitoring staff. (PRS and the 'National Monitoring Group' to action) Scope content of a 'National Monitoring Database'. Identified need for workshop participants to have input to ensure database meets needs of those using it. Possibility of a questionnaire and/or survey to start with or the database could be discussed in the of a facilitated workshop. Users to have maximum input. (Responsibility for actioning not assigned)

218

219
Appendix 1 OUTCOME MONITORING WORKSHOP -ANIMAL PESTS: AGENDA AND PARTICIPANTS Day 1 Tuesday 1st June 1999 12.30 - 1.40 pm Participant arrival and lunch 1.40 pm - 1.50 pm Introduction. Keith Broome and Stephanie Turner (NRO) 1.50 pm - 2.45 pm What's the point of all this? Keith Broome (NRO) 2.45 pm - 3.15 pm Outcomes: that's what it's all about. Joseph Arand (CPD) 3.15 pm – 3.45pm Afternoon tea. 3.45 pm - 5.55 pm Conservancy Presentations I: Scope of Conservancy
pest control and restoration management. 6.00 pm - 6.30 pm General discussion 6.45 pm - 7.45 pm Evening meal. 8.00 pm - 8.45 pm Guest speaker: Rob Allen (Landcare Research,
Lincoln) Forest health assessment for reporting conservation
performance. Day 2 Wednesday 2nd June 1999 8.00 am - 10.05 am Monitoring Sika deer impacts in Kaweka and
Kaimanawa. Sean Husheer (Tongariro/Taupo) How does aerial foliar browse compare with ground
based foliar browse monitoring? Astrid Dijkgraaf (Wanganui) Using permanent plots and exclosures to assess
animal impacts. Cathy Allan (Southland) Monitoring possum palatable threatened plants as
ecological indicators. Nick Singers (Tongariro/Taupo) Monitoring the outcome of weed control operations. Chris Buddenhagen/Julie Geritzlehner (SRU) 10.05am-10.30 am Morning Coffee.

220
10.35 -12.35 pm: Ecosystem monitoring at Waipapa - Where We're At Hazed Speed (Pureora) Interpreting FBI data: Balancing sample size with
statistical robustness. Pete Corson and Mike Ogle (Waikato) Improving information transfer between research
providers and users. Phil Knightbridge (West Coast) The involvement of volunteers in monitoring
programmes. Steve Deverell (Tongariro/Taupo) The whys, whats and hows of communicating
monitoring information. Kate McNutt (Northland) 12.45pm – 1.30 pm. Lunch 1.30 pm - 3.50 pm Conservancy Presentations II: Understanding the
benefits of outcome monitoring -presentation of Conservancy results from outcome monitoring.
3.50 pm – 4.15 pm Afternoon Tea. 4.15 pm – 6.15 pm Conservancy presentations continued 6.15 pm - 7.15 pm General discussion. 7.30 pm Evening Meal Day 3 Thursday 3rd June 1999 8.00 am - 9.00 am Guest speaker: Bruce Burns, (Landcare Research,
Hamilton) Gap/non-gap monitoring - focusing on the forest. 9.00 am - 11.30 am Workshop facilitated discussion and feedback on key
issues. 11.30 am – 12.00 pm Workshop close. Keith Broome and Stephanie Turner (NRO) 12.00 pm Lunch and departure Suggested Topics for Discussion:
What are the main issues for the future of outcome monitoring in the Department?
Does DOC’s new structure work for monitoring?
Is a QCM approach appropriate to ecological monitoring?
Fostering closer relationships between Conservancy monitoring programmes.

221
Experimental design and the need to resist compromising good statistical methodology for practicalities.
Monitoring for management vs. monitoring for research.
Who's missing out on the monitoring network
Data storage, analysis options and reporting methods
Implementing the recommendations from outcome monitoring results - how to
influence the Business Planning process.

222
WORKSHOP TEAM Stephanie Turner Organiser and Workshop Chair Northern Regional Office Keith Broome Organiser Northern Regional Office Sonia Frimmel Scribe and Proceedings Editor (What's the Story?) HEAD OFFICE DIVISIONS/REGIONS Suzan Dopson BRU Joseph Arand* CPD James Goff* CRO Simon Kelton* NRO Phil Dawson* NRO Elaine Wright SRO Chris Buddenhagen* S&R Julie Geritzleher* S&R Alan Saunders S&R Rex Bartholemew Ecological Skills Training CONSERVANCIES Kate McNutt Northland Andrew Harrison EC/Hawke’s Bay Patrick Whaley Northland Dave Wilson EC/Hawke’s Bay Geoff Woodhouse Northland Lindsay Wilson EC/Hawke’s Bay Phil Todd Auckland Philippa Crisp Wellington George Wilson Auckland Colin Giddy Wellington Thelma Wilson Auckland Judy Dix Nelson/Marl. Pete Corson Waikato Greg Napp Nelson/Marl. Pim de Monchy Waikato Tom Belton West Coast Mike Ogle Waikato Fiona Bockett West Coast Hazel Speed Waikato Phil Knightbridge West Coast John Gumbley* Waikato Neil Bolton Canterbury Ron Keyzer Bay of Plenty Chris Woolmore Canterbury Dale Williams Bay of Plenty Bruce Kyle Otago Steve Deverell Tongariro/Taupo Shirley McQueen Otago Sean Husheer Tongariro/Taupo Cathy Allan Southland Nick Singers* Tongariro/Taupo Wayne Baxter Southland Astrid Dijkgraaf Wanganui EXTERNAL SPEAKERS Rob Allen* Manaaki Whenua – Landcare Research, Lincoln Bruce Burns* Manaaki Whenua – Landcare Research, Hamilton * Not at all sessions

223
Appendix 2 ANALYSIS OF PARTICIPANT QUESTIONNAIRE Summary Of the 42 participants at the Workshop 26 filled in the questionnaire (62%). All respondents found the Workshop valuable, although to varying degrees. Analysis of the multiple-choice questions clearly indicates a favourable reaction overall (see graphs overleaf). There seemed to be a view that this Workshop was only a start and that some sort of on-going/regular workshop or equivalent be desirable. People found the opportunity to meet others involved in Outcome Monitoring and to see how everything fitted together nationally particularly useful. The only significant criticism was that there was not enough time for formal and informal discussions. A number of participants suggested that having two Conservancy presentations was too much. One would have sufficed and this would have freed up more time for questions and discussions. There were several comments made about specific presentations (both positive and negative) but no clear preference trend could be established. Multi-choice responses
Question-specific comments
Respondent was previously aware of contribution (2).
Not too sure what the relationship between QCM and monitoring should be.
No specific discussion of the relationship except for Joseph Arand’s talk.

224
Question-specific comments Information sharing in a limited range. Little discussion of options available.
Not enough discussion/presentation on the detail of the options: the end result vs. practicalities.
Question-specific comments Many key people were present, especially for forests and pests.
Not enough nuts and bolts discussion, i.e. comparisons in sampling vs. results, new techniques.
Answered as many questions as it created
Question-specific comments Too little time on identifying/discussing improved methods/skills.
Some general discussion of the issues occurred in working groups and good,
specific recommendations emerged.
Additional comments
General The Workshop highlighted how many outcome monitoring projects/programmes
DOC funds and the huge variety in methods and quality. I hope the Workshop leads to consistency (methods/data/reports) and higher quality.
The idea of the Workshop was extremely good and it has been very valuable. However, it is just a starting point and needs to be built on.
In all a good forum which needs to be repeated annually.
Stirs the grey matter, eliminated stagnation. More such workshops would be very beneficial.
Lots of good ideas came out of the Workshop
Overall a really worthwhile get-together.

225
Great food, great organisation, great talks and guest speakers. No major improvements needed for next year!
Excellent location, good food. Would have been good to have sticky name tags.
Excellent workshop, very beneficial. Good venue.
Specific presentations CPD talk seemed irrelevant and tedious. Showed how 'out of touch' some Head
Office projects are.
Rob Allen's talk was enlightening and I enjoyed the way it made people think.
The talks by Rob and Bruce were the most stimulating aspects of this Workshop. There were a lot of presentations that were not necessary.
Information The Workshop Proceedings will be invaluable.
The Intranet will be very useful for this.
Networking Great get together and touch base. The group was keen and a lot of work got
done.
Very interesting to hear what others are doing, meet people and cement relationships.
Very, very useful to make contacts and discuss work across Conservancies - know where I fit into the big picture nationwide.
I still came away a little unclear as to how Regional Office roles fit in. For example, do they have a national co-ordination role?
Good to hear Conservancy summaries, I now have a better idea of what's going on.
Appreciated the opportunity to have a say.
Excellent forum to gain an overview of the direction monitoring is taking in DOC. The material and contacts will enable me to have far more focused input into the training programme.
Agenda issues It would have been good just to have one lot of Conservancy presentations, as a
lot of information being presented in both sessions will be published. This would freed up Day 2 for discussions rather than cutting into the evenings. People need downtime/social time at these sons of things; a lot of work does get done in the 'informal' times.
There is a risk of people not taking in information if too much is fitted into one day. Need more time for informal networking.
Very tight/full schedule, perhaps too full.
More time for informal discussion.

226
I think one presentation from each Conservancy would have been enough. This would have allowed more time for both formal and informal discussion. Otherwise excellent.
Case studies were interesting, but too many for time allowed.
In future spend less time with Conservancy overviews or make them more
consistent.
Suggest a not so full agenda next time: more time to come up with ideas (space to think).
Maybe have only one presentation per Conservancy and more time for general
discussion.
More time for questions and discussions after speakers would have been desirable. Maybe less speakers to enable this. Some Conservancy presentations were duplicated.
Lots of presentations, lots of discussion regarding aspects that we all know about
and agree with, a lot of discussion on factors that do not directly affect many participants.
I was hoping that we would deal with some of the impending computer issues
with Connect 2000.That is:
- PC series of programmes not currently supported
- Data files for above are not considered
- Difficult file management system in the new system
- System reliability, reports are poor.
Next time we should move beyond vegetation and herbivore issues and beyond
forest ecosystems but remain focused on management issues.
Very strong vegetation monitoring component -needs to be balanced with more animal monitoring.

227
Appendix 3 CONSERVANCY PEST CONTROL OPERATIONS AND OUTCOME MONITORING SUMMARIES
Appendix 3 for Science & Research Internal Report is not currently
available in electronic form.
Please contact Knowledge Services at the Department of Conservation to request a copy.