outbreaks of the crown-of-thorns starfish on the great
TRANSCRIPT

REPORT
2018
OUTBREAKS OF THE CROWN-OF-THORNS STARFISH ON THE GREAT BARRIER REEF Current Status, Emerging Trends And Developing Issues Of Concern

2
Report prepared by Dr Udo Engelhardt, Director Reefcare International Pty. Ltd. Cairns, Queensland, Australia. Prepared for WWF-Australia in December 2018
Front page image © Lisa Bostrom Einarsson / WWF-Aus
CONTENTSEXECUTIVE SUMMARY 3
Current status of COTS on the GBR 3
Synergistic effects of COTS outbreaks with mass coral bleaching events 4
COTS outbreak prevention and mitigation – the reef water quality link 4
Key Findings & Recommendations 5
ACRONYMS USED 6
INTRODUCTION 7
The link between COTS outbreaks and reef water quality pollution 7
Past outbreaks of COTS on the GBR 9
Current COTS outbreaks on the GBR 10
Status of coral communities on the GBR 11
Coral loss due to COTS predation 13
The population dynamics of A. planci cf. solaris 15
Estimation of probable age classes of A. planci cf. solaris 15
Synergistic effects of COTS outbreaks and coral bleaching events 18
REFERENCES 20
3 WWF-Australia: COTS Report 2018
EXECUTIVE SUMMARYIn recent years, coral communities across the Great Barrier Reef (GBR) have suffered serious declines due to the occurrence of an unprecedented series of events, including the fourth recorded reef-wide episode of outbreaks of the coral-eating crown-of-thorns starfish (COTS; Acanthaster planci cf. solaris), back-to-back mass coral bleaching events in 2016 and 2017, as well as significant cyclone damage. In 2013, the effects of both COTS outbreaks and cyclone damage were identified as the main drivers responsible for the lowest mean cover of hard corals (estimated at only 17%) recorded across the GBR since the inception of reef-wide monitoring back in 1986. In 2016, a further 30% of the GBR’s remaining hard coral cover died as a result of mass coral bleaching (Hughes et al. 2017). Preliminary analyses of surveys, conducted after the subsequent bleaching event in 2017, suggest that coral cover across the GBR is now at a historic low (Hughes, pers. comm.). Whilst the predicted increase in both the frequency and severity of mass coral bleaching events in the coming years is now widely seen as the most serious threat to the long-term survival of the GBR, continuing COTS outbreaks remain a similarly critical disturbance to the reef. This report provides an up-to-date synopsis of the current state of both COTS populations and hard coral communities on the GBR. The report also outlines the options available to management aimed at mitigating the detrimental effects of starfish outbreaks. Particular emphasis is given to the key role of improving reef water quality through the reduction of nutrient-rich run-off from agricultural areas. Emerging concerns about a possible shift to more chronic starfish outbreaks in the central GBR region are outlined.
Current status of crown of thorns starfish on the Great Barrier ReefThe GBR is currently experiencing the fourth recorded reef-wide COTS outbreak episode. Whilst the timing of this latest episode is consistent with the previously observed 15-17 year cycle between outbreaks, there are a few notable differences with this latest episode. Published survey data suggests that a significantly higher proportion of reefs is being affected during this latest event. At the peak of the current outbreak episode, back in 2013, close to 30% of the reefs surveyed by a reef-wide monitoring program recorded a COTS outbreak. This figure indicates that, during the current episode, the proportion of reefs affected by the starfish has actually increased by about 50% when compared to previous outbreak cycles. Furthermore, recent surveys have detected an increasing number of outbreaks in areas of the reef that have previously been relatively unaffected by the phenomenon. This includes reefs in the northern GBR region, an area previously considered to be near pristine, and also in the southern GBR region, where the Swain reefs are particularly affected by starfish outbreaks. However, the central GBR region, between Lizard Island and Townsville still remains the most seriously COTS-affected part of the GBR, with an estimated 90% of mid-shelf reefs in this area having recorded outbreaks during the current episode.
Whilst the proportion of COTS-affected reefs appears to have increased in recent times, the actual peak densities of starfish recorded on outbreaking reefs may be somewhat lower than previously recorded. This observation is, however, entirely consistent with the current, widely degraded state of the GBR, with the reef-wide cover of live coral at just over or around the lowest levels ever recorded. Just as it would be in any other predator-prey (COTS–coral) system, the reduced availability of the prey (low hard coral cover), effectively suppresses the numbers of its predators (the COTS). However, even somewhat at reduced densities, COTS outbreaks still have the potential to further decimate the available cover of live coral.
Recent site inspections on reefs in the Port Douglas to Cairns area of the GBR, the key reef tourism area, suggest that active settlement and recruitment of COTS onto local reefs is ongoing. For example,

4 WWF-Australia: COTS Report 2018
a high value reef-tourism site located offshore Cairns has now recorded its seventh, consecutive year of COTS larval settlement and recruitment. This pattern clearly demonstrates that the environmental conditions favouring successful COTS recruitment (e.g. high nutrient loadings, reduced predator abundances) are regionally-persistent, and could in fact be contributing to the development of chronically-elevated populations of the starfish. Improved monitoring of COTS recruitment success in this important area of the reef is seen as critically important if further reef degradation in the near future is to be prevented.
The documented low coral cover, combined with widespread and persistent starfish outbreaks, is a significant concern as the co-occurrence of these factors could potentially lock the reef system into a pattern of step-wise reef degradation, where coral cover is simply unable to fully recover between successive outbreak events. This undesirable situation could worsen further if the projected increases in the frequency and severity of mass coral bleaching events were to eventuate. A recently issued El Nino alert for the entire GBR region suggests a strong possibility of renewed mass coral bleaching to occur in the 2018-19 Australian summer. Clearly the current status of both COTS and coral populations on the GBR requires urgent actions to prevent and/or mitigate the effects of this ‘perfect storm’ of ecological disturbances on the reef.
Synergistic effects of COTS outbreaks with mass coral bleaching eventsRecent surveys of post-bleaching reefs in the Seychelles have identified possible synergistic effects between COTS outbreaks and coral bleaching events. Field observations have shown that the few surviving, and apparently heat-resistant, hard corals on post-bleaching reefs were being targeted by the starfish, effectively killing off the only corals exhibiting any positive signs of adaptation to increasing climate stress. In these circumstances, the starfish’s feeding activity does not only result in simply causing additional hard coral mortality, but also seriously reduces the abundance of resilient corals that are critical for the reefs’ recovery and long-term survival. The survival of heat-resistant or resilient corals is the most critical factor for promoting temperature acclimation within coral communities in response to increasing climate stress. These latest observations strongly suggest that both key ecological threats – COTS outbreaks and mass coral bleaching events – must be considered and managed together as part of a coherent and coordinated program. Whilst comparable reports of post-bleaching COTS impacts on coral communities have not yet been published for the GBR, this newly discovered synergistic effect warrants further investigation.
COTS outbreak prevention and mitigation – the reef water quality linkMeaningful, targeted management regimes aiming to deal effectively with both the causes and consequences of the COTS phenomenon on the GBR are more important than ever, as both climate change impacts and storm damage cannot be prevented at either a local or regional level. However, improving reef water quality through significant reductions in the nutrient loadings of terrestrial run-off, has the potential to break through the observed cycle of frequent and widespread outbreaks across much of the GBR reef region. Science has established a clear link between nutrient enrichment of reef waters, and an increased likelihood of developing COTS outbreaks (Brodie et al. 2005; Fabricius et al. 2010; Brodie et al. 2017). Seepage of nitrogenous fertilisers from sugar cane areas is still the main source of this pollution, which can promote COTS outbreaks via algal blooms, stimulated zooplankton growth and increased COTS larval survival. Drastically reducing nutrient loadings in GBR waters would almost certainly reduce the incidence and/or severity of COTS outbreaks, just like drastically reducing carbon emissions would mitigate the effects of climate change and coral bleaching – there simply are no other measures available with a comparable, positive effect on the long-term health of the GBR.
Unfortunately, on both ‘ecological fronts’ - significantly improving reef water quality, and effectively controlling COTS populations – recent assessments suggest that little real progress has been made

5 WWF-Australia: COTS Report 2018
on mitigating the ecological effects of COTS population outbreaks on the GBR. For example, a recent assessment of water quality in river catchments and coastal waters in the GBR region has again demonstrated that nutrient loads to the reef via the four key river catchments, located upstream of the main COTS outbreak area, remain high, with little sign of a significant downward trend in nutrient status observed (Waterhouse et al. 2018). There is a broad, scientific consensus that current water quality management regimes are insufficient for achieving a significant reduction in the nutrient loadings contained in terrestrial run-off (Waterhouse et al. 2017), with reef water quality likely to remain at levels that will further promote the occurrence of starfish outbreaks in the central GBR region.
Key Findings & Recommendations
COTS and water quality link: There is convincing evidence that high levels of certain nutrients in reef waters, particularly dissolved inorganic nitrogen (DIN), can promote and exacerbate the development of COTS outbreaks. The commonly excessive, and often illegal, use of large quantities of industrial fertilisers has been identified as the main source of nutrients causing and/or exacerbating COTS outbreaks on the GBR.
• Improvements to reef water quality need to be pursued as a matter of the highest priority. Significantly lowering the nutrient loadings out of river catchments in the Wet Tropics area and the Burdekin is critically important for preventing the establishment of renewed and possibly more chronic COTS outbreaks in the central GBR region.
• The use of industrial fertilisers has to be far more effectively regulated and controlled with a stronger enforcement of existing laws urgently required.
COTS Status: The fourth recorded COTS outbreak episode is continuing on the GBR, with outbreaks apparently more widespread than during previous episodes. Recent data suggests that there has been up to a 50% increase in the number of reefs affected by outbreaks. However, the mean density of COTS on outbreak-affected reefs appears somewhat lower than previously recorded.
• Monitoring activities should be stepped up to provide an in-depth assessment of the COTS population characteristics of the widespread and unprecedented outbreaks recently recorded in the northern and southern parts of the GBR.
• Using all available data sources from the 1960’s onwards, a desktop study into the relationship between COTS abundance and coral cover on the GBR should investigate the evidence for a possible step-wise degradation of both coral and COTS populations.
COTS Populations: Based on available size-frequency distributions, and in line with previous observations from the third recorded outbreak episode, current COTS outbreaks appear to be comprised of multiple, consecutive year classes. This suggests that outbreaks are the result of persistent high levels of starfish recruitment, leading to concerns that ongoing recruitment could support the development of more chronic outbreaks.
• COTS monitoring activities should be scaled up to again include the COTS fine-scale survey technique originally developed in the 1990’s. This intensive, high-resolution monitoring method can (i) detect developing starfish outbreaks up two years prior to the development of an outbreak, and (ii) provides critical age-structured COTS population data to investigate starfish population dynamics and underlying outbreak causality.

6 WWF-Australia: COTS Report 2018
ACRONYMS USED
AIMS Australian Institute of Marine Science
AIMS LTMP Australian Institute of Marine Science Long-Term Monitoring Report
AMPTO Association of Marine Park Tourism Operators
COTS crown-of-thorns starfish
CSIR Commonwealth Scientific and Industrial Research Organisation
CRC Reef Cooperative Research Centre for the Great Barrier Reef World Heritage Area
GBRMPA Great Barrier Reef Marine Park Authority
GBRMP Great Barrier Reef Marine Park
JCU James Cook University
LHCC Loss of hard coral cover
RCINT Reefcare International Pty Ltd
RRRC Reef and Rainforest Research Centre
WWF Worldwide Fund for Nature (Australia)
7 WWF-Australia: COTS Report 2018
INTRODUCTIONIn the period from 1985 to 2012, the GBR lost approximately 50% of its pre-existing hard coral cover, with outbreaks of the crown-of-thorns starfish (COTS; Acanthaster planci cf. solaris) accounting for some 42% of the coral mortality observed (De’ath et al. 2012). Outbreaking populations of the starfish can reduce the live cover of hard corals at a rapid rate, with coral loss of more than 90% frequently recorded during severe outbreaks (Moran 1988, Engelhardt et al. 2001, 2002). Unsustainably-high or outbreaking populations of this starfish have been recorded repeatedly since the early 1960’s, with major outbreak episodes having occurred at fairly regular intervals of approximately 15-17 years. The outbreaks have been concentrated on the reefs in the central parts of the GBR between Lizard Island and the Whitsunday Islands. Currently, coral reefs in the Innisfail to Townsville region of the central GBR are experiencing the fourth known major outbreak episode, with additional, active outbreaks also observed in the Swain reefs near the southern end of the GBR, as well in the northern GBR region offshore the Cape York peninsula.
It has generally been acknowledged that outbreaks of COTS may be caused by a multiplicity of factors, which may differ in their relevance in both time and space. For several decades, a lack of reliable data on the dynamics and age structures of starfish populations before, during and after outbreaks was the main stumbling block for achieving more rapid progress on the key question of outbreak causality (Birkeland and Lucas 1990, Engelhardt and Lassig 1997). However, from the 1980’s to the early 2000’s, coordinated programs of multi-disciplinary scientific research attempted to address this key issue. This research effort led to significant advances in our understanding of the outbreak phenomenon on the GBR, particularly in relation to the two main hypotheses implicating human activities in outbreak causation - the role of nutrients derived from terrestrial sources (the ‘terrestrial run-off hypothesis’; Birkeland 1982), and on the effects of commercial exploitation of some of the natural predators of the starfish (the ‘predator removal hypothesis’; Endean 1969).
In support of a ‘natural causes hypothesis’ for outbreaks, some researchers have identified the high potential of A. planci cf. solaris to produce massive numbers of offspring under favourable conditions (Babcock and Mundy 1993). Fertilisation success in COTS was found to depend, not only on the synchrony in spawning times, but also on the spatial distribution of COTS within reef habitats. In situ fertilisation rates measured by Babcock (1992) and Babcock and Mundy (1993) were the highest measured for any of the invertebrates observed, with 60-70% fertilisation where male and female starfish were separated by approximately 10 metres. Measurable fertilisation still occurred when spawning animals were separated by up to 100 metres. Researchers concluded that COTS outbreaks may be initiated from a relatively small population of COTS through spawning synchrony and aggregative behaviour (Babcock and Mundy (1993; Benzie and Dixon 1994). The fact that relatively low COTS population densities may be sufficient to trigger new outbreaks is of key importance, particularly when assessing the efficacy of targeted COTS controls programs. The starfish’s ability to rebuild its population from a low base ‘stock’ highlights the risks potentially associated with inadequate control measures that allow COTS to remain above the suggested reproductive threshold density. The ecological risks associated with the current COTS control measures on the GBR should be assessed as a matter of priority, and in the contest of the starfish’s described reproductive capabilities.
The link between COTS outbreaks and reef water quality pollutionIt has been shown that river discharge is the main source of land-based pollutants (i.e. sediments, nutrients and pesticides) to the GBR lagoon (Waterhouse et al. 2017, 2018). However, there are major differences in both the distribution and movement of different pollutants from wet and dry rivers in the tropics (Devlin and Brodie 2005; Devlin and Schaffelke 2009). There is clear evidence to show that there has been a 3-5 fold increase in the export of sediments and nutrients from Queensland

8 WWF-Australia: COTS Report 2018
highly probable that nutrient loadings in some parts the GBR, at least in the short-term, have also increased through these activities. Because COTS populations most commonly occur on mid-shelf reefs (Moran et al. 1992), it was previously assumed that most recruitment events on the GBR would occur in relative isolation from terrestrial influences. However, monitoring of major river plumes has confirmed the occasional extension of coastal influences out to mid-shelf regions (Devlin and Schaffelke 2009, Brodie et al. 2011, Devlin et al. 2012). Current strength and direction of the prevailing winds have been shown to strongly affect the cross-shelf extent of these plumes. The timing and frequency of major run-off events are unpredictable, as are COTS spawning events. Consequently, it has been rarely possible to reliably match the spatial and temporal occurrence of river plumes with COTS larval clouds. However, in 1990-91, a major river run-off event in the Cairns to Cooktown region coincided with the summer reproductive season of A. planci cf. solaris. The persistent monsoonal rain depression associated with tropical cyclone ‘Joy’, resulted in widespread plumes of low salinity water coupled with high nutrient levels, and higher than usual chlorophyll a concentrations. Chlorophyll concentrations peaked at above the suggested threshold level for COTS larval development of 0.5 µg l-1 (Lucas 1982; Okaji 1996) leading Furnas (1996) to tentatively link the plumes to the subsequent outbreaks recorded in this region. Laboratory experiments have shown that the odds of the starfish larvae successfully completing development increases 8-fold with every doubling of the concentration of chlorophyll a in the water (Fabricius et al. 2010).
The most recent, GBR-wide assessment of inshore reef water quality concluded that there were few signs of any significant recent reductions in nutrient loadings in the key river catchments along the Queensland coast (Waterhouse et al. 2018). Plankton biomass production in the GBR is generally thought to be limited by the availability of nitrogen, particularly dissolved inorganic nitrogen (DIN). Consequently, these nutrients are typically taken up by microbiota at a rapid rate, making it difficult to detect persistent trends (Waterhouse et al. 2018). Calculated end-of-catchment pollutant loads for the 2016–17 sampling period showed that dissolved inorganic nitrogen (DIN) was again the dominant nutrient export from both the Proserpine-O’Connell-Pioneer-Plane and the Tully-Murray-Herbert river basins. As these are the main river catchments feeding into the central GBR lagoon area, outbreaking populations of COTS recorded in this region may be the ‘end-of-chain’ beneficiaries of elevated nitrogen and phytoplankton levels. The data presented by Waterhouse et al. (2018) again demonstrates the repeated spatial overlap of COTS outbreaks and elevated nitrogenous pollution of reef waters. These latest findings lend additional empirical support to the hypothesis that primary outbreaks of COTS are much more likely to develop in reef areas with elevated dissolved nutrients (Fabricius et al. 2010; Brodie et al. 2017). Using plausible historic increases in river nutrient loads over the last 200 years, Fabricius et al (2010) calculated that the frequency of COTS outbreaks on the GBR has likely increased from one in 50–80 years to one every 15 years. Furthermore, the model outputs suggest that the coral cover of reefs in the central GBR in the early 2000’s may have been at only 30–40% of its potential value i.e. in the absence of frequent starfish outbreaks.
Documents recently obtained by the Australian Broadcasting Cooperation (ABC) under Right-to-Information (RTI) legislation, show that the Queensland Government’s $261 million Reef Water Quality program is not achieving the desired significant reductions in nitrogen-rich fertiliser run-off into GBR waters (http://www.abc.net.au/news/2018-10-11/laws-not-stopping-fertilser-runoff-to-reef/10348718). Excessively-high applications of nitrogenous fertilisers on sugar cane farms are still common place, with some 49% of sugar cane farms audited by government agencies in 2017-18 found to be in breach of at least some the laws governing the use of agricultural fertilisers. The Queensland Department of Environment and Science (DES) acknowledges that diffuse source pollution of nitrogen, phosphorous, fine sediments and pesticides from agriculture is the main source of water pollution in the GBR. However, there is no evidence to suggest that reef water quality is significantly improving as a result of current government programs. Water quality monitoring on farms, in rivers and out in the GBR lagoon are all demonstrating little effect of the current measures (Waterhouse et al. 2017, 2018).
These consistent findings are of particular concern, as they suggest that the identified main driver of COTS outbreaks in the central GBR region is not being dealt with effectively. The current, business-as-usual approach to the management of agricultural run-off along the GBR offers little hope that the

9 WWF-Australia: COTS Report 2018
frequent COTS outbreak cycles can be effectively mitigated or even prevented. Ongoing, successful recruitment of the starfish to reefs in the key tourism area between Port Douglas and Cairns clearly demonstrates that the underlying driver of COTS outbreaks continues to function unabated. Dedicated COTS fine-scale surveys conducted in the late 1990’s first raised the possibility that starfish outbreaks were becoming more frequent or persistent (Engelhardt et al. 2000, 2001). These surveys demonstrated that recruitment of starfish onto reefs was happening simultaneously across a wide geographic range and over several consecutive years, suggesting that the ecological driver(s) behind the observed outbreaks were also widespread and persistent. This scenario raises the spectre of more chronic outbreaks of COTS developing in the central region of the GBR. Continuing high levels of COTS recruitment observed in recent years on some reefs off Cairns provide additional, circumstantial evidence for the possible evolution of this scenario.
Past outbreaks of COTS on the GBROver the last 50 or so years, major COTS outbreaks on the GBR have originated on reefs in the Cairns Section (14o30’S-17o52’S) of the Great Barrier Reef Marine Park (Kenchington 1977, Moran et al. 1992; Engelhardt and Lassig 1997). Recently, this area has been described as a distinct ‘initiation box’ for COTS outbreaks on the GBR, with the ‘box’ suggested to cover the area between Lizard Island and Cairns (Pratchett et al. 2014). From there, typically, the outbreaks spread predominantly to the south over a decade or so before waning at about latitude 21oS (Reichelt et al. 1990; Moran et al. 1992).
During the first two outbreak episodes, in the early 1960’s and again in the late 1970’s, outbreaking populations of A. planci cf. solaris were first observed on Green Island Reef off Cairns (16o46’S), with a number of surrounding reefs also being affected at about the same time (Moran 1986). However, dedicated surveys of starfish populations were initiated only several years later, when the outbreaks had apparently progressed several hundreds of kilometres from their suggested geographic origin (Dight et al. 1990, Moran et al. 1992). Similar time lags in responding to apparent increases in COTS densities in the ‘initiation box’ have occurred several times since. Consequently, critical COTS and coral population data remains somewhat patchy and incomplete. This holds particularly true for the first two recorded outbreak episodes from 1962-1974 and 1979-1991, which were not anticipated or planned for, resulting in a real dearth of information on the dynamics of COTS population before, during and after these outbreak events (Birkeland and Lucas 1990). While outbreak patterns appear to be fairly consistent over time, there are no reliable comparative data to assess the relative extent or severity of the first and second outbreak episodes. Effective quantitative comparisons are further hindered because a variety of survey techniques, including manta tows (Moran et al. 1992) and timed swim searches (Pearson and Endean 1969; Kenchington 1976) were used in these earlier surveys. Reefs were occasionally confused and published locations were at times ambiguous. Some survey data were aggregated into such broad categories as to defy meaningful ecological interpretation. A lack of consistent definitions of what constitutes an outbreak further compounds the confusion in some of the older data sets.
A standardised and consistent monitoring scheme for COTS was only introduced in 1986, when the Australian Institute of Marine Science (AIMS) instigated a reef-wide, annual broad-scale monitoring program for both COTS and corals using the manta tow technique. Since then, AIMS’s Long-Term Monitoring Project (LTMP) has continued to provide reliable, quantitative estimates of both hard coral cover and the incidence of COTS outbreaks on the GBR. Whilst other forms of COTS monitoring (including transect-based fine-scale monitoring and swim searches to assist COTS control efforts) have been undertaken at various times over the past 25 or so years, the AIMS LTMP data provide the only consistent reef status reporting that allows for actual comparisons between individual outbreak episodes. Figures 1 and 2 (see below) show the most recent time-series data for the distribution of COTS outbreaks as well as mean COTS densities across the reef. Annual broad-scale surveys using the manta tow technique have established that, during second GBR-wide episode (1979-1991), some 17% of reefs were affected to various degrees by outbreaks (Moran et al. 1992). During this period, starfish activity was found to be concentrated largely within the central third of the GBR, from about the Lizard Island area (14o40’S) in the north to reefs south of Townsville (20o30’S).

10 WWF-Australia: COTS Report 2018
For the third recorded COTS outbreak episode from 1993 to 2006, the AIMS LTMP data suggests that a similar proportion of reefs was again affected across the GBR region, with a peak of around 18% of the reefs surveyed in 2000 recording outbreaks (Fig. 1).
Current COTS outbreaks on the GBRThe proportion of reefs affected by COTS outbreaks during the current (fourth) recorded outbreak episode appears to be markedly higher, with some 29% of the reefs surveyed by AIMS in 2013 recording outbreaks (Fig. 1). Interestingly, AIMS’ survey data also suggests a possible change in the relationship between COTS densities and the proportion of reefs affected by outbreaks in recent times. Whilst actual COTS density and outbreak peaks showed a high degree of temporal synchrony across the second and third outbreak episodes, this pattern appears to have broken down in the current (fourth) episode. Recent manta tow data suggest that a significantly higher proportion of reefs is being affected by COTS outbreaks, but that the mean density of starfish on outbreaking reefs is significantly lower than during previous episodes (Figs. 1 and 2; Table 1).
Assuming that the AIMS data describes a true and representative pattern, the survey results suggest that COTS outbreaks may in fact be becoming more widespread across the GBR. Whilst the
Figure 1: Time-series plot of the percentage of reefs with COTS outbreaks across the GBR.(AIMS LTMP manta tow data 1986–2017; Graph copied from http://data.aims.gov.au/waCOTSPage/cotspage.jsp)
Figure 2: Time-series plot of the mean relative abundance (density*) of COTS on reefs across the GBR.(AIMS LTMP manta tow data 1986-2017; * density = mean number of COTS per 2 min. manta tow;
Graph copied from http://data.aims.gov.au/waCOTSPage/cotspage.jsp)

11 WWF-Australia: COTS Report 2018
the proportion of COTS-affected reefs has apparently gone up, the actual peak densities of starfish recorded on outbreaking reefs appear to be lower than previously recorded. This observation, which initially might appear contradictory, is actually entirely consistent with the current state of the GBR, with the cover of live hard coral in the northern and central parts of the GBR at or around the lowest levels ever recorded (Fig. 3; Sweatman 2018). Just as it would be in any other predator-prey (COTS–coral) system, the reduced availability of the prey (low hard coral cover), effectively suppresses the numbers of its predators (the COTS). However, even with these somewhat reduced population densities, COTS still have the potential to further decimate the available cover of live coral.
It is worth noting that possible operational changes to the AIMS LTMP program (e.g. different sets of ‘core’ reefs, or a reduced number reefs surveyed) may have contributed to the observed pattern change. Similarly, the current COTS control program on the GBR may have affected the numbers of starfish actually available and visible to manta tow observers. This in turn, may have lowered the field estimates of the LTMP observers. However, a more detailed investigation into such factors was beyond the scope of this report.
Status of coral communities on the GBRThe most recent summary report of AIMS’s LTMP surveys (Sweatman 2018) paints a gloomy picture of the current condition of coral communities on the GBR. The latest reef-wide surveys, conducted in 2017-18, identified an unprecedented steep decline in hard coral cover across all three reef monitoring sectors (Figures 3a-c), with cumulative impacts due to a combination of COTS outbreaks, coral bleaching and storm damage responsible for the observed declines. However, the relative contribution of these factors to declining coral cover varied markedly between the sections.
Active COTS outbreaks contributed to the observed declines in coral cover in the Northern GBR region (Fig. 3a), but the relative contribution of the various disturbances could not be determined.
Figure 3a: Trends in mean hard coral cover in the Northern GBR sector estimated from AIMS’ manta tow surveys for the period from 1986 to March 2018. Graphs copied from https://www.aims.gov.au/reef-monitoring/gbr-condition-summary-2017-2018 (Sweatman 2018); where N shows the actual number of reefs surveyed in each section, and the blue, shaded area represents 95% certainty around the estimate.
Figure 3b: Trends in mean hard coral cover in the Central GBR sector estimated from AIMS’ manta tow surveys for the period from 1986 to March 2018. Graphs copied from https://www.aims.gov.au/reef-monitoring/gbr-condition-summary-2017-2018 (Sweatman 2018); where N shows the actual number of reefs surveyed in each section, and the blue, shaded area represents 95% certainty around the estimate.
Figure 3c: Trends in mean hard coral cover in the Southern GBR sector estimated from AIMS’ manta tow surveys for the period from 1986 to March 2018. Graphs copied from https://www.aims.gov.au/reef-monitoring/gbr-condition-summary-2017-2018 (Sweatman 2018); where N shows the actual number of reefs surveyed in each section, and the blue, shaded area represents 95% certainty around the estimate.
Reefs in the Central GBR region suffered significant losses of coral cover due to the combined effects of coral bleaching and COTS outbreaks, with average live coral cover declining from 22% in 2016 to only 14% in 2018 (Fig. 3b). COTS activity in the Central GBR region did increase as the moving ‘wave’ of outbreaks moved further southward. In contrast, COTS outbreaks were clearly identified as the primary driver of the declines in coral cover observed on reefs in the Swains region, in the southern GBR. Here coral cover declined from a mean of 33% in 2017 down to 25% in 2018 (Fig. 3c). Estimates for the southern GBR region include additional survey data provided by the GBRMPA -QPWS Field

12 WWF-Australia: COTS Report 2018
Management Team, which also found that a majority of the Swain Reefs had fairly ‘intense’ outbreaks.
The survey reports published by AIMS’ LTMP program are the only publicly available source of information on the current status of COTS populations and coral communities across the GBR. Unfortunately, other reef management activities, such as the COTS surveys undertaken by the GBRMPA-QPWS field management team and the current COTS controls program, do not make their data as readily available as the AIMS. For example, the AMPTO/RRRC COTS controls program has not published any detailed data reports in 5 years of operation. The only data available from this source is a small sub-set of COTS and coral data for the period from 2013 to 2015, which can be viewed on www.eatlas.org.au. The 2013-15 COTS controls data set was formally reviewed in 2015 (Engelhardt 2015), with the analysis showing that more than 90% of mid-shelf reefs in the Cairns Section of the GBRMP had suffered active COTS outbreaks in the study period (Table 1 b). The locational spread of these outbreaks is shown in Figure 4, with colour-coded estimates of COTS densities based on COTS-Per-Unit-Effort (CPUE) data used rather than independent survey data. It would be highly desirable to change the reporting arrangements for these programs to allow both the research community and the public to gain a better and more timely understanding of the GBR’s current status.
A comparison of some key COTS outbreak statistics for the last two episodes is particularly insightful, as it highlights both the (i) the inter-outbreak reductions in mean COTS density and live coral cover across the GBR (Table 1a), and (ii) the continuing high proportion of COTS-affected reefs in the central GBR region (Table 1b).
For example, over a seven-year period from 1994 to 2001, a dedicated fine-scale monitoring program for COTS surveyed mid-shelf reefs across some four degrees of latitude from Lizard Island Reef in the North, down to Lodestone Reef in the South (Engelhardt et al. 1998, 1999, 2000, 2001). All of the randomly-selected, and annually-surveyed reefs experienced active or incipient COTS outbreaks at some time during the seven-year study period (Engelhardt 2001). The survey results clearly demonstrated that 100% of the mid-shelf reefs in the central GBR region were affected by COTS outbreaks during the third recorded outbreak episode (1993-2006).
(a) GBR-wide % reefs with outbreaks Mean COTS density Live hard coral1 (1962-1975) N/Ax N/Ax N/Ax
2 (1979-1991) 17% (1987) 0.9 (1989) 28% (1986)
3 (1993-2006) 18% (2000) 1.2 (2003) 23% (1997)
4 (2011-ongoing) 29% (2013) 0.23 (2013) 17% (2013)
(b) Central GBR % reefs with outbreaks Mean COTS density Live hard coral1 (1962-1975) N/Ax N/Ax N/Ax
2 (1979-1991) N/Az N/Az N/Az
3 (1993-2006) 100% (FSS data) N/Az 21% (1997)
4 (2011-ongoing) >90% (COTS controls data)
N/Az 15% (2013)
Table 1 a-b: Overview table of actual peak values recorded for both the proportion of reefs affected by COTS outbreaks, as well as mean COTS densities during respective COTS outbreak episodes on the GBR. Unless otherwise shown, the data are from AIMS LTMP manta tow surveys for the entire GBR (A) and the central GBR survey region (B). (where: N/Ax - no comparable data available for this pre-LTMP period; N/Az – no comparable data available as LTMP reef monitoring sectors were changed.)

13 WWF-Australia: COTS Report 2018
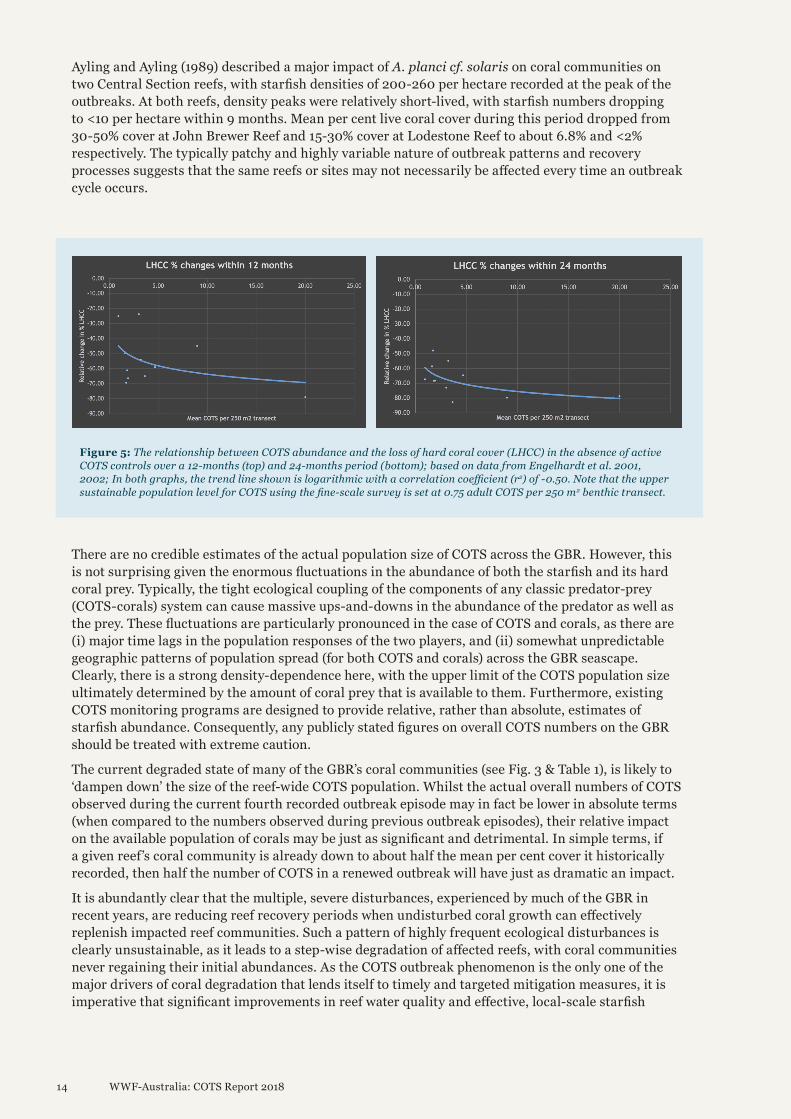
Coral loss due to COTS predationDuring the third recorded COTS outbreak episode in the 1990’s, the dedicated COTS fine-scale survey project, conducted by RCINT, determined actual rates of hard coral mortality on outbreaking reefs. Reefs were surveyed annually with COTS abundance and hard coral cover assessed simultaneously using intensively-sampled benthic 50 x 5 m transects. Figure 5 shows the estimated ‘natural’ rate of coral loss in the presence of COTS outbreaks of varying intensities (Engelhardt et al. 2001, 2002), but in the absence of any COTS control measures.
The results show that COTS densities of between 1.0 and 5.0 COTS per 250 m2 would typically consume between 25-70% of the available coral population within a 12-months period (Fig. 5, upper graph), with rates of coral mortality increasing to levels of approximately 50-85% over the following 12 months (Fig. 5, lower graph). As the size-frequency distributions of outbreaking populations of COTS were similar during the outbreaks in the 1990’s (Engelhardt et al. 2001, 2002), the historical estimates of hard coral mortality presented in Figure 5 provide a useful, comparative baseline for an assessment of the efficacy of current COTS controls. The challenge, however, is to collect accurate and reliable coral cover estimates before, during and after COTS control measures on affected reefs.
During the third outbreak episode, dedicated COTS fine-scale surveys showed that the typically severe outbreaks recorded in the late 1990’s resulted in coral mortality rates ranging from 66 to 89% of the initial live coral cover. At the end of the outbreak cycle, remnant hard coral cover across the survey reefs ranged from 5-15% live cover. Based on annual re-surveys of a set of ‘core reefs’, the study showed that the actual rate of decline of live coral cover was highly-dependent on COTS abundance. Despite the general pattern of density-dependent coral mortality rates on COTS-affected reefs, the impacts of COTS predation on individual reefs can be highly variable. During the second outbreak episode (1979-1991) approximately 57% of reefs with outbreaks experienced moderate to high coral mortality (approx. 30 to >50%) over at least one third of their perimeters. On average, these outbreaks produced a 3.4-fold increase in the levels of dead coral cover (Moran et al. 1992). The average time between successive outbreaks on these reefs was 14.68 years (Moran et al. 1992), which is consistent with earlier research that showed reef recovery (at least in terms of coral cover) may take from 12-15 years (Moran 1986).
Figure 4: Map of reefs with outbreaking populations of COTS in the Cairns Section of the GBRMP, as observed during the 2013-15 COTS controls period. Colour-coded estimates shown are based on COTS-Per-Unit-Effort data from roving COTS control measures rather than independent surveys. (Source: www.eatlas.org.au; AMPTO COTS controls program 2013-15).
14 WWF-Australia: COTS Report 2018
Ayling and Ayling (1989) described a major impact of A. planci cf. solaris on coral communities on two Central Section reefs, with starfish densities of 200-260 per hectare recorded at the peak of the outbreaks. At both reefs, density peaks were relatively short-lived, with starfish numbers dropping to <10 per hectare within 9 months. Mean per cent live coral cover during this period dropped from 30-50% cover at John Brewer Reef and 15-30% cover at Lodestone Reef to about 6.8% and <2% respectively. The typically patchy and highly variable nature of outbreak patterns and recovery processes suggests that the same reefs or sites may not necessarily be affected every time an outbreak cycle occurs.
There are no credible estimates of the actual population size of COTS across the GBR. However, this is not surprising given the enormous fluctuations in the abundance of both the starfish and its hard coral prey. Typically, the tight ecological coupling of the components of any classic predator-prey (COTS-corals) system can cause massive ups-and-downs in the abundance of the predator as well as the prey. These fluctuations are particularly pronounced in the case of COTS and corals, as there are (i) major time lags in the population responses of the two players, and (ii) somewhat unpredictable geographic patterns of population spread (for both COTS and corals) across the GBR seascape. Clearly, there is a strong density-dependence here, with the upper limit of the COTS population size ultimately determined by the amount of coral prey that is available to them. Furthermore, existing COTS monitoring programs are designed to provide relative, rather than absolute, estimates of starfish abundance. Consequently, any publicly stated figures on overall COTS numbers on the GBR should be treated with extreme caution.
The current degraded state of many of the GBR’s coral communities (see Fig. 3 & Table 1), is likely to ‘dampen down’ the size of the reef-wide COTS population. Whilst the actual overall numbers of COTS observed during the current fourth recorded outbreak episode may in fact be lower in absolute terms (when compared to the numbers observed during previous outbreak episodes), their relative impact on the available population of corals may be just as significant and detrimental. In simple terms, if a given reef’s coral community is already down to about half the mean per cent cover it historically recorded, then half the number of COTS in a renewed outbreak will have just as dramatic an impact.
It is abundantly clear that the multiple, severe disturbances, experienced by much of the GBR in recent years, are reducing reef recovery periods when undisturbed coral growth can effectively replenish impacted reef communities. Such a pattern of highly frequent ecological disturbances is clearly unsustainable, as it leads to a step-wise degradation of affected reefs, with coral communities never regaining their initial abundances. As the COTS outbreak phenomenon is the only one of the major drivers of coral degradation that lends itself to timely and targeted mitigation measures, it is imperative that significant improvements in reef water quality and effective, local-scale starfish
Figure 5: The relationship between COTS abundance and the loss of hard coral cover (LHCC) in the absence of active COTS controls over a 12-months (top) and 24-months period (bottom); based on data from Engelhardt et al. 2001, 2002; In both graphs, the trend line shown is logarithmic with a correlation coefficient (r2) of -0.50. Note that the upper sustainable population level for COTS using the fine-scale survey is set at 0.75 adult COTS per 250 m2 benthic transect.

15 WWF-Australia: COTS Report 2018
control measures are given the highest possible priority. The timely implementation of such actions is critically important as the observed population structure of the starfish, and its continuing recruitment into already impacted reef areas, has the potential to develop into a chronic disturbance scenario.
The population dynamics of A. planci cf. solarisSurveys of A. planci cf. solaris populations on the GBR and in other parts of the Indo-Pacific region have employed a variety of monitoring techniques, including timed swim searches (Pearson and Endean 1969, Kenchington 1976), spot checks (Pearson 1972), manta tows (Moran et al. 1988, Sweatman et. al. 1998), and more recently, transect-based fine-scale surveys (Engelhardt et al. 1994-2001). However, with the exception of the fine-scale survey method, these surveys have not provided accurate estimates of population densities and age structures (Birkeland and Lucas 1990). Consequently, population field and modelling studies have suffered from the resulting lack of suitable data. Such information is, however, critical for improving our understanding of the possible factors and mechanisms that may be implicated in initiating outbreaks.
Kenchington (1977) was the first researcher to attempt to determine inter-annual variations in COTS recruitment using size-frequency distributions in outbreaking populations of A. planci cf. solaris. Suggested year classes were determined based on the modal peaks recorded in these populations. This method, however, was then considered to be unreliable, as starfish size was subsequently found to be susceptible to food availability. A population of A. planci cf. solaris on Davies Reef (18o49’S) in the central GBR showed some drastic responses to the depletion of food resources that occurred during an active outbreak. Stump (1994) recorded a significant decrease in the mean starfish body size following a profound decline in coral resources. Apparently to maintain a higher short-term reproductive output, female starfish drew more heavily on their body reserves causing resorption of soft body wall and skeletal tissues, resulting in a reduced lifespan. Stump (1994) concluded that the reproductive success of COTS, and its ability to undergo sudden population explosions may be directly related to the flexible allocation of resources to the functions of growth, maintenance and reproduction in response to changing environmental conditions. Until recently, accurately assessing low density populations or populations with substantial numbers of small juvenile starfish has posed particular difficulties. Juvenile A. planci cf. solaris (est. age 1) which, because of their cryptic behaviour and nocturnal feeding habits, were considered to be difficult to sample, as they had rarely been seen in the field (Doherty and Davidson 1988, Johnson et al. 1991). Using the COTS fine-scale survey method – an intensive, transect-based methodology - Engelhardt et al. (1997) identified emerging, incipient outbreaks of COTS some two years prior to developing into full blown outbreaks.
Estimation of probable age classes of A. planci cf. solarisIn the absence of a reliable ageing technique for COTS, probable ages of individual starfish were obtained by fitting actual in situ size measurements to a previously constructed probable ‘size-at-age’ curve for A. planci cf. solaris in the central GBR region (Figure 6). In line with accepted convention, distinct peaks (modes) apparent in the size-frequency distribution of the target organism, in this case A. planci cf. solaris, were deemed to be indicative of probable age classes or ‘pseudo-cohorts’. A new size-at-age curve was constructed using measurements from >3,500 individual starfish detected during fine-scale surveys (Engelhardt, unpublished data), and showed an almost identical profile to the curve originally calculated by Kenchington in 1977 (Fig. 6).
The identified ‘pseudo-cohorts’ can be used to define broad size-at-age categories for juvenile starfish (estimated age 1, <13 cm), sub-adult starfish (estimated age 2, 14-25 cm) and adult starfish (estimated age 3 or older, >26 cm). The estimated relationships correspond well with other published information, including natural, in situ (Zann et al. 1987, 1990, Zann and Vuki 1992) as well as laboratory-based estimates of ‘size-at-age’ (Yamaguchi 1974, Lucas 1984). Whilst published estimates of A. planci cf. solaris growth show some variability, for example 12-months old starfish may range from approximately 4.5-11.5 cm across, with 24-month old starfish most commonly in the range of

16 WWF-Australia: COTS Report 2018
15-24 cm, they do provide a useful tool for assessing recent recruitment history. The COTS fine-scale surveys provided, for the first time, reliable data on age structures of starfish populations on for reefs in the suspected outbreak ‘initiation box’. With this information it has been possible to reliably ‘hindcast’ recruitment events in this area and to make projections about likely future population changes (Fig. 6).
The estimated size-at-age curve (Fig. 6) shows a strong, almost linear growth relationship for the first 5 years of life, with the growth curve significantly flattening in the older age classes (>5 years old). This pattern probably arises due to an increasing demand for food in the older year classes, with variability in food supply probably making body growth more unpredictable.
The utility of the COTS fine-scale survey methodology was again highlighted in 1999, when a strong cohort of juvenile COTS (1997-98 recruits) was detected on mid-shelf reefs in the Cairns Section of the GBRMP. This was the first time that large numbers of juvenile COTS had been detected on the GBR by any monitoring program. Follow-up fine-scale surveys in 1999-2000 showed that a cohort of juvenile starfish would apparently require a minimum live coral cover in the order of 15% to allow it to mature and reach adult age. A sufficiently large source of suitable prey is clearly required to allow for starfish maturation and the development of a new outbreak.
The availability of age-structured COTS population data remains critically important for further improving our understanding of the possible drivers of individual outbreaks, as well as their geographic origin and likely spread. In the 1990’s, COTS fine-scale surveys identified the presence of multiple cohorts or year classes, with size-frequency distributions of starfish indicating that between four and seven consecutive year classes (‘pseudo-cohorts’), had combined to cause the severe outbreaks observed in the central GBR region (Fig. 7; Engelhardt et al. 1999). The observed pattern of ongoing recruitment showed, for the first time, that COTS outbreaks were not the result of a single, unusual event. Rather, the surveys suggested that the observed outbreaks were the result of relatively persistent environmental factors and conditions favouring COTS recruitment success
synchronously across a geographic area spanning several degrees of latitude. Unfortunately, no data set of comparable resolution and detail is currently available for the outbreaking populations observed during the current episode. However, the 2013-15 AMPTO COTS controls data suggest that a similarly wide range of starfish sizes are again making up the observed populations. The fairly broad size classes used by the controls do not allow to distinguish individual COTS year classes, but they are also supportive of the notion of multiple recruitment events having led to the current outbreaks.
Figure 6: Estimated size-at-age plot for A. planci cf. solaris in the central Great Barrier Reef region as determined by three independent field studies. Error bars show standard errors (+1 SE). Note that the term ‘Poly.’ as shown in the legend refers to the second-order polynomial function used to fit the curve for this study’s data set. First published in Engelhardt et al. (1997), this graph provides a tool for the determination of existing COTS proxy year classes or cohorts based on size-frequency distributions.

17 WWF-Australia: COTS Report 2018
Figure 7: Selected size-frequency plots of COTS in outbreaking populations recorded during dedicated fine-scale surveys in the central GBR region in 1995-96 (from Engelhardt et al. 1999). Distinct modal peaks are deemed to represent median sizes of starfish in respective year classes; Reef IDs are from GBRMPA Reef Gazetteer: 14-132 Rocky Islets (b), 15-019 Lark Reef, 15-84 Irene Reef, 16-023 Rudder Reef.
The COTS fine-scale surveys also identified a strongly size-specific patterns of within-reef distribution for juvenile and sub-adult starfish (Engelhardt et. al. 2000, 2001), with small COTS found to be significantly more abundant in exposed front reef environments, rather than in more sheltered back reef environments. Clearly, these findings have important implications for future monitoring of A. planci cf. solaris populations. If the main objective is the early detection of developing outbreaks (forecasting capability), then it would appear that considerable effort should go into sampling reef front environments. In contrast, if the main objective is an assessment of past recruitment events on reefs (hindcasting capability), then both back and front reef zones may have to be surveyed in order to gain a complete insight into the probable age structures of local starfish populations.
With regard to the need for ongoing monitoring, the period in between successive outbreak episodes may also be of particular importance. At this stage, our understanding of the population structure and dynamics of A. planci cf. solaris during the inter-outbreak period is extremely sketchy. Detailed records on starfish abundance and size-frequency distributions.
(‘pseudo-cohorts’) within local and regional populations appear to offer the only realistic chance of improving our understanding of this critically important phenomenon.

18 WWF-Australia: COTS Report 2018
Synergistic effects of COTS outbreaks and coral bleaching eventsMass coral bleaching events and outbreaks of COTS have been identified as the most significant causes of hard coral mortality on the GBR in recent times. Whilst each of these two main drivers of reef degradation can result in extensive coral mortality on their own, there has been little consideration given to possible synergistic effects when these disturbances occur side by side.
When a severe COTS outbreak occurs at exactly the same time as a major mass coral bleaching event, one could argue that the combined rate of coral mortality would be little different if only one of the two disturbances had occurred. After all, it doesn’t really matter how a coral dies, from starfish predation or from heat stress, as the end result is the same. There is, however, an important difference in a key parameter of these disturbances, and that is in the average duration of their impact. In the absence of effective control measures, COTS outbreaks typically last between 12 and 24 months, depending on the starfish’s abundance and the amount of hard coral available to them. In contrast, mass coral bleaching events typically last from a few weeks to 2-3 months duration. This major difference in impact duration between the two stressors is responsible for the development of a possible synergistic effect between COTS outbreaks and coral bleaching events. Recent field observations by the author in the Seychelles, made during and after the 2016 global mass coral bleaching event, suggest that persistent starfish outbreaks can significantly alter the status and composition of post-bleaching coral communities (Engelhardt, unpublished data).
In the period from 2014 to 2016, the reefs surrounding the Seychelles’ main Island of Mahé were experiencing widespread COTS outbreaks. Locally, there were few resources available to undertake an effective COTS control program, with only sporadic control measures being applied during this period. Pronounced peaks in the size-frequency distributions of the starfish populations indicated that local outbreaks were comprised of individuals from at least four different year classes. At the time of the onset of the mass coral bleaching event in early April 2016, the local starfish population was made up of individuals ranging in size from about 16 to 46 centimetres maximum diameter.
Up until April 2016, the COTS outbreaks had only really affected populations of Acropora and Pocillopora corals, the fast-growing coral types generally preferred by the starfish. Slower-growing encrusting and massive corals remained largely unaffected by the outbreaks. This, however, changed when the mass coral bleaching event struck. Bleaching impacted disproportionally on the starfishes’ preferred coral types - the Acropora and Pocillopora corals. By June 2016, some two months into the bleaching event, COTS were seen feeding mostly on previously untouched and not fully-bleached encrusting and massive corals. There appeared to be an actual avoidance behaviour by the starfish, which now largely ignored fully-bleached acroporids and pocilloporids. However, the reasons for this change in feeding preferences and behaviour are unclear.
A resurvey of COTS and bleaching-affected reefs, conducted in December 2016, identified persistent remnant populations of the starfish. Whilst the largest year class of COTS (38-46 cm max. diameter) had virtually disappeared, significant numbers of small to intermediate size COTS (18-30 cm max. diameter) were impacting on the remaining hard corals.
Interestingly, starfish feeding had again refocussed on their normally preferred coral prey of the genera Acropora and Pocillopora. This is significant, as the few mature staghorn corals remaining represent the heat-resistant, climate resilient part of the coral community which is critically important if any successful coral acclimation to increasing climatic stress is to occur. Photos presented in Figure 8 illustrate some the field observations.
These new, and as yet unpublished observations, highlight the possible synergistic effects that exist between COTS outbreaks and coral bleaching events. Additional, COTS-induced coral mortality on post-bleaching reefs appears to be a serious issue to consider, particularly in the context of management actions aimed at improving the long-term resilience of reefs. Losing a significant proportion of the few remaining, heat-resistant corals due to predation by COTS could seriously alter, not only the recovery trajectories of impacted reefs, but also the composition of future coral communities. I suggest that the area of possible synergistic effects is in urgent need of further study. The observations described here should also be considered in the context of the current COTS control program on the GBR, as they suggest that incomplete or only partially-successful COTS controls may indirectly contribute to further coral degradation on post-bleaching reefs, as remnant starfish populations continue to affect resilient corals.

19 WWF-Australia: COTS Report 2018
Figure 8 (a-f): Underwater photographs of COTS (Acanthaster planci) feeding activities targeting heat-resistant or resilient hard coral types during and in the post-bleaching period. All photos taken by the author on the reefs around NW Mahé Island, Republic of the Seychelles.

20 WWF-Australia: COTS Report 2018
REFERENCESAustralian Government and Queensland Government (2017) Great Barrier Reef Report Card 2016. Reef Water Quality Protection Plan. 155 pp.
Ayling AM and AL Ayling (1989) Crown-of-thorns and coral trout density on three Central Section reefs: 1983-1989. GBRMPA Research Publication No. 15, Townsville.
Babcock RC (1992) Reproductive biology, spawning and field fertilisation rates of Acanthaster planci. Aust. J. Mar. Freshwater Res. 43: 525-534.
Babcock RC and CN Mundy (1993) Reproductive biology of the crown-of-thorns starfish Acanthaster planci. Final Report to GBRMPA, Townsville.
Benzie JAH and P Dixon (1994) The effects of sperm concentration, sperm: egg ratio, and gamete age on fertilisation success in crown-of-thorns starfish (Acanthaster planci) in the laboratory. Biol Bull 186: 139-152.
Birkeland C (1982) Terrestrial runoff as a cause of outbreaks of Acanthaster planci (Echinodermata: Asteroidea). Mar. Biol. 69: 175-185.
Birkeland C and JS Lucas (1990) Acanthaster planci: Major management problem of coral reefs. CRC Press, Boca Raton.
Brodie J, Fabricius K, De’ath G, Okaji K (2005) Are increased nutrient inputs responsible for more outbreaks of crown-of-thorns starfish? An appraisal of the evidence. Marine Pollution Bulletin, Catchment to Reef: Water Quality Issues in the Great Barrier Reef Region 51: 266-278
Brodie J, Devlin M, Lewis S (2017). Potential enhanced survivorship of crown of thorns starfish larvae due to near-annual nutrient enrichment during secondary outbreaks on the central mid-shelf of the Great Barrier Reef, Australia. Diversity 9(1): 17.
De’ath G, Fabricius KE, Sweatman H and M Puotinen (2012) The 27–year decline of coral cover on the Great Barrier Reef and its causes. PNAS 109(44): 17995-17999
Devlin MJ and J Brodie (2005) Terrestrial discharge into the Great Barrier Reef Lagoon: nutrient behaviour in coastal waters. Mar Pollut Bull 51(1-4):9-22
Devlin M and B Schaffelke (2009) Spatial extent of riverine flood plumes and exposure of marine ecosystems in the Tully coastal region, Great Barrier Reef. Mar Freshwater Res 60:1109-1122
Devlin MJ, McKinna L, Alvarez-Romero JG and JE Brodie (2012) Mapping the pollutants in surface riverine flood plume waters in the Great Barrier Reef, Australia. Mar Pollut Bull 65(4-9):224-235
Dight IJ, Bode L and MK James (1990) Modelling the larval dispersal of Acanthaster planci: I. Large scale hydrodynamics, Cairns Section, Great Barrier Reef Marine Park. Coral Reefs 9:115-123
Endean R (1969) Report on investigations made into aspects of the current Acanthaster planci (crown-of-thorns) infestations of certain reefs of the Great Barrier Reef. Qld. Dept. Primary Industries, Fisheries Branch, Brisbane.
Engelhardt U and BR Lassig (1997) A review of the possible causes and consequences of outbreaks of the crown-of-thorns starfish (Acanthaster planci) on the Great Barrier Reef - an Australian perspective. In: The Great Barrier Reef - Science, Use and Management, A National Conference, Proceedings Volume 1 (Invited papers): 243-259. CRC Reef Research Centre, Townsville, Australia.
Engelhardt U, Hartcher M, Taylor N, Cruise J, Engelhardt D, Russell M, Stevens I, Thomas G, Williamson D and D Wiseman (2001) Crown-of-thorns starfish (Acanthaster planci) in the central Great Barrier Reef region. Results of fine-scale surveys conducted in 1999-2000. CRC Reef Research Centre Technical Report No 32, CRC Reef Research Centre, Townsville, 100 pp.
21 WWF-Australia: COTS Report 2018
Engelhardt U, Taylor N, Brent J, Engelhardt D, Russell M, Williamson D and D Wiseman (2002) Fine-scale surveys of crown-of-thorns starfish Acanthaster planci in the Cairns Section of the Great Barrier Reef Marine Park. Status Report 2000-01. CRC Reef Research Centre Technical Report No 45, CRC Reef Research Centre, Townsville, 73 pp.
Fabricius KE, Okaji K, De’ath G (2010). Three lines of evidence to link outbreaks of the crown-of-thorns seastar Acanthaster planci to the release of larval food limitation. Coral Reefs 29: 593-605.
Furnas MJ (1996) Biological and chemical oceanographic features of the Cairns - Cooktown region relevant to crown-of-thorns starfish outbreaks. Final Report to GBRMPA, Townsville.
Hughes et al. 2018 Global warming transforms coral reef assemblages. Nature 556: 492/496
Keesing JK (1990) Feeding biology of the crown-of-thorns starfish, Acanthaster planci (Linnaeus). PhD thesis, James Cook University.
Kenchington RA (1977) Growth and recruitment of Acanthaster planci (L.) on the Great Barrier Reef. Biol. Conserv. 11: 103-118.
Lucas JS (1982) Quantitative studies of feeding and nutrition during larval development of the coral reef asteroid Acanthaster planci (L.). J. Exp. Mar. Biol. Ecol. 65: 173-193.
Moran PJ (1986) The Acanthaster phenomenon. Oceanogr. Mar. Biol. 24: 379-480.
Moran PJ, De’ath G, Baker V, Bass DK, Christie CA, Miller IR, Miller-Smith BA and AA Thompson (1992) Pattern of outbreaks of crown-of-thorns starfish (Acanthaster planci L.) along the Great Barrier Reef since 1966. Aust. J. Mar. Freshwater Res. 43: 555-568.
Okaji K (1996) Feeding ecology in the early stages of the crown-of-thorns starfish, Acanthaster planci L. PhD thesis, James Cook University of North Queensland, Townsville.
Pratchett MS, Caballes CF, Rivera-Posada and HPA Sweatman (2014) Limits to understanding and managing outbreaks of crown-of-thorns starfish (Acanthaster spp.) Oceanogr Mar Biol doi: 10.2012/b17143-4
Reichelt RE, Bradbury RH and PJ Moran (1990) Distribution of Acanthaster planci outbreaks on the Great Barrier Reef between 1966 and 1989. Coral Reefs 9: 97-103.
Sweatman HPA (2018) AIMS Long-term Reef Monitoring Program - Annual Summary Report on coral reef condition for 2017/18. Australian Institute of Marine Science, 5pp.
Waterhouse J, Schaffelke B, Bartley R, Eberhard R, Brodie J, Star M, Thorburn P, Rolfe J, Ronan M, Taylor B and F Kroon (2017) 2017 Scientific Consensus Statement LAND USE IMPACTS ON GREAT BARRIER REEF WATER QUALITY AND ECOSYSTEM CONDITION, State of Queensland, 18 pp.
Waterhouse J, Lønborg C, Logan M, Petus C, Tracey D, Lewis S, Howley C, Harper E, Tonin H, Skuza M, Doyle J, Costello P, Davidson J, Gunn K, Wright M, Zagorskis I, Kroon F and R Gruber (2018) Marine Monitoring Program: Annual Report for inshore water quality monitoring 2016-2017. Report for the Great Barrier Reef Marine Park Authority, Great Barrier Reef Marine Park Authority, Townsville.

22 WWF-Australia: COTS Report 2018
WWF.ORG.AUAUS
OUTBREAKS OF THE CROWN-OF-THORNS STARFISH ON THE GREAT BARRIER REEF REPORT 2018
Why we are here
wwf.org.au
To stop the degradation of the planet’s natural environment andto build a future in which humans live in harmony with nature.
©1986 Panda symbol WWF ® WWF is a registered trademark
WWF-Australia National Office
Level 1, 1 Smail StreetUltimo NSW 2007GPO Box 528 Sydney NSW 2001
Freecall: 1800 032 551Email: [email protected]@WWF_Australiawwf.org.au
© G
LOB
AL W
AR
MIN
G IM
AG
ES
/ WW
F
PACIFICOver 1,000 women in PNG and Solomon Islands empowered to improve their livelihoods and the sustainability of coral reefs.
Saved more than 10,000 sharks, dugongs, turtles and dolphins, each year through the purchase of two shark net fishing licences.
GREAT BARRIER REEF
INDIGENOUS PARTNERSHIPS We work with 100 Indigenous rangers in the Kimberley and northern Queensland to protect the bilby, Gouldian finch, northern bettong and turtle.
1.5 million-square-kilometre Marine Protected Area declared in the Ross Sea.
ANTARCTICA
togetherpossible#
EARTH HOURCelebrated the 10th anniversary with 300 community events across Australia, and the largest Earth Hour event ever, globally.