out of the qinghai–tibet plateau: evidence for the origin and dispersal of eurasian temperate...
TRANSCRIPT
Out of the Qinghai–Tibet Plateau: evidence for the origin anddispersal of Eurasian temperate plants from a phylogeographicstudy of Hippophae rhamnoides (Elaeagnaceae)
Dong-Rui Jia1,2,3, Richard J. Abbott4, Teng-Liang Liu1, Kang-Shan Mao1, Igor V. Bartish2 and Jian-Quan Liu1
1Molecular Ecology Group, State Key Laboratory of Grassland Agro-Ecosystem, School of Life Science, Lanzhou University, Lanzhou 730000, Gansu, China; 2Department of Genetic Ecology,
Institute of Botany, Academy of Sciences of the Czech Republic, Zamek 1, 252 43 Pruhonice, Czech Republic; 3Department of Botany, Faculty of Science, Charles University in Prague,
Benatska 2, CZ-128 01 Prague, Czech Republic; 4School of Biology, University of St Andrews, St Andrews, Mitchell Building, Fife KY16 9TH, UK
Author for correspondence:Jian-Quan LiuFax: +86 931 8914288
Email: [email protected], [email protected]
Received: 19 October 2011
Accepted: 9 February 2012
New Phytologist (2012) 194: 1123–1133doi: 10.1111/j.1469-8137.2012.04115.x
Key words: Hippophae rhamnoides,intraspecific evolutions, migration,phylogeography, Qinghai-Tibet Plateau(QTP).
Summary
• Numerous temperate plants now distributed across Eurasia are hypothesized to have origi-
nated and migrated from the Qinghai-Tibet Plateau (QTP) and adjacent regions. However,
this hypothesis has never been tested through a phylogeographic analysis of a widely distrib-
uted species. Here, we use Hippophae rhamnoides as a model to test this hypothesis.
• We collected 635 individuals from 63 populations of the nine subspecies of H. rhamnoides.
We sequenced two maternally inherited chloroplast (cp) DNA fragments and also the
bi-paternally inherited nuclear ribosomal ITS.
• We recovered five major clades in phylogenetic trees constructed from cpDNA and internal
transcribed spacer (ITS) sequence variation. Most sampled individuals of six subspecies that
are distributed in northern China, central Asia and Asia Minor ⁄ Europe, respectively, comprised
monophyletic clades (or subclades) nested within those found in the QTP. Two subspecies in
the QTP were paraphyletic, while the placement of another subspecies from the Mongolian
Plateau differed between the ITS and cpDNA phylogenetic trees.
• Our phylogeographic analyses supported an ‘out-of-QTP’ hypothesis for H. rhamnoides
followed by allopatric divergence, hybridization and introgression. These findings highlight
the complexity of intraspecific evolutions and the importance of the QTP as a center of origin
for many temperate plants.
Introduction
A central objective of biogeography is to identify the underlyingcauses of how organisms are distributed geographically (Cox &Moore, 2000). The origins and migration patterns of NorthernHemisphere (NH) temperate plants, which exhibit the greatestdiversification in the highlands of Asia, have attracted the atten-tion of numerous botanists for many years (e.g. Wulff, 1943;Ozenda, 1988; Donoghue et al., 2001; Donoghue & Smith,2004). Several have suggested that the majority of these temper-ate groups originated in the Qinghai-Tibet Plateau (QTP) andadjacent highlands, when global temperature decreased and theQTP uplifted extensively during the Neogene (Wulff, 1943;Ozenda, 1988; Wu, 1988; Axelrod et al., 1996; Wu & Wu,1996; Zhang et al., 2001, 2004; Kadereit et al., 2008). Evidencein support of this hypothesis has been sought from phylogeneticanalyses of genera containing species that are disjunctly andwidely distributed in the NH. Three different biogeographicpatterns have emerged from such analyses. The first indicates thatmost of such genera originated in the QTP and adjacent regions,
and then migrated to other NH regions where they gave rise todaughter species (e.g. Zhang et al., 2007, 2009; Xu et al., 2010).This is especially true for numerous forest genera containingseveral lineages that migrated to North America and othertemperate regions at different times during the past 30 million yr(Donoghue & Smith, 2004). The second pattern indicates thatthe disjunct distribution of some genera in the NH originatedfrom local relics of the once continuous Arcto-Tertiary, Tethyanor boreal floras (e.g. Sun et al., 2001; Mao et al., 2010). Thethird pattern suggests that a limited number of genera originatedin other regions of the world and diversified greatly after theirancestors reached the QTP (e.g. Liu et al., 2002; Tu et al.,2010). These different patterns, therefore, suggest that biogeo-graphic connections between the QTP and other NH regions aremore complex than previously thought.
Previous phylogenetic studies have focused on species distribu-tions within genera and not below the species level. However,phylogenetic analyses of populations from a single species acrossits entire range can provide important insights into the originsand migration of organisms, especially over relatively recent
Research
� 2012 The Authors
New Phytologist � 2012 New Phytologist Trust
New Phytologist (2012) 194: 1123–1133 1123www.newphytologist.com

historical time (Abbott et al., 2000; Avise, 2000; Qiu et al.,2011). Here we report a phylogenetic analysis of Hippophaerhamnoides (Sea buckthorn) to test the ‘out-of-QTP’ hypothesisfor a temperate plant species. Hippophae is a small genus of Ela-eagnaceae, comprising seven species (Rousi, 1971; Bartish et al.,2002; Swenson & Bartish, 2002). Two of the species are putativehomoploid hybrids (H. goniocarpa and H. litangensis), and theirtaxonomic status is uncertain (Swenson & Bartish, 2002). Allspecies of Hippophae are restricted to the QTP region andadjacent areas, except for H. rhamnoides, which contains ninesubspecies (Swenson & Bartish, 2002; Lian et al., 2003) that aredistributed widely but fragmentally in eastern Asia (ssp.yunnanensis, wolongensis, sinensis and mongolica), central Asia(ssp. turkestanica), Asia Minor (ssp. caucasica) and Europe (ssp.carpatica, fluviatilis and rhamnoides; see Fig. 1). Its Eurasian
range makes H. rhamnoides a good candidate to examine biogeo-graphic connections between the QTP and Europe through inter-vening mountain ranges in central Asia and Asia Minor (Kadereitet al., 2008). Although several phylogenetic studies have indi-cated east-to-west directional dispersal in the genus (Bartishet al., 2000, 2002; Sun et al., 2002), this hypothesis has not beentested at the species level.
Fruits of H. rhamnoides are juicy favouring dispersal by birdsand the possibility of long-distance dispersal leading potentiallyto inter-regional hybridization (Rousi, 1971). Such long-distancedispersal and inter- regional hybridization is likely to be furtherpromoted by strong pollen-mediated gene flow because all sub-species of H. rhamnoides are dioecious and wind-pollinated(Rousi, 1971; Hyvonen, 1996; Lian et al., 1998; Bartish et al.,2000). Two previous phylogenetic analyses of the genus
25°N
30°N
35°N
40°N
45°N
50°N
75°E 80°E 85°E 90°E 95°E 100°E 105°E 110°E 115°E 120°E 125°E
0m500m1000m
2000m
3000m
4000m5000m
0 400km
ssp. mongolica
ssp. fluviatilis
ssp. yunnanensis
Subspecies
ssp. wolongensis
ssp. turkestanica
ssp. sinensis
ssp. carpatica ssp. caucasica
ssp. rhamnoides
cpDNA Clades ITS CladesA
B
C
D
E
II
I
III
IV
V
CHINA
MONGOLIA
RUSSIA
KAZAKSTAN
NEPALINDIA
BURMA
1 2 34
5
6
7 8
9
10
11
12
131415
16
17
1819 20
21 22
23
2425
26 27
28
29 30
31
32
33
34
35
3637
38
39
4041 42
43
45
4647
4849
5051
52
44
53
54
TURKEY
RUSSIA
IRAN
FRANCE
GERMANY
ROMANIA
5°E 10°E 15°E 20°E 25°E 30°E 35°E 40°E 45°E
55°N
50°N
45°N
40°N
35°N 50°E
0 400km
55
56
57
58
59
60
61
62
63
(a)
(b)
Fig. 1 Map of sampling sites (details in Supporting Information Table S1) and geographic distribution of Hippophae rhamnoides cpDNA and internaltranscribed spacer (ITS) clades (Fig. 2) in Asia (a) and Europe ⁄ Minor Asia (b). Pie charts show the relative proportion of each cpDNA clade within eachpopulation and presence ⁄ absence of ITS clades. The colour of the outer ring of each pie corresponds to the subspecies present at a location according tomorphological delimitation.
1124 Research
NewPhytologist
� 2012 The Authors
New Phytologist � 2012 New Phytologist Trust
New Phytologist (2012) 194: 1123–1133
www.newphytologist.com
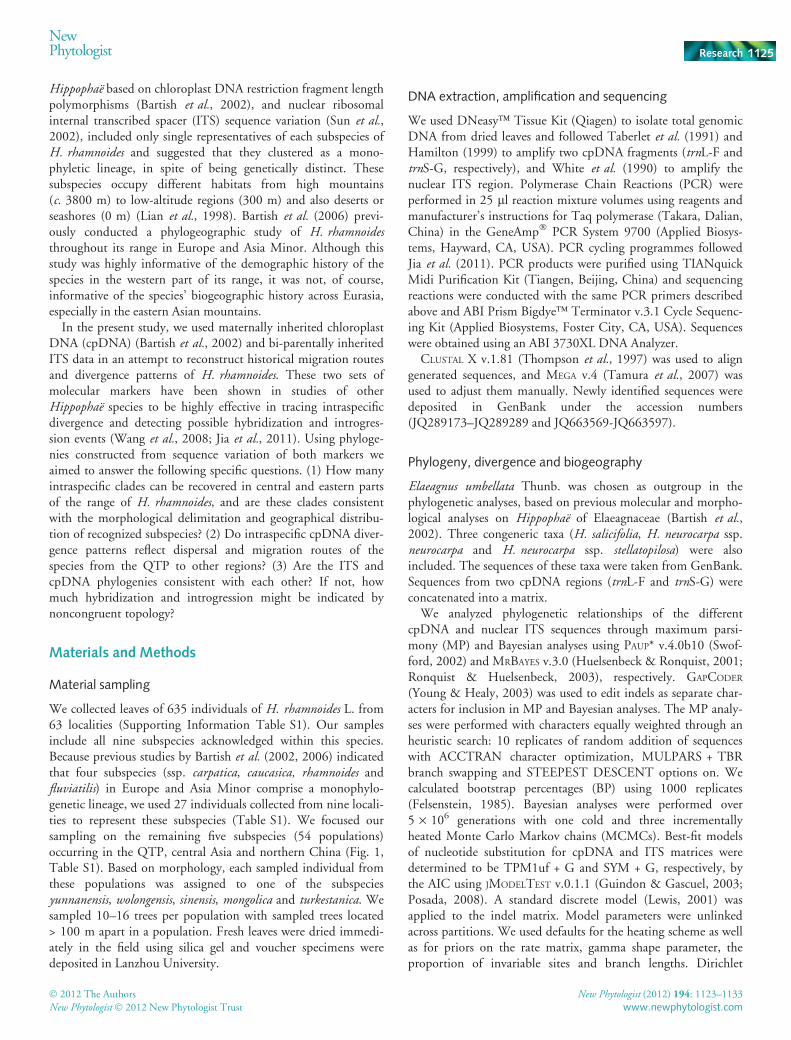
Hippophae based on chloroplast DNA restriction fragment lengthpolymorphisms (Bartish et al., 2002), and nuclear ribosomalinternal transcribed spacer (ITS) sequence variation (Sun et al.,2002), included only single representatives of each subspecies ofH. rhamnoides and suggested that they clustered as a mono-phyletic lineage, in spite of being genetically distinct. Thesesubspecies occupy different habitats from high mountains(c. 3800 m) to low-altitude regions (300 m) and also deserts orseashores (0 m) (Lian et al., 1998). Bartish et al. (2006) previ-ously conducted a phylogeographic study of H. rhamnoidesthroughout its range in Europe and Asia Minor. Although thisstudy was highly informative of the demographic history of thespecies in the western part of its range, it was not, of course,informative of the species’ biogeographic history across Eurasia,especially in the eastern Asian mountains.
In the present study, we used maternally inherited chloroplastDNA (cpDNA) (Bartish et al., 2002) and bi-parentally inheritedITS data in an attempt to reconstruct historical migration routesand divergence patterns of H. rhamnoides. These two sets ofmolecular markers have been shown in studies of otherHippophae species to be highly effective in tracing intraspecificdivergence and detecting possible hybridization and introgres-sion events (Wang et al., 2008; Jia et al., 2011). Using phyloge-nies constructed from sequence variation of both markers weaimed to answer the following specific questions. (1) How manyintraspecific clades can be recovered in central and eastern partsof the range of H. rhamnoides, and are these clades consistentwith the morphological delimitation and geographical distribu-tion of recognized subspecies? (2) Do intraspecific cpDNA diver-gence patterns reflect dispersal and migration routes of thespecies from the QTP to other regions? (3) Are the ITS andcpDNA phylogenies consistent with each other? If not, howmuch hybridization and introgression might be indicated bynoncongruent topology?
Materials and Methods
Material sampling
We collected leaves of 635 individuals of H. rhamnoides L. from63 localities (Supporting Information Table S1). Our samplesinclude all nine subspecies acknowledged within this species.Because previous studies by Bartish et al. (2002, 2006) indicatedthat four subspecies (ssp. carpatica, caucasica, rhamnoides andfluviatilis) in Europe and Asia Minor comprise a monophylo-genetic lineage, we used 27 individuals collected from nine locali-ties to represent these subspecies (Table S1). We focused oursampling on the remaining five subspecies (54 populations)occurring in the QTP, central Asia and northern China (Fig. 1,Table S1). Based on morphology, each sampled individual fromthese populations was assigned to one of the subspeciesyunnanensis, wolongensis, sinensis, mongolica and turkestanica. Wesampled 10–16 trees per population with sampled trees located> 100 m apart in a population. Fresh leaves were dried immedi-ately in the field using silica gel and voucher specimens weredeposited in Lanzhou University.
DNA extraction, amplification and sequencing
We used DNeasy� Tissue Kit (Qiagen) to isolate total genomicDNA from dried leaves and followed Taberlet et al. (1991) andHamilton (1999) to amplify two cpDNA fragments (trnL-F andtrnS-G, respectively), and White et al. (1990) to amplify thenuclear ITS region. Polymerase Chain Reactions (PCR) wereperformed in 25 ll reaction mixture volumes using reagents andmanufacturer’s instructions for Taq polymerase (Takara, Dalian,China) in the GeneAmp� PCR System 9700 (Applied Biosys-tems, Hayward, CA, USA). PCR cycling programmes followedJia et al. (2011). PCR products were purified using TIANquickMidi Purification Kit (Tiangen, Beijing, China) and sequencingreactions were conducted with the same PCR primers describedabove and ABI Prism Bigdye� Terminator v.3.1 Cycle Sequenc-ing Kit (Applied Biosystems, Foster City, CA, USA). Sequenceswere obtained using an ABI 3730XL DNA Analyzer.
CLUSTAL X v.1.81 (Thompson et al., 1997) was used to aligngenerated sequences, and MEGA v.4 (Tamura et al., 2007) wasused to adjust them manually. Newly identified sequences weredeposited in GenBank under the accession numbers(JQ289173–JQ289289 and JQ663569-JQ663597).
Phylogeny, divergence and biogeography
Elaeagnus umbellata Thunb. was chosen as outgroup in thephylogenetic analyses, based on previous molecular and morpho-logical analyses on Hippophae of Elaeagnaceae (Bartish et al.,2002). Three congeneric taxa (H. salicifolia, H. neurocarpa ssp.neurocarpa and H. neurocarpa ssp. stellatopilosa) were alsoincluded. The sequences of these taxa were taken from GenBank.Sequences from two cpDNA regions (trnL-F and trnS-G) wereconcatenated into a matrix.
We analyzed phylogenetic relationships of the differentcpDNA and nuclear ITS sequences through maximum parsi-mony (MP) and Bayesian analyses using PAUP* v.4.0b10 (Swof-ford, 2002) and MRBAYES v.3.0 (Huelsenbeck & Ronquist, 2001;Ronquist & Huelsenbeck, 2003), respectively. GAPCODER
(Young & Healy, 2003) was used to edit indels as separate char-acters for inclusion in MP and Bayesian analyses. The MP analy-ses were performed with characters equally weighted through anheuristic search: 10 replicates of random addition of sequenceswith ACCTRAN character optimization, MULPARS + TBRbranch swapping and STEEPEST DESCENT options on. Wecalculated bootstrap percentages (BP) using 1000 replicates(Felsenstein, 1985). Bayesian analyses were performed over5 · 106 generations with one cold and three incrementallyheated Monte Carlo Markov chains (MCMCs). Best-fit modelsof nucleotide substitution for cpDNA and ITS matrices weredetermined to be TPM1uf + G and SYM + G, respectively, bythe AIC using JMODELTEST v.0.1.1 (Guindon & Gascuel, 2003;Posada, 2008). A standard discrete model (Lewis, 2001) wasapplied to the indel matrix. Model parameters were unlinkedacross partitions. We used defaults for the heating scheme as wellas for priors on the rate matrix, gamma shape parameter, theproportion of invariable sites and branch lengths. Dirichlet
NewPhytologist Research 1125
� 2012 The Authors
New Phytologist � 2012 New Phytologist Trust
New Phytologist (2012) 194: 1123–1133
www.newphytologist.com
distributions were used to model base frequency parameters anduninformative priors placed on tree topology. We sampled onetree per 500 generations. After discarding the first 2500 trees outof the 10 001 trees as burn-ins, the remaining trees were used toestimate posterior probability (PP).
In order to detect genealogical relationships among sequenceswith shallow genetic divergences, we also constructed cpDNAand ITS haplotype networks using a statistical parsimony algo-rithm described by Templeton et al. (1992) as implemented inTCS v.1.21 (Clement et al., 2000). As the TCS program collapsessequences that differ only by additive sites, we grouped the 78different ITS sequences recorded into 28 types and manuallyselected one representative sequence possessing the lowest num-ber of additive sites for each type (Table S2). These 28 generalribotypes were used in further analyses to reduce bias introducedby sequence ambiguities (Koch & Matschinger, 2007). We ranTCS with a default parsimony connection limit of 95%. In thecase of ITS data, after starting initially with the default limit (11internal steps allowed), we added ribotypes R68, R76 and R77with the 90% confidence interval (five steps) and finally R55 andR56 when fixing the connection limit at 33 steps.
The datasets obtained were examined to see if they fitted thehypothesis of a molecular clock using a likelihood-ratio test(LRT; Huelsenbeck & Rannala, 1997) implemented in PAUP*v.4.0b10 (Swofford, 2002) and comparing the log likelihood(loge L) of the ML trees with and without assuming a molecularclock. A molecular clock could not be rejected for both cpDNAand ITS data (cpDNA: TPM1uf + G, 2logeLR = 67.889,df = 51, P = 0.057; ITS: SYM + G, 2logeLR = 77.053, df = 80,P = 0.573). We therefore used BEAST v.1.5.4 (Drummond et al.,2002; Drummond & Rambaut, 2007) to estimate genetic diver-gence. We used GTR + G substitution model, a fixed molecularclock, a constant population size coalescent tree prior and a UP-GMA starting tree for both datasets. We sampled all parametersonce every 2000 steps from 20 · 106 MCMC steps after aburn-in of 5 · 106 steps. The program TRACER (Rambaut &Drummond, 2007) was used to examine convergence of chainsto the stationary distribution and the analysis was repeated beforecombining the two independent runs. The cpDNA substitutionrates for most angiosperm species have been estimated to varybetween 1 and 3 · 10)9 substitutions per site per year (s s)1 yr)1)(Wolfe et al., 1987), while those for nrITS in shrubs andherbal plants vary between 3.46 and 8.69 · 10)9 s s)1 yr)1
(Richardson et al., 2001). Given the uncertainties in these ratevalues, we used normal distribution priors with a mean of2 · 10)9 and a SD of 6.080 · 10)10 for cpDNA, and a mean of6.075 · 10)9 and a SD of 1.590 · 10)9 for ITS to cover theserate ranges within the 95% range of the distribution for our esti-mation of divergence times of major clades.
We ran Bayes-DIVA analyses using RASP v.2.0b (ReconstructAncestral State in Phylogenies; Yu et al., 2010, 2011) to infer thebiogeographic history of H. rhamnoides based on the phylogenyconstructed from cpDNA and nrITS. In this analysis we definedfive distribution regions for the sampled populations: (Q) theQTP region (including Tibet, Qinghai, northwest Yunnan,southwest Sichuan, south Gansu; populations 1–28); (N)
northern China (including east Gansu, Inner Mongolia,Shaanxi, Shanxi, Hebei, Liaoning; populations 29–43); (M) theMongolian Plateau (including north Xinjiang, Mongolia, Siberia;populations 44–47); (C) central Asia (including west Xinjiangand west Tibet; populations 48–54); (E) Europe and Asia Minor(populations 55–63) (Figs 1, 3). We loaded 10 001 trees previ-ously produced in MRBAYES v.3.0 (Huelsenbeck & Ronquist,2001; Ronquist & Huelsenbeck, 2003) and chose the F81 modelfor the Bayesian MCMC analyses, allowing for different rates ofchange among ancestral areas.
Population genetic analyses
Population gene diversity (HS, HT) and between-populationdivergence (GST, NST) were estimated within each region usingthe program PERMUT with 1000 permutations tests (Pons &Petit, 1996; http://www.pierroton.inra.fr/genetics/labo/Software/PermutCpSSR). A significant difference between NST and GST
may suggest a significant phylogeographic structure (Pons &Petit, 1996). We assessed genetic differentiation between all pairsof geographical regions using FST as estimator following analysesof molecular variance (AMOVA; Excoffier et al., 1992) inARLEQUIN v.3.1 (Excoffier et al., 2005). We also conducted twotypes of hierarchical (3-level) AMOVAs; that is, with the highestlevel partitioned by either subspecies or regions. Finally, wecalculated haplotype diversity (h) and nucleotide diversity (p) foreach population and each subspecies using ARLEQUIN.
A mismatch distribution analysis (MDA; Slatkin & Maddison,1989; Rogers & Harpending, 1992; Schneider & Excoffier,1999) was conducted to examine the demographic expansions ofthe five major cpDNA clades identified in the phylogenetic analy-ses. As population structure has a limited effect on the mismatchdistribution (Rogers, 1995; Bernatchez, 2001), we pooled allhaplotypes of each clade and did not consider their frequencies.We used 1000 parametric bootstrap replicates to generate anexpected distribution using a model of sudden demographicexpansion (Excoffier et al., 2005), to calculate the sum of squareddeviations (SSD) and raggedness index (HRag) of Harpending(1994) between observed and expected mismatch distributionsand to obtain 95% confidence intervals (CIs) around s. We alsocalculated Tajima’s D (Tajima, 1989) and Fu’s FS (Fu, 1997) toassess possible expansions. The D and Fs statistic should havelarge negative values within a clade under the expansion hypothe-sis due to an excess of rare new mutations. We calculated signifi-cance of the tests with 10 000 replicates. All of these demo-graphic tests were performed using ARLEQUIN v.3.1 (Excoffieret al., 2005). When sudden expansions were detected, we usedthe equation s = 2ut (Rogers & Harpending, 1992; Rogers,1995) to estimate expansion times, where t is the expansion timein number of generations, s is the mode of the mismatch distribu-tion, and u is the mutation rate per generation for the whole ana-lyzed sequence (i.e. chlorotype). We calculated u according tou = lkg, where l is the substitution rate per nucleotide site peryear, k is the average sequence length of the DNA region understudy, and g is the generation time in years. We assumed thegeneration time of H. rhamnoides to be 5 yr (Bartish et al., 2006).
1126 Research
NewPhytologist
� 2012 The Authors
New Phytologist � 2012 New Phytologist Trust
New Phytologist (2012) 194: 1123–1133
www.newphytologist.com

We again adopted the substitution rate of 2.0 · 10)9 s s)1 yr)1
for expansion estimations.
Results
cpDNA variation
From the 635 individuals sampled, we recovered 27 and 29unique sequences for the trnL-F and trnS-G fragments, respec-tively. After combining both sequences we identified a total of 49chlorotypes (C01–C49). Sequence lengths of these haplotypesvaried from 1357 to 1514 bp with 59 nucleotide substitutionsand 11 indels (1–163 bp) recorded. Thirty-four haplotypes(69.39%) occurred in not more than one population while theremaining 15 (30.61%) were shared between populations(Table S1). However, all chlorotypes were subspecies-specificand therefore none was shared by any two subspecies.
Phylogenetic trees constructed using MP and Bayesian methodswere largely consistent in topology (Fig. 2a). All haplotypes fromH. rhamnoides comprised a monophyletic lineage with five clades(A–E) showing no exact ‘one to one’ match with subspecies. Allhaplotypes of ssp. yunnanensis clustered into three major clades (A,B and C) apart from C32 (found in population 11) which wasplaced in clade E. Haplotypes placed in clades A, B or C wereexclusively distributed in the QTP region (Fig. 1). Clade E com-prised most haplotypes of ssp. sinensis, plus one from ssp.mongolica (C26) in addition to the one from ssp. yunnanensis(C32) mentioned above. However, C08 of ssp. sinensis nestedwithin clade B. A monophyletic subclade comprising four
haplotypes of ssp. wolongensis also nested within clade B. Clade Dcomprised two subclades: one consisted of haplotypes of ssp.turkestanica distributed in central Asia, and the other included ssp.caucasica, carpatica, fluviatilis and rhamnoides distributed in AsiaMinor and Europe (Figs 1, 2a). The haplotype network (Fig. S1a)was largely congruent with the phylogenetic trees (Fig. 2a), butdepicted relationships between haplotypes in more detail. The dat-ing analysis estimated that the five major clades diversified fromthe late Miocene to the late Pliocene (Fig. 2a), with the first (nodea1) and last major events (node a4) occurring 5.46 (95% HPD:2.23–10.10) million yr ago (Ma) and 2.05 (95% HPD:0.72–3.86) Ma (Table S3), respectively.
ITS variation
We recovered 78 different ITS sequences (ribotypes, R01–R78),of which 50 (64.10%) were unique to single populations. A totalof 108 base substitutions and five indels (1–2 bp) were foundand the two phylogenetic analyses generated topologically similartrees (Fig. 2b). Two ribotypes (R55 and R56) of ssp. yunnanensisclustered with H. neurocarpa ribotypes into a clade also contain-ing H. salicifolia ribotype with high support, indicating possiblepast hybridization and introgression between these species. Theother 76 ribotypes comprised a monophyletic H. rhamnoideslineage with high support. However, phylogenetic relationshipsbetween subspecies differed somewhat from those inferred fromcpDNA sequences.
Ribotypes from ssp. yunnanensis clustered into three basalclades (I, II and III) with those of ssp. wolongensis also placed
C
C
C
C
C
C
C
C
C
C
C
C
C
C
C
C
C
C
C
C
C
C
C
C
C
C
C
C
C
C
C
C
C
C
C
C
C
C
C
C
C
C
C
H. salicifoliaH. neurocarpa stellatopilosassp.H. neurocarpa neurocarpassp.Elaeagnus umbellata
66/0.89/-
60/0.96/0.91
91/1.00/1.00
70/1.00/1.00
65/0.97/0.98
60/0.98/0.99
69/0.99/0.91
41/0.78/0.90
90/1.00/1.00
55/0.84/0.87
79/1.00/1.00
79/1.00/1.00
100/1.00/0.45
62/0.79/-
62/0.89/-
34/1.00/0.75
79/1.00/1.00
49/1.00/-
100/1.00/1.00
97/1.00/1.00
100/1.00/1.00
83/0.81/0.99
84/0.99/0.99
80/1.00/1.00
48/0.95/0.99
67/0.82/1.00
92/1.00/0.95
-/-/1.00
H. salicifolia
H. neurocarpa stellatopilosassp.H. neurocarpa neurocarpassp.Elaeagnus umbellata
A
B
C
D
E
III
III
IV
V
a1
a3
a4
a5
a2
b3
b4b2
b1
(a) (b)
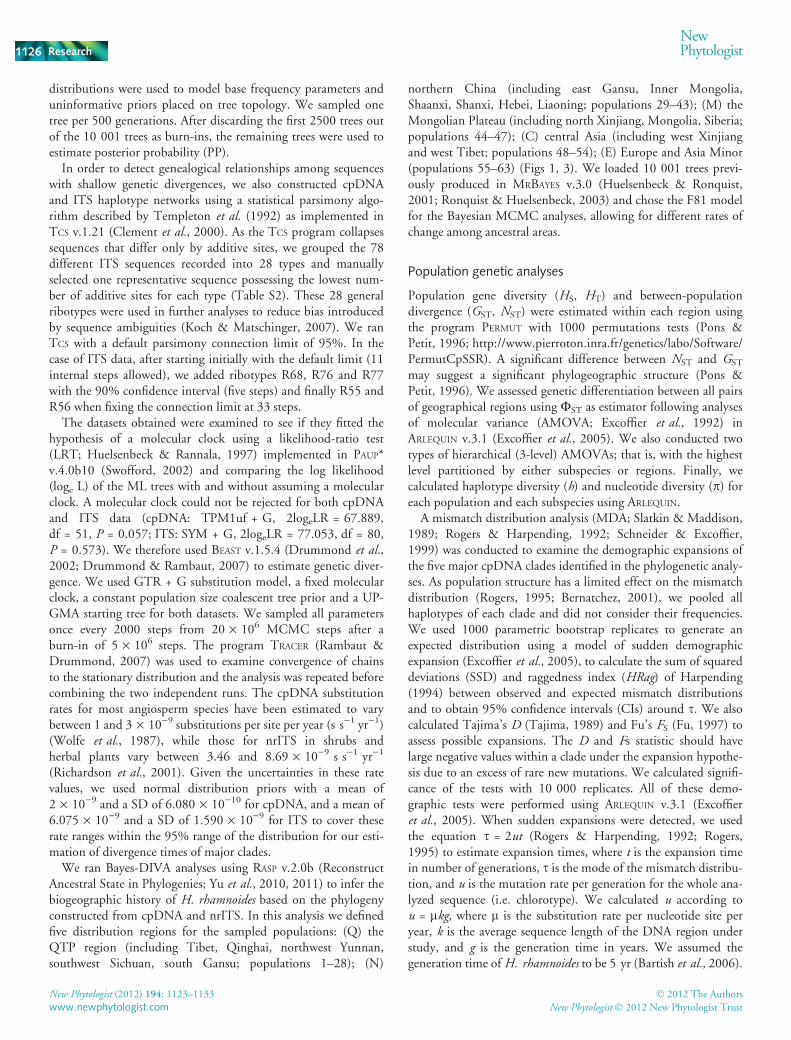
Fig. 2 Maximum parsimony 50% consensus trees based on phylogenetic analyses of (a) cpDNA (length = 297, CI = 0.808, RI = 0.883) and (b) internaltranscribed spacer (ITS; length = 230, CI = 0.848, RI = 0.955). Support values (MP bootstrap ⁄ Bayesian posterior probability ⁄ BEAST posterior possibilities)are shown at nodes. Colours correspond to the different subspecies examined in Fig. 1.
NewPhytologist Research 1127
� 2012 The Authors
New Phytologist � 2012 New Phytologist Trust
New Phytologist (2012) 194: 1123–1133
www.newphytologist.com
within clade III. Clade V consisted of only ribotypes from ssp.sinensis, while clade IV included all the ribotypes from the othersix subspecies. Three ribotypes were shared between subspecies:R13 between ssp. yunnanensis (occurred in populations 6, 10, 11,13, 14 and 15) and ssp. wolongensis (population 17), R16between ssp. wolongensis (population 16) and ssp. sinensis(population 21), R08 between ssp. turkestanica (populations 48,49, 50, 51 and 52) and ssp. mongolica (populations 45, 46 and47) and R77 among ssp. caucasica (populations 57, 58 and 59),ssp. carpatica (population 61) and ssp. rhamnoides (population63). R18, the only ribotype of ssp. sinensis placed in clade III,occurred in population 21. The first divergence withinH. rhamnoides (node b1; Fig. 2b) resulting in the origin of cladeII and the ancestor of clades III, IV and V in the ITS tree, wasestimated to have occurred 3.02 (95% HPD: 1.42–5.18) Ma.The second divergence (node b2) occurred 2.56 (95% HPD:1.22–4.33) Ma, while the third divergence (node b3) occurred2.44 (95% HPD: 1.07–4.19) Ma (Table S3).
Biogeographic analyses and intersubspecies differentiation
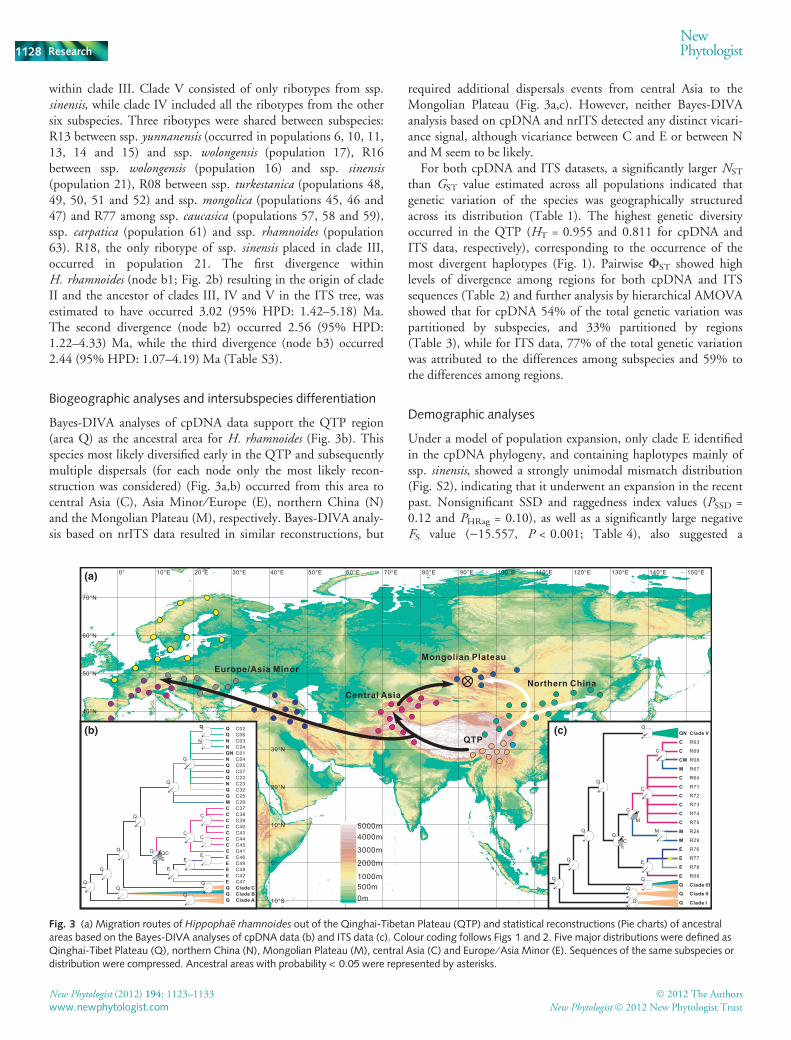
Bayes-DIVA analyses of cpDNA data support the QTP region(area Q) as the ancestral area for H. rhamnoides (Fig. 3b). Thisspecies most likely diversified early in the QTP and subsequentlymultiple dispersals (for each node only the most likely recon-struction was considered) (Fig. 3a,b) occurred from this area tocentral Asia (C), Asia Minor ⁄ Europe (E), northern China (N)and the Mongolian Plateau (M), respectively. Bayes-DIVA analy-sis based on nrITS data resulted in similar reconstructions, but
required additional dispersals events from central Asia to theMongolian Plateau (Fig. 3a,c). However, neither Bayes-DIVAanalysis based on cpDNA and nrITS detected any distinct vicari-ance signal, although vicariance between C and E or between Nand M seem to be likely.
For both cpDNA and ITS datasets, a significantly larger NST
than GST value estimated across all populations indicated thatgenetic variation of the species was geographically structuredacross its distribution (Table 1). The highest genetic diversityoccurred in the QTP (HT = 0.955 and 0.811 for cpDNA andITS data, respectively), corresponding to the occurrence of themost divergent haplotypes (Fig. 1). Pairwise FST showed highlevels of divergence among regions for both cpDNA and ITSsequences (Table 2) and further analysis by hierarchical AMOVAshowed that for cpDNA 54% of the total genetic variation waspartitioned by subspecies, and 33% partitioned by regions(Table 3), while for ITS data, 77% of the total genetic variationwas attributed to the differences among subspecies and 59% tothe differences among regions.
Demographic analyses
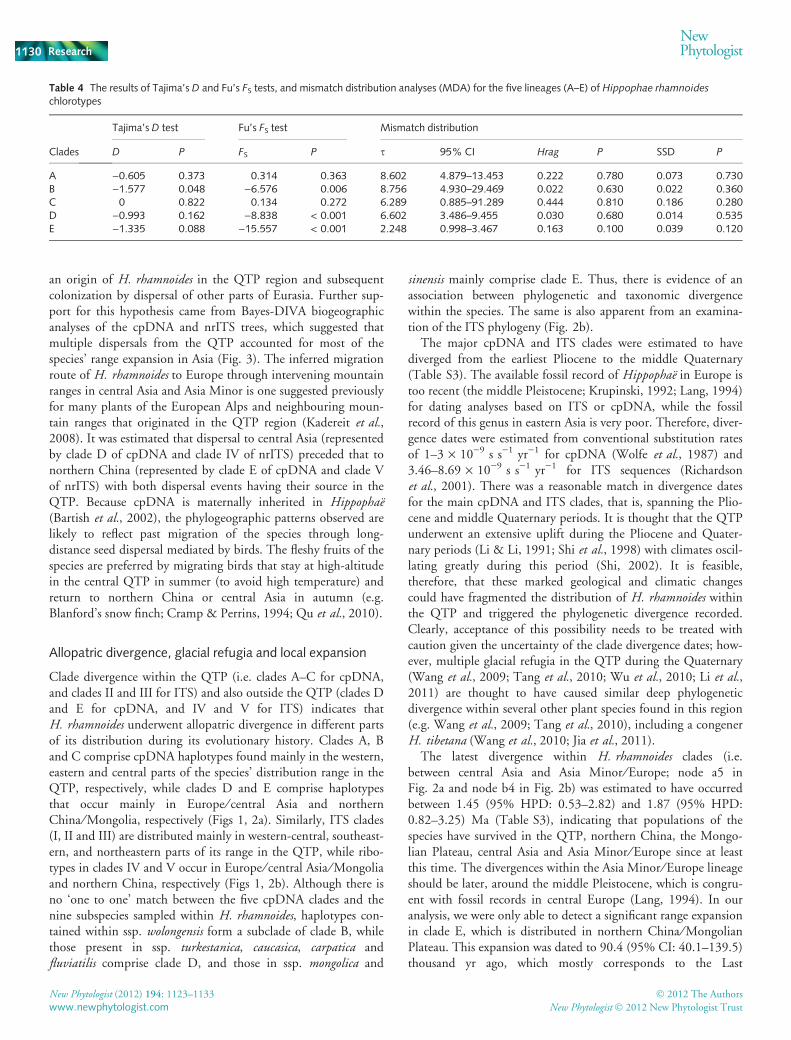
Under a model of population expansion, only clade E identifiedin the cpDNA phylogeny, and containing haplotypes mainly ofssp. sinensis, showed a strongly unimodal mismatch distribution(Fig. S2), indicating that it underwent an expansion in the recentpast. Nonsignificant SSD and raggedness index values (PSSD =0.12 and PHRag = 0.10), as well as a significantly large negativeFS value ()15.557, P < 0.001; Table 4), also suggested a
70°N
60°N
50°N
40°N
30°N
20°N
10°N
0°
10°S
0° 10°E 20°E 30°E 40°E 50°E 60°E 70°E 80°E 90°E 100°E 110°E 120°E 130°E 140°E 150°E
(b) (c)
(a)
*N*
Q
*
Q
*
Q
*
Q
*
C
*
C*
C
*Q
C EQC
*
E
*
E
*
E
*
Q
*
Q
*
Q*
Q
*
Q*
Q
C02
C42C48C49C46C41C45C44C43C40C39C38C37C26C25C32C23C22C07C05C04C01C24C03C06
C47Clade CClade BClade A
QNN
NN
N
QQQ
MC
CCCC
CCCEEEEE
QQQ
*
*
*
*
*
*
*
*
***
*
*
*
M
E
Q
EC
C
M
C
C
Q
Q
Q
Q
Q
Q
Q
Q
R63
R69
R08
R67
R64
R71
R72
R73
R74
R75
R28
R29
R76
R77
R78
R68
Clade III
Clade II
Clade I
Clade V
CM
M
C
C
C
C
C
C
C
C
M
M
E
E
E
E
QN
Q
Q
Q
Europe/Asia Minor
Central Asia
Mongolian Plateau
Northern China
QTP
0m500m1000m
2000m
3000m
4000m5000m
Fig. 3 (a) Migration routes of Hippophae rhamnoides out of the Qinghai-Tibetan Plateau (QTP) and statistical reconstructions (Pie charts) of ancestralareas based on the Bayes-DIVA analyses of cpDNA data (b) and ITS data (c). Colour coding follows Figs 1 and 2. Five major distributions were defined asQinghai-Tibet Plateau (Q), northern China (N), Mongolian Plateau (M), central Asia (C) and Europe ⁄ Asia Minor (E). Sequences of the same subspecies ordistribution were compressed. Ancestral areas with probability < 0.05 were represented by asterisks.
1128 Research
NewPhytologist
� 2012 The Authors
New Phytologist � 2012 New Phytologist Trust
New Phytologist (2012) 194: 1123–1133
www.newphytologist.com

historical demographic expansion within clade E. AssumingcpDNA mutation rates of 2 · 10)9 s s)1 yr)1, the expansion ofclade E was estimated to have occurred 90.4 (95% CI:40.1–139.5) thousand yr ago.
Discussion
Previous studies of the historical biogeography of northern hemi-sphere, widespread, temperate plant groups having greatest diver-sification in the highlands of Asia have tended to focus on thephylogenetic analysis of genera showing such distribution (e.g.Zhang et al., 2007, 2009; Mao et al., 2010; Tu et al., 2010;Xu et al., 2010). Here we have focused on the historical bio-geography of a widespread, temperate species in Eurasia,
H. rhamnoides, rather than a genus, and shown that a phylogeo-graphic analysis of cpDNA and ITS sequence variation in thisspecies strongly supports an ‘out-of-QTP’ origin and migrationpattern, as suggested by phylogenetic analyses at the genus level(e.g. Zhang et al., 2007, 2009; Xu et al., 2010). Our results fur-ther suggest that following dispersal from the QTP region, allo-patric divergence took place, sometimes followed by secondarycontact, hybridization and introgression between divergent intra-specific taxa.
Out of the Qinghai-Tibet Plateau
‘Dispersal is often inferred if the taxa in one area are phylogeneti-cally derived from lineages that have more ‘primitive’ (phylo-genetically basal) members in another area, which is inferred to bethe source area’ (Futuyma, 1998; p. 208). Our phylogenetic treesof both ITS ribotype and cpDNA haplotype variation showedthat the phylogenetically basal clades of H. rhamnoides (II and IIIin the ITS tree, and A, B and C in the cpDNA tree) were exclu-sively distributed in the QTP, thus supporting the ‘out-of-QTP’hypothesis for the origin and dispersal of the species (Figs 1, 2).The phylogeographic analysis of cpDNA variation showed thatthe two other clades identified (D and E) contained haplotypesfound only in individuals distributed in northern China, theMongolian Plateau, central Asia, Asia Minor and Europe.Because clades D and E were nested within two QTP clades (Aand B) and sister to QTP clade C, our results further indicated
Table 1 Estimates of average gene diversity within populations (HS) of Hippophae rhamnoides, total gene diversity (HT), interpopulation differentiation(GST), and number of substitution types (NST) for chlorotypes and ribotypes across regions
Region #Pop N
cpDNA ITS
n HS HT GST NST n HS HT GST NST
Qinghai-Tibetan Plateau (QTP) 28 321 31 0.314 0.955 0.672 0.896* 13 0.117 0.811 0.856 0.947*Northern China 15 167 5 0.112 0.355 0.683 0.671 6 0.223 0.667 0.666 0.678Mongolian Plateau 4 54 1 – – – – 3 0.110 0.738 0.851 0.990Central Asia 7 76 8 0.173 0.856 0.798 0.896* 5 0.287 0.594 0.517 0.596Total 54 618 44 0.216 0.905 0.761 0.870* 25 0.168 0.854 0.804 0.968*
ITS, internal transcribed spacer; #Pop, no. of populations; N, no. of plants; n, no. of chlorotypes ⁄ ribotypes.*, P < 0.005.
Table 2 Pairwise genetic differentiation (FST) among regions estimatedfrom internal transcribed spacer (ITS) sequences (upper part) and cpDNAsequences (lower part)
QTPNorthernChina
MongolianPlateau
CentralAsia
Qinghai-Tibetan Plateau (QTP) 0.960 0.976 0.979Northern China 0.726 0.990 0.990Mongolian Plateau 0.703 0.963 0.786Central Asia 0.815 0.998 0.998
All values are significant at the 0.01 level in a permutation tests (1000permutations).
Table 3 Analysis of molecular variance (AMOVA) of chlorotypes and ITS ribotypes for Hippophae rhamnoides populations, partitioned by subspecies andregions, respectively
Partitioning Source of variation df
cpDNA ITS
SS VC PV (%) SS VC PV (%)
By subspecies Among subspecies 4 8986.633 20.409 54.05 3215.827 7.515 76.78Among populations 49 6134.421 10.357 27.43 1151.816 2.039 20.84Within populations 564 3945.402 6.995 18.53 131.424 0.233 2.38Total 617 19 066.456 37.762 4499.068 9.787
By region Among regions 3 5284.371 11.899 33.49 2310.731 5.563 59.30Among populations 50 9836.683 16.632 46.82 2056.912 3.586 38.22Within populations 564 3945.402 6.995 19.69 131.424 0.233 2.48Total 617 19 066.456 35.527 4499.068 9.382
df, degrees of freedom; SS, sum of squares; VC, variance components; PV, percentage of variation.
NewPhytologist Research 1129
� 2012 The Authors
New Phytologist � 2012 New Phytologist Trust
New Phytologist (2012) 194: 1123–1133
www.newphytologist.com
an origin of H. rhamnoides in the QTP region and subsequentcolonization by dispersal of other parts of Eurasia. Further sup-port for this hypothesis came from Bayes-DIVA biogeographicanalyses of the cpDNA and nrITS trees, which suggested thatmultiple dispersals from the QTP accounted for most of thespecies’ range expansion in Asia (Fig. 3). The inferred migrationroute of H. rhamnoides to Europe through intervening mountainranges in central Asia and Asia Minor is one suggested previouslyfor many plants of the European Alps and neighbouring moun-tain ranges that originated in the QTP region (Kadereit et al.,2008). It was estimated that dispersal to central Asia (representedby clade D of cpDNA and clade IV of nrITS) preceded that tonorthern China (represented by clade E of cpDNA and clade Vof nrITS) with both dispersal events having their source in theQTP. Because cpDNA is maternally inherited in Hippophae(Bartish et al., 2002), the phylogeographic patterns observed arelikely to reflect past migration of the species through long-distance seed dispersal mediated by birds. The fleshy fruits of thespecies are preferred by migrating birds that stay at high-altitudein the central QTP in summer (to avoid high temperature) andreturn to northern China or central Asia in autumn (e.g.Blanford’s snow finch; Cramp & Perrins, 1994; Qu et al., 2010).
Allopatric divergence, glacial refugia and local expansion
Clade divergence within the QTP (i.e. clades A–C for cpDNA,and clades II and III for ITS) and also outside the QTP (clades Dand E for cpDNA, and IV and V for ITS) indicates thatH. rhamnoides underwent allopatric divergence in different partsof its distribution during its evolutionary history. Clades A, Band C comprise cpDNA haplotypes found mainly in the western,eastern and central parts of the species’ distribution range in theQTP, respectively, while clades D and E comprise haplotypesthat occur mainly in Europe ⁄ central Asia and northernChina ⁄ Mongolia, respectively (Figs 1, 2a). Similarly, ITS clades(I, II and III) are distributed mainly in western-central, southeast-ern, and northeastern parts of its range in the QTP, while ribo-types in clades IV and V occur in Europe ⁄ central Asia ⁄ Mongoliaand northern China, respectively (Figs 1, 2b). Although there isno ‘one to one’ match between the five cpDNA clades and thenine subspecies sampled within H. rhamnoides, haplotypes con-tained within ssp. wolongensis form a subclade of clade B, whilethose present in ssp. turkestanica, caucasica, carpatica andfluviatilis comprise clade D, and those in ssp. mongolica and
sinensis mainly comprise clade E. Thus, there is evidence of anassociation between phylogenetic and taxonomic divergencewithin the species. The same is also apparent from an examina-tion of the ITS phylogeny (Fig. 2b).
The major cpDNA and ITS clades were estimated to havediverged from the earliest Pliocene to the middle Quaternary(Table S3). The available fossil record of Hippophae in Europe istoo recent (the middle Pleistocene; Krupinski, 1992; Lang, 1994)for dating analyses based on ITS or cpDNA, while the fossilrecord of this genus in eastern Asia is very poor. Therefore, diver-gence dates were estimated from conventional substitution ratesof 1–3 · 10)9 s s)1 yr)1 for cpDNA (Wolfe et al., 1987) and3.46–8.69 · 10)9 s s)1 yr)1 for ITS sequences (Richardsonet al., 2001). There was a reasonable match in divergence datesfor the main cpDNA and ITS clades, that is, spanning the Plio-cene and middle Quaternary periods. It is thought that the QTPunderwent an extensive uplift during the Pliocene and Quater-nary periods (Li & Li, 1991; Shi et al., 1998) with climates oscil-lating greatly during this period (Shi, 2002). It is feasible,therefore, that these marked geological and climatic changescould have fragmented the distribution of H. rhamnoides withinthe QTP and triggered the phylogenetic divergence recorded.Clearly, acceptance of this possibility needs to be treated withcaution given the uncertainty of the clade divergence dates; how-ever, multiple glacial refugia in the QTP during the Quaternary(Wang et al., 2009; Tang et al., 2010; Wu et al., 2010; Li et al.,2011) are thought to have caused similar deep phylogeneticdivergence within several other plant species found in this region(e.g. Wang et al., 2009; Tang et al., 2010), including a congenerH. tibetana (Wang et al., 2010; Jia et al., 2011).
The latest divergence within H. rhamnoides clades (i.e.between central Asia and Asia Minor ⁄ Europe; node a5 inFig. 2a and node b4 in Fig. 2b) was estimated to have occurredbetween 1.45 (95% HPD: 0.53–2.82) and 1.87 (95% HPD:0.82–3.25) Ma (Table S3), indicating that populations of thespecies have survived in the QTP, northern China, the Mongo-lian Plateau, central Asia and Asia Minor ⁄ Europe since at leastthis time. The divergences within the Asia Minor ⁄ Europe lineageshould be later, around the middle Pleistocene, which is congru-ent with fossil records in central Europe (Lang, 1994). In ouranalysis, we were only able to detect a significant range expansionin clade E, which is distributed in northern China ⁄ MongolianPlateau. This expansion was dated to 90.4 (95% CI: 40.1–139.5)thousand yr ago, which mostly corresponds to the Last
Table 4 The results of Tajima’s D and Fu’s FS tests, and mismatch distribution analyses (MDA) for the five lineages (A–E) of Hippophae rhamnoides
chlorotypes
Clades
Tajima’s D test Fu’s FS test Mismatch distribution
D P FS P s 95% CI Hrag P SSD P
A )0.605 0.373 0.314 0.363 8.602 4.879–13.453 0.222 0.780 0.073 0.730B )1.577 0.048 )6.576 0.006 8.756 4.930–29.469 0.022 0.630 0.022 0.360C 0 0.822 0.134 0.272 6.289 0.885–91.289 0.444 0.810 0.186 0.280D )0.993 0.162 )8.838 < 0.001 6.602 3.486–9.455 0.030 0.680 0.014 0.535E )1.335 0.088 )15.557 < 0.001 2.248 0.998–3.467 0.163 0.100 0.039 0.120
1130 Research
NewPhytologist
� 2012 The Authors
New Phytologist � 2012 New Phytologist Trust
New Phytologist (2012) 194: 1123–1133
www.newphytologist.com
Interglacial Period (Zheng et al., 2002) in the late Pleistoceneand earlier than the Last Glacial Maximum (LGM; 18–21thousand yr ago). Interestingly, this age is highly consistentwith the estimate for range expansion of the species in AsiaMinor ⁄ Europe (Bartish et al., 2006). Failure to detectdemographic expansions in the other clades might stem from thelimited number of samples and haplotypes recorded or for otherreasons currently unknown.
Hybridization and ⁄ or introgression
Several examples of phylogenetic incongruence between thecpDNA and ITS trees indicated that historical hybridization andintrogression had occurred between H. rhamnoides and a closerelative, and also between some subspecies of H. rhamnoides.Interspecific hybridization between H. rhamnoides andH. neurocarpa was suggested by the finding that two ribotypes(R55 and R56) present in a few individuals of ssp. yunnanensisclustered with H. neurocarpa in the ITS tree, whereas theircpDNA haplotypes were placed firmly within H. rhamnoides inthe cpDNA tree. Bartish et al. (2002) previously proposed thathybridization between these two species resulted in the originof the two homoploid hybrid species, H. goniocarpa andH. litangensis (Lian et al., 1998; Sun et al., 2003). Hybridizationbetween ssp. yunnanensis and ⁄ or ssp. wolongensis and ssp. sinensiswas also indicated by the following: several individuals of ssp.sinensis in population 20 (Table S1; Fig. 1) possessed cpDNAhaplotypes characteristic of ssp. yunnanensis and wolongensis (i.e.placed in clade B), but ribotypes characteristic of ssp. sinensis (i.e.placed in clade V of the ITS tree); and certain individuals inpopulation 21 of ssp. sinensis possessed a cpDNA haplotype char-acteristic of this subspecies (i.e. placed in clade E), but a ribotypethat clustered with those of ssp. yunnanensis and wolongensis inclade III of the ITS tree. Finally, there was an indication that ssp.mongolica originated from hybridization between ssp. sinensis andssp. turkestanica in that its cpDNA haplotype (C26) was placedwithin those of ssp. sinensis in the cpDNA tree (clade E; Fig. 2a),while its ribotypes were placed in a subclade with those of ssp.turkestanica (clade IV; Fig. 2b).
Conclusions
Hippophae rhamnoides is one of seven species recognized in thegenus (Swenson & Bartish, 2002). Whereas the six other species,H. goniocarpa, H. litangensis, H. gyantsensis, H. neurocarpa,H. salicifolia and H. tibetana, are restricted in their distributionto the QTP and the adjacent Himalaya region, H. rhamnoides isdisjunctly distributed across Eurasia occurring in the QTP,northern China, Mongolia, Siberia, central Asia, Asia Minor andEurope. Our phylogeographic analysis of H. rhamnoides indicatesthat the species originated in the QTP and then dispersed out ofthe QTP to other parts of Eurasia. Thus, our results support thehypothesis that many Northern Hemisphere, widespread,temperate plant groups having the greatest diversification in thehighlands of Asia originated in the QTP and adjacent highlands,before migrating to other northern hemisphere regions and
undergoing divergence. Both within and outside the QTPH. rhamnoides is divergent at the molecular level with several dis-tinct clades resolved in both cpDNA and ITS phylogenetic trees.It was not possible to date the origin of these clades precisely;however, it is feasible that they originated during the Plioceneepoch and Quaternary period when the QTP and other partsof Eurasia underwent considerable geological and ⁄ or climaticoscillations. Such oscillations are likely to have fragmented thedistribution of H. rhamnoides and triggered allopatric divergenceand the formation of deep clades. We were only able to detect asignificant expansion for one of the cpDNA clades, which using amean substitution rate was estimated to have occurred before theLast Glacial Maximum. Although there was no ‘one to one’match between the molecular clades and the nine subspecies weexamined in H. rhamnoides, there was an association betweenphylogenetic and taxonomic divergence. A comparison of thetopologies of the cpDNA and ITS trees revealed several examplesof phylogenetic incongruence indicating that historical hybridi-zation and introgression had occurred between H. rhamnoidesand a closely related species, and also between some subspecies ofH. rhamnoides.
Acknowledgements
We thank Dr M. Rabadanov for assistance in collecting materialfrom eastern Caucasus, Dr K. Rumpunen for allowing us tocollect wild materials of Hippophae cultivated at Balsgard, Sweden,and Dr Y-M. Yuan for collecting material from Switzerland onour behalf. We are grateful to two anonymous reviewers for theirconstructive criticism of an earlier version of the manuscript.This research was supported by grants from the Natural ScienceFoundation of China (30725004 and 40972018), the Key Pro-ject of International Collaboration Program, the Ministry of Sci-ence and Technology of China (grant number 2010DFB63500)to J.Q.L., a Royal Society-NSF China International Joint Projectaward 2010 ⁄ R4 to R.J.A. and J.Q.L., and an InternationalCollaboration ‘111’ Project to J.Q.L and Purkine fellowshipfrom the Academy of Sciences of the Czech Republic to I.V.B.
References
Abbott RJ, Smith LC, Milne RI, Crawford RMM, Wolff K, Balfour J. 2000.
Molecular analysis of plant migration and refugia in the Arctic. Science 289:
1343–1346.
Avise JC. 2000. Phylogeography: the history and formation of species. London, UK:
Harvard University Press.
Axelrod DI, Al SI, Raven PH. 1996. History of the modern flora of China. In:
Zhang AL, Wu SG, eds. Floristic characteristics and diversity of East Asian plants.Hongkong, China: Springer, 43–55.
Bartish IV, Jeppsson N, Bartish GI, Lu R, Nybom H. 2000. Inter- and
intraspecific genetic variation in Hippophae (Elaeagnaceae) investigated by
RAPD markers. Plant Systematics and Evolution 225: 85–101.
Bartish IV, Jeppsson N, Nybom H, Swenson U. 2002. Phylogeny of Hippophae(Elaeagnaceae) inferred from parsimony analysis of chloroplast DNA and
morphology. Systematic Botany 27: 41–54.
Bartish IV, Kadereit JW, Comes HP. 2006. Late Quaternary history of
Hippophae rhamnoides L. (Elaeagnaceae) inferred from chalcone synthase
intron (Chsi) sequences and chloroplast DNA variation. Molecular Ecology 15:
4065–4083.
NewPhytologist Research 1131
� 2012 The Authors
New Phytologist � 2012 New Phytologist Trust
New Phytologist (2012) 194: 1123–1133
www.newphytologist.com

Bernatchez L. 2001. The evolutionary history of brown trout (Salmo trutta L.)
inferred from phylogeographic, nested clade, and mismatch analyses of
mitochondrial DNA variation. Evolution 55: 351–379.
Clement M, Posada D, Crandall KA. 2000. TCS: a computer program to
estimate gene genealogies. Molecular Ecology 9: 1657–1659.
Cox CB, Moore PD. 2000. Biogeography: an ecological and evolutionary approach.
Oxford, UK: Blackwell Science.
Cramp S, Perrins CM. 1994. The birds of the Western Palearctic. New York, NY,
USA: Oxford University Press.
Donoghue MJ, Bell CD, Li J. 2001. Phylogenetic patterns in Northern
Hemisphere plant geography. International Journal of Plant Sciences 162:
41–52.
Donoghue MJ, Smith SA. 2004. Patterns in the assembly of temperate forests
around the Northern Hemisphere. Philosophical Transactions of the Royal Societyof London. Series B: Biological Sciences 359: 1633–1644.
Drummond AJ, Nicholls GK, Rodrigo AG, Solomon W. 2002. Estimating
mutation parameters, population history and genealogy simultaneously from
temporally spaced sequence data. Genetics 161: 1307–1320.
Drummond AJ, Rambaut A. 2007. BEAST: Bayesian evolutionary analysis by
sampling trees. BMC Evolutionary Biology 7: 214.
Excoffier L, Laval G, Schneider S. 2005. Arlequin (version 3.0): an integrated
software package for population genetics data analysis. EvolutionaryBioinformatics Online 1: 47–50.
Excoffier L, Smouse PE, Quattro JM. 1992. Analysis of molecular variance
inferred from metric distances among DNA haplotypes: application to human
mitochondrial DNA restriction data. Genetics 131: 479–491.
Felsenstein J. 1985. Confidence limits on phylogenies: an approach using the
bootstrap. Evolution 39: 783–791.
Fu YX. 1997. Statistical tests of neutrality of mutations against population
growth, hitchhiking and background selection. Genetics 147: 915–925.
Futuyma DJ. 1998. Evolutionary biology. Sunderland, MA, USA: Sinauer
Associates.
Guindon S, Gascuel O. 2003. A simple, fast, and accurate algorithm to estimate
large phylogenies by maximum likelihood. Systematic Biology 52: 696–704.
Hamilton MB. 1999. Four primer pairs for the amplification of chloroplast
intergenic regions with intraspecific variation. Molecular Ecology 8: 521–523.
Harpending HC. 1994. Signature of ancient population growth in a
low-resolution mitochondrial DNA mismatch distribution. Human Biology 66:
591–600.
Huelsenbeck JP, Rannala B. 1997. Phylogenetic methods come of age: testing
hypotheses in an evolutionary context. Science 276: 227–232.
Huelsenbeck JP, Ronquist F. 2001. MRBAYES: Bayesian inference of
phylogenetic trees. Bioinformatics 17: 754–755.
Hyvonen J. 1996. On phylogeny of Hippophae (Elaeagnaceae). Nordic Journal ofBotany 16: 51–62.
Jia DR, Liu TL, Wang LY, Zhou DW, Liu JQ. 2011. Evolutionary history of an
alpine shrub Hippophae tibetana (Elaeagnaceae): allopatric divergence and
regional expansion. Biological Journal of the Linnean Society 102: 37–50.
Kadereit JW, Licht W, Uhink CH. 2008. Asian relationships of the flora of the
European Alps. Plant Ecology & Diversity 2: 171–179.
Koch MA, Matschinger M. 2007. Evolution and genetic differentiation among
relatives of Arabidopsis thaliana. Proceedings of the National Academy of Sciences,USA 104: 6272–6277.
Krupinski K. 1992. Significance of Hippophae rhamnoides L. in evolution of the
Eemian Interglacial flora in Warsaw area. Acta Societatia Botanicorum Poloniae61: 131–144.
Lang G. 1994. Quartare Vegetationsgeschichte Europas: Methoden und Ergebnisse.Heidelberg, Germany: Spektrum Akademischer Verlag.
Lewis PO. 2001. A likelihood approach to estimating phylogeny from discrete
morphological character data. Systematic Biology 50: 913–925.
Li BY, Li JJ. 1991. Quaternary glacial distribution map of Qinghai-Xizang (Tibet)Plateau. Beijing, China: Science Press.
Li ZH, Zhang QA, Liu JQ, Kallman T, Lascoux M. 2011. The Pleistocene
demography of an alpine juniper of the Qinghai-Tibetan Plateau: tabula rasa,
cryptic refugia or something else? Journal of Biogeography 38: 31–43.
Lian YS, Chen XL, Lian H. 1998. Systematic classification of the genus
Hippophae L. Seabuckthorn Research 1: 13–23.
Lian YS, Chen XL, Sun K, Ma RJ. 2003. A new subspecies of Hippophae(Elaeagnaceae) from China. Novon 13: 200–202.
Liu JQ, Gao TG, Chen ZD, Lu AM. 2002. Molecular phylogeny and
biogeography of the Qinghai-Tibet Plateau endemic Nannoglottis (Asteraceae).
Molecular Phylogenetics and Evolution 23: 307–325.
Mao KS, Hao G, Liu JQ, Adams RP, Milne RI. 2010. Diversification and
biogeography of Juniperus (Cupressaceae): variable diversification rates and
multiple intercontinental dispersals. New Phytologist 188: 254–272.
Ozenda P. 1988. Die Vegetation der Alpen im europaischen Gebirgsraum. Stuttgart,
Germany: Fischer.
Pons O, Petit RJ. 1996. Measuring and testing genetic differentiation with
ordered versus unordered alleles. Genetics 144: 1237–1245.
Posada D. 2008. jModelTest: phylogenetic model averaging. Molecular Biologyand Evolution 25: 1253–1256.
Qiu YX, Fu CX, Comes HP. 2011. Plant molecular phylogeography in China
and adjacent regions: tracing the genetic imprints of Quaternary climate and
environmental change in the world’s most diverse temperate flora. MolecularPhylogenetics and Evolution 59: 225–244.
Qu Y, Lei F, Zhang R, Lu X. 2010. Comparative phylogeography of five avian
species: implications for Pleistocene evolutionary history in the
Qinghai-Tibetan Plateau. Molecular Ecology 19: 338–351.
Rambaut A, Drummond AJ. 2007. Tracer v 1.5. [WWW program] URL:
http://beast.bio.ed.ac.uk/Tracer [accessed on 18 December 2009].
Richardson JE, Pennington RT, Pennington TD, Hollingsworth PM. 2001.
Rapid diversification of a species-rich genus of neotropical rain forest trees.
Science 293: 2242–2245.
Rogers AR. 1995. Genetic evidence for a Pleistocene population explosion.
Evolution 49: 608–615.
Rogers A, Harpending H. 1992. Population growth makes waves in the
distribution of pairwise genetic differences. Molecular Biology and Evolution 9:
552–569.
Ronquist F, Huelsenbeck JP. 2003. MrBayes 3: Bayesian phylogenetic inference
under mixed models. Bioinformatics 19: 1572–1574.
Rousi A. 1971. The genus Hippophae L. A taxonomic study. Annales BotaniciFennici 8: 177–227.
Schneider S, Excoffier L. 1999. Estimation of past demographic parameters
from the distribution of pairwise differences when the mutation rates vary
among sites: application to human mitochondrial DNA. Genetics 152:
1079–1089.
Shi YF. 2002. Characteristics of late quaternary monsoonal glaciation on the
Tibetan Plateau and in East Asia. Quaternary International 97: 79–91.
Shi YF, Li JJ, Li BY. 1998. Uplift and environmental changes of Qinghai-TibetanPlateau in the late Cenozoic. Guangzhou, China: Guangdong Science and
Technology Press.
Slatkin M, Maddison WP. 1989. A cladistic measure of gene flow inferred from
the phylogenies of alleles. Genetics 123: 603–613.
Sun K, Chen X, Ma R, Li C, Wang Q, Ge S. 2002. Molecular phylogenetics of
Hippophae L. (Elaeagnaceae) based on the internal transcribed spacer (ITS)
sequences of nrDNA. Plant Systematics and Evolution 235: 121–134.
Sun K, Ma RJ, Chen XL, Li CB, Ge S. 2003. Hybrid origin of the diploid
species Hippophae goniocarpa evidenced by the internal transcribed spacers
(ITS) of nuclear rDNA. Belgian Journal of Botany 136: 91–96.
Sun H, McLewin W, Fay MF. 2001. Molecular phylogeny of Helleborus(Ranunculaceae), with an emphasis on the East Asian-Mediterranean
disjunction. Taxon 50: 1001–1018.
Swenson U, Bartish IV. 2002. Taxonomic synopsis of Hippophae (Elaeagnaceae).
Nordic Journal of Botany 22: 369–374.
Swofford DL. 2002. PAUP*: phylogenetic analysis using parsimony (and othermethods). Sunderland, MA, USA: Sinauer Associates.
Taberlet P, Gielly L, Pautou G, Bouvet J. 1991. Universal primers for
amplification of three non-coding regions of chloroplast DNA. Plant MolecularBiology 17: 1105–1109.
Tajima F. 1989. Statistical method for testing the neutral mutation hypothesis by
DNA polymorphism. Genetics 123: 585–595.
Tamura K, Dudley J, Nei M, Kumar S. 2007. MEGA4: molecular evolutionary
genetics analysis (MEGA) software version 4.0. Molecular Biology and Evolution24: 1596–1599.
1132 Research
NewPhytologist
� 2012 The Authors
New Phytologist � 2012 New Phytologist Trust
New Phytologist (2012) 194: 1123–1133
www.newphytologist.com

Tang LZ, Wang LY, Cai ZY, Zhang TZ, Ci HX, Lin GH, Su JP, Liu JQ. 2010.
Allopatric divergence and phylogeographic structure of the plateau zokor
(Eospalax baileyi), a fossorial rodent endemic to the Qinghai-Tibetan Plateau.
Journal of Biogeography 37: 657–668.
Templeton AR, Crandall KA, Sing CF. 1992. A cladistic analysis of phenotypic
associations with haplotypes inferred from restriction endonuclease mapping
and DNA-sequence data. 3. Cladogram estimation. Genetics 132: 619–633.
Thompson JD, Gibson TJ, Plewniak F, Jeanmougin F, Higgins DG. 1997. The
CLUSTAL_X windows interface: flexible strategies for multiple sequence
alignment aided by quality analysis tools. Nucleic Acids Research 25:
4876–4882.
Tu TY, Volis S, Dillon MO, Sun H, Wen J. 2010. Dispersals of Hyoscyameae
and Mandragoreae (Solanaceae) from the New World to Eurasia in the early
Miocene and their biogeographic diversification within Eurasia. MolecularPhylogenetics and Evolution 57: 1226–1237.
Wang LY, Abbott RJ, Zheng W, Chen P, Wang YJ, Liu JQ. 2009. History and
evolution of alpine plants endemic to the Qinghai-Tibetan Plateau: Aconitumgymnandrum (Ranunculaceae). Molecular Ecology 18: 709–721.
Wang H, Qiong L, Sun K, Lu F, Wang YG, Song ZP, Wu QH, Chen JK,
Zhang WJ. 2010. Phylogeographic structure of Hippophae tibetana(Elaeagnaceae) highlights the highest microrefugia and the rapid uplift of the
Qinghai-Tibetan Plateau. Molecular Ecology 19: 2964–2979.
Wang AL, Schluetz F, Liu JQ. 2008. Molecular evidence for double maternal
origins of the diploid hybrid Hippophae goniocarpa (Elaeagnaceae). BotanicalJournal of the Linnean Society 156: 111–118.
White TJ, Bruns T, Lee S, Taylor JW. 1990. Amplification and direct
sequencing of fungal ribosomal RNA genes for phylogenetics. In: Innis MA,
Gelfand DH, Shinsky JJ, White TJ, eds. PCR Protocols: a guide to methods andapplications. New York, NY, USA: Academic Press, 315–322.
Wolfe KH, Li WH, Sharp PM. 1987. Rates of nucleotide substitution vary
greatly among plant mitochondrial, chloroplast, and nuclear DNAs. Proceedingsof the National Academy of Sciences, USA 84: 9054–9058.
Wu LL, Cui XK, Milne RI, Sun YS, Liu JQ. 2010. Multiple
autopolyploidizations and range expansion of Allium przewalskianum Regel.
(Alliaceae) in the Qinghai-Tibetan Plateau. Molecular Ecology 19: 1691–1704.
Wu ZY. 1988. Hengduan Mountains flora and its significance. Journal of JapaneseBotany 63: 297–311.
Wu ZY, Wu SG. 1996. A proposal for a new floristic kingdom (realm) – the E.
Asiatic kingdom, its delineation and characteristics. In: Zhang AL, Wu SG,
eds. Floristic characteristics and diversity of East Asian plants. Beijing, China:
China Higher Education Press, 3–42.
Wulff EV. 1943. An introduction to historical plant geography. Waltham, MA,
USA: Chronica Botanica Company.
Xu TT, Abbott RJ, Milne RI, Mao K, Du FK, Wu GL, Ciren ZX, Miehe G, Liu
JQ. 2010. Phylogeography and allopatric divergence of cypress species
(Cupressus L.) in the Qinghai-Tibetan Plateau and adjacent regions. BMCEvolutionary Biology 10: 194.
Young ND, Healy J. 2003. GapCoder automates the use of indel characters in
phylogenetic analysis. BMC Bioinformatics 4: 6.
Yu Y, Harris AJ, He X. 2010. S-DIVA (Statistical Dispersal-Vicariance Analysis):
a tool for inferring biogeographic histories. Molecular Phylogenetics andEvolution 56: 848–850.
Yu Y, Harris AJ, He X. 2011. RASP (Reconstruct Ancestral State in Phylogenies) 2.0beta. [WWW program] URL http://mnh.scu.edu.cn/soft/blog/RASP [accessed
on 13 June 2011].
Zhang LB, Comes HP, Kadereit JW. 2001. Phylogeny and Quaternary history of
the European montane ⁄ alpine endemic Soldanella (Primulaceae) based on ITS
and AFLP variation. American Journal of Botany 88: 2331–2345.
Zhang LB, Comes HP, Kadereit JW. 2004. The temporal course of Quaternary
diversification in the European high mountain endemic Primula sect. Auricula
(Primulaceae). International Journal of Plant Sciences 165: 191–207.
Zhang ML, Kang Y, Zhou LH, Podlech D. 2009. Phylogenetic origin of
Phyllolobium with a further implication for diversification of Astragalus in
China. Journal of Integrative Plant Biology 51: 889–899.
Zhang ML, Uhink CH, Kadereit JW. 2007. Phylogeny and biogeography of
Evpimedium ⁄ Vancouveria (Berberidaceae): Western North American – East
Asian disjunctions, the origin of European mountain plant taxa, and East Asian
species diversity. Systematic Botany 32: 81–92.
Zheng BX, Xu QQ, Shen YP. 2002. The relationship between climate change
and Quaternary glacial cycles on the Qinghai-Tibetan Plateau: review and
speculation. Quaternary International 97–98: 93–101.
Supporting Information
Additional supporting information may be found in the onlineversion of this article:
Fig. S1 TCS networks of (a) chlorotypes and (b) general ITSribotypes (see Table S2).
Fig. S2 Mismatch distribution analyses of the five cpDNAclades showing histogram of observed mismatch frequencies andbest-fit curve of the sudden expansion model.
Table S1 Locations of populations of Hippophae rhamnoidessampled, sample sizes (n), numbers of different cpDNA haplo-types and ITS ribotypes recorded in each population, andestimates of gene diversity (h) and nucleotide diversity (p) inpercent
Table S2 List of the general ITS types grouped by TCS aftercollapsing sequences that differ only by ambiguous sites
Table S3 The divergence times of major cpDNA and ITSphylogenetic nodes (Fig. 2)
Please note: Wiley-Blackwell are not responsible for the contentor functionality of any supporting information supplied by theauthors. Any queries (other than missing material) should bedirected to the New Phytologist Central Office.
NewPhytologist Research 1133
� 2012 The Authors
New Phytologist � 2012 New Phytologist Trust
New Phytologist (2012) 194: 1123–1133
www.newphytologist.com