out-of-state and natural contributions to baseline atmospheric mercury deposition in alaska krish...
TRANSCRIPT
1
Out-of-state and Natural Contributions to Baseline Atmospheric Mercury Deposition in
Alaska
Krish Vijayaraghavan, Jaegun Jung and Ralph MorrisENVIRON International Corporation
Novato, CA
Alaska Forum on the EnvironmentAnchorage, AK
February 6, 2014
Acknowledgments
2
• Donlin Gold• U.S. Environmental Protection Agency• State of Alaska• Harvard University• Dr. Lyatt Jaeglé, U. Washington, Seattle

Why is Mercury Important in Alaska?
3
• Naturally found in Earth’s crust • Trace amounts in fossil fuels and mine deposits• Potential concerns with mercury:– Exposure to inorganic mercury in the air– Exposure to organic mercury in fish and mammals
• Health benefits from eating fish and marine mammals– State of Alaska: Risk v. Benefit approach for eating fish
• Important to consider all potential sources of mercury in Alaska including atmospheric deposition
What is Atmospheric Mercury Deposition?
4
• Removal of mercury from the air to the ground • Wet deposition – Removal in rain and snow– Depends on precipitation and mercury concentration
• Dry deposition– Removal by settling or molecular diffusion to the ground– Depends on land cover, winds and other weather
conditions
• Different forms of mercury exhibit different deposition characteristics

Forms of Mercury and Deposition
5
• Gaseous Elemental Mercury Hg(0)– Not removed from the air in rain or snow– Removed in dry conditions but also re-emitted– Transported around the world
• Gaseous Oxidized Mercury Hg(II)– Rapidly removed from the air by wet and dry deposition– Deposited locally and regionally
• Particulate-bound Oxidized Mercury Hg(p)– Properties are between those of the two gaseous forms.
• Organic mercury MeHg– Very little in air, instead formed in water/sediment– Methylation depends on local conditions such as sulfates – Bioaccumulates in fish and mammals

Mercury Cycle (simplified)
6
MeHg
Re-emission
DryDeposition
WetDeposition
Dry and WetDeposition
Throughfalland Litterfall
Inorganic Hg MeHg Sediment
WaterSnow/Ice
DepositionRe-emission
Long RangeTransport of mercury
For illustrative purposes only
Transformationsamong forms of
mercury
Mercury
Inorganic Hg
Baseline Level of Mercury Deposition
7
• Baseline = “Background” or “Current” level• No standards for mercury deposition (unlike air
concentrations)• The baseline deposition level needs to be quantified to
assess the additional impacts of projects in Alaska• Baseline = Wet + Dry deposition due to existing
sources (defined here for 2005-2008 time period)• Need to assess all sources of mercury contributing to
the baseline– Man-made sources within and outside Alaska– Natural sources within and outside Alaska
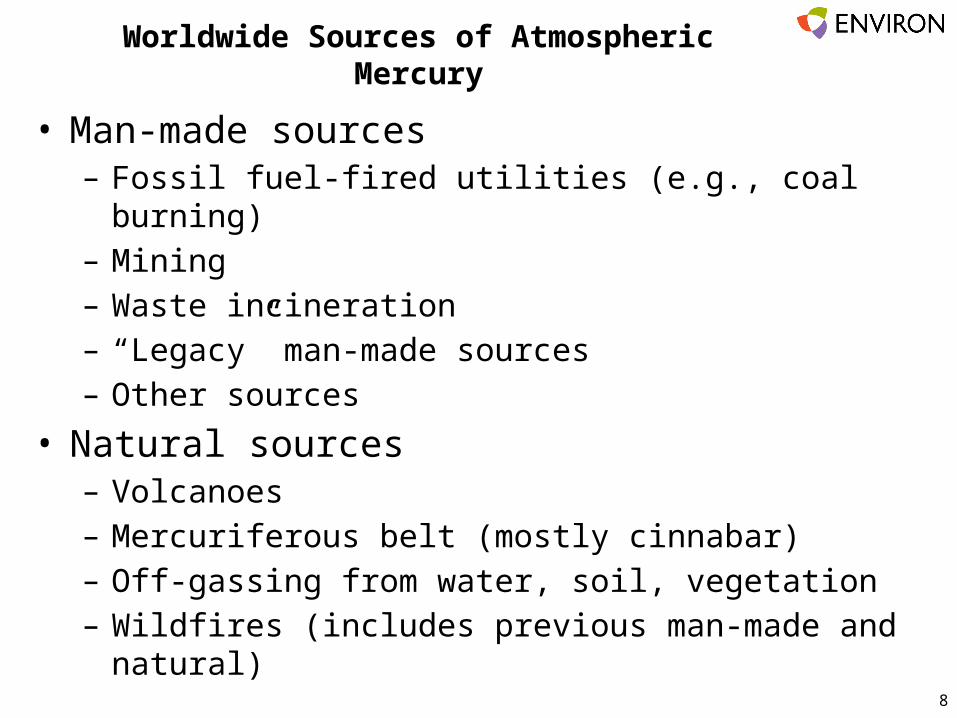
Worldwide Sources of Atmospheric Mercury
8
• Man-made sources– Fossil fuel-fired utilities (e.g., coal burning)– Mining– Waste incineration– “Legacy” man-made sources– Other sources
• Natural sources– Volcanoes– Mercuriferous belt (mostly cinnabar)– Off-gassing from water, soil, vegetation– Wildfires (includes previous man-made and natural)

Man-made Mercury Sources
9
• Alaska man-made mercury emissions = 110 lb/yr (2008 U.S. National Emissions Inventory)– 71% fossil fuel combustion– 13% other industrial processes– 5% waste disposal
• U.S. total man-made mercury emissions = 61 ton/yr (2008 U.S. NEI)– Alaska man-made = 0.1% of US total
• Worldwide man-made Hg emissions = 2000 ton/yr (Pacyna et al., 2010)

Out-of-state Contributions to Alaska
10
• Elemental mercury has very long residence time in air• Arctic air mass moves air pollution around the globe • Mercury emitted in Asia and Europe transported to
North America (and Alaska in particular)– e.g., Coal burning power plants in China, Wildfires in Siberia
• Elemental mercury converted to other forms which wash out or dry deposit over Alaska. – For example, Atmospheric Mercury Depletion Events
(AMDE) during spring near Barrow
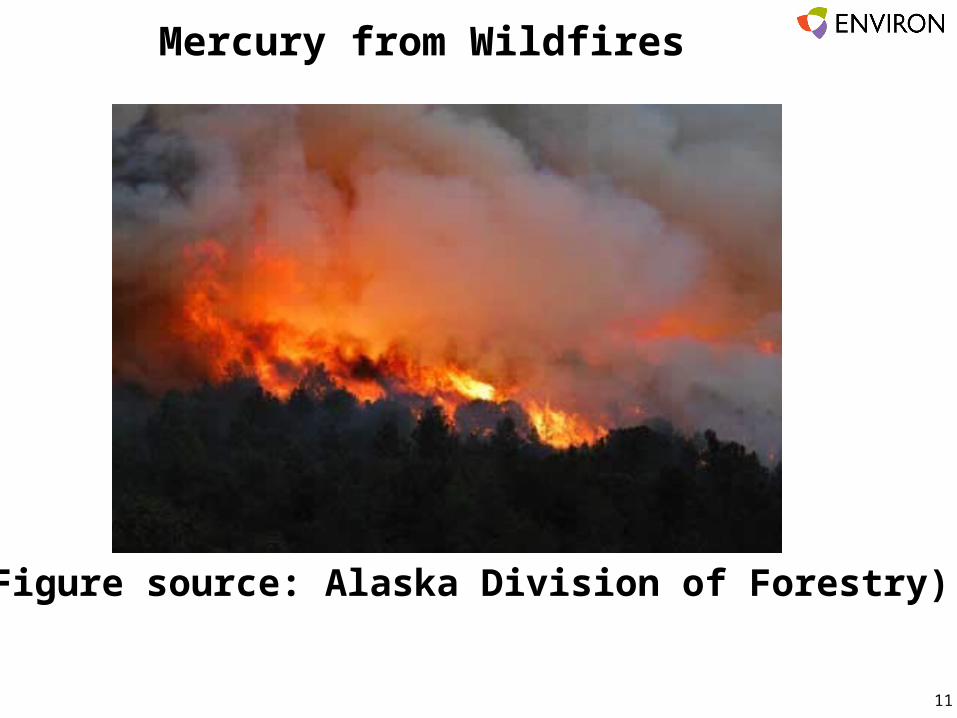
Mercury from Wildfires
11
(Figure source: Alaska Division of Forestry)

Mercury from Wildfires
12
• Mercury in tree needles and leaves due to previously deposited mercury from man-made and natural sources
• Elemental and particulate mercury released in fires• Alaskan wildfire mercury emissions: 2002-2006 average
12 tons/year (from NCAR), Vary widely
Wildfire locationsin 2008 from satellite data

Mercury from Volcanoes
13
Veniaminof volcano (Figure source: Alaska Volcano Observatory)

Mercury from Volcanoes
14
• Mercury emitted from volcanoes: gaseous elemental and particulate
• Mercury emissions estimated by scaling with sulfur dioxide emissions from volcanoes from satellite data
• Volcano mercury emissions in Alaska in 2008 = 29 tons/year

Other Sources of Atmospheric Mercury
15
• Mercury-containing minerals like cinnabar• Off-gassing from soil, vegetation and water– Emission from water (e.g., oceans) saturated with mercury
• “Legacy source” of past man-made emissions which have accumulated in soils and deep oceans and are later released
• Deposited mercury re-emitted to atmosphere as elemental mercury, e.g., from snow
• Difficult to distinguish between “re-emission” of previously deposited mercury and direct natural emissions

Global Mercury Emissions Inventory
16
Global natural emissions~ 4000 tons/year (includes recycled man-made)
Total global mercury emissions ~ 6000 tons/year
Global man-made emissions ~ 2000 tons/year*
AsiaOceaniaAfrica
S. AmericaRussia
Europe
NorthAmerica
Source: Pacyna et al., 2010and EPA Mercury Rule

Mercury Deposition Monitoring in Alaska
Mercury wet deposition measured at 5 stations in the Mercury Deposition Network (MDN) by Alaska DEC and others
3 Active stations (as of 2013)• Unalaska Dutch Harbor• Kodiak island • Gates of Arctic NP
2 Inactive stations• Ambler• Bartlett Cove
Kodiak island – most complete data among the stations

Global Mercury Modeling
18
– Long range transport => Global modeling required– Global chemical transport model used = GEOS-Chem– Mercury air concentrations and wet and dry deposition in 2008– 4o x 5o horizontal grid spacing; vertically up to stratosphere– Worldwide man-made and natural mercury emissions– Used to estimate contributions of continents and various source
categories to mercury deposition in AlaskaHg

Total Baseline Mercury Deposition
19
Wet + Dry DepositionUnits = micrograms per sq. meterYellow and Red => Higher deposition
• Deposition in Alaska much less than most of US• Modeled annual wet deposition at Kodiak island (4.4 mg/m2) compares reasonably well with measurement by Alaska DEC (5.2)
Note differentcolor scales
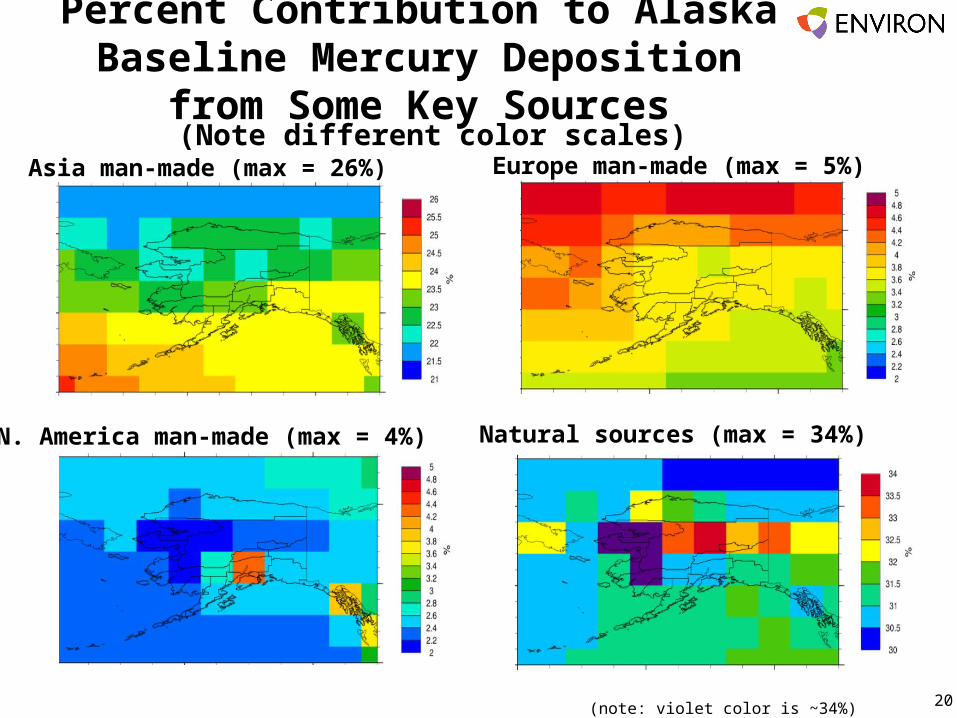
Percent Contribution to Alaska Baseline Mercury Deposition from Some Key Sources
20
Asia man-made (max = 26%) Europe man-made (max = 5%)
Natural sources (max = 34%)N. America man-made (max = 4%)
(Note different color scales)
(note: violet color is ~34%)

Average Contribution toAlaska Baseline Mercury Deposition
21
Natural sources
Wildfires
Asia man-madeN. Americaman-made
Europeman-made
Other currentman-made
Legacy of pastman-made
Summary
22
• Mercury found naturally in the Earth’s crust and associated with some ore deposits and fossil fuels
• To understand the additional impact of any project in Alaska, need to first estimate the baseline (current) mercury deposition in Alaska
• Modeling shows that contributors of baseline mercury deposition in Alaska include (from largest to smallest):– Natural sources such as land, volcanoes, vegetation, water– Legacy of past man-made sources (accumulated in soils and deep
oceans)– Man-made sources from Asia– Man-made sources from other countries and the U.S.
• Large contribution from out-of-state and natural sources

Questions
23
• Krish Vijayaraghavan ENVIRON International Corporation