our strong retirement system: an american success story
TRANSCRIPT


OUR STRONG RETIREMENT SYSTEM: An American Success Story
Contents Summary ......................................................................................................................................... 1
Introduction ..................................................................................................................................... 3
1: Americans’ Retirement Well-Being Has Improved over Time .................................................. 5
2: Access to and Participation in Retirement Plans Are Both Strong ............................................. 8
3: Defined Contribution Plans Can Produce Meaningful Retirement Benefits .............................. 9
4: The 401(k) Is a Good Fit for America’s Mobile Workforce .................................................... 12
5: Americans Report High Levels of Confidence in the 401(k) System ...................................... 14
6: Retirement Plan Contributions Are Tax-Deferred—Not Tax-Free .......................................... 18
7: Retirement Assets Constitute a Major Share of U.S. Household Savings and Investments ..... 24
8: Innovation and Incentives Improve Retirement Security ......................................................... 26
Acknowledgement: This paper was prepared by the staffs of the American Benefits Council, the American Council of Life Insurers, and the Investment Company Institute, based on a draft written by Robert Stowe England.

OUR STRONG RETIREMENT SYSTEM: AN AMERICAN SUCCESS STORY 1
Summary The U.S. retirement system has many components: Social Security provides a strong base, complemented by employer-sponsored retirement plans, IRAs, annuities, homeownership, and other savings. A growing component of that system is employer-sponsored defined contribution arrangements, such as 401(k) plans. These plans are popular and successful with employees and employers. With consistent contributions over time, defined contribution plans can generate substantial retirement benefits, especially when combined with Social Security. This report brings to bear the most recent statistical data and the results of rigorous academic research to clearly illustrate: 1. Americans’ retirement well-being has improved over time, as successive generations of
retirees have been better off than previous generations. 2. Access to and participation in retirement plans are both strong, with almost 80% of full-
time workers having access to employer-sponsored retirement plans, and more than 80% of workers with access to plans participating. With further refinements, coverage could be increased to benefit other workers as well.
3. Defined contribution plans can produce meaningful retirement benefits, as evidenced by
account balances that reflect combined 401(k) and IRA assets accumulated over a full working career. Near-retirees (age 60–64) have on average nearly $360,000 in their defined contribution accounts and IRAs combined.
4. The 401(k) is a good fit for America’s mobile workforce, in which workers tend to move
from job to job, because these plans are portable. When employees accumulate savings in workplace retirement plans like the 401(k), those assets grow with them when they change jobs.
5. Americans report high levels of confidence in the 401(k) system—despite recent market
turmoil—and appreciate its many user-friendly features including the tax benefits, the convenience of payroll deduction, their control over their own assets, and the choice of distribution options.
6. Retirement plan contributions are tax-deferred, not tax-free, meaning that efforts to raise
money by reducing tax incentives for retirement plans are short-sighted and illusory—and could ultimately decrease retirement savings, especially for low-income workers.
7. Retirement assets constitute a major share of U.S. households’ savings and investments,
providing more than $20 trillion ($5.3 trillion from defined contribution plans alone) in private investment capital for American businesses.
8. Innovation and incentives improve retirement security, as demonstrated by initiatives that
are well under way (such as automatic enrollment, automatic escalation, and life-cycle investing).

2 OU
OUR STRONG RETIREMENT SYSTEM: AN AMERICAN SUCCESS STORY
The evidence is compelling: the current retirement savings system is fostering economic
security in retirement for Americans across all income levels. Defined contribution plans have grown in importance in U.S. retirement accumulations, rising to be a key component of the voluntary, private-sector employer-sponsored system. Defined contribution plans, which offer workers a portable benefit that grows throughout their careers, are a flexible platform for further innovation and improvement. Defined contribution plans are not just “working,” they are strong.

OUR STRONG RETIREMENT SYSTEM: AN AMERICAN SUCCESS STORY 3
Introduction
The accomplishments of the retirement system in the United States do not receive enough attention. For this reason, it is critical that we take a closer look.
This report delves into the evidence from data, studies and surveys that explain how the
retirement system contributes to the retirement security of Americans. The report also demonstrates that the ability of the retirement system to provide resources during retirement has improved over the past two decades.
Defined contribution (DC) plans have become the dominant private-sector retirement savings
vehicle in the United States.1 This paper will demonstrate how these voluntary, employer-sponsored arrangements are helping Americans prepare for retirement. Furthermore, while workers retiring today have not had full careers with DC plans as their primary retirement plan, a number of studies demonstrate that DC plans will provide significant resources during retirement for the nation’s workers.
There are several key strengths that characterize the nation’s retirement system, which can be
envisioned as a “pyramid” composed of many components (see figure below). The five broad components of the retirement resource pyramid are Social Security; homeownership; employer-sponsored retirement plans, both private-sector employer and government employer plans, as well as both defined benefit (DB) and DC plans; individual retirement accounts (IRAs), including rollovers; and other assets. This paper primarily focuses on the important role that employer-sponsored plans play in the nation’s retirement system. 1 Broadly, there are two types of employer-sponsored retirement plan designs, defined benefit (DB) and defined contribution (DC). A DB plan is an employer-sponsored pension plan where the amount of future benefits an employee will receive from the plan is defined, typically by a formula based on salary history and years of service. The amount of contributions the employer is required to make will depend on the investment returns experienced by the plan and the benefits promised. A DC plan is an employer-sponsored retirement plan, such as a 401(k) plan or a 403(b) plan, in which contributions are made to individual participant accounts. Depending on the type of DC plan, contributions may be made by the employee, the employer, or both. The employee’s benefits at retirement or termination of employment are based on the employee and employer contributions and earnings and losses on those contributions. For data on trends in private-sector pension plans, see U.S. Department of Labor Employee Benefits Security Administration, Private Pension Plan Bulletin Abstract of 2011 Form 5500 Annual Reports, Version 1.0, June 2013, www.dol.gov/ebsa/PDF/2011pensionplanbulletin.PDF.

4 OU
OUR STRONG RETIREMENT SYSTEM: AN AMERICAN SUCCESS STORY
U.S. Retirement Resource Pyramid
Employer-sponsored retirement plans (DB and DC plans)
Other assets
Social Security (and Supplemental Security Income)
Homeownership
IRAs (including rollovers)
Source: Investment Company Institute; see Brady, Burham, and Holden, The Success of the U.S. Retirement System (December 2012)

OUR STRONG RETIREMENT SYSTEM: AN AMERICAN SUCCESS STORY 5
1: Americans’ Retirement Well-‐Being Has Improved over Time
A number of broad measures of retiree well-being indicate that the U.S. retirement system has successfully provided resources for American workers during retirement, and that successive generations of retirees have been better off than previous generations. These measures include rising levels of assets earmarked for retirement; measures of retirees’ wealth, income, and consumption; and studies of workers’ savings for retirement. Other research has examined the retirement preparedness of today’s workers and found evidence of success.
Assets specifically earmarked for retirement have increased significantly. As of June 2013,
Americans had accumulated $20.9 trillion in assets specifically earmarked for retirement, not including the value of Social Security benefits.2 Retirement assets have grown significantly faster than inflation or the number of households since 1975, when the Employee Retirement Income Security Act (ERISA) took effect. In 1975, average retirement assets per U.S. household were $27,300 in constant (inflation-adjusted) 2012 dollars.3 By June 2013, they stood at $167,800 (in 2012 dollars)—more than six times higher than in 1975 (see figure below).4
More retirees receive income from private-sector retirement plans, and the amount of income has risen. Data from the United States Census Bureau’s yearly Current Population Survey show that in 1975, 21% of retirees (former employees and their spouses) were receiving income from retirement plans sponsored by a private-sector employer. Among retirees with private-sector retirement plan income, the median annual income per person in 1975, in 2012 dollars, was about $4,800.5 In 2012, by contrast, 32% of retirees were receiving income from private-sector retirement plans, and the median annual income per person was about $6,300.6
Social Security forms a strong foundation for a “pyramid” of retirement resources. Social
Security provides retirement income for almost all working Americans, with higher replacement rates for lower-earning households (replacing 70% of lifetime earnings for the lowest-income quintile and 47% in the second quintile).7
Most near-retirement households have resources from employer-sponsored retirement plans.
In 2010, 81% of households headed by a worker aged 55 to 64 had accrued DB plan benefits, DC assets, or IRA assets, from either private-sector or government employment-based plans,
2 Investment Company Institute, “The U.S. Retirement Market, Second Quarter 2013” (September 2013), www.ici.org/info/ret_13_q2_data.xls. Retirement assets include individual retirement accounts (IRAs), DC plans, public and private-sector DB plans, the federal Thrift Savings Plan, and annuity reserves. The total does not include Social Security benefits, home equity, or other financial assets not specifically earmarked for retirement. 3 Peter Brady, Kimberly Burham, and Sarah Holden, The Success of the U.S. Retirement System, Washington, DC, Investment Company Institute, December 2012, Figure 4, p. 11, www.ici.org/pdf/ppr_12_success_retirement.pdf. 4 Update of calculations in Peter Brady, Kimberly Burham, and Sarah Holden, The Success of the U.S. Retirement System, Washington, DC, Investment Company Institute, December 2012, Figure 4, p. 11. 5 Peter Brady and Michael Bogdan, “A Look at Private-Sector Retirement Plan Income After ERISA, 2012,” ICI Research Perspective, vol. 19, no. 8, October 2013, Figure 7, p. 13, www.ici.org/pdf/per19-08.pdf. 6 Ibid. 7 Congressional Budget Office, The Long-Term Projections for Social Security: Additional Information (October 2012), Exhibit 10, p. 16, www.cbo.gov/publication/43648.

6 OU
OUR STRONG RETIREMENT SYSTEM: AN AMERICAN SUCCESS STORY
according to data from the Federal Reserve Board’s Survey of Consumer Finances.8 This figure has been consistently high since 1989, suggesting that the transition from DB to DC plans has not reduced the share of near-retirees with employment-based retirement resources.
Studies indicate that American workers are reaching appropriate savings goals. Another way to look at whether or not Americans have saved adequately is to measure to what extent they are “saving optimally.”9 A study published in 2006 looked at measures of retirement well-being of 6,322 households obtained from interviews of retirees born between 1931 and 1941 by the Health and Retirement Study (HRS). Comparing household net worth with the amount each household needed to save over a life cycle to preserve its living standard and consumption in retirement, the authors found that about 80% of households in the HRS sample had accumulated as much as or more wealth than their optimal targets.10 A follow-up study in 2008 looked at
8 Peter Brady, Kimberly Burham, and Sarah Holden, The Success of the U.S. Retirement System, Washington, DC, Investment Company Institute, December 2012, Figure 13, p. 29, www.ici.org/pdf/ppr_12_success_retirement.pdf. 9 John Karl Scholz, Ananth Seshadri, and Surachai Khitatrakun, “Are Americans Saving ‘Optimally’ for Retirement?” NBER Working Paper, No. 10260, National Bureau of Economic Research, February 2004; Also published in Journal of Political Economy 114 (August 2006): 607-643. 10 Ibid.
0
20,000
40,000
60,000
80,000
100,000
120,000
140,000
160,000
180,000
1975 1985 1995 2005 2013 (June)
27,300
56,200
105,400
150,300 167,800
Average reNrement assets per U.S. household, constant 2012 dollars, rounded to nearest $100, end-‐of-‐period, selected dates
Chart updated and reprinted with permission from Investment Company Institute (ICI): The Success of the U.S. Retirement System, December 2012, Page 11, Fig. 4 Note: “Retirement assets” include annuities, federal pension plans, state and local government pension plans, private defined benefit plans, defined contribution plans, and IRAs. Sources: Investment Company Institute; U.S. Federal Reserve Board; National Association of Government Defined Contribution Administrators; American Council of Life Insurers; Internal Revenue Service, Statistics of Income Division; U.S. Department of Commerce, U.S. Census Bureau; U.S. Department of Labor, Bureau of Labor Statistics; and U.S. Department of Labor, Employee Benefits Security Administration

OUR STRONG RETIREMENT SYSTEM: AN AMERICAN SUCCESS STORY 7
earlier and subsequent birth cohorts, including early Baby Boomers, and found that “Americans are, by in large [sic], preparing sensibly for retirement.”11
The accumulation of retirement assets has improved over time. A University of Wisconsin
study12 looked at two comprehensive sets of retirement asset and income data13 to compare the wealth accumulated by people who had just received their first Social Security benefit in the 1980s with another set of new retirees in the 1990s. Including the value of Social Security benefits, a married couple in the 1980s cohort of new retirees had, on average, sufficient wealth to produce a steady annual income of about $34,000 (in 2012 dollars).14 In the 1990s cohort, the average married couple’s wealth could produce a steady income stream of about $53,00015 (in 2012 dollars)—a 55% real increase.16
Workers generally maintain their standard of living when they retire. Analysis of data from
the Internal Revenue Service’s Statistics of Income Division shows that income from wages, Social Security benefits, employer-sponsored retirement plans, and IRAs, net of taxes and adjusted for inflation, on average remains fairly stable in the year individuals first claim Social Security benefits and for three years thereafter. For three-quarters of these individuals, income in the year in which they retired equaled 87% or more of their income in the prior year.17
The independent academic studies cited above demonstrate that the U.S. retirement system
has improved over time.
11 John Karl Scholz and Ananth Seshadri, “Are All Americans Saving ‘Optimally’ for Retirement?” University of Michigan Retirement Research Center, Working Paper WP 2008-189 (2008), www.mrrc.isr.umich.edu/publications/papers/pdf/wp189.pdf. 12 Robert Haveman, Karen Holden, Barbara Wolfe, and Andrei Romanov, “The Sufficiency of Retirement Savings: A Comparison of Two Cohorts of Retired Workers at the Time of Retirement,” Robert M. La Follette School of Public Affairs at the University of Wisconsin at Madison, Working Paper, No. 2006-019 (2006). 13 The earlier set of data comes from the New Beneficiary Survey that linked Social Security records with comprehensive data on pensions and wealth for a cohort that first received Social Security benefits in 1980 and 1981. The later set of data is from the HRS at the University of Michigan and for individuals who retired in the mid-1990s. 14 Haveman et al. (2006), Table 2, p. 36. Net annuitized values updated to 2012 constant dollars by American Benefits Council. 15 Ibid. 16 Net annuitized wealth increased by $12,022 in constant 1994 dollars to $34,036 for the 1990s cohort, which is a 55% increase over the $22,014 value calculated for the 1980s cohort. 17 Peter Brady and Kevin Pierce, “Using Panel Tax Data to Examine the Transition to Retirement,” presented at the National Bureau of Economic Research, November 2011. “Employment-related income” includes wages, Social Security benefits, distributions from pension plans, and IRAs.

8 OU
OUR STRONG RETIREMENT SYSTEM: AN AMERICAN SUCCESS STORY
2: Access to and Participation in Retirement Plans Are Both Strong
U.S. employer-sponsored retirement plans offer more than 84 million American workers and their families the opportunity to accumulate savings and improve their retirement security.18 These plans build upon the foundation of Social Security, which in 2010 had 157 million participating American workers.19
According to the U.S. Department of Labor’s Bureau of Labor Statistics, almost 80% of full-
time workers have access to employer-sponsored retirement plans, and more than 80% of workers with access to plans participate.20 When one includes all part-time and seasonal workers, 68% have access to employer-sponsored retirement plans, and 80% of workers with access participate.21
These data demonstrate the powerful reach of the employer-sponsored retirement plan
system. The challenge now is to build on this system so that workers have greater ability and encouragement to accumulate employment-based retirement resources beyond Social Security.
Access to and participation in private-sector plans vary by the size of the company. At larger
companies with 500 workers or more, 89% have access to employer-sponsored retirement plans; of those, an impressive 90% participate.22 At companies with fewer than 100 workers, half of all workers have access to plans; 72% of those offered a plan participate.23
As these data show, part-time, temporary and seasonal workers and those at small businesses
are somewhat less likely to have access to a retirement plan at work. That does not mean these workers are not accruing retirement resources to supplement their Social Security benefits. Many of these workers have had access to a retirement savings plan at prior employers, have a spouse accruing retirement benefits at work, will accumulate retirement resources in the future, or can save in a tax-advantaged IRA.
18 Bureau of Labor Statistics, Employee Benefits in the United States—March 2013, Press Release, July 17, 2013, www.bls.gov/news.release/pdf/ebs2.pdf. Note: In the civilian workforce 78% of full-time workers have access with a take-up rate of 83%. The civilian data, with both private-sector and state and local government workers, reflect those who benefit under the current tax system with existing tax incentives. 19 Social Security Administration, Earnings and Employment Data for Workers Covered Under Social Security and Medicare, by State and County, 2010, Table 1, p. 3, www.ssa.gov/policy/docs/statcomps/eedata_sc/2010/table01.html. 20 Bureau of Labor Statistics, Employee Benefits in the United States—March 2013, Press Release, July 17, 2013, www.bls.gov/news.release/pdf/ebs2.pdf, Table 1, p. 6. 21 Ibid. 22 Ibid, p. 7. 23 Ibid.

OUR STRONG RETIREMENT SYSTEM: AN AMERICAN SUCCESS STORY 9
3: Defined Contribution Plans Can Produce Meaningful Retirement Benefits
The 401(k) was introduced in the early 1980s. None of today’s retirees or near-retirees has spent a full 40- to 45-year career in the 401(k) era. Even a worker who first participated at the beginning of his or her working life in the earliest 401(k) plans is still more than a decade away from retirement—and has not enjoyed the full benefits of the many innovations and improvements reflected in today’s 401(k) plans.
Nonetheless, critiques of 401(k) plans and the DC system frequently focus on measures of
the average or median account balances of today’s workers or for a wide array of households. Missteps commonly made in evaluating 401(k) and DC plan accumulations include:
• The analyses often highlight average or median account balances for all workers,
without considering workers’ income, job tenure, or age. • These analyses usually report on account balances in a worker’s current plan. Thus,
they do not include DB accruals or retirement assets accumulated in DC plans at prior jobs or assets in IRAs. Nor do they look at other resources a household might have—for example, a spouse’s or partner’s DC balances, DB plans, or IRAs.
• These analyses do not consider that individuals’ savings goals vary over a lifecycle. Younger workers typically focus on savings for education, for buying and furnishing a home, and for childrearing rather than in ways specifically earmarked for retirement. Measures of retirement preparedness that do not separate 30-year-olds from 55-year-olds are inherently misleading.
• These analyses judge the retirement account balances while failing to recognize that 401(k) plans are a component of people’s retirement resources.
Analyzing data on accumulated balances cannot yet reflect the full potential benefit that can
be produced in the 401(k) system. Studies have, in fact, attempted to address these data shortcomings and better assess how
well the 401(k) plan is doing in achieving retirement security. One approach is to look at 401(k) balances for long-tenured workers close to retirement. At year-end 2011, the average balance for participants in their 60s with at least 30 years of tenure with the same employer was $208,892, according to an analysis of 401(k) plans by the Employee Benefit Research Institute (EBRI) and the Investment Company Institute (ICI).24 This compared to an overall average for all 401(k) participants of $58,991.25
24 Sarah Holden, Jack VanDerhei, Luis Alonso, and Steven Bass, “401(k) Plan Asset Allocation, Account Balances, and Loan Activity in 2011,” ICI Research Perspective, Vol. 18, no. 9, and EBRI Issue Brief, no. 380 (December 2012), www.ici.org/pdf/per18-09.pdf. 25 Ibid.

10 OUR STRONG RETIREMENT SYSTEM: AN AMERICAN SUCCESS STORY
Other studies attempt to aggregate workers’ assets held in multiple accounts. For example, Fidelity Investments®26 analyzed balances of nearly 1 million investors who have both a workplace savings plan, such as a 401(k) or 403(b), and an IRA at Fidelity. For investors of all ages in this sample, the average combined balance was $225,600 at the end of 2012.27 Average combined balances rose by age group from $32,317 for those aged 25 to 29 to $447,751 for those aged 70 to 75 (see figure below).
26 Fidelity® Retirement Savings Analysis Highlights Higher Balances and Contribution Rates of Investors Saving Beyond Workplace Savings Plans, Press Release, February 28, 2013, www.fidelity.com/inside-fidelity/employer-services/fidelity-analysis-highlights-balances-and-contribution-rates-of-combined-retirement-savings. 27 This analysis was based on the population of 999,000 individuals who had both IRA and 401(k) (or 403(b)) balances at Fidelity as of 12/31/2012. These individuals consist of those actively employed as well as those terminated from their 401(k)/403(b) plan sponsor. Only a subset of these individuals made contributions into their IRAs and/or 401(k)/403(b) plans in 2012. Excluded are individuals in Fidelity’s own employee plans, as well as those in the advisor-sold channel. Additionally, many workplace plan participants presumably have IRAs that are not serviced by Fidelity, and these balances are not reflected in this analysis.
$0 $50,000 $100,000 $150,000 $200,000 $250,000 $300,000 $350,000 $400,000 $450,000
25-29
30-34
35-39
40-44
45-49
50-54
55-59
60-64
65-69
70-75
$32,317
$60,663
$103,124
$144,975
$194,592
$259,637
$328,527
$357,196
$397,358
$447,751
Average combined balances of investors using both a Fidelity workplace savings plan and an IRA, by age group, U.S. dollars
Chart reprinted with permission from Fidelity Investments: Infocgraphic accompanying news release, “Fidelity® Retirement Savings Analysis Highlights Higher Balances and Contribution Rates of Investors Saving Beyond Workplace Savings Plans,” February 28, 2013 Note: This analysis was based on the population of 999,000 individuals who had both IRA and 401(k) (or 403(b)) balances at Fidelity as of 12/31/2012. These individuals consist of those actively employed as well as those terminated from their 401(k)/403(b) plan sponsor. Only a subset of these individuals made contributions into their IRAs and/or 401(k)/403(b) plan in 2012. Excluded are individuals in Fidelity’s own employee plans, as well as those in the advisor-sold channel. Additionally, many workplace plan participants presumably have IRAs that are not serviced by Fidelity, and these balances are not reflected in this analysis. Source: Fidelity Investments®
OUR STRONG RETIREMENT SYSTEM: AN AMERICAN SUCCESS STORY 11
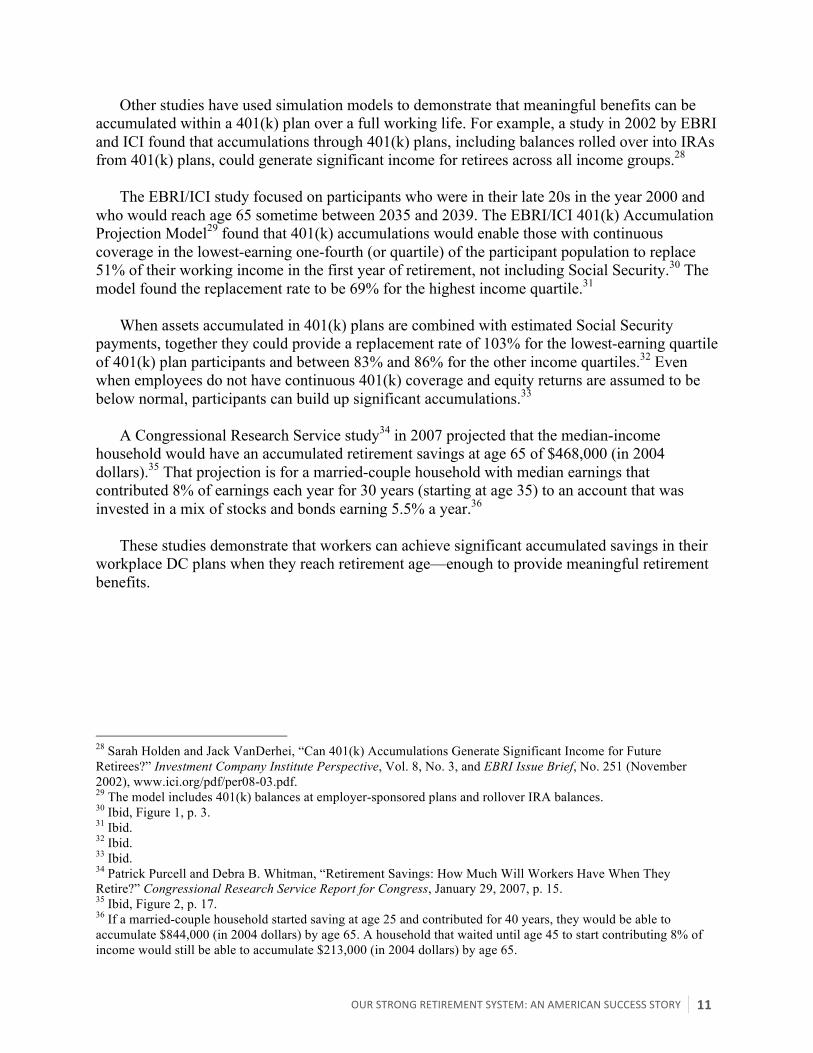
Other studies have used simulation models to demonstrate that meaningful benefits can be accumulated within a 401(k) plan over a full working life. For example, a study in 2002 by EBRI and ICI found that accumulations through 401(k) plans, including balances rolled over into IRAs from 401(k) plans, could generate significant income for retirees across all income groups.28
The EBRI/ICI study focused on participants who were in their late 20s in the year 2000 and
who would reach age 65 sometime between 2035 and 2039. The EBRI/ICI 401(k) Accumulation Projection Model29 found that 401(k) accumulations would enable those with continuous coverage in the lowest-earning one-fourth (or quartile) of the participant population to replace 51% of their working income in the first year of retirement, not including Social Security.30 The model found the replacement rate to be 69% for the highest income quartile.31
When assets accumulated in 401(k) plans are combined with estimated Social Security
payments, together they could provide a replacement rate of 103% for the lowest-earning quartile of 401(k) plan participants and between 83% and 86% for the other income quartiles.32 Even when employees do not have continuous 401(k) coverage and equity returns are assumed to be below normal, participants can build up significant accumulations.33
A Congressional Research Service study34 in 2007 projected that the median-income
household would have an accumulated retirement savings at age 65 of $468,000 (in 2004 dollars).35 That projection is for a married-couple household with median earnings that contributed 8% of earnings each year for 30 years (starting at age 35) to an account that was invested in a mix of stocks and bonds earning 5.5% a year.36
These studies demonstrate that workers can achieve significant accumulated savings in their
workplace DC plans when they reach retirement age—enough to provide meaningful retirement benefits.
28 Sarah Holden and Jack VanDerhei, “Can 401(k) Accumulations Generate Significant Income for Future Retirees?” Investment Company Institute Perspective, Vol. 8, No. 3, and EBRI Issue Brief, No. 251 (November 2002), www.ici.org/pdf/per08-03.pdf. 29 The model includes 401(k) balances at employer-sponsored plans and rollover IRA balances. 30 Ibid, Figure 1, p. 3. 31 Ibid. 32 Ibid. 33 Ibid. 34 Patrick Purcell and Debra B. Whitman, “Retirement Savings: How Much Will Workers Have When They Retire?” Congressional Research Service Report for Congress, January 29, 2007, p. 15. 35 Ibid, Figure 2, p. 17. 36 If a married-couple household started saving at age 25 and contributed for 40 years, they would be able to accumulate $844,000 (in 2004 dollars) by age 65. A household that waited until age 45 to start contributing 8% of income would still be able to accumulate $213,000 (in 2004 dollars) by age 65.

12 OUR STRONG RETIREMENT SYSTEM: AN AMERICAN SUCCESS STORY
4: The 401(k) Is a Good Fit for America’s Mobile Workforce
The dynamism of the economy in the United States naturally means that Americans may experience significant job changes over their working lives, as the employer landscape changes over time. New businesses, especially small businesses, often as start-ups, offer most of the net new jobs in the economy.
One vital element of a dynamic economy is a highly active and mobile workforce. The
Bureau of Labor Statistics in 2012 found in its National Longitudinal Survey that younger baby boomers held an average of 11 jobs between the ages of 18 and 46 (see figure below).37
37 Bureau of Labor Statistics, “Number of Jobs, Labor Market Experience, and Earnings Growth: Results from a National Longitudinal Survey,” News Release, July 25, 2012, www.bls.gov/news.release/nlsoy.htm.
0
2
4
6
8
10
12
Total Ages 18 to 24 Ages 25 to 29 Ages 30 to 34 Ages 35 to 39 Ages 40 to 46
11.3
5.5
3.0 2.4
2.1 2.1
11.5
5.7
3.1 2.6
2.1 2.1
11.1
5.3
2.8 2.3 2.0 2.1
Total Men Women
Average number of jobs held by individuals born 1957–1964 from age 18–46, in 1976–2010
Note: This table excludes individuals who turned age 18 before January 1, 1978, or who had not yet turned age 47 when interviewed in 2010–11. The National Longitudinal Survey of Youth 1979 consists of men and women who were born in the years 1957–64 and were ages 14 to 22 when first interviewed in 1979. These individuals were ages 45 to 53 in 2010–11. Source: Bureau of Labor Statistics, “Number of Jobs, Labor Market Experience, and Earnings Growth: Results from a National Longitudinal Survey,” News Release, July 25, 2012, Table 1

OUR STRONG RETIREMENT SYSTEM: AN AMERICAN SUCCESS STORY 13
The mobility of the workforce and the dynamic nature of job creation and loss puts a premium on retirement benefits that are portable; that is, benefits that can travel with a worker throughout his or her career. When employees accumulate savings in workplace retirement plans like the 401(k), those assets grow with them when they change jobs. Under current tax law, an employee can (1) leave assets in the old 401(k) plan, (2) roll those assets into an IRA without a tax penalty or, where permitted, (3) roll them over into a 401(k) sponsored by the new employer. In this way, the accumulation of retirement assets can continue even as employees change jobs—no matter how often they change jobs.
Furthermore, small businesses, when they are ready and able to do so, can adopt retirement
plans that suit their workforce. Once a plan is established, the employer can expand and improve it over time, as the company can afford to do so. The range of plan types available to small businesses gives them a range of choices to meet their needs.

14 OUR STRONG RETIREMENT SYSTEM: AN AMERICAN SUCCESS STORY
5: Americans Report High Levels of Confidence in the 401(k) System
Americans have a very favorable view of the employer-sponsored 401(k) and other DC plans. Such confidence is a powerful indicator of the value American workers and retirees place on the 401(k) system.
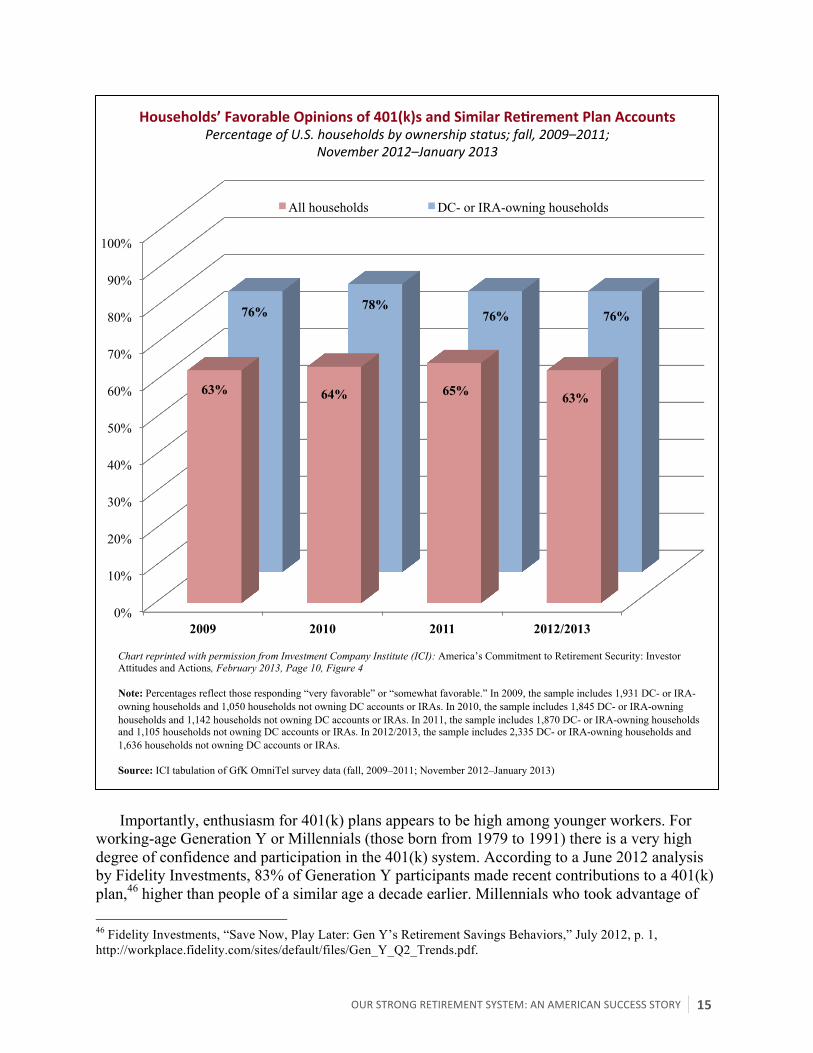
In a survey of 4,000 households conducted for ICI in the winter of 2012/2013, 63% of
respondents said that they have a “very” or “somewhat” favorable impression of 401(k) and similar retirement accounts (see figure below).38 That support rose to 76% among households that held a DC plan account or an IRA.39 Americans have expressed similarly positive views in surveys conducted since late 2008, despite the stock market decline from late 2007 to early 2009.
A number of factors shape households’ views of individual account plans. “The ability of
retirement plan accounts to accumulate significant savings” was selected as a factor that shaped their favorable opinion by 97% of households with DC plan accounts or IRAs who expressed their opinions.40 The performance of retirement plan account investments over time was similarly important, with 96% of DC- or IRA-owning households citing this factor as shaping their views.41
The ICI survey also asked households with DC plan accounts to evaluate several features of
such plans. In the 2012/2013 survey, 96% of DC account-owning households agreed that having investment choice and control over investment was an important plan feature.42 In addition, 90% of respondents reported that because their employer provides them with the ability to save through a retirement account plan, it “helps me think about the long term, not just my current needs.”43 Also, 89% said that payroll deduction “makes it easier for me to save.”44 The tax-deferred treatment of contributions was identified by 84% of households owning a DC plan as “a big incentive to contribute.” More than half of households with DC plan accounts—51%—said they probably would not save for retirement if they did not have a retirement plan at work.45
38 In the survey, nearly all respondents answered the opinion question, with 31% of U.S. households reporting that they had no opinion of DC plan accounts. Among households expressing an opinion, 91% had very or somewhat favorable opinions of DC plan accounts. See Sarah Holden and Steven Bass, Investment Company Institute, America’s Commitment to Retirement Security: Investor Attitudes and Actions, 2013, February 2013, Figure 4, p. 10, www.ici.org/pdf/ppr_13_retir_sec_update.pdf. 39 Ibid, Figure 4, p. 10. Among DC- or IRA-owning households that expressed an opinion, 95% reported favorable views. 40 Ibid, Figure 5, p.11. 41 Ibid. 42 Ibid, Figure 6, p. 12. 43 Ibid. 44 Ibid. 45 Ibid. Similarly, a Fidelity Investments® survey found that 55% of participants currently saving through a workplace plan would not be saving for retirement if they were not able to do so at work through their 401(k) plan. See Fidelity Investments®, “Fidelity® Survey Finds Majority of Workplace Investors Would Not Be Saving for Retirement Without a 401(k) Plan,” July 14, 2011, http://businesswire.com/news/home/20110714005888/en/Fidelity®-Survey-Finds-Majority-Workplace-Investors-Saving.
OUR STRONG RETIREMENT SYSTEM: AN AMERICAN SUCCESS STORY 15
Importantly, enthusiasm for 401(k) plans appears to be high among younger workers. For working-age Generation Y or Millennials (those born from 1979 to 1991) there is a very high degree of confidence and participation in the 401(k) system. According to a June 2012 analysis by Fidelity Investments, 83% of Generation Y participants made recent contributions to a 401(k) plan,46 higher than people of a similar age a decade earlier. Millennials who took advantage of 46 Fidelity Investments, “Save Now, Play Later: Gen Y’s Retirement Savings Behaviors,” July 2012, p. 1, http://workplace.fidelity.com/sites/default/files/Gen_Y_Q2_Trends.pdf.
0%
10%
20%
30%
40%
50%
60%
70%
80%
90%
100%
2009 2010 2011 2012/2013
63% 64% 65% 63%
76% 78% 76% 76%
All households DC- or IRA-owning households
Households’ Favorable Opinions of 401(k)s and Similar ReNrement Plan Accounts Percentage of U.S. households by ownership status; fall, 2009–2011;
November 2012–January 2013
Chart reprinted with permission from Investment Company Institute (ICI): America’s Commitment to Retirement Security: Investor Attitudes and Actions, February 2013, Page 10, Figure 4 Note: Percentages reflect those responding “very favorable” or “somewhat favorable.” In 2009, the sample includes 1,931 DC- or IRA-owning households and 1,050 households not owning DC accounts or IRAs. In 2010, the sample includes 1,845 DC- or IRA-owning households and 1,142 households not owning DC accounts or IRAs. In 2011, the sample includes 1,870 DC- or IRA-owning households and 1,105 households not owning DC accounts or IRAs. In 2012/2013, the sample includes 2,335 DC- or IRA-owning households and 1,636 households not owning DC accounts or IRAs. Source: ICI tabulation of GfK OmniTel survey data (fall, 2009–2011; November 2012–January 2013)

16 OUR STRONG RETIREMENT SYSTEM: AN AMERICAN SUCCESS STORY
guidance have also increased their average deferral rate from 4.5% to 8.7% of salary or wages over the past decade.47
These favorable attitudes are reflected in workers’ behavior throughout the recent recession
and a weak recovery. Participants’ contribution activity, for example, has continued to be robust. A 2012 survey, conducted by the American Benefits Institute and WorldatWork, reported that the percentage of employees who elected to contribute the maximum allowable employee contribution under their 401(k) plan in 2012 was consistent with data from a similar survey four years earlier, conducted prior to the financial crisis.48
Surveys of plan record keepers by ICI found that only 3.7% of DC plan participants stopped
regular contributions from wages and salary in 2008, and only 3.4% stopped contributing in 2009.49 Fewer than 4% of participants took withdrawals from their accounts in each of those years and participants also generally stayed the course on their asset allocations.50 Although loan activity edged up in the wake of the financial market crisis, fewer than one-in-five 401(k) participants had a loan outstanding.51
As owners of the retirement assets accumulated in a plan, employees have choices about how
they will take their benefit in retirement. A 2007 survey of recent retirees by ICI found that DC plan participants made decisions about distributions that preserved their benefits for future retirement income.52 For example, only 3% of the accumulated DC plan account assets were cashed out and spent in their entirety; these were most commonly small balances.53 Almost one third (31%) of accumulated DC plan assets were taken as annuities and 47% were taken as lump sums that were rolled over into other investments.54 Of the remainder of all the assets, 19% were left in the plan (deferred distribution).55
While avoiding loans and hardship withdrawals is usually seen to provide employees with
better future retirement security, the availability of such features also has a positive effect. Data suggest that the accessibility of savings through the availability of plan loans is directly related to greater participation and higher plan contributions. A report by the Government Accountability
47 Ibid, p. 2. 48 American Benefits Institute and WorldatWork, 2013 Trends in 401(k) Plans and Retirement Rewards, March 13, 2013; American Benefits Council and WorldatWork, Trends in 401(k) Plans, March 17, 2009, www.americanbenefitscouncil.org/documents2013/abc-waw-surveytrendsin401kplans-2013.pdf and www.americanbenefitscouncil.org/documents/abc-waw-surveytrendsin401kplans.pdf. 49 Sarah Holden and Daniel Schrass, “Defined Contribution Plan Participants’ Activities, 2012,” ICI Research Report (April 2013), Figure 3, p. 4, www.ici.org/pdf/ppr_13_rec_survey_q4.pdf. 50 Ibid. 51 Ibid and see Holden et al. (2012), Figure 46, p. 50. 52 John Sabelhaus, Michael Bogdan, and Sarah Holden, Defined Contribution Plan Distribution Choices at Retirement: A Survey of Employees Retiring Between 2002 and 2007, Investment Company Institute (Fall 2008), www.ici.org/pdf/rpt_08_dcdd.pdf. Specifically, 52% received distribution as lump sum; comprised of 34% receiving the lump sum and reinvesting all of it; 11% taking a lump sum and spending some, reinvesting some; 7% taking a lump sum, and spending all of it. Additionally, 9% of respondents used multiple dispositions; 6% took installment payments, 18% annuitized entire balance and 16% deferred distribution of entire balance (Figure S.1, p. 7). 53 Ibid, Figure S.2, p. 8. 54 Ibid. 55 Ibid.

OUR STRONG RETIREMENT SYSTEM: AN AMERICAN SUCCESS STORY 17
Office found, based on the 1992 Survey of Consumer Finances, that workers significantly increased their contribution rate when their plans offered a loan option.56 Similarly, a joint EBRI/ICI study found that the availability of a plan loan increased contribution rates compared to participants without such an option.57
Opinion surveys clearly demonstrate that Americans have highly favorable views of the
401(k) plan and other DC plans. They like the features of such plans, such as payroll deduction at work and a selection of choices for investing their accumulated funds in the plan. Studies of participant contribution and asset allocation behavior demonstrate confidence in such plans, especially by continuing to contribute through difficult times and maintaining allocations to equities. Confidence in such plans is particularly high among younger workers, who, like their elders, can see the benefit of choice and control over assets in the plan and appreciate that when they retire, they will have control over decisions about how the accumulated assets will be distributed as a benefit.
Given the enormous popularity of 401(k) plans among employees, great care should be taken
that we do not disrupt or destabilize the current voluntary employer-sponsored system, whether in pursuit of coverage expansions or tax reform and deficit reduction.
56 U.S. General Accounting Office (Now Government Accountability Office), 401(k) Pension Plans, October 1, 1997, www.gao.gov/assets/230/224713.pdf. 57 Sarah Holden and Jack VanDerhei, “Contribution Behavior of 401(k) Participants,” Investment Company Institute Perspective, Vol. 7, No. 4, and EBRI Issue Brief, No. 238 (October 2001), p. 10, www.ici.org/pdf/per07-04.pdf. See also references in end notes 39 and 70 in Sarah Holden, Peter Brady, and Michael Hadley, “401(k) Plans: A 25-Year Retrospective,” Investment Company Institute Research Perspective, Vol. 12, No. 2 (November 2006), www.ici.org/pdf/per12-02.pdf.
18 OUR STRONG RETIREMENT SYSTEM: AN AMERICAN SUCCESS STORY
6: Retirement Plan Contributions Are Tax-‐Deferred—Not Tax-‐Free
Typically, contributions to retirement plans are tax deferred.58 That is, no tax is paid on compensation contributed to a qualified plan until the funds are paid out to the plan participant. In policy discussions, tax deferrals are often lumped together with tax exclusions (such as the exclusion from income of employer-provided health insurance) and tax deductions (such as the deduction from income of mortgage interest expense).
But a deferral of tax is neither a tax deduction nor a tax exclusion.59 Exclusions and
deductions reduce taxes paid in the year taken, but do not affect taxes in any future year. Like deductions or exclusions, tax deferrals reduce taxes paid in the year of deferral. However, unlike a tax deduction, tax deferral in retirement plans increases taxes paid when the income is recognized through distribution or withdrawal. Taxes are paid on both the original deferred compensation and the investment earnings on those deferrals. This distinction is important because the tax benefit of deferral is often mischaracterized and misunderstood. The benefit of tax deferral is the combined effect of tax savings at the time of contribution and tax savings on investment returns, reduced by the tax paid on distributions.
Deferral Removes the Bias against Savings Inherent in an Income Tax
The income tax provides incentives for current consumption and discourages savings. In the absence of an income tax, the rate of return earned on savings represents the trade-off between consuming today and consuming tomorrow (i.e., saving). By reducing the after-tax rate of return on savings, the income tax reduces the incentive to save. And, because of the progressive tax rate schedule, the income tax has a larger impact on the after-tax rate of return earned by higher-income taxpayers. By effectively taxing investment returns at a zero rate, tax deferral removes the bias against savings that is inherent in an income tax.
Deferral Encourages Voluntary Provision of Employer Retirement Plans Tax deferral is key to the success of the U.S. employer-sponsored retirement system. It
provides the incentive for firms to voluntarily offer retirement benefits to their workers. Because employers compete with one another to hire workers, they create compensation packages that will help them attract and retain qualified workers. Employees who are focused on saving for retirement should value compensation packages that include retirement benefits more highly than compensation packages of equal cost but which consist entirely of cash compensation. Because employees value these benefits, U.S. private-sector employers voluntarily sponsor plans that provide significant benefits to American workers.
58 With Roth tax treatment (a Roth IRA or Roth contributions to a 401(k) plan), there is no tax deferral, as contributions are included in taxable compensation. Instead, no taxes are paid on qualified withdrawals from the account. 59 For a more detailed explanation of the benefits of tax deferral, see Peter Brady, The Tax Benefits and Revenue Costs of Tax Deferral, Investment Company Institute, Washington, DC (2012), www.ici.org/pdf/ppr_12_tax_benefits.pdf.

OUR STRONG RETIREMENT SYSTEM: AN AMERICAN SUCCESS STORY 19
Workers of all income levels receive tax benefits from deferral. The tax code limits the
ability of workers to defer compensation. In addition, each plan is subject to broad coverage requirements and nondiscrimination rules, which limit the amount of retirement benefits that a firm’s high-paid workers can receive based on the benefits received by the firm’s low-paid workers. Fully 65% of tax benefits for DC plans go to taxpayers with less than $100,000 of adjusted gross income and 79% go to employees with incomes below $150,000.60
The loss of employer plans would have a substantial impact on lower-paid workers. As noted
above, these workers receive substantial tax benefits from tax deferral. In addition, low- and moderate-income workers likely benefit as much or more from the non-tax features of employer-plans. For example, these workers may value more highly the convenience of payroll deduction, the economies of scale that reduce the cost of investing, and the professional investment management and financial education offered through employer plans.
Recent Proposals Are Flawed
Several current proposals would change the tax treatment of contributions to employer-provided DC plans and IRAs.61
One prominent proposal for income-tax reform is to change the current system of deductions
and exclusions to flat-rate refundable credits, with the credit rate typically set at 15%.62 Since its fiscal year 2011 Budget (released in February 2010), the Administration has
proposed a variant of the flat-rate credit proposal that would cap the benefit of itemized deductions at 28%. Taxpayers with marginal tax rates at or below the cap rate would not be affected. Taxpayers with marginal tax rates above 28% would pay an additional tax on deductions, with the rate set equal to the difference between a taxpayer’s marginal tax rate and 60 American Society of Pension Professionals and Actuaries, “Estimating the Distribution Benefits of the Tax Expenditure,” Letter to Bill Keller, Executive Editor, New York Times, from Stephen Dobrow, President of ASPPA, analysis based on Internal Revenue Service tax data, August 25, 2009, www.asppa.org/Document-Vault/pdfs/mediaroom/LTENYT082509.aspx. 61Lily L. Batchelder, Fred T. Goldberg, Jr. and Peter R. Orszag, “Efficiency and Tax Incentives: The Case for Refundable Tax Credits,” New York University Law and Economics Working Papers, Paper 77 (October 2006), http://lsr.nellco.org/nyu_lewp/77; William G. Gale, “Tax Reform Options: Promoting Retirement Security,” Testimony Submitted to the Senate Committee on Finance, September 15, 2011, www.finance.senate.gov/imo/media/doc/Testimony%20of%20William%20Gale.pdf ; Alan J. Auerbach and William G. Gale, “Tempting Fate: The Federal Budget Outlook,” Tax Notes 132(4), (2011), pp. 375–88; and William G. Gale, David C. John, and Spencer Smith, “New Ways to Promote Retirement Saving,” AARP Public Policy Institute Research Report, no. 2012-09 (October 2012), www.aarp.org/content/dam/aarp/research/public_policy_institute/econ_sec/2012/new-ways-promote-retirement-saving-AARP-pp-econ-sec.pdf. 62 Some proposals structure a retirement savings credit as a matching contribution to a retirement savings account. In these cases, an 18% credit rate is roughly equivalent to a normal tax credit of 15%. See discussion in William G. Gale, David C. John, and Spencer Smith, “New Ways to Promote Retirement Saving,” AARP Public Policy Institute Research Report, no. 2012-09 (October 2012), p. 15, www.aarp.org/content/dam/aarp/research/public_policy_institute/econ_sec/2012/new-ways-promote-retirement-saving-AARP-pp-econ-sec.pdf.

20 OUR STRONG RETIREMENT SYSTEM: AN AMERICAN SUCCESS STORY
28%. The Administration’s fiscal year 2013 Budget (released February 2012) expanded the proposal to encompass the exclusion from income of employee contributions to 401(k)-type plans and the deduction for contributions to an IRA.
The 28% cap proposal and the 15% credit proposal are attempts to make the tax code “more
fair” by ensuring that the tax benefits of deductions and exclusions provide similar benefits to taxpayers regardless of marginal tax rates. Under current law, for example, $100 of mortgage interest reduces taxes by $35 for an individual with a 35% marginal tax rate and by $10 for an individual with a 10% marginal tax rate.
As explained earlier, retirement plan contributions are tax deferred. It makes no sense to cap
the tax benefit of making a contribution, because that does not represent the tax benefit of tax deferral.
Under current law, if a taxpayer’s marginal tax rate is the same while saving and in
retirement, the tax paid in retirement is equal to the tax that was deferred, plus the earnings on the deferred amount. Under the proposal, the upfront value of the tax deferral is reduced by the amount of the cap tax, but the tax rate ultimately paid on income from the retirement account is not reduced. Thus, the taxpayer’s benefit from participating in tax-deferred retirement savings is sharply reduced. In fact, analysis by ICI shows that, depending on the length of time contributions remain invested, a worker could be better off simply paying tax on their compensation and investing the rest in a taxable account.
For example, using reasonable assumptions for the rate of return earned on investments, a
taxpayer in the 33% tax bracket (while working and in retirement) invested in bonds would fare better saving in a taxable account for any holding period less than four years.63 If that taxpayer were investing solely in stocks, the holding period needed to offset the impact of the cap would be nine years. Even if the holding period was long enough to offset the impact of the cap, tax benefits would be substantially reduced. For example, if the holding period was 20 years, tax benefits for a worker with a 33% marginal tax rate would be reduced by 22% if the worker’s account was invested in bonds, and by 48% if it was invested in stocks, relative to current law.64
63 Calculations assume no penalty for early withdrawal and use a risk-free rate of return of 6%. As of July 3, 2013, the yield on 10-year Treasuries was 2.52%. If current rates were used, the break-even holding period would be much longer. 64 To respond to criticism that the 28% cap proposal could make plan participants worse off than if they simply paid taxes on their compensation, the Administration’s fiscal year 2014 Budget, released in April 2013, included a new provision to prevent workers from being made worse off in a plan. Under the 2014 Budget proposal, individuals subject to the cap would be able to claim basis when they take withdrawals in retirement. To ensure that workers are not worse off, the basis credit is larger than the actual tax paid. For example, a worker subject to a 39.6% marginal tax rate who made a $1,000 contribution would pay a “cap tax” of $116, or 11.6% (the difference between 39.6% and the cap rate of 28%) of the contribution. Under the proposal, the worker would get a basis credit of $246. The rule would introduce enormous complexity and recordkeeping burdens for millions of taxpayers, requiring them to track and document their basis from the time of contribution to the time all funds in the account are distributed. Further, the new rule would simply ensure that workers are not made worse off. The proposal would still substantially reduce the tax benefits of deferral. For example, a worker with a 33% marginal tax rate and a 20-year holding period would have the tax benefits of deferral reduced by 15% if invested in bonds and by 32% if invested in stocks. This complicated “solution” highlights the underlying problem with the 28% cap proposal: tax deferrals are neither exclusions nor deductions and should not be subject to the 28% cap.

OUR STRONG RETIREMENT SYSTEM: AN AMERICAN SUCCESS STORY 21
Another prominent proposal is to limit total DC plan contributions (the sum of employer and employee contributions) to the lesser of $20,000 or 20% of compensation (the 20/20 proposal).65 A $20,000 contribution limit in 2013 would be less in nominal dollars—without allowing for inflation—than the 1975 limit of $25,000 established by ERISA. In inflation-adjusted dollars, a $20,000 limit would be less than 18% of the 1975 limit. There is no justification for reducing the current limit, which is already low by historical standards.
Studies and surveys have found that the impact of some of the proposed changes in tax
treatment of retirement plans could be quite harmful to the retirement security of employees, as well as to the retirement system itself.
A 2012 survey of 516 employers (466 offering DC plans) by Mathew Greenwald &
Associates, Inc., for the American Benefits Institute asked how DC plan sponsors might respond to the three prominent proposals discussed above.66 The survey found that each of the proposals could have a big negative effect on the willingness of employers to offer a DC plan (see figure below). A flat-rate tax credit of 25% would lead 46% of current plan sponsors to drop or consider dropping their DC plan.67 Applying the tax exclusion limitation (28% cap) to contributions would lead 35% of current plan sponsors to drop or consider dropping their DC plan and the 20/20 proposal would also potentially turn off 35% of current DC plan sponsors.68
Plan sponsors who said they would keep their plans predicted that they would cut back on
important plan provisions that could lead to lower coverage. For example, if lawmakers enacted a 25% tax credit proposal, 30% of employers in the survey said they would decrease or eliminate non-elective contributions, 29% would eliminate matching contributions, and 23% would reduce auto-enrollment, auto-escalation and safe harbor contributions.69 Similar negative impacts were seen for the 28% cap proposal and the 20/20 proposal.70
A 2012 study by EBRI found that modifications in the tax treatment of 401(k) contributions
would lead employers to reduce matching contributions or even terminate existing plans.71 The modifications included modeling a tax credit replacement for tax deductibility and the 20/20 proposal. The tax credit proposal, in particular, would lead plan participants to reduce contributions. Smaller employers are more likely to respond negatively, the study found. The result of the proposed changes in tax policy would reduce average participant balances at small
65 National Commission on Fiscal Responsibility and Reform (Simpson-Bowles Commission), “The Moment of Truth,” December 2010, www.fiscalcommission.gov/sites/fiscalcommission.gov/files/documents/TheMomentofTruth12_1_2010.pdf. 66 American Benefits Institute, “Attitudes of Employees Benefits Decision Makers Toward Retirement Plan Tax Proposals,” prepared by Mathew Greenwald & Associates, Inc., Washington, DC, December 10, 2012, www.americanbenefitscouncil.org/documents2012/retirement-tax_survey-greenwald121012.pdf. 67 Ibid, p. 8. 68 Ibid. 69 Ibid. 70 Ibid. 71 Jack VanDerhei, “Modifying the Federal Tax Treatment of 401(k) Plan Contributions: Projected Impact on Participant Account Balances,” EBRI Notes, vol. 33, no. 3, March 2012, www.ebri.org/pdf/notespdf/EBRI_Notes_03_Mar-12.Ktaxes-PThlthCvg1.pdf. Small plans are those with $10 million or less in assets.

22 OUR STRONG RETIREMENT SYSTEM: AN AMERICAN SUCCESS STORY
plans by 23% to 40% for workers aged 26 to 35.72 The average loss for all plans for the same young population segment would be 6% to 22%.73
Studies clearly show that changing the tax treatment of contributions to DC plans could
reduce retirement security, especially for today’s youngest workers—and all workers who follow them into the workforce.
These changes to the tax treatment of retirement plans are promoted for the additional federal
revenue they would garner. In fact, these changes would not actually create the anticipated revenue windfall. First, tax expenditure estimates for retirement plans vastly overstate the impact that eliminating tax deferral for new retirement plan contributions would have on federal government revenue over the next 10-years—the standard budget window used for revenue
72 Ibid, Figure 2, p. 7. 73 Ibid, Figure 1, p. 7.
0%
10%
20%
30%
40%
50%
60%
A 25% tax credit The 20/20 proposal Tax exclusion limitation
8% 9% 9%
38%
26% 26%
Would consider dropping the plan Would drop the plan
Likely employer responses to various tax proposals for modifying the income tax treatment of plan contribuNons
Chart reprinted with permission from American Benefits Institute: Attitudes of Employee Benefits Decision Makers Toward Retirement Plan Tax Proposals, December 2012, Pages 20, 30, 40 Note: The sample is 466 employers offering DC plans. Source: Online survey conducted by Mathew Greenwald & Associates, Inc., on behalf of the American Benefits Institute
46% total
35% total 35% total
OUR STRONG RETIREMENT SYSTEM: AN AMERICAN SUCCESS STORY 23
estimates used in budget “scoring.”74 Second, although any revenue estimate would be substantially less than tax expenditure estimates, the estimate would still overstate the true impact on federal tax revenue of eliminating deferral. That’s because a revenue estimate would measure the increase in tax revenue associated with taxing retirement plan contributions and investment income over 10 years, but would miss the taxes that would have been collected on the same contributions and investment income when retirement funds are withdrawn or benefits are paid out in retirement, which will typically be long past the 10-year budget window. Thus, if properly measured, the impact of eliminating retirement plan contributions on federal tax revenue would be a fraction of the impact suggested by oft-cited tax expenditure estimates. Americans Support Retirement Plan Tax Incentives
Americans overwhelmingly favor keeping the current tax incentives that promote saving for
retirement. A survey of households in 2012/2013, for example, found that 85% of U.S. households disagreed when asked whether the tax advantages of DC accounts should be eliminated.75 Similarly, 82% of U.S. households opposed any reduction in employee contribution limits to DC plans, and 79% opposed reducing employer contribution limits.76 Overall, 79% of U.S. households believe that tax incentives to encourage retirement saving should be a national priority.77 Support for this national priority is very high among both those who have DC plan accounts or IRAs (83%) and those who do not (72%).78
74 For an explanation of the difference between tax expenditure estimates and revenue estimates, see Appendix I of Peter Brady, The Tax Benefits and Revenue Costs of Tax Deferral, Investment Company Institute, Washington, DC (2012). 75 Holden and Bass, 2013, Figure 7, page 17. 76 Ibid. 77 Ibid, Figure 12, page 23. 78 Ibid.

24 OUR STRONG RETIREMENT SYSTEM: AN AMERICAN SUCCESS STORY
7: Retirement Assets Constitute a Major Share of U.S. Household Savings and Investments
The savings and investments held in the retirement system represent the largest component or share of American households’ total accumulated financial wealth. At the end of June 2013, total retirement assets of $20.9 trillion,79 as tabulated by ICI, represented 34% of $61.9 trillion in all household financial assets in the United States (see figure below).80
79 Investment Company Institute, “The U.S. Retirement Market, Second Quarter 2013,” September 2013, www.ici.org/info/ret_13_q2_data.xls. 80 Board of Governors of the Federal Reserve System, Financial Accounts of the United States: Flow of Funds, Balance Sheets, and Integrated Macroeconomic Accounts, Second Quarter 2013, September 25, 2013, www.federalreserve.gov/releases/z1/Current/z1r-5.pdf, Table B.100, Balance Sheet of Households and Nonprofit Organizations, p. 113, and Table L.100.a, p. 121. Note: The tally for households also includes assets held by nonprofit organizations; however, the share of the totals represented by nonprofits was about 6% in 2000 (latest data available), according to the Federal Reserve, and considered to be negligible to the total amounts.
Non-retirement assets: $41.0
(66%)
$5.3 (25%)
$5.7e
(27%)
$2.8 (13%)
$5.2 (25%) $1.8 (9%)
Retirement assets: $20.9 (34%)
Defined contribution plans
Individual Retirement Accounts
Private defined benefit plans
Government plans
Annuity reserves
Household financial assets: $61.9 trillion Total retirement assets: $20.9 trillion
Assets Earmarked for ReNrement Are a Significant Share of Households' Financial Assets
Trillions of U.S. dollars as of June 30, 2013
e = data are estimated Note: Household total financial assets also include assets held by nonprofit organizations; however, the share of the total represented by nonprofits was about 6% in 2000 (latest data available), according to the Federal Reserve, and is considered to be negligible to the total amounts in the figure. Components may not add to the total because of rounding. Social Security is not included. Sources: Investment Company Institute, “The U.S. Retirement Market, Second Quarter 2013,” (September 2013) and Board of Governors of the Federal Reserve System, “Financial Accounts of the United States: Flow of Funds, Balance Sheets, and Integrated Macroeconomic Accounts, Second Quarter 2013,” (September 25, 2013)

OUR STRONG RETIREMENT SYSTEM: AN AMERICAN SUCCESS STORY 25
Assets in the retirement system in the ICI analysis include the assets of private-sector DB plans, private-sector DC plans, assets in funded government (federal, state, and local) plans,81 Individual Retirement Arrangements (IRAs) of all types, and annuity reserves at insurance companies.
The heart of the privately held pool of retirement savings and investment is the $5.3 trillion
in assets held by participants in DC retirement plans, such as the 401(k) plan.82 Such plans provide individual accounts and ownership rights to employees. At retirement, their accumulated assets represent the sum of contributions into the plan by employees and their employers plus the earnings from investments over the years.
Another big component of the U.S. retirement system is the $5.7 trillion83 in savings in IRAs
of all types, a pool of funds that includes rollovers from 401(k) and similar DC plans, as well as from DB plans.84 Together DC plans and IRAs represent $11.1 trillion or 53% of the $20.9 trillion in the nation’s total retirement assets.85 The private sector’s share of total funded retirement assets additionally includes $2.8 trillion in assets in private-sector DB plans and $1.8 trillion in insurance company reserves for annuities beyond those held by retirement plans.86
The combination of accumulated savings and investments in retirement assets for employees
in both the private and public sector provides employees in the United States with a more secure retirement and represents a large share of all financial assets. These trillions of dollars in assets not only constitute retirement security for millions of future retirees, they also represent an important and immediate source of investment capital for American businesses.
81 This includes the federal Thrift Savings Plan, a DC plan, as well as state and local 457 deferred compensation plans. Investment Company Institute, “The U.S. Retirement Market, Second Quarter 2013,” September 2013, www.ici.org/info/ret_13_q2_data.xls. 82 Ibid, Tables 1 and 6. The $20.9 trillion figure refers to assets in all kinds of retirement accounts, not just DC plans. 83 Ibid, Table 1. 84 ICI tabulations of 2010 Survey of Consumer Finances data find that about half of traditional IRA assets resulted from rollovers. 85 Investment Company Institute, “The U.S. Retirement Market, Second Quarter 2013,” September 2013, www.ici.org/info/ret_13_q2_data.xls, Table 1. 86 Ibid.

26 OUR STRONG RETIREMENT SYSTEM: AN AMERICAN SUCCESS STORY
8: Innovation and Incentives Improve Retirement Security
Some researchers and journalists have argued that the shift from a DB world to a DC world in the private sector over the past 30 years has been harmful to Americans’ retirement security. The evidence suggests, however, that American households have continued to increase retirement income over that time.87
Even as DC plans grew to dominate among private-sector retirement plans, the share of
retirees who receive retirement income from private-sector plans rose by almost half from 1975 to 2012, from 21% to 32%.88 And the median benefit rose by about one-third, after adjusting for inflation—thanks to both reductions in the time required to vest in DB pensions and the growth of 401(k) plans.89
Automatic enrollment, in which new employees are automatically enrolled in the 401(k) plan
unless they actively opt-out, has dramatically expanded participation and harnessed the power of inertia to keep individuals in the plan. Another recent invention, auto-escalation, gradually increases the share of pay contributed each pay period until it reaches a desired goal.
An EBRI/ICI study90 has quantified just how helpful auto-enrollment and auto-escalation can
be in improving overall participation and total retirement savings. Using the EBRI/ICI 401(k) Accumulation Projection Model, the study’s authors calculated the gains in participation and retirement income that can result from these specific innovations in plan design.
The study found that automatic enrollment can dramatically increase participation rates from
66% to 92% for eligible workers91 and over time can raise the median replacement rate when workers retire. The authors modeled the effect of an automatic enrollment feature that defaults all eligible employees to 3% of compensation with all assets invested in a money market fund. In that instance, the median replacement rate—retirement income as a percentage of average annual income for the last five years of employment—for the lowest-income quartile would rise from 23% in a plan with voluntary enrollment to 37% in a plan with automatic enrollment (see figure below).92 The replacement rate also rises for the second income quartile (from 33% to 40%), and the third (from 43% to 45%).93
87 Peter Brady and Michael Bogdan, “A Look at Private-Sector Retirement Plan Income After ERISA, 2012,” ICI Research Perspective, Vol. 19, No. 8 (October 2013), Figure 7, p. 13, www.ici.org/pdf/per19-08.pdf. 88 Ibid. 89 Ibid. Note: the Current Population Survey (CPS) data, which were used to analyze retiree income, do not fully capture distributions from DC pension plans and IRAs, and thus likely underestimate the increase in retirement plan income since ERISA. 90 Sarah Holden and Jack VanDerhei, “The Influence of Automatic-Enrollment, Catch-Up, and IRA Contributions on 401(k) Accumulations at Retirement,” Investment Company Institute Perspective, Vol. 11, No. 2, and EBRI Issue Brief, No. 283, July 2005, www.ici.org/pdf/per11-02.pdf. 91 Ibid, Figure 7, p.10. 92 Ibid, Figure 1, p. 3. 93 Ibid. The replacement rate falls for the highest income group because the 3% default is lower than the deferral that higher income employees would set aside on their own.

OUR STRONG RETIREMENT SYSTEM: AN AMERICAN SUCCESS STORY 27
If the default contribution rate is set at 6% and contributions are invested in a life cycle or target date fund,94 the median replacement rate rises to 52% for the lowest quartile.95 Under these assumptions, the replacement rate for the second and third quartiles would rise to 54%, and 57%. These findings highlight the strength of 401(k) plan design in improving outcomes.
94 A target date fund, which allocates investments between stocks and fixed-income securities, typically rebalances its portfolio to become more focused on income and less focused on growth as it approaches and passes the target date, which is usually included in the fund’s name. These funds have become increasingly popular as a default investment option or by employee choice. These funds rebalance the holdings and allocations as the investor ages and markets move, which simplifies the process for fund owners. 95 Holden and VanDerhei, July 2005, Figure 1, p. 3.
51%
23%
37%
52% 54%
33%
40%
54% 59%
43% 45%
57%
67%
56% 52%
63%
Baseline (401(k) Plan Participants Only)
All Eligible Workers (401(k) Plan Participants and
Eligible Non-Participants)
Automatic Enrollment (3% Contribution Rate, Money
Market Fund)
Automatic Enrollment (6% Contribution Rate, Life
Cycle Fund)
Quartile 1 Quartile 2 Quartile 3 Quartile 4
Median Replacement Rates1 from 401(k) AccumulaNons2 for Workers Turning 65 Between 2030 and 2039, by Income QuarNle at Age 65
Percentage of final five-‐year average salary
Chart reprinted with permission from EBRI and ICI; EBRI Issue Brief #283, “The Influence of Automatic Enrollment, Catch-Up, and IRA Contributions on 401(k) Accumulations at Retirement,” July 2005, Page 4, Fig. 1 and ICI Research Perspective, Vol. 11, no. 2, July 2005, Page 3, Fig. 1 1In all four simulations presented in this figure, workers experience continuous employment, continuous 401(k) plan coverage, and investment returns based on historical returns from 1926 to 2001. In the baseline, only 401(k) participants with account balances at year-end 2000 are considered. In the other three scenarios, all eligible workers are considered. 2The 401(k) accumulation includes 401(k) balances at employer(s) and rollover IRA balances. Source: EBRI/ICI 401(k) Accumulation Projection Model

28 OUR STRONG RETIREMENT SYSTEM: AN AMERICAN SUCCESS STORY
Using its Retirement Security Projection Model96 in 2010, EBRI analyzed how 225 large 401(k) sponsors responded to changes in the law97 that encourage automatic enrollment. The plan sponsors in the sample did not have auto-enrollment in 2005, but had added it by 2009. The study found that employers responded to the plan design change with a higher effective match rate and a higher total employer contribution rate.98
EBRI, in a separate 2010 study99 also looked at the probability that the implementation of
automatic enrollment and automatic escalation would lead to an adequate retirement income. “Success” in this study was defined as the accumulation by retirement age of a 401(k) balance large enough to provide, when combined with Social Security, a total real replacement rate of 80%.100 The analysis was limited to young employees with 31 to 40 years of 401(k) eligibility left in their working career.
The EBRI analysis looked at a variety of plan design and employee behavior factors that
could determine the final replacement rate. A plan with a 6% maximum allowable limit in employee contributions and a 1% annual auto escalation would mean that nearly half (48.5%) of workers would reach an 80% replacement rate for the lowest income quartile of workers aged 25 to 29.101 However, if the plan’s maximum allowable employee contribution is raised to 9%, almost two thirds (63.2%) would reach an 80% replacement rate. With a 12% employee contribution limit, 71.8% reach an 80% replacement rate.102 And with a 15% maximum employee contribution limit, more than three-quarters (76.6%) of the lowest quartile of employees aged 25 to 29 would reach an 80% replacement rate.103 These findings show how targeted changes in plan design can dramatically improve outcomes for employees and enhance retirement security.
Thus, research has demonstrated that changes in plan design and incentives can increase
coverage, participation and accumulated benefits. The strong U.S. retirement system can be made stronger, as employers implement more of the innovations that have been shown to help strengthen plans, while government maintains a tax and regulatory environment that encourages employers to adopt, expand and improve retirement plans.
96 Jack VanDerhei, “The Impact of Automatic Enrollment in 401(k) Plans on Future Retirement Accumulations: A Simulation Study Based on Plan Design Modifications of Large Plans Sponsors,” EBRI Issue Brief, no. 341 (April 2010), www.ebri.org/pdf/briefspdf/EBRI_IB_04-2010_No341_Auto-Enroll1.pdf. 97 Pension Protection Act of 2006. 98 Ibid, p. 18. 99 Jack VanDerhei and Lori Lucas, “The Impact of Auto-enrollment and Automatic Contribution Escalation on Retirement Income Adequacy,” EBRI Issue Brief, no. 349 (November 2010), www.ebri.org/pdf/briefspdf/EBRI_IB_011-2010_No349_EBRI-DCIIA.pdf. 100 Ibid, p. 1. 101 Ibid, Figure 3, p. 7. 102 Ibid. 103 Ibid.


Copyright © 2013 by the American Benefits Council, the American Council of Life Insurers, and the Investment Company Institute. All rights reserved.
101 Constitution Avenue NW Suite 700
Washington, DC 20001
202-624-2000
1501 M Street NW Suite 600
Washington, DC 20005
202-289-6700
1401 H Street NW Suite 1200
Washington, DC 20005
202-326-5800