our innovation. your advantage
TRANSCRIPT

Investor PresentationMay 2019
Our Innovation. Your Advantage.

2
Forward-Looking StatementsThis presentation includes “forward-looking statements” within the meaning of U.S. federal securities laws, and we intend that such forward-looking statements be subject to the safe harbor created thereby. Our use of words “estimate,” “expect,” “anticipate,” “project,” “plan,” “intend,” “believe,” “outlook,“ “guidance,“ “forecast,” or future or conditional verbs, such as “will,” “should,” “could,” “would,” or “may,” and variations of such words or similar expressions are intended to identify forward-looking statements. All forward-looking statements are based upon our current expectations and various assumptions. Our expectations, beliefs, and projections are expressed in good faith, and we believe there is a reasonable basis for them. However, we cannot assure you that these expectations, beliefs, and projections will be achieved. Forward-looking statements are not guarantees of future performance and are subject to significant risks and uncertainties that may cause actual results or achievements to be materially different from the future results or achievements expressed or implied by the forward-looking statements. Among other items, such factors may include: prolonged or material contractions in automotive sales and production volumes; our inability to realize sales represented by awarded business; escalating pricing pressures; loss of large customers or significant platforms; our ability to successfully compete in the automotive parts industry; availability and increasing volatility in costs of manufactured components and raw materials; disruption in our supply base; competitive threats and commercial risks associated with us entering new markets; possible variability of our working capital requirements; risks associated with our international operations, including changes in laws, regulations, and policies governing the terms of foreign trade such as increased trade restrictions and tariffs; foreign currency exchange rate fluctuations; our ability to control the operations of our joint ventures for our sole benefit; our substantial amount of indebtedness; our ability to obtain adequate financing sources in the future; operating and financial restrictions imposed on us under our debt instruments; the underfunding of our pension plans; significant changes in discount rates and the actual return on pension assets; effectiveness of continuous improvement programs and other cost savings plans; manufacturing facility closings or consolidation; our ability to execute new program launches; our ability to meet customers' needs for new and improved products; the possibility that our acquisitions and divestitures may not be successful; product liability, warranty and recall claims brought against us; laws and regulations, including environmental, health and safety laws and regulations; legal proceedings, claims or investigations against us; work stoppages or other labor disruptions; the ability of our intellectual property to withstand legal challenges; cyber-attacks, other disruptions in, or the inability to implement upgrades to, our information technology systems; the possible volatility of our annual effective tax rate; changes in our assumptions as a result of IRS issuing guidance on Tax Cuts and Jobs Act; the possibility of future impairment charges to our goodwill and long-lived assets; and our dependence on our subsidiaries for cash to satisfy our obligations. For a more detailed discussion of these factors, see the information under “Risk Factors” and “Management’s Discussion and Analysis of Financial Condition and Results of Operations” in our most recent Form 10-K and subsequent periodic filings with the Securities and Exchange Commission (the “SEC”), which are accessible on the SEC’s website (www.sec.gov).
You should not place undue reliance on these forward-looking statements. Our forward-looking statements speak only as of the date of this presentation, and we undertake no obligation to publicly update or otherwise revise any forward-looking statement, whether as a result of new information, future events or otherwise, except where we are expressly required to do so by law. This presentation also contains estimates and other information that is based on industry publications, surveys, and forecasts. This information involves a number of assumptions and limitations, and we have not independently verified the accuracy or completeness of the information.

3
Company Overview

4
Primary Product Lines$1.8 B Sealing Systems; $1.4B Fluid Systems
2018 Revenue by product / % of Total Revenue pro forma ex. AVS
Sealing Systems
#1 Globally
Fuel & Brake DeliverySystems
#2 Globally
Fluid TransferSystems
#3 Globally
Sealing Systems$1.8B / 55%
#1 Globally
Fuel & Brake DeliverySystems
$0.8B / 24%
#2 Globally1
Fluid TransferSystems
$0.6B / 17%
#3 Globally
Market position data Boston Consulting Group (2018) and company estimates1 Two companies tied at this level
5
Sealing Systems
#1 Globally
Fuel & Brake Delivery Systems
#2 Globally
Fluid Transfer Systems
#3 Globally
Sealing Systems$1.8B / 55%
#1 Globally
Fuel & Brake Delivery Systems
$0.8B / 24%
#2 Globally1
Fluid Transfer Systems
$0.6B / 17%
#3 Globally
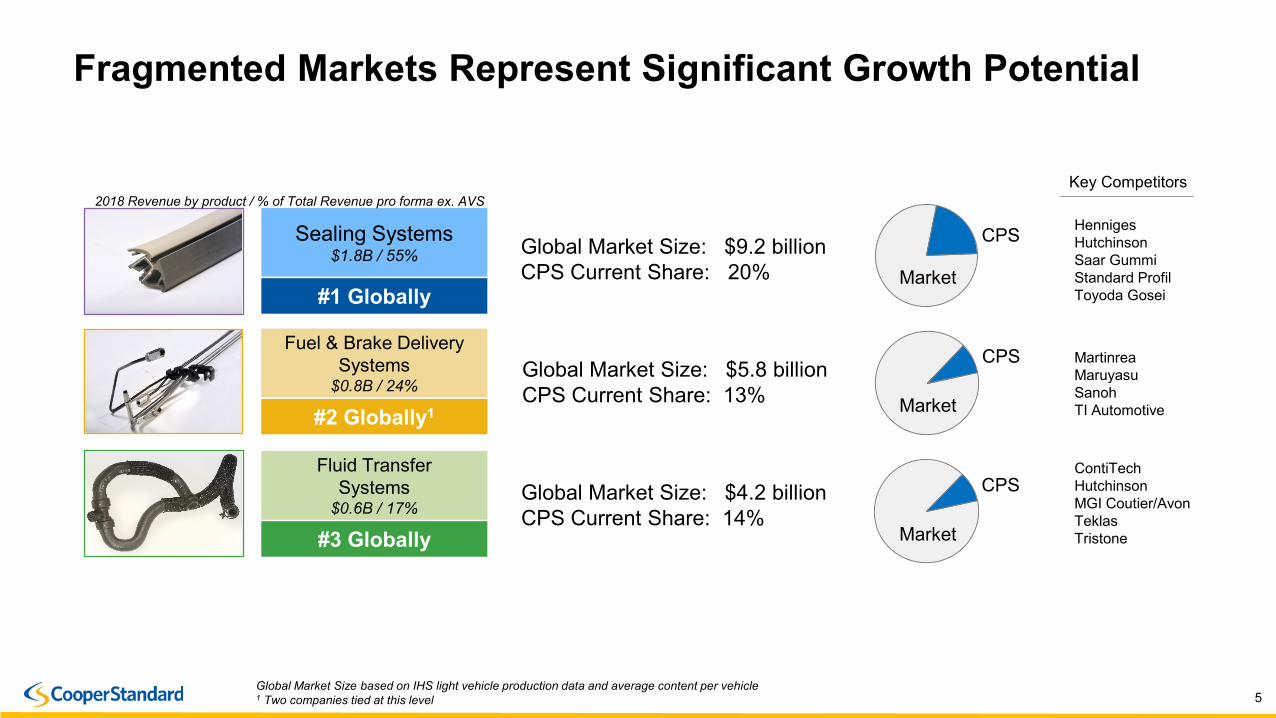
Global Market Size based on IHS light vehicle production data and average content per vehicle1 Two companies tied at this level
Global Market Size: $9.2 billionCPS Current Share: 20%
Global Market Size: $5.8 billionCPS Current Share: 13%
Global Market Size: $4.2 billionCPS Current Share: 14%
HennigesHutchinsonSaar GummiStandard ProfilToyoda Gosei
MartinreaMaruyasuSanohTI Automotive
ContiTechHutchinsonMGI Coutier/AvonTeklasTristone
Market
CPS
Market
CPS
Market
CPS
Fragmented Markets Represent Significant Growth Potential
Key Competitors2018 Revenue by product / % of Total Revenue pro forma ex. AVS

6
Products Well Represented on Key Global VehiclesVehicle Global
Platform Sealing Fuel and Brake
Fluid Transfer
Ford F-150 • • •
GM Equinox • • •
GM LaCrosse • • •
FCA 1500 • • •
Daimler C-Class • •
Ford Ecosport • • •
Ford Explorer • • •
PSA 308 • •
VW Lavida • •
Ford Edge •

7
Ford 30%
GM 21%
FCA 11%
PSA 7%
VW 5%
Daimler 6%
Renault Nissan
3%Tata 3%
BMW 2%
Geely2%
Other 10%
Supporting Diverse Global Customer Base
RENAULT2018 Revenue
$3.63B
Automotive
Diverse Markets

8
Well Positioned to Capitalize on Industry Trends

9
Strong Content in the Right Segments
2013 2014 2015 2016 2017 2018 2019 2020 2021 2022 2023
Car Crossover Truck
84.7
94.7
102.5
+0.3%CAGR
+3.8%CAGR
+0.2%CAGR
Projected Growth 2018 - 2023
1 Source: IHS – April 20192 Data based on Company estimates – full year 2019
Global Light Vehicle Production - Million Units1
Cooper Standard – Advantaged Market Position2
Cars Crossovers Light Trucks
% Revenue - Global 27% 44% 21%
% Revenue - N. America 13% 38% 46%
CPV (relative to cars) – Global +58% +132%
CPV (relative to cars) – N. America +104% +303%

10
Products Essential Across all Powertrains and Mobility OptionsSupplier on 7 of the Top 10 EV Platforms1
SEALING SYSTEMS
FUEL & BRAKE DELIVERY SYSTEMS
FLUID TRANSFER SYSTEMS
Internal Combustion All Electric AutonomousHybrid
ADDITIONAL COOLING LOOPS = HIGHER CPV
INNOVATION ENHANCEMENTS FOR LIGHTER MATERIALS AND QUIET INTERIORS
1 Based on 2018 production data; source: IHS

11
Continuing Ramp Up of Asia Pacific1 Business
Asia Pacific Key Highlights
• Revenue expected to grow faster than market, on average, over next several years
• World-class manufacturing footprint in place to support significant growth
• Capacity utilization and overhead absorption expected to improve with increased sales
• Customer mix shifting toward local OEMs with China approaching 25% by 2023
1 Includes China, India and Korea
2 Estimates as of Q1 2019, based on management projections at that time.
$0.6B ~$1.3B2
2018 2023
Global OEMs Local OEMs Global OEMs Local OEMs
Customer Mix
2018 2023
Projected Sales, USD
12%23%2

12
Past New Business Awards Driving Record Launches
2019 new launches expected to increase 39% vs. 2018
Quarterly Launch CadenceNet New Business Awards(USD millions)

13
2019 Key Program Launches
North America
Europe
Asia
Ford Explorer Chevy Silverado Ford Escape
BMW 1 Series Peugeot 208 Renault Captur
Range Rover Evoque Buick Encore Chevy Malibu

14
Accelerating Value Through Innovation

15
Providing Customer Solutions Through InnovationDriving Sustainable Competitive Advantage for Cooper Standard
Fortrex®
FlushSeal™
MagAlloy™
Gen III Posi-Lock™
LightHose™
Easy-Lock
More than $830 million in annualized innovation sales1 awards since 2016 1 Estimates based on current management projections, IHS production estimates. Includes new and replacement business.

16
Ramping Up Automotive Innovation Revenue1
Enhanced Value for Customers Providing Higher Margin Opportunity
USD Millions
1 Estimates based on current management projections, IHS production estimates. Includes new and replacement business.Commercialized innovation products include: MagAlloyTM, ArmorHoseTM, AmorHoseTM TPV, Gen III Posi-Lock, TP Microdense and FortrexTM
17
Advanced Technology Group - Strategic Diversification

18
Advanced Technology Group Driving Growth and Diversification
Leveraging Traditional Technologies in Non-automotive Markets Leveraging FortrexTM Chemistry Platform in Diverse Industries and Applications
Industrial and Specialty Group (ISG) Applied Materials Science Business (AMS)

19
Industrial and Specialty GroupLeveraging Traditional Technologies in Diverse Industrial Markets
Sealing SystemsFuel & Brake Delivery SystemsFluid Transfer Systems
Hood SealAC Assemblies
Coolant Hose/Tube(s)
Engine Oil TubeRadiator Hose QC
TOC Hose Assemblies & QC
Transmission Cooler
Overmolded BracketOil Pickup Tube
Front Brake Line AssembliesInner & Outer Belts
Brake & Fuel Tank BundleBulb Seal
Glass Run SealEncapsulated Glass Trim Seals
Auxiliary Cooling Assemblies
Engine Oil Tubes
Engine Cooling Hose/Tubes
Cowling Seal Hydraulic Hose/Tube Assemblies
AC Hose/Tube Assemblies Window & Door Seals
Structural Tube - RailsFuel Assemblies
Multi-layer Fuel Lines
Engine Cooling Hose/Tube Assemblies
Fuel RailsMulti-layer EVAP Lines
Rubber Trim Seals
Air Intake Hose Turbo Coolant Lines
Coolant QC
Fuel QC
Window & Door Seals
Door Gaskets
Tube Suction AssembliesTube Drain
Window & Door Seals
PVC Tube ASm
Engine Cooling Hose
Fuel Feed Lines & QC
Filter to Rail Hose
Oil Pick-up Hose
Breather HoseCowling Seal
Water Pick-up AssembliesFuel Vapor Lines & QC
ISG Global Addressable Market of $3.2 Billion*
*Source: Company estimates

20
Applied Materials Science GroupLeveraging FortrexTM Chemistry Platform in Diverse Industries and Applications
• Recently signed two new license agreements
– Leading Chinese sportswear manufacturer
– Major North American producer of materials for building and construction industry
• On track to sign 1-4 additional license/commercial development agreements in 2019
• Developing strategy for high volume production and logistics for Fortrex™ materials
• Expanding product line formulations for:
– Athletic footwear midsoles
– Building and industrial products
– Wire and cable applications
• Enhancing ISG product offering with Fortex™ technology

21
2018 2019E 2020E 2021E 2022E 2023E
$190
~$650USD Millions
ATG Revenue Outlook1
1 Estimates as of Q1 2019, based on management projections at that time.. Includes booked, planned replacement and targeted new business. Assumes no further acquisitions/divestitures beyond those previously announced.
ISG
• Aggressively pursuing share of $3.2 billion global addressable market
• Leveraging recent acquisitions for additional technology, talent and scale
• Recently received first contract in China
AMS
• Existing licensees advancing toward start of production/commercialization
• Expect to sign multiple additional license/commercial development agreements in 2019
Advanced Technology Group Driving Growth and Diversification

22
Summary

23
2018 2019E 2020E 2021E 2022E 2023E
Growth Outlook Outpacing Global Automotive Market
$3.6B
99% 92% 78%% Booked 62% 48%
• Projected 5.0% CAGR vs. global light vehicle growth2
of 1.6%
• Net year-over-year impact of acquisitions / divestitures in 2019 is $(160)M or (4.4%)
• Asia sales expected to exceed $1B by 20213; China sales expected to exceed $1B by 20233
• Anticipated strong revenue growth within the Advanced Technology Group
~$4.6B
1 Includes booked, planned replacement and targeted new business. Assumes no acquisitions/divestitures.2 Source: IHS April 20193 Estimates as of Q1 2019, based on management projections at that time.
Cooper Standard Revenue Outlook1
(USD)
24
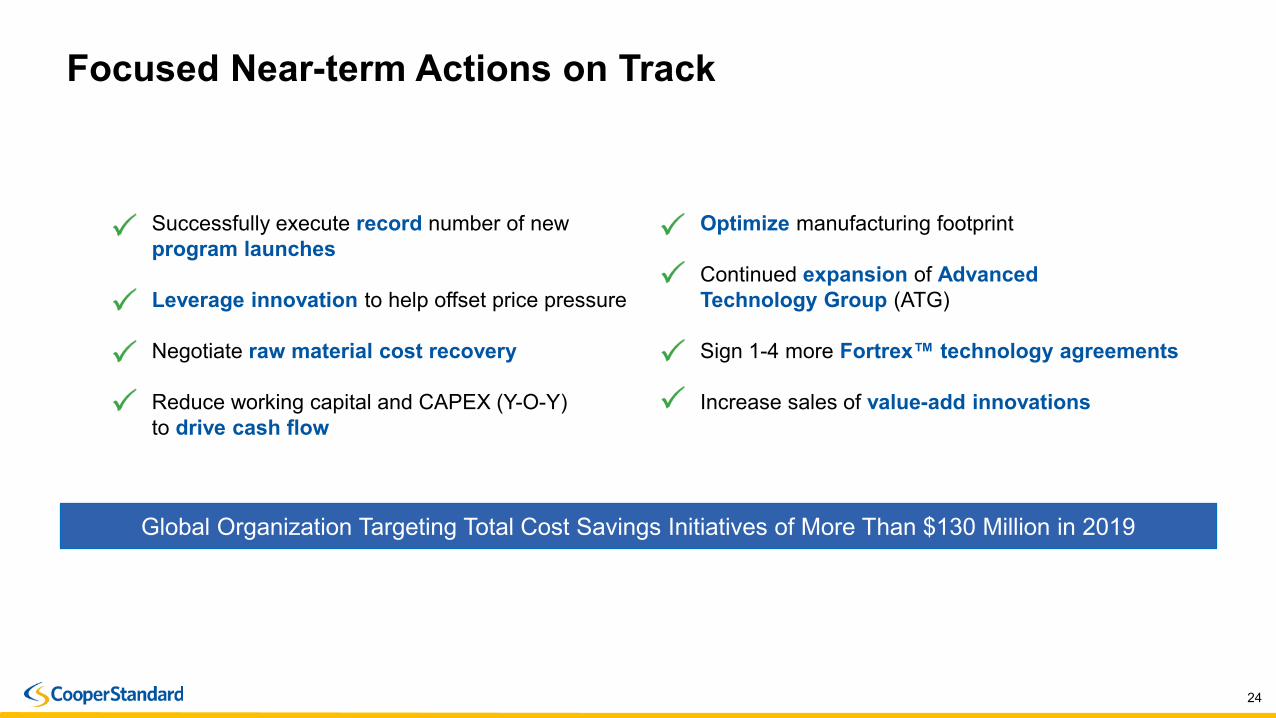
Focused Near-term Actions on Track
Global Organization Targeting Total Cost Savings Initiatives of More Than $130 Million in 2019
Successfully execute record number of new program launches
Leverage innovation to help offset price pressure
Negotiate raw material cost recovery
Reduce working capital and CAPEX (Y-O-Y) to drive cash flow
Optimize manufacturing footprint
Continued expansion of Advanced Technology Group (ATG)
Sign 1-4 more Fortrex™ technology agreements
Increase sales of value-add innovations

25
Continuing Strong Balance Sheet and Credit Profile
Numbers are subject to rounding
1 See Appendix for definitions and reconciliation to U.S. GAAP
xxx
x
Liquidity Profile (USD millions)
Interest Coverage Ratio ( TTM Adj. EBITDA1 / Interest)Leverage Ratio (Gross Debt /TTM Adj. EBITDA1)
Gross Debt and Net Debt (USD millions)
~$220 to $225 million of net cash proceeds from April 1 sale of AVS not reflected above
26
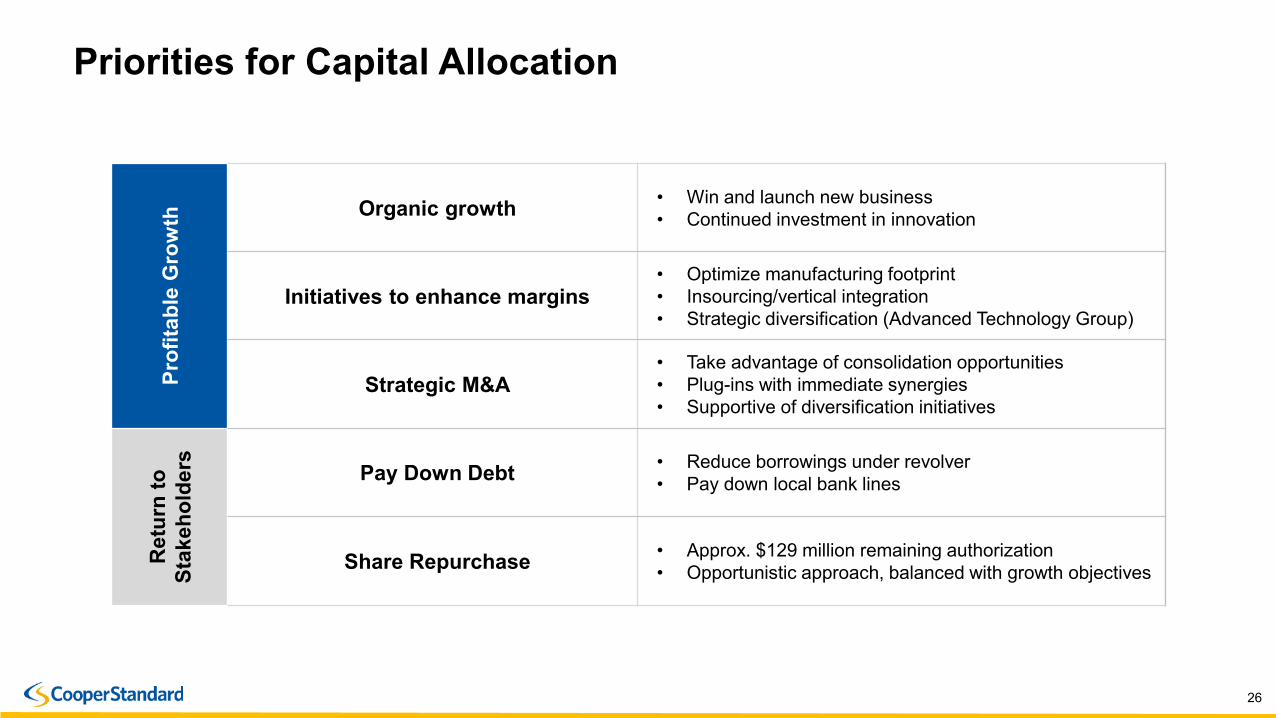
Priorities for Capital Allocation
Prof
itabl
e G
row
th Organic growth • Win and launch new business• Continued investment in innovation
Initiatives to enhance margins• Optimize manufacturing footprint• Insourcing/vertical integration• Strategic diversification (Advanced Technology Group)
Strategic M&A• Take advantage of consolidation opportunities• Plug-ins with immediate synergies• Supportive of diversification initiatives
Ret
urn
to
Stak
ehol
ders Pay Down Debt • Reduce borrowings under revolver
• Pay down local bank lines
Share Repurchase • Approx. $129 million remaining authorization• Opportunistic approach, balanced with growth objectives

27
Strategic Value Drivers
2019 2020 2021 2022 2023
• Culture of innovation and sustainability
• Increasing innovation portfolio
• Continuing operational excellence
• Profitable growth of Asia Pacific business
• Continued strong net new business wins
• Leveraging material science capabilities
• Rapid growth in non-automotive business
• Pursue synergistic M&A opportunities

2828
APPENDIX
29
Non-GAAP Financial MeasuresEBITDA, adjusted EBITDA, and net debt are measures not recognized under U.S. GAAP and which exclude certain non-cash and special items that may obscure trends and operating performance not indicative of the Company's core financial activities. Management considers EBITDA, adjusted EBITDA and net debt to be key indicators of the Company's operating performance and believes that these and similar measures are widely used by investors, securities analysts and other interested parties in evaluating the Company's performance. In addition, similar measures are utilized in the calculation of the financial covenants and ratios contained in the Company’s financing arrangements and management uses these measures for developing internal budgets and forecasting purposes. EBITDA is defined as net income adjusted to reflect income tax expense, interest expense net of interest income, depreciation and amortization, and adjusted EBITDA is defined as EBITDA further adjusted to reflect certain items that management does not consider to be reflective of the Company's core operating performance. Net debt is defined as total debt minus cash and cash equivalents.
When analyzing the Company’s operating performance, investors should use EBITDA, adjusted EBITDA and net debt as supplements to, and not as alternatives for, net income, operating income, total indebtedness, or any other performance measure derived in accordance with U.S. GAAP. EBITDA, adjusted EBITDA, and net debt have limitations as analytical tools and should not be considered in isolation or as substitutes for analysis of the Company’s results of operations as reported under U.S. GAAP. Other companies may report EBITDA, adjusted EBITDA and net debt differently and therefore the Company's results may not be comparable to other similarly titled measures of other companies. In addition, in evaluating adjusted EBITDA, it should be noted that in the future the Company may incur expenses similar to or in excess of the adjustments in the below presentation. This presentation of adjusted EBITDA should not be construed as an inference that the Company's future results will be unaffected by special items. Reconciliations of EBITDA, adjusted EBITDA as well as the calculations for certain financial ratios follow.

30
EBITDA and Adjusted EBITDA Reconciliation
(1) Project costs related to acquisitions and planned divestiture.(2) Loss on refinancing and extinguishment of debt related to the applicable amendment of the Term Loan Facility entered into during such period.
(Unaudited, dollar amounts in thousands)
Three Months Ended March 31,2019 2018
Net (loss) income attributable to Cooper-Standard Holdings Inc. $ (3,460) $ 56,792
Income tax expense 2,331 11,891
Interest expense, net of interest income 11,932 9,800
Depreciation and amortization 36,605 36,259
EBITDA $ 47,408 $ 114,742
Restructuring charges 17,715 7,125
Project costs (1) 1,263 —
Loss on refinancing and extinguishment of debt (2) — 770
Adjusted EBITDA $ 66,386 $ 122,637

31
Adjusted EBITDA Margin, Financial RatiosTwelve Months Ended March 31, 2019
(Unaudited, dollar amounts in thousands)
(1) Other non-cash impairment charges related to intangible assets of $791 and fixed assets of $42,915.(2) Non-cash goodwill impairment charges related to impairments at our Europe and Asia Pacific reporting units, net of approximately $5,463 attributable to our noncontrolling interests. (3) Includes non-cash impairment charges related to restructuring.(4) Gain on sale of land in Europe that was contemplated in conjunction with our restructuring plan. (5) Project costs related to acquisitions and planned divestiture.(6) Amortization of write-up of inventory to fair value for the 2018 acquisitions. (7) Non-cash settlement charges incurred related to certain of our non-U.S. pension plans.
Twelve Months EndedQ2 2018 Q3 2018 Q4 2018 Q1 2019 March 31, 2019
Net income (loss) attributable to Cooper-Standard Holdings Inc. $ 41,877 $ 32,156 $ (23,059) $ (3,460) $ 47,514Income tax expense (benefit) 9,130 (1,190) (49,514) 2,331 (39,243)Interest expense, net of interest income 9,973 9,983 11,248 11,932 43,136Depreciation and amortization 36,914 36,098 37,427 36,605 147,044
EBITDA $ 97,894 $ 77,047 $ (23,898) $ 47,408 $ 198,451Other impairment charges (1) — — 43,706 — 43,706Goodwill impairment charges(2) — — 39,818 — 39,818Restructuring (3) 10,013 2,703 9,881 17,715 40,312Gain on sale of long-lived asset (4) — (10,714) 337 — (10,377)Project costs (5) — — 4,881 1,263 6,144Amortization of inventory write-up (6) — 535 925 — 1,460Settlement charges (7) — — 775 — 775
Adjusted EBITDA $ 107,907 $ 69,571 $ 76,425 $ 66,386 $ 320,289Debt
Debt payable within one year $ 169,087Long-term debt 738,077Total debt $ 907,164Less: cash and cash equivalents 262,169Net debt $ 644,995
Leverage ratio (Total debt/TTM Adjusted EBITDA) 2.8Net leverage ratio (Net debt/TTM Adjusted EBITDA) 2.0Interest coverage ratio (TTM Adjusted EBITDA/Interest expense) 7.4Sales $ 928,262 $ 861,653 $ 871,987 $ 880,038 $ 3,541,940
Net income margin (Net income/Sales) 4.5% 3.7% (2.6)% (0.4)% 1.3%Adjusted EBITDA margin (Adjusted EBITDA/Sales) 11.6% 8.1% 8.8% 7.5% 9.0%