our atmosphere and climate 2017
TRANSCRIPT

Our atmosphere and climate 2017DATA TO 2016
>> New Zealand’s Environmental Reporting Series

Crown copyright ©
Unless otherwise stated, this copyright work is licensed for re-use under a Creative Commons Attribution 3.0 New Zealand licence. Except for any photographs, in essence, you are free to copy, distribute and adapt the work, as long as you attribute the work to the New Zealand Government and abide by the other licence terms. To view a copy of this licence, visit Creative Commons Attribution 3.0 New Zealand licence. To reuse a photograph please seek permission by sending a request to the stated image owner.
Please note that neither the New Zealand Government emblem nor the New Zealand Government logo may be used in any way which infringes any provision of the Flags, Emblems, and Names Protection Act 1981 or would infringe such provision if the relevant use occurred within New Zealand. Attribution to the New Zealand Government should be in written form and not by reproduction of any emblem or the New Zealand Government logo.
If you publish, distribute, or otherwise disseminate this work (or any part of it) to the public without adapting it the following attribution statement should be used:
Source: Ministry for the Environment, Stats NZ, and data providers, and licensed by the Ministry for the Environment and Stats NZ for re-use under the Creative Commons Attribution 3.0 New Zealand licence.
If you adapt this work in any way, or include it in a collection, and publish, distribute, or otherwise disseminate that adaptation or collection to the public, the following attribution statement should be used:
This work uses material sourced from the Ministry for the Environment, Stats NZ, and data providers, which is licensed by the Ministry for the Environment and Stats NZ for re-use under the Creative Commons Attribution 3.0 New Zealand licence.
Where practicable, please hyperlink the name of the Ministry for the Environment or Stats NZ to the Ministry for the Environment or Stats NZ web page that contains, or links to, the source data.
Disclaimer While all care and diligence has been used in processing, analysing, and extracting data and information for this publication, the Ministry for the Environment, Stats NZ, and the data providers give no warranty in relation to the report or data used in the report – including its accuracy, reliability, and suitability – and accept no liability whatsoever in relation to any loss, damage, or other costs relating to the use of any part of the report (including any data) or any compilations, derivative works, or modifications of the report (including any data).
Citation Ministry for the Environment & Stats NZ (2017). New Zealand’s Environmental Reporting Series: Our atmosphere and climate 2017. Retrieved from www.mfe.govt.nz and www.stats.govt.nz.
Published in October 2017 by Ministry for the Environment and Stats NZ
Publication number: ME 1332 ISSN: 2382-0179 (online) ISSN: 2463-3038 (print) ISBN: 978-1-98-852521-1 (online) ISBN: 978-1-98-852523-5 (print)
Cover image courtesy of the Earth Science and Remote Sensing Unit, NASA Johnson Space Center.

New Zealand’s Environmental Reporting Series: Our atmosphere and climate 2017 3
Contents
Message to our readers 4
Our atmosphere and climate at a glance 6 Our climate – top findings 6
Ultraviolet sunlight – top findings 8
Introduction 9 Focus of this report 9
Scope of our report 10
Climate change 13 Pressures on our atmosphere and climate 13
State of New Zealand’s climate 23
Impacts of a changing climate 32
New Zealand’s future climate and climate risks 42
Exposure to ultraviolet sunlight 46 Importance of stratospheric ozone 46
New Zealand’s UV levels 48
UV sunlight and health 49
Acknowledgements 51
Appendix: Climate change projections for New Zealand 52
References 54

4 New Zealand’s Environmental Reporting Series: Our atmosphere and climate 2017
Message to our readers
Ki te kore he whakakitenga, ka ngaro ai te iwi Without foresight or vision, the people will be lost
New Zealand’s Environmental Reporting Series: Our atmosphere and climate 2017 is the first report in the series dedicated to our atmosphere and climate. It does not cover air quality because air, the shallow gas layer closest to Earth, is considered a separate domain, which we have reported on in the 2014 Air domain report.
Unsurprisingly, the dominant issue for atmosphere and climate is human-induced climate change. New Zealand’s atmosphere and climate are part of a complex Earth system that is being changed by global greenhouse gas emissions from human activities, largely from burning fossil fuels. This report is not an assessment of the science of climate change; that has been done comprehensively in other places, such as in reports by the Intergovernmental Panel on Climate Change. Rather, in line with the aims of the Environmental Reporting Act 2015, the report summarises indicators of climate change in New Zealand.
Data to 2013 show gross global greenhouse gas emissions increased 51 percent from 1990 to 2013. New Zealand contributed to this trend, with a 24 percent increase in our gross greenhouse gas emissions from 1990 to 2015. Most of this increase occurred before 2005.
As greenhouse gas emissions have increased globally, so too have concentrations of those gases in the atmosphere, thus warming the planet. New Zealand’s annual average land temperature has increased 1 degree Celsius since 1909. This is in line with global increases and is reflected, for example, in more warm days and fewer frosts at about one-third of sites around the country over the period 1972–2016.
New Zealand’s climate will continue to warm in the short term due to the cumulative effect of past emissions of greenhouse gases, such as carbon dioxide, which can persist in the atmosphere for thousands of years. However, the climate changes that our children and grandchildren will experience depend on the effectiveness of current worldwide actions to reduce emissions.
While this report is not primarily about future climate projections, scientists have warned that the greater the magnitude of warming in the climate system, the greater the risk of severe and pervasive negative impacts on people and the environment. We hope this report contributes to people, governments, and businesses making good decisions for future generations.
The report also discusses New Zealand’s ultraviolet (UV) radiation levels and the risk of skin damage, including skin cancer, from exposure to high UV levels. Our UV levels fluctuate over the year but are high in summer and contribute to New Zealand’s high rates of melanoma. The ozone layer in the atmosphere is important in controlling the levels of UV radiation that reach Earth’s surface. The 1987 Montreal Protocol heralded an international agreement to minimise the damaging effect of ozone-depleting substances on the ozone layer.

New Zealand’s Environmental Reporting Series: Our atmosphere and climate 2017 5
The production of these harmful substances fell by 98 percent from 1986 to 2015. New Zealand has both contributed to and benefited from the decline in the production of these substances. Moreover, the effective management of this issue is a heartening example of how, in the face of data and other evidence, we can come together internationally to constrain damaging human activities and prevent the serious consequences of higher UV levels.
Vicky Robertson Liz MacPherson Secretary for the Environment Government Statistician

6 New Zealand’s Environmental Reporting Series: Our atmosphere and climate 2017
Our atmosphere and climate at a glance
Our climate – top findings Around the world, greenhouse gas emissions from human activities are changing the atmosphere and climate. Although agriculture is New Zealand’s largest emissions sector, road transport had one of the largest increases in emissions since 1990 (78 percent).
New Zealand is experiencing the effects of past global emissions, and even if these emissions stopped today, many aspects of climate change would continue for centuries. The full extent of future global warming depends on the emissions added from this point forward.
• Global gross emissions of greenhouse gases rose 51 percent from 1990 to 2013, mainly due to people burning more fossil fuels for electricity generation, heat, transport, manufacturing, and construction.
• New Zealand’s contribution to global gross greenhouse gas emissions is small (0.17 percent), but we have the fifth-highest level of emissions per person of the 35 countries in the Organisation for Economic Cooperation and Development (OECD, 2017).
• New Zealand’s gross greenhouse gas emissions rose 24 percent from 1990 to 2015, with most of the increase having occurred by 2005. Most of the increase came from road transport and agricultural production (largely from nitrogen fertiliser use and grazing animal excrement on managed soils, and livestock digestion).
• At the same time, our net greenhouse gas emissions rose 64 percent, as a result of increasing gross emissions and higher logging rates in production forests. Net emissions acknowledge the role of carbon sinks, such as growing forests, in removing atmospheric greenhouse gases but also adding them when forests are harvested and land use is changed.
• Agriculture emissions (mainly methane and nitrous oxide) made up almost half our greenhouse gas emissions in 2015, reflecting the important role of the agriculture sector in New Zealand’s economy.
In 2016, global concentrations of atmospheric carbon dioxide passed 400 parts per million. This is the highest level of carbon dioxide in our atmosphere in at least the last 800,000 years.
• Atmospheric carbon dioxide concentrations have increased rapidly. Concentrations at Baring Head, near Wellington, increased 23 percent from 1972 to 2016, matching global trends.

New Zealand’s Environmental Reporting Series: Our atmosphere and climate 2017 7
New Zealand’s annual average temperature has increased by 1 degree Celsius since 1909. This is in line with global average temperature increases, which are almost certainly the result of high levels of atmospheric greenhouse gases emitted from human activities.
Although seemingly small, this warming represents a rapid increase over a century and is already affecting the natural systems on which we depend. Further warming is expected; how much depends on future global greenhouse gas emissions.
• 2016 was New Zealand’s warmest year since at least 1909, and the five warmest years on record have occurred in the last 20 years.
• The number of frost days (below 0 degrees Celsius) decreased and the number of warm days (over 25 degrees Celsius) increased at around one-third of measured sites over the period 1972–2016.
New Zealand’s climate varies naturally, making it hard to discern trends from short-term observations. Alongside increased temperature, our data show trends at some sites for sunshine and wind.
Our data show sunshine hours increased across New Zealand largely because of reduced cloud cover, and some locations experienced changes in seasonal rainfall and extreme wind and rainfall events. We need longer-term data to confirm if humans are contributing to these trends.
Climate change is already potentially irreversibly affecting New Zealand’s natural systems. We can expect more severe effects on the environment and our human systems as the climate continues to change.
Climate-related changes to our oceans will continue for centuries and are threats to marine life, commercial and recreational fishing, Māori customary practices, and other cultural and recreational practices. Rising sea levels are threatening public and private coastal communities, infrastructure, cultural sites, and marine habitats. The decreasing volumes of our glaciers affect ecological and hydropower resources, and cultural and tourism activities.
• Changes to New Zealand’s marine environment include:
− the acidity of the subantarctic ocean off the Otago coast has increased since 1998
− the average sea-surface temperature around New Zealand increased 0.7 degrees Celsius from 1909 to 2009, similar to worldwide increases (Mullan et al, 2010)
− coastal sea levels have risen by up to 22 centimetres, depending on location, over the last century, consistent with global trends.

8 New Zealand’s Environmental Reporting Series: Our atmosphere and climate 2017
• From 1977 to 2016, it is estimated our glaciers lost almost 25 percent (13.3 cubic kilometres) of their ice volume.
• Since the 1972/73 measurement season, soils at one-quarter of sites around New Zealand have been getting drier. The frequency and intensity of drought in drought-prone regions are expected to increase with climate change, with important implications for our primary industries.
• We do not yet have a detailed understanding of how the changing climate will add to the pressures faced by already vulnerable native flora and fauna. However, emerging evidence suggests it is already affecting some species and their ecosystems:
− the sex ratios of North Brother Island tuatara are changing – there are now more male offspring in response to warmer nest temperatures
− the numbers of invasive wasps have increased around the Nelson area because of increasing spring temperatures.
• If global greenhouse gas emissions continue unabated, we face further warming by the end of this century that will lead to high to very high risk of severe, widespread, and irreversible impacts globally (Intergovernmental Panel on Climate Change (IPCC), 2014a), with far-reaching implications for New Zealand.
Ultraviolet sunlight – top findings New Zealand’s ultraviolet (UV) levels are naturally high in summer (December–February). UV sunlight can cause skin damage and some cancers, but some UV exposure is important for the production of vitamin D. Our high summer UV levels are partly caused by the naturally thinner ozone layer over New Zealand at this time, our clear air, and Earth’s orbit, which brings the Southern Hemisphere closer to the sun during summer. The ozone hole over Antarctica does not have a large effect on the concentrations of ozone over New Zealand or, therefore, on our UV levels.
• In summer, our UV levels are often classified as extreme, causing damage to fair skin in minutes.
• Australasia has the highest rates of melanoma in the world. New Zealand’s rates of melanoma for males increased from 1996 to 2013, but there was no obvious trend for females.
• Global production of ozone-depleting substances fell 98 percent from 1986 to 2015.
• The ozone hole, which forms because of ozone-depleting substances produced from human activities, has started to shrink and may cease to form by the middle of this century.
New Zealand’s Environmental Reporting Series: Our atmosphere and climate 2017 9
Introduction
Our atmosphere has been described as a blanket wrapped around Earth to keep it at the perfect temperature to sustain life. Yet, relative to Earth’s size, the atmosphere is incredibly thin. If Earth were an apple, the atmosphere would be the film of wax coating its skin. However, this insignificant-looking film is vital for our climate system and any changes to it will affect our climate and, to varying degrees, life on Earth, possibly forever.
Focus of this report Our atmosphere and climate 2017 focuses on climate change and exposure to ultraviolet sunlight. We chose these themes as the focus of this report because scientific evidence shows human activities are causing long-lasting changes to the state of the atmosphere.
Climate change The atmosphere comprises a range of gases (including greenhouse gases such as carbon dioxide, methane, nitrous oxide, and water vapour) and minute dust-like particles called aerosols, encircling Earth and held in place by gravity. Combined, these atmospheric greenhouse gases and aerosols help regulate the global climate by contributing to the extent to which the sun’s energy is distributed and stored around Earth or escapes into outer space.
Without any input from humans, the global climate would vary naturally over hundreds to thousands of years as a result of natural variations in atmospheric and ocean circulations and changes in Earth’s orbit around the sun. The natural climate variations, including ice ages, have led to adjustments across ecosystems and the environment. In many instances, such adjustments have occurred gradually, but there have been occasions, many millions of years ago, where rapid changes occurred, resulting in mass extinctions (Barnosky et al, 2011).
Human activities emit additional greenhouse gases and have increased atmospheric concentrations of these gases to unprecedented levels over a period of less than 100 years (as shown in figure 1) (IPCC, 2013). Such a rapid increase is causing the planet to warm faster than ever experienced in the history of human civilisation (at least the past 2,000 years).
“… the science now shows with 95 percent certainty that human activity is the dominant cause of observed warming since the mid-20th century.”
IPCC Climate Change 2013 The Physical Science Basis

10 New Zealand’s Environmental Reporting Series: Our atmosphere and climate 2017
Figure 1
Source: Adapted from NASA; data from National Oceanic and Atmospheric Administration. Some descriptions adapted from the Scripps CO2 Program website, Keeling Curve Lessons
Note: This graph, based on the comparison of atmospheric samples contained in ice cores and more recent direct measurements, shows how atmospheric CO2 has increased since the Industrial Revolution.
The Climate change chapter focuses on pressures that are changing our atmosphere and climate and what this changing state means for New Zealand.
Exposure to ultraviolet sunlight The Exposure to ultraviolet sunlight chapter reports on the pressure on Earth’s protective ozone layer from ozone-depleting substances. This is a decreasing pressure as ozone-depleting substances are now well managed internationally and the ozone hole is shrinking. As long as this continues, the ultraviolet (UV) levels that New Zealanders experience will largely be due to natural causes and variation. Understanding our fluctuating UV levels is important for making good decisions about exposure to UV sunlight. We report on the state and changes in New Zealand’s UV levels, which have implications for New Zealanders’ health.
Scope of our report The scope of our report was determined by the framework for environmental reporting set out in legislation (the Environmental Reporting Act 2015), which requires us to report on the pressures on and state of the atmosphere and climate, and the impacts of changes to the state of the atmosphere and climate. In line with our focus on changes to the environment from human pressures, we also focus on long-term, human-induced climate change rather than the natural climate variability that is a prominent feature of New Zealand’s climate.
For environmental reporting purposes, we differentiate the shallow gas layer that is closest to Earth – the air that we breathe – from the rest of the atmosphere. We report on air quality as a separate domain, with an updated report on air due in October 2018.
While reducing emissions (mitigation) and adaptation are critical factors in how climate change will affect New Zealanders, they are largely outside the scope of this report, and we do not discuss them in detail. New Zealand’s action on climate change is reported under the United Nations Framework Convention on Climate Change in national communications (every four years) and biennial reports (every two years). The next editions of both reports are due at the end of 2017.

New Zealand’s Environmental Reporting Series: Our atmosphere and climate 2017 11
We also do not cover features of weather, such as daily weather forecasts or recent weather events experienced around New Zealand. Weather information is regularly updated by and available from sources such as NIWA or Meteorological Service of New Zealand Ltd (MetService). NIWA also provides comprehensive annual reports on climate variability and long-term climate change.
Data We use our own national data and international data to report on climate change and UV sunlight exposure. Our national data are based on datasets that have passed our Environmental Reporting Programme’s quality standards. The datasets are available on our data service.
We have assessed all trends described in this report at the 95 percent confidence level. For more information about our trend assessments, see Trend assessment – technical information.
In many instances, our data are collected from 30 regionally representative climate stations around the North and South islands. We selected stations that:
• are currently open and likely to remain open for the foreseeable future
• have a long record of reliable, good-quality data
• are situated near a large city (eg at an airport site) so they are representative of the climate where many people in the region live.
We aimed to collect data from at least one station for each region – although we also selected two or three stations to represent a large region.
We advise you to be cautious when comparing results presented in Our atmosphere and climate 2017 with those from other reports, which might use data from a range of locations or cover different lengths of time. For further detail on data and methodologies, see Environmental indicators Te taiao Aotearoa – Atmosphere and climate.
We do not have adequate data to report on the more remote land masses of our realm, including the Chatham Islands and extending from the Ross Dependency in Antarctica in the south and north to the Cook Islands, Niue, and Tokelau.
The Intergovernmental Panel on Climate Change (IPCC) is an independent international scientific authority set up in 1988 by the World Meteorological Organization and the United Nations to provide objective analysis of global climate change. Where we do not yet have suitable national data for some issues, we have supported our discussion with information from the IPCC and other reports and scientific literature, which we reference within the text.

12 New Zealand’s Environmental Reporting Series: Our atmosphere and climate 2017
Box 1 Whether it’s weather or whether it’s not
Climate is different from weather. Weather relates to current atmospheric conditions, such as rainfall, temperature, and wind, at a specific time in a particular location or region. Weather changes from day to day.
Climate is the average weather conditions for a particular location or region over at least three decades. In a wider sense, it relates to the complex interactions between the world’s atmosphere, water bodies (such as oceans, rivers, and lakes, including frozen water bodies), land areas, and the ecosystems and organisms that live in the climate system.
Climate variability is the natural, normal variations in the world’s climate patterns. It relates to seasonal and yearly variations around a long-term average. For example, some summers are warmer or cooler than average, and some years are wetter, drier, or windier than average. These changes are not long term or permanent.
Climate change is an adjustment in climate that persists for even longer periods, typically decades or more (see figure 2). Climate change can occur naturally, for example, through large-scale ocean circulation changes or changes in Earth’s orbit. However, increasing greenhouse gas concentrations in the atmosphere resulting from human activities are the key driver of the climate change that has been occurring since the 19th century.
Figure 2

New Zealand’s Environmental Reporting Series: Our atmosphere and climate 2017 13
Climate change
Pressures on our atmosphere and climate The climate and weather we experience around New Zealand are influenced by a number of factors. These include our geography and position on the globe, the time of year, natural drivers of variability, and human activities.
New Zealand is a set of islands in a remote location in the mid-latitude westerlies of the South Pacific Ocean. Our two main islands stretch across a wide span of latitudes (34–47° south), with mountain ranges affecting the patterns of wind and rain. This varied geography contributes to marked variations in climate across the country, particularly between the east and west, and to extreme weather events, such as flooding and droughts.
Natural climate variability Our climate varies naturally over timescales ranging from months to millennia. For example, ‘wobbles’ in Earth’s orbit drive ice ages every 100,000 years or so, changes in solar irradiance (or sunspots) occur roughly every decade, large volcanic eruptions can cool the planet for 1–3 years, and then there are climate oscillations, which affect the climate from year to year.
Climate oscillations
A climate oscillation is a natural pattern of changes in air pressure, sea temperature, and wind direction that is consistent over a period of a few months to several decades. Three oscillations in particular influence New Zealand’s weather and climate. These are El Niño Southern Oscillation (ENSO) (with three phases: neutral, El Niño, and La Niña), Interdecadal Pacific Oscillation (IPO), and Southern Annular Mode (SAM). The influence of these oscillations on our weather and climate (see box 2) is important for recreation and our agricultural and other industries, such as construction.
Box 2 Climate oscillations influencing New Zealand’s weather and climate
El Niño Southern Oscillation
ENSO is the cyclical change in the movement of wind and warm equatorial water across the Pacific Ocean. An El Niño or La Niña phase of ENSO occurs every two to seven years and lasts around a year (NIWA, nd-a). In New Zealand, the impacts vary between individual phases, but over summer, an El Niño tends to lead to increased westerly winds, with more rain in the west and drought in the east (Salinger & Mullan, 1999). By comparison, a La Niña may lead to fewer westerly winds and more north-easterly winds in New Zealand. This tends to cause warmer temperatures around the country and more rain in the northeast of the North Island and less in the south and southwest of the South Island.
An El Niño phase during summer can lead to increased westerlies, with more rain in the west and drought in the east.
See Environmental indicators Te taiao Aotearoa: El Niño Southern Oscillation

14 New Zealand’s Environmental Reporting Series: Our atmosphere and climate 2017
Southern Annular Mode
SAM, also known as Antarctic Oscillation or the Southern Hemisphere Annular Mode, describes the north to south movement of westerly wind that circles the South Pole, dominating the middle to higher latitudes of the Southern Hemisphere. In New Zealand, a negative SAM phase is associated with more frequent westerly winds, unsettled weather, and storms over most of the country. The opposite applies in a positive SAM phase. New Zealand generally experiences relatively light winds and settled weather during a positive SAM phase (NIWA, 2007). One phase of SAM can last for several weeks, but phases change quickly and randomly.
SAM has generally been increasing (becoming more positive) since 1970 (Marshall, 2003). This increasing trend is largely associated with ozone depletion (NIWA, 2006).
Interdecadal Pacific Oscillation
IPO is a pattern of sea-surface temperature and sea-level pressure changes over the Pacific basin that occur over 20- to 30-year timescales. It affects the strength and frequency of ENSO (Salinger et al, 2001). In New Zealand, a positive IPO phase is linked to stronger west to southwest winds, more rain in the west, and drier conditions in the north and east. The opposite occurs in a negative phase. IPO was in a negative phase from 1999 to 2013, then switched to a positive phase.
Greenhouse gas emissions from human activities As well as natural variability, the global climate is changing as a result of increased greenhouse gases and aerosols in the atmosphere from human activities, mainly burning fossil fuels but also changing land use and emissions from other activities (including industry and agriculture). An example of land-use change is converting forested land (which stores large amounts of carbon until the trees are felled) for agriculture and urban developments.
Carbon dioxide, methane, nitrous oxide, and fluorinated gases (human-made gases found in products such as refrigerators, air-conditioners, foams, and aerosol cans) are the most important greenhouse gases emitted from human activity because they accumulate in the atmosphere and absorb additional energy, making Earth warmer than it would otherwise be.
Different greenhouse gases can have different effects on Earth’s warming, for example, through how long they stay in the atmosphere (their ‘lifetime’) and their ability to absorb energy or trap heat (their ‘radiative efficiency’). The global warming potential (GWP) index measures how much each gas contributes to global warming over a given time period compared with carbon dioxide, which has a GWP value of 1. GWP is usually measured over a time period of 100 years. For example, the 100-year GWP of methane describes the effect that emitting 1 kilogram of this gas will exert on atmospheric warming over 100 years relative to the effect of emitting 1 kilogram of carbon dioxide (United Nations Framework Convention on Climate Change (UNFCCC), 2006).
SAM has generally been increasing (becoming more positive) since 1970.
See Environmental indicators Te taiao Aotearoa: Southern Annular Mode
A positive phase of IPO is linked to stronger west to southwest winds, more rain in the west, and drier conditions in the north and east.
See Environmental indicators Te taiao Aotearoa: Interdecadal Pacific Oscillation

New Zealand’s Environmental Reporting Series: Our atmosphere and climate 2017 15
Researchers can use the GWP to add emissions estimates of different gases and compare the effects of reducing emissions from different human activities. Figure 3 shows the most important greenhouse gases emitted from human activity, some of the primary New Zealand sources of these gases, their lifetime in the atmosphere, and GWP.
Figure 3
Note: New Zealand uses the global warming potential (GWP) index in its reports to the United Nations Framework Convention on Climate Change. GWP values are updated from time to time as knowledge of the lifetime and radiative efficiency of gases is refined.

16 New Zealand’s Environmental Reporting Series: Our atmosphere and climate 2017
Increasing global emissions
Greenhouse gas emissions enter the atmosphere and, given their long lifetimes, accumulate and spread around the globe. This means that despite New Zealand’s geographic remoteness, we cannot avoid the effects of increasing global emissions.
From 1990 to 2013, global gross greenhouse gas emissions from human activities increased 51 percent (see figure 4). The global emissions for 2013 comprised mostly carbon dioxide (76 percent), methane (16 percent), and nitrous oxide (6 percent).
Atmospheric carbon dioxide concentrations have risen steadily since the industrial revolution (around the mid-18th century) (IPCC, 2013). Records from Baring Head, Wellington show that carbon dioxide concentrations over New Zealand increased 23 percent from 1972 (when measurements first began) to 2016 (see box 3). This is consistent with global trends.
In 2016, global concentrations of atmospheric carbon dioxide passed the symbolic threshold of 400 parts per million (see box 3) (NASA, 2017b). This is the highest level of carbon dioxide in our atmosphere in at least the last 800,000 years (IPCC, 2013).
Figure 4
Note: Net emissions include emissions and removals as a result of land-use change and forestry (LUCF). GHG emissions are in metric tons of CO2 equivalent (MtCO2-e). The Kyoto Protocol set 1990 as the base year for signing parties’ national greenhouse gas inventories.
Some countries are reducing their emissions. For example, from 1990 to 2013, the United Kingdom reduced its emissions of carbon-dioxide equivalents by 26 percent, Sweden by 25 percent, and France by 11 percent (CAIT, 2017). Any country’s ability to decrease their emissions depends on not only the steps they take to reduce emissions but also their circumstances, such as their economic dependence on greenhouse-gas-intensive industries, changing energy sources, accessibility and availability of emission-reducing technologies, and population changes.
0
10,000
20,000
30,000
40,000
50,000
60,000
Net greenhouse gas emissions Gross greenhouse gas emissions
Gross and net global greenhouse gas emissions 1990–2013
MtCO2e
Source: Climate Analysis Indicators Tool; World Resources Institute
Global gross greenhouse gas emissions increased 51 percent from 1990 to 2013.
See Environmental indicators Te taiao Aotearoa: Global greenhouse gas emissions

New Zealand’s Environmental Reporting Series: Our atmosphere and climate 2017 17
New Zealand’s emissions
Over the period 1990 to 2015, New Zealand’s gross and net greenhouse gas emissions increased 24 and 64 percent respectively, although most of the increase in gross emissions occurred by 2005.
Net emissions take into account the carbon dioxide absorbed by forests and then released when the trees are felled. The large increase in net emissions is the result of increases in gross emissions combined with higher logging rates in production forests (Ministry for the Environment, 2017a).
Population growth and increased domestic production have driven the increase in gross emissions since 1990 (Ministry for the Environment, 2017a). Most of these increases came from agricultural production and road transport. Agricultural emissions from livestock digestion (mostly methane) rose 5 percent, while emissions from agricultural soils (mostly nitrous oxide from nitrogen fertiliser use and excrement from grazing livestock) rose 51 percent. Road transport emissions (mostly carbon dioxide) rose 78 percent (see table 1).
The increased agricultural emissions were mainly due to increased dairy production and were partly offset by a drop in emissions from sheep as a result of reduced sheep numbers. Increasing emissions from energy generation have been moderated by an increase in the share of energy from renewable sources (Ministry for the Environment, 2017a).
New Zealand’s Intended Nationally Determined Contribution under the 2015 Paris Agreement on Climate Change is a target to reduce our greenhouse gas emissions to 30 percent below 2005 levels by 2030.
High per capita emissions
As expected from a country with a small population, New Zealand’s contribution to global gross greenhouse gas emissions is small (0.17 percent of global gross greenhouse gas emissions), but our per capita emissions are at the high end compared with most other developed nations, based on 2013 data (CAIT, 2017).
New Zealand has the second-highest level of emissions per gross domestic product unit of the 35 OECD countries and the fifth-highest emissions per capita (OECD, 2017).
New Zealand’s high per capita emissions are mainly due to our unusually large share of agricultural emissions and high per capita car ownership rate. New Zealand’s car ownership is the highest in the OECD (OECD, 2017). Our car fleet is also relatively old by OECD standards, resulting in high fuel consumption for each kilometre travelled.
New Zealand’s gross and net greenhouse gas emissions increased 24 and 64 percent respectively, from 1990 to 2015.
See Environmental indicators Te taiao Aotearoa: New Zealand’s greenhouse gas emissions
“…New Zealand currently has the fifth-highest level of emissions per person in the OECD.”
OECD, 2017

18 New Zealand’s Environmental Reporting Series: Our atmosphere and climate 2017
Table 1 Main sources of New Zealand’s greenhouse gas emissions
Emissions category Main GHG produced
Total GHG emissions in
2015 (kt CO2-e)
Percent of gross NZ GHG
emissions in 2015 Percent change
since 1990
Digestion from livestock Methane 28,091 35 + 5
Road transportation Carbon dioxide
13,282 17 + 78
Agricultural soils (direct source, eg fertilisers, animal urine, and crop residues; indirect sources, eg atmospheric deposition and nitrate leaching)
Nitrous oxide
7,917 10 + 51
Manufacturing industries and construction (iron and steel; non-ferrous metals; chemicals; pulp, paper, and print; food processing, beverage, and tobacco; non-metallic minerals; other)
Carbon dioxide
6,810 8 + 43
Industrial processes and product use (minerals; chemicals; metals; non-energy products from fuels and solvent use; substitutes for ozone-depleting substances; other)
Carbon dioxide
5,280 7 + 47
Grassland (conversion of land, primarily forest, to grassland; existing grassland)(1)
Carbon dioxide
4,652 Not applicable + 430
Public electricity and heat generation Carbon dioxide
4,041 5 + 16
Solid waste disposal Methane 3,626 5 – 4
1. Percent of gross New Zealand greenhouse gas (GHG) emissions cannot be calculated for grasslands because they are not included in gross emissions totals. Emissions in this category are largely from the loss of carbon associated with converting forest land to grassland.
Note: kt CO2-e – kilotonnes carbon dioxide equivalent. As the table only covers the main sources of New Zealand’s emissions, the percentages in column four will not add up to 100 percent.
Our emissions profile
Our agricultural emissions are large compared with other developed countries, but we have a smaller share of emissions from the energy and transport sectors (see figure 5). Unlike most countries where fossil fuel electricity generation is the primary source of carbon dioxide emissions, in New Zealand, we generate over 80 percent of our electricity from renewable resources (OECD, 2017).
Figure 6 shows the sources and relative contribution of greenhouse gas emissions in New Zealand’s emissions in 2015.
For more information on New Zealand’s greenhouse gas emissions, see New Zealand Greenhouse Gas Inventory and Interactive Emissions Tracker.

New Zealand’s Environmental Reporting Series: Our atmosphere and climate 2017 19
Figure 5
Figure 6

20 New Zealand’s Environmental Reporting Series: Our atmosphere and climate 2017
Box 3 Increasing greenhouse gas concentrations
Greenhouse gas concentrations have been measured at the Baring Head Clean Air Monitoring Station, overlooking the Cook Strait near Wellington, since 1972. Baring Head lies in the perfect position to receive southerly air from areas with no local human activity and therefore represents background concentrations of greenhouse gases over the Southern Ocean.
The Baring Head monitoring station boasts the longest-running continuous record of atmospheric carbon dioxide in the Southern Hemisphere. Data from the internationally recognised site contribute to our global understanding of greenhouse gases and the effect of human activity on Earth's atmosphere. Carbon dioxide was the first gas to be measured at the site in 1972, followed by methane in 1989 and nitrous oxide in 1996. Isotopes (variants) of these gases have been measured nearby since 1954 and are used to understand sources that contribute to the build-up of these gases.
Since 1972, levels of atmospheric carbon dioxide have increased 23 percent, from 326 parts per million to 401 parts per million in December 2016, surpassing the symbolic threshold of 400 parts per million (see 400 parts per million below). Levels of atmospheric methane and nitrous oxide increased 9 percent from 1989 and 6 percent from 1996, respectively. The Baring Head record is consistent with global trends.
Baring Head measurement station near Wellington. (Photo: Dave Allen, NIWA)
400 parts per million
In June 2016, the Baring Head monthly reading of atmospheric carbon dioxide concentrations officially exceeded 400 parts per million (NIWA, 2016). While 400 parts per million is not considered to be any kind of tipping point, it was a symbolic threshold or benchmark – a value that we will never again dip below in our lifetimes. It was also a tangible value to stay below in order to limit global temperature increases and other climate change impacts (see Climate risks: avoiding dangerous climate change).
Scientists at the Stockholm Resilience Centre have made a case for a safe planetary boundary of 350 parts per million of atmospheric carbon dioxide concentrations, with an uncertainty zone of 350–450 parts per million. According to their study, the notion of a planetary boundary for climate change defines a safe operating space in which human societies can develop and thrive (Steffen et al, 2015) – a boundary we have already breached.
Since 1972, atmospheric carbon dioxide concentrations measured at the Baring Head monitoring station have increased 23 percent.
See Environmental indicators Te taiao Aotearoa: Greenhouse gas concentrations

New Zealand’s Environmental Reporting Series: Our atmosphere and climate 2017 21
New Zealand’s carbon stocks Our native and exotic forests absorb carbon dioxide from the atmosphere through photosynthesis and store the carbon as biomass in their timber, roots, and the soil. The amount of carbon stored in living and dead forest biomass (including trunk, roots, branches, deadwood, and litter) and soil makes up a forest’s carbon stocks.
By removing carbon dioxide from the atmosphere, forests help us meet our net emissions reduction commitments. However, this is only effective if the forest area increases to match our increasing emissions. Almost every year since 1990, additional land around New Zealand has been planted in new forests, but this has not been enough to balance the amount of deforestation that has taken place over the same timeframe. From 2006 to 2015, there was about twice as much deforestation (120,115 hectares) as afforestation (64,207 hectares).
Pastures and cropland also store carbon, but it has been difficult to demonstrate clear changes in this storage over time.
Increasing carbon stocks in forests offset greenhouse gas emissions from other sources
Net greenhouse gas emissions are calculated by offsetting the amount of carbon stored in growing forests against our greenhouse gas emissions.
From 1990 to 2015, our growing forests removed an average of 8.5 million tonnes of carbon from the atmosphere each year – about three times the amount of carbon dioxide emitted by on-road vehicles countrywide (Ministry for the Environment, 2017a).
Our native forests, both mature and regenerating, are predominantly slow growing. Mature native forests store the largest amount of carbon, about 1.706 billion tonnes, because they cover the largest area (almost 6.6 million hectares, about 24 percent of our land area). However, some native trees take many decades to reach full maturity. These carbon stocks are also slow to reach their full potential, so contribute little to offset greenhouse gas emissions from other sources.
By comparison, exotic forests (such as pine), which are planted as wood supply or for erosion control, are generally fast growing, and every year since 1990, additional land has been planted in new forests. There are approximately 2 million hectares of exotic forest around the country. Our exotic forests planted for wood production store just under half as much carbon per hectare as our mature native forests.
Total carbon stored in exotic forests fluctuates over decades as forests grow from seedlings to mature trees and then are harvested and replanted. In 2015, our exotic forests planted for wood production stored about one-sixth the amount of carbon stored in our mature native
From 2006 to 2015, there was about twice as much deforestation (120,115 hectares) as afforestation (64,207 hectares).
See Environmental indicators Te taiao Aotearoa: Carbon stocks in forests
Our native forests store about 1.706 billion tonnes of carbon. (Photo: Ministry for the Environment)

22 New Zealand’s Environmental Reporting Series: Our atmosphere and climate 2017
forests. Many of these exotic forests are nearing maturity and are likely to be harvested soon, which will release carbon back into the atmosphere and will affect efforts to meet our emission-reduction targets.
Deforestation
Deforestation is when a forest is cleared and the land is used for another purpose. Logging managed forest land does not count as deforestation if the land is replanted and maintained as forest land. However, if the managed forest land is logged and converted to another land use, it is counted as a deforested area.
Figure 7 shows the proportion of land deforested from 2008 to 2014 in different regions of New Zealand. About 169,000 hectares of land around New Zealand have been converted from forest to other land use since 2000 – an area almost the size of Stewart Island. In the period 2000–2015, afforestation has been about 10 percent higher than deforestation because of intensive planting in the early years. However, in the last 10 years of that period, deforestation has been nearly twice as high as afforestation.
Figure 7
For more detail on deforestation see the Parliamentary Commissioner for the Environment report Water quality in New Zealand: Land use and nutrient pollution.
About 169,000 hectares of land around the country have been converted from forest to other land use since 2000 – an area almost the size of Stewart Island.
See Environmental indicators Te taiao Aotearoa: Carbon stocks in forests

New Zealand’s Environmental Reporting Series: Our atmosphere and climate 2017 23
State of New Zealand’s climate This section reports on a range of climate variables that together give a picture of the current and changing state of New Zealand’s climate. The longest record reported in this section is for land-surface temperature, with data back to 1909 (NIWA, 2010). For the 30 sites we report on, measurement of most other variables started in the 1960s or early 1970s – once all sites were reporting regular data for that variable. A wealth of data, collected over many decades, allows us to monitor and detect natural climate variability, long-term trends, and the human contribution to such trends.
Temperature New Zealand’s annual average land-surface temperature (measured 1.3 metres above the ground) has increased 1 degree Celsius since 1909, when measurements first began. This is consistent with the lower end of the global average increase of land temperature over a similar period (1–1.2 degrees Celsius from 1880 to 2012) due to the moderating influence of our oceanic location.
From 1909 to 2016, our annual average temperature was 12.3 degrees Celsius.
Our five warmest years occurred in the last 20 years, with 2016 the warmest. Globally, 19 of the 20 warmest years occurred within the last 20 years. The more variable and more moderate recent warming over New Zealand reflects the moderating influence of our oceanic location (NIWA, nd-b) (see figure 8).
Figure 8
Note: The unusual drop in temperature from 1992 to 1993 is a result of the volcanic eruption at Mount Pinatubo in the Philippines.
2016 was our warmest year since at least 1909.
See Environmental indicators Te taiao Aotearoa: National temperature time series

24 New Zealand’s Environmental Reporting Series: Our atmosphere and climate 2017
We can expect temperatures to continue increasing, with warming unabated to 2100 and beyond unless the world follows a low-emissions path that includes removing some carbon dioxide presently in the atmosphere (Ministry for the Environment, 2016) (see New Zealand’s future climate and climate risks and Appendix: Climate change projections for New Zealand).
Frost and warm days
Frost days are days when the minimum air temperature is 0 degrees Celsius or lower, while warm days are days when the maximum air temperature is higher than 25 degrees Celsius. Climate models project fewer cold and more warm extremes in the future (see Appendix: Climate change projections for New Zealand).
Over the 45 years between 1972 and 2016, the number of frost days decreased at 10 of the 30 measured sites and increased at 1 site, while no trend was apparent at the other 19 measured sites around New Zealand. The number of warm days increased at 8 and decreased at 1 of the 30 measured sites. No trend in warm days was apparent at 21 sites (figure 9).
Growing degree days
Growing degree days measure heat accumulation, which can be used to predict plant, and subsequently, animal growth. For example, they can be used to predict when certain flowers will bloom or insects will emerge from dormancy. Growing degree days count the total number of degrees Celsius the average temperature each day is above a base temperature, commonly a threshold of 10 degrees Celsius.
Plant and animal cycles are interdependent across the food chain. Small changes, for example, in the timing of insect reproduction, can mean that species further up the food chain miss out
on a crucial food source. The greater the change in timings, the more pressure species further up the food chain experience. In extreme cases, some species are threatened with extinction.
Our increasing temperatures have resulted in a greater number of growing degree days across the country (see figure 9) between 1972 and 2016. Of 30 measured sites, 16 showed increasing trends.
We do not yet have data to assess the impact of changes in growing degree days, but we can expect the changes to both challenge and provide opportunities for our agricultural industries. For example, some plants may suffer, while new varieties may be able to be grown in novel conditions. We may also experience longer growing seasons.
Between 1972 and 2016, the number of frost days decreased at 10 of 30 measurement sites.
See Environmental indicators Te taiao Aotearoa: Frost and warm days
Our increasing temperatures have resulted in a greater number of growing degree days across the country between 1972 and 2016.
See Environmental indicators Te taiao Aotearoa: Growing degree days
We are experiencing a greater number of growing degree days across the country. (Photo: NIWA)

New Zealand’s Environmental Reporting Series: Our atmosphere and climate 2017 25
Figure 9

26 New Zealand’s Environmental Reporting Series: Our atmosphere and climate 2017
Sunshine
Sunshine is important for plant growth and our mental and physical well-being, as well as benefiting tourism and recreation. However, it can also increase our risk of skin damage (see UV sunlight and health).
From 1972 to 2016, sunshine hours increased at 27 of 30 locations around New Zealand (see figure 10). On average, most places around the country received between around 1,700 and 2,100 hours of sunshine each year. The increase in sunshine hours is because of reduced cloud cover (Liley, 2009).
Cloud distribution patterns in the atmosphere appear to be changing globally, with increasing greenhouse gas concentrations a major driver for this change (Norris et al, 2016). The changing patterns are consistent with storm tracks shifting towards the poles and subtropical dry zones expanding. As a result of these changes, we can expect less cloud cover and more sunshine over New Zealand (Norris et al, 2016).
Figure 10
From 1972 to 2016, most places around New Zealand received more sunshine.
See Environmental indicators Te taiao Aotearoa: Sunshine hours

New Zealand’s Environmental Reporting Series: Our atmosphere and climate 2017 27
Rainfall The impacts of high or low rainfall can be positive or negative. Rainfall is a valuable source of water for crops and gardens, as well as a generator of hydroelectricity. However, rainfall can restrict some recreational activities and has serious impacts when it leads to flooding, or when a lack of it leads to drought.
Annual and seasonal rainfall
Annual and seasonal rainfall are highly variable and depend on short-term weather patterns and long-term climate oscillations such as El Niño Southern Oscillation, the Interdecadal Pacific Oscillation, and the Southern Annular Mode.
Geographically, annual average rainfall varies from less than 400 millimetres in places like Central Otago to over 4,000 millimetres in mountainous areas such as the Tararua range, and even more in the Southern Alps (an average of over 6,000 millimetres has been recorded at Milford Sound).
Rainfall also varies seasonally, with more rain in winter than in summer for most of the country except the southern half of the South Island, where most rain falls in summer. Despite no clear trend in annual rainfall, seasonal rainfall in some locations showed trends (see figure 11). For example, between 1960 and 2016, winter rainfall in Whangarei, Wellington, and New Plymouth decreased while summer rainfall increased in Dunedin and Kerikeri.
Climate models project that rainfall is very likely to increase on average over winter and spring in the south of the South Island and west of both the North and South islands (see Appendix: Climate change projections for New Zealand). Meanwhile, drier average conditions are expected in the east and north. In summer, wetter conditions are likely in the north and east of both islands (Ministry for the Environment, 2016).
Intense rainfall events
Changes in the frequency, intensity, spatial extent, duration, and timing of weather and climate extremes are expected to result from a changing climate (IPCC, 2012). Some reasons for this are well understood. For example, the natural global water cycle is intensifying as the atmosphere warms. This leads to increased evaporation, which may worsen droughts but may also increase the frequency of intense rainfall events because a warmer atmosphere can hold more water.
Between 1960 and 2016, winter rainfall in Whangarei, Wellington, and New Plymouth decreased while summer rainfall in Dunedin and Kerikeri increased.
See Environmental indicators Te taiao Aotearoa: Annual and seasonal rainfall
Between 1960 and 2016, the proportion of intense annual rainfall events increased in Napier and Timaru.
See Environmental indicators Te taiao Aotearoa: Rainfall intensity

28 New Zealand’s Environmental Reporting Series: Our atmosphere and climate 2017
Figure 11
For most of New Zealand, there is no clear evidence that intense rainfall events have changed between 1960 and 2016. However, there were trends at some locations (see figure 12):
• the proportion of annual rainfall occurring in intense events (in the 95th percentile) decreased at 4 of 30 locations (Auckland, New Plymouth, Rotorua, and Taupō) and increased at two (Napier and Timaru)
• the annual maximum one-day rainfall amounts decreased at 4 of 30 locations (Auckland, Hamilton, Taupō, and New Plymouth) and increased at two (Timaru and Dunedin).

New Zealand’s Environmental Reporting Series: Our atmosphere and climate 2017 29
As the climate changes, the number of intense rainfall events is expected to increase over most of the country (except for Northland and Hawke’s Bay), with up to a 20 percent increase of events possible in the south of the South Island (Ministry for the Environment, 2016) (see Appendix: Climate change projections for New Zealand).
The extent to which a specific individual event is influenced by increasing greenhouse gas concentrations is difficult to determine. Many factors combine to produce a specific event, and because such events are rare, there are usually only a few examples of past events for any given location (Herring et al, 2016).
So far, published studies have identified increasing greenhouse gas concentrations contributing to two recent New Zealand flooding events: 2011 – a flood in Golden Bay (Dean et al, 2013); and 2014 – a flood in Northland (Rosier et al, 2015). These studies indicate that, while such events might have happened in the absence of high greenhouse gas emissions, they were more extreme than they would have been without the warming caused by additional greenhouse gases in the atmosphere.
Wind Wind is a valuable source of renewable energy, but strong gusts can damage property and trees and cause havoc for transport, communications, and power.
Average annual maximum wind gusts using data between 1972 and 2016 showed Wellington, Invercargill, and Gore were the windiest populated centres in the country, while Reefton, Gisborne, and Queenstown were the least windy.
In this report, we analysed extreme wind using two statistics: the number of days each year with a maximum wind gust in the 99th percentile and the annual highest maximum gust.
Between 1972 and 2016, the frequency and magnitude of extreme wind decreased at about one-third of sites across New Zealand (see figure 12). Over this period, the number of days a year with a gust that is extreme for that location decreased at 10 of 30 sites (Whangarei, Hamilton, Tauranga, Rotorua, Napier, Wellington, Blenheim, Christchurch, Timaru, and Dunedin) and increased at two sites (New Plymouth and Queenstown). New Plymouth also experienced an increase in highest maximum wind gusts.
Projections indicate climate change may alter the occurrence of extreme wind events, with the strength of extreme winds expected to increase over the southern half of the North Island and the South Island, especially east of the Southern Alps (Ministry for the Environment, 2016) (see Appendix: Climate change projections for New Zealand).
Between 1972 and 2016, the frequency and magnitude of extreme wind decreased at about one-third of sites across New Zealand.
See Environmental indicators Te taiao Aotearoa: Extreme wind

30 New Zealand’s Environmental Reporting Series: Our atmosphere and climate 2017
Figure 12
New Zealand’s Environmental Reporting Series: Our atmosphere and climate 2017 31
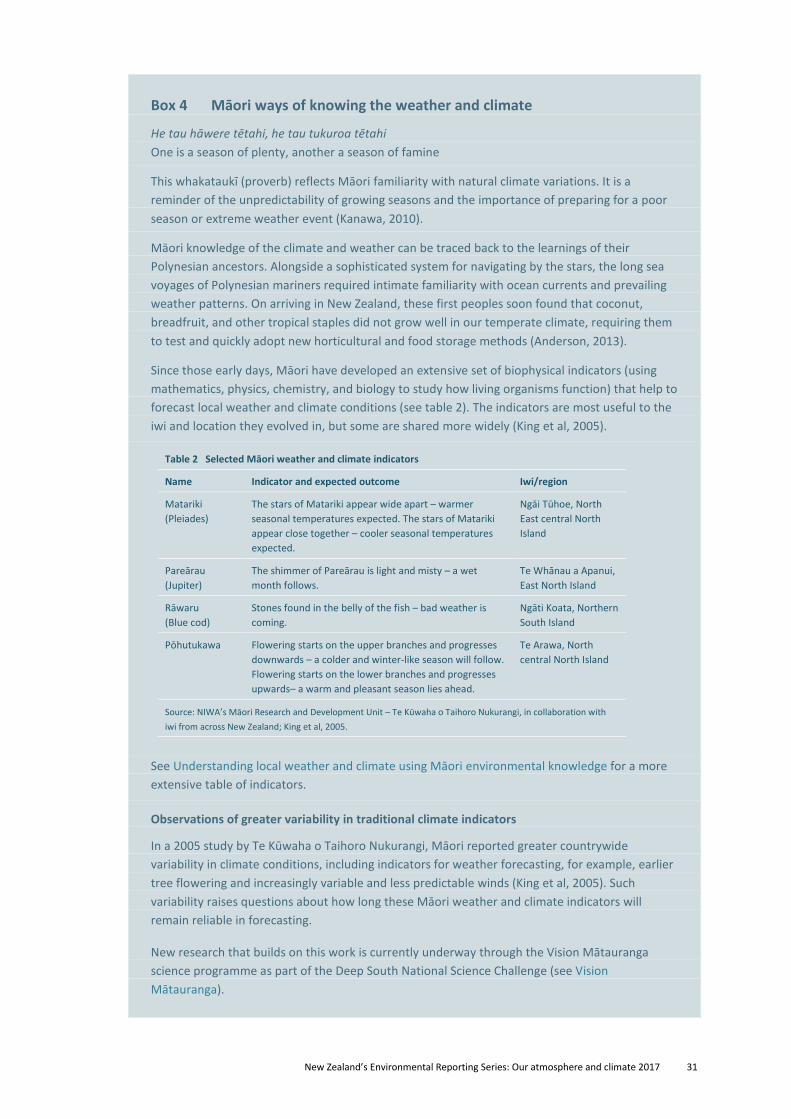
Box 4 Māori ways of knowing the weather and climate
He tau hāwere tētahi, he tau tukuroa tētahi One is a season of plenty, another a season of famine
This whakataukī (proverb) reflects Māori familiarity with natural climate variations. It is a reminder of the unpredictability of growing seasons and the importance of preparing for a poor season or extreme weather event (Kanawa, 2010).
Māori knowledge of the climate and weather can be traced back to the learnings of their Polynesian ancestors. Alongside a sophisticated system for navigating by the stars, the long sea voyages of Polynesian mariners required intimate familiarity with ocean currents and prevailing weather patterns. On arriving in New Zealand, these first peoples soon found that coconut, breadfruit, and other tropical staples did not grow well in our temperate climate, requiring them to test and quickly adopt new horticultural and food storage methods (Anderson, 2013).
Since those early days, Māori have developed an extensive set of biophysical indicators (using mathematics, physics, chemistry, and biology to study how living organisms function) that help to forecast local weather and climate conditions (see table 2). The indicators are most useful to the iwi and location they evolved in, but some are shared more widely (King et al, 2005).
See Understanding local weather and climate using Māori environmental knowledge for a more extensive table of indicators.
Observations of greater variability in traditional climate indicators
In a 2005 study by Te Kūwaha o Taihoro Nukurangi, Māori reported greater countrywide variability in climate conditions, including indicators for weather forecasting, for example, earlier tree flowering and increasingly variable and less predictable winds (King et al, 2005). Such variability raises questions about how long these Māori weather and climate indicators will remain reliable in forecasting.
New research that builds on this work is currently underway through the Vision Mātauranga science programme as part of the Deep South National Science Challenge (see Vision Mātauranga).
Table 2 Selected Māori weather and climate indicators
Name Indicator and expected outcome Iwi/region
Matariki (Pleiades)
The stars of Matariki appear wide apart – warmer seasonal temperatures expected. The stars of Matariki appear close together – cooler seasonal temperatures expected.
Ngāi Tūhoe, North East central North Island
Pareārau (Jupiter)
The shimmer of Pareārau is light and misty – a wet month follows.
Te Whānau a Apanui, East North Island
Rāwaru (Blue cod)
Stones found in the belly of the fish – bad weather is coming.
Ngāti Koata, Northern South Island
Pōhutukawa Flowering starts on the upper branches and progresses downwards – a colder and winter-like season will follow. Flowering starts on the lower branches and progresses upwards– a warm and pleasant season lies ahead.
Te Arawa, North central North Island
Source: NIWA’s Māori Research and Development Unit – Te Kūwaha o Taihoro Nukurangi, in collaboration with iwi from across New Zealand; King et al, 2005.

32 New Zealand’s Environmental Reporting Series: Our atmosphere and climate 2017
Impacts of a changing climate This section reports on the impacts of a changing climate. The modest number of impact measures in this section is in part due to the difficulty of attributing long-term climate change to changes in natural and human systems that are typically variable and complex.
We use our own data to report on ocean warming and acidification, sea-level rise, glaciers, soil moisture and drought, and the occurrence of food- and water-borne diseases and influenza. We also draw from New Zealand-based research to discuss three case studies on the impacts on New Zealand’s biodiversity associated with temperature increases.
Oceans Our marine environment 2016 discusses in depth the effects of our changing climate on our oceans. The main points are summarised below.
Acidity
Globally, the oceans are increasing in acidity as they absorb some of the additional carbon dioxide in the atmosphere emitted by human activities. The longest record we have for measuring the acidity of New Zealand’s oceans is for the subantarctic ocean off the Otago coast. The record shows that the pH of the east subantarctic ocean has decreased 0.03 units (meaning increased acidity) since 1998. We expect more data from more locations to be available in the future.
The rate of decrease (0.0015 units per year) is consistent with global trends (Bates et al, 2014). Globally, the average pH of ocean surface waters has decreased by about 0.1 units since the beginning of the industrial era (IPCC, 2013). While this decrease may seem small, the pH scale is logarithmic – so a decrease in pH by 0.1 units is equivalent to a 26 percent increase in acidity (IPCC, 2013).
The impacts of this acidification are still being investigated. However, it could cause widespread changes, and marine experts rank it as the most serious threat to our marine habitats (MacDiarmid et al, 2012). See also Our marine environment 2016.
Warming
Sea-surface temperatures fluctuate naturally with the seasons and across decades. Over the last century, our sea-surface temperature has increased 0.71 degrees Celsius (Mullan et al, 2010), matching worldwide increases (Hartmann et al, 2013). However, recent satellite data, only available since 1993, show no trend in sea-surface temperature change in the Tasman Sea and New Zealand’s oceanic, subtropical, and subantarctic waters. This result is not surprising given the short time these data have been available and the year-to-year temperature variations. See also Our marine environment 2016.
The pH of the ocean off the Otago coast has decreased 0.03 units (meaning increased acidity) since 1998.
See Environmental indicators Te taiao Aotearoa: Ocean acidification
New Zealand’s annual average sea-surface temperatures measured by satellite have not shown a trend over the past 20 years.
See Environmental indicators Te taiao Aotearoa: Oceanic sea-surface temperature

New Zealand’s Environmental Reporting Series: Our atmosphere and climate 2017 33
Implications
Ocean acidification and warming may cause widespread harm to marine ecosystems, for example, by reducing the survival and growth rates of marine species, extending or reducing the range of species, and modifying habitats. The impacts could occur across New Zealand’s entire ocean area, with implications for biodiversity, marine-based industries such as commercial fishing and aquaculture, and Māori customary practice (see Our marine environment 2016).
The marine environment is particularly important to the Māori economy (including fishing operations, incomes, and ocean-based investment). As at 2015, kaimoana (fish, crustaceans, such as crayfish and shrimp, and molluscs, such as shellfish) was the top export commodity of Māori authorities (Statistics NZ, 2016).
Sea level
Sea level has been rising around the globe as a result of the world’s oceans expanding as they warm and because ice previously stored in glaciers and in parts of the polar ice sheets has been melting. Globally, sea level rose 19 centimetres between 1901 and 2010 (IPCC, 2014a).
However, sea-level change is not uniform around the world. This is because of the rising and sinking of land relative to sea, regional variations in ocean temperatures and circulation, and the adjustment of Earth’s gravitational field to the changing ice sheets. For the same reasons, sea-level rise is not consistent around New Zealand’s coastline.
Our coastal sea level is rising, with increases of up to 22 centimetres since 1916 (depending on local land motion), recorded at monitoring sites around the country. Over this period, sea level rose an average of 1.8 millimetres a year across monitoring sites. This agrees with the global record from tide gauges of about 1.7 millimetres a year between 1901 and 2010.
In the satellite era (since 1993), global mean sea level has risen about 3.4 millimetres per year (University of Colarado, nd). It is likely that similarly high rates occurred between 1920 and 1950. Satellite measurements have the significant advantage of near-global coverage and are not affected by local land movements. Since 1993, data from satellites and tide gauges has been in agreement. Globally, average sea levels will continue to rise at a faster rate in the 21st century (IPCC, 2014a). See also Our marine environment 2016.
Implications
Sea-level rise is a long-term threat that will have an increasing effect on the coastal marine zone. Rising sea levels and more intense heavy rainfall events associated with climate change are projected to increase coastal flooding and erosion, which may in turn cause damage to coastal ecosystems, housing, and critical infrastructure, such as roading, sewage, and power supply (Reisinger et al, 2014).
Since 1916, our coastal sea level has risen up to 22 centimetres at monitoring sites around the country.
See Environmental indicators Te taiao Aotearoa: Coastal sea-level rise
Long-term data on sea-surface temperature show a statistically significant trend, increasing 0.71 degrees Celsius over the last century (Mullan et al, 2010).

34 New Zealand’s Environmental Reporting Series: Our atmosphere and climate 2017
Globally, the sea level is projected to rise by about 20 to 40 centimetres by 2060 (relative to 1986–2005) (IPCC, 2013). While New Zealand’s sea-level rise has aligned with the global average so far, at least one study projected that our sea-level may rise a little faster than the global average in the future (Ackerley et al, 2013). Moreover, with rising seas, we can expect tides, waves, and storm surges (commonly known as extremely long, slow waves) to reach further inland more regularly, resulting in more frequent and serious flooding (PCE, 2015).
For Māori, sea-level rise poses threats to a mix of interests, assets, and values (King et al, 2010; Manning et al, 2015). Many Māori communities have ancestral ties with coastal areas, and relationships are maintained (often at a distance) with cultural heritage (eg marae and burial grounds) and food-gathering sites. These interests and activities are deeply connected with identity and well-being. Some communities face hard decisions about how long they can remain living near coastal areas prone to erosion, storm surges, and peak tides associated with sea-level rise.
There is an increasing recognition and concern about the impacts of coastal erosion and sea-level rise on cultural sites, including early settlement sites and burial grounds (McFadgen, 2007). As sites are lost to erosion or the encroaching sea, we lose the knowledge they offer about early Māori and European settlement.
A 2013 study of the impact of climate change on the archaeology of the coastline in the Whangarei district suggested increases in the likelihood and severity of detrimental impacts on archaeological sites, one-third of which were already threatened by other pressures. Middens (piles of pre-historic or historic domestic refuse, such as discarded shells or animals bones, particularly around a cooking area) and small sites of early Māori occupation are particularly at risk (Bickler et al, 2013).
Extreme coastal flooding, usually due to storm surges coinciding with very high tides, already causes disruption and damage in some places around New Zealand’s coastline. As sea levels continue to rise, local councils will almost certainly face difficult decisions around what investments to make towards protecting land and existing structures versus retreating from some areas and helping communities adapt. Some local councils are already planning and adapting to new conditions (see box 5).

New Zealand’s Environmental Reporting Series: Our atmosphere and climate 2017 35
Box 5 The implications of sea-level rise for South Dunedin
South Dunedin lies on a spread of low-lying flats between Otago Harbour and the Pacific Ocean. The urban area is generally based on land reclaimed from coastal dunes and marshlands in the 1880s. As a result, the groundwater table lies close to the surface and has many direct underground connections to the Pacific Ocean and Otago Harbour.
In 2015, nearly 2,700 homes, 116 businesses, and 35 kilometres of roads lay less than 50 centimetres above the spring high-tide mark, with more than 70 percent of homes lying lower than 25 centimetres elevation (PCE, 2015).
The global projections of the sea level rising by 20 to 40 centimetres by 2060 (IPCC, 2014a) mean South Dunedin’s water table will rise, which is likely to increase surface ponding and flooding after heavy rain. Such flooding can damage roads, pipes, cables, buildings (which will also experience ongoing dampness), and parks and other recreational facilities. The projected sea-level rise could cause extreme high-water events to occur every two years at Port Otago (PCE, 2015).
In June 2015, prolonged heavy rain caused extensive flooding when drainage systems were overwhelmed. Numerous roads and properties were damaged. The Dunedin City Council had already commissioned an assessment of options for protecting South Dunedin in the case of sea-level rise. Options range from building an underground sea wall to prevent seawater pushing up groundwater to pumping water away from the ground to sinking ‘dewatering wells’ along the coast to absorb excess water. At the same time, the Council is investigating the viability of a managed retreat (PCE, 2015).
Flooding in South Dunedin in June 2015. (Photo: Otago Daily Times)

36 New Zealand’s Environmental Reporting Series: Our atmosphere and climate 2017
Glaciers
New Zealand’s mountains are home to 3,144 large glaciers (each covering more than 1 hectare). Most of these glaciers are located along the Southern Alps of the South Island. However, there are also 18 on the flanks of Mount Ruapehu in the North Island (Chinn, 2001).
Glacier ice volume is strongly influenced by temperature and precipitation. Changes to ice accumulation and melting can affect ecological and hydropower resources downstream, as well as important cultural values and tourism.
Over the past 20 years, almost all the world’s glaciers have been shrinking (IPCC, 2013). New Zealand’s glacier ice volume decreased 25 percent from 1977 to 2016 (see figure 13). This equates to a loss of 13.3 cubic kilometres of ice.
Figure 13
Note: A glacial ice year runs from 1 April to 31 March.
Implications
New Zealand’s longest glacier, the Tasman, has retreated roughly 5 kilometres since 1980. While this means the glacier is more difficult to climb, it has presented a different tourism opportunity. Guided boat trips are now held on lakes that have formed over the last 30 years (Ministry for the Environment, 2017b).
The West Coast’s Fox and Franz Josef glaciers have each retreated about 3 kilometres since 1940, and in 2012 and 2014 respectively, they became too dangerous for tourists to be guided onto them. This marked the end of almost a century of glacier guiding from the valley floor (Anderson et al, 2016).
While climate warming will lead to loss of frozen water resources, the magnitude, timing, and distribution of changes in meltwater from New Zealand’s glaciers is unclear.
40
45
50
55
60
1981 1986 1991 1996 2001 2006 2011 2016
Ice volume (km3)
All glaciers
New Zealand's annual glacier ice volume (km3) 1977–2016
Source: NIWA
Our glacier ice volume decreased 25 percent from 1977 to 2016.
See Environmental indicators Te taiao Aotearoa: Annual glacier ice volumes

New Zealand’s Environmental Reporting Series: Our atmosphere and climate 2017 37
Native biodiversity New Zealand’s native flora and fauna evolved in near isolation, forming our country into a biodiversity ‘hotspot’ that features many species found nowhere else on Earth. Despite humans only arriving in this country comparatively recently (circa 1250AD), our biodiversity has declined rapidly because of the cumulative effects of land disturbance, overexploitation of resources, and introduced pest plants and animals. A changing climate has the potential to exacerbate these existing pressures.
It is difficult to predict the specifics of the impact of a changing climate on our native flora and fauna. This is because biodiversity and supporting ecological systems are complex; one change to a system, however small, can have compounding effects. However, we do know that our biodiversity is already vulnerable to pests and diseases (see box 6). A warming atmosphere and ocean will affect the range, distribution, and success of pest and weed species, which are often more resilient to harsher environmental pressures. In addition, we know that the distribution or breeding success of some species is tied to climate (mainly temperature and rainfall), and those species will be affected by climate change.
Box 6 presents three examples of how climate change is already thought to be affecting three species resident in New Zealand.
Implications
We can expect to face possibly costly decisions around how we manage the effects of a changing climate for our unique and celebrated native biodiversity. This includes decisions about relocating vulnerable species whose ideal climatic conditions are expected to shrink.
Changes in climate could well affect native fauna and flora that are taonga (treasures) to Māori. This poses an additional challenge on Māori ability to exercise kaitiakitanga (environmental stewardship), a cultural value that is at the heart of their identity (Selby et al, 2010). The well-being of our natural systems is of paramount importance to whānau, hapū, iwi, and Māori business values.
North Brother Island tuatara. (Photo:
38 New Zealand’s Environmental Reporting Series: Our atmosphere and climate 2017
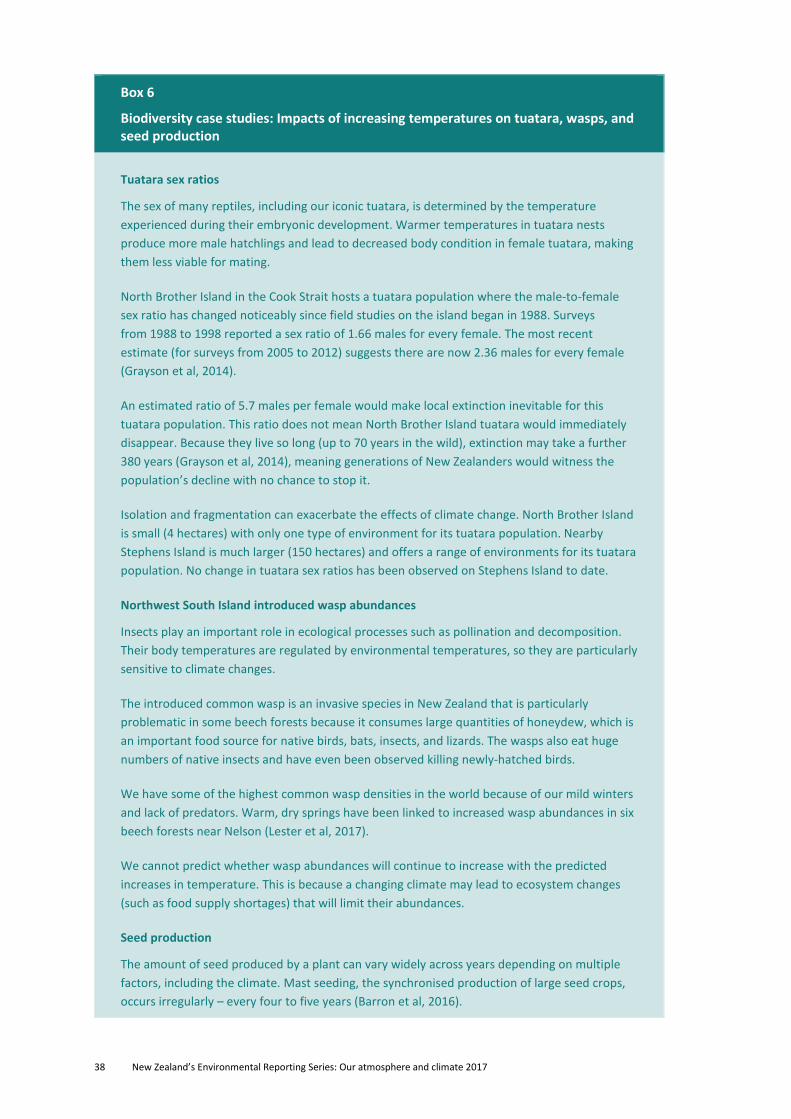
Box 6
Biodiversity case studies: Impacts of increasing temperatures on tuatara, wasps, and seed production
Tuatara sex ratios
The sex of many reptiles, including our iconic tuatara, is determined by the temperature experienced during their embryonic development. Warmer temperatures in tuatara nests produce more male hatchlings and lead to decreased body condition in female tuatara, making them less viable for mating.
North Brother Island in the Cook Strait hosts a tuatara population where the male-to-female sex ratio has changed noticeably since field studies on the island began in 1988. Surveys from 1988 to 1998 reported a sex ratio of 1.66 males for every female. The most recent estimate (for surveys from 2005 to 2012) suggests there are now 2.36 males for every female (Grayson et al, 2014).
An estimated ratio of 5.7 males per female would make local extinction inevitable for this tuatara population. This ratio does not mean North Brother Island tuatara would immediately disappear. Because they live so long (up to 70 years in the wild), extinction may take a further 380 years (Grayson et al, 2014), meaning generations of New Zealanders would witness the population’s decline with no chance to stop it.
Isolation and fragmentation can exacerbate the effects of climate change. North Brother Island is small (4 hectares) with only one type of environment for its tuatara population. Nearby Stephens Island is much larger (150 hectares) and offers a range of environments for its tuatara population. No change in tuatara sex ratios has been observed on Stephens Island to date.
Northwest South Island introduced wasp abundances
Insects play an important role in ecological processes such as pollination and decomposition. Their body temperatures are regulated by environmental temperatures, so they are particularly sensitive to climate changes.
The introduced common wasp is an invasive species in New Zealand that is particularly problematic in some beech forests because it consumes large quantities of honeydew, which is an important food source for native birds, bats, insects, and lizards. The wasps also eat huge numbers of native insects and have even been observed killing newly-hatched birds.
We have some of the highest common wasp densities in the world because of our mild winters and lack of predators. Warm, dry springs have been linked to increased wasp abundances in six beech forests near Nelson (Lester et al, 2017).
We cannot predict whether wasp abundances will continue to increase with the predicted increases in temperature. This is because a changing climate may lead to ecosystem changes (such as food supply shortages) that will limit their abundances.
Seed production
The amount of seed produced by a plant can vary widely across years depending on multiple factors, including the climate. Mast seeding, the synchronised production of large seed crops, occurs irregularly – every four to five years (Barron et al, 2016).

New Zealand’s Environmental Reporting Series: Our atmosphere and climate 2017 39
Mast seeding creates an abundance of food that is vital for some of our native bird species’ survival but also dramatically increases introduced predator numbers (eg mice, rats, and mustelids such as weasels, stoats, and ferrets).
Research on five native plants species (beech, hīnau, mountain daisy (Celmisia), snow tussock (Chionochloa flavescens), and flax) highlights that masting for these species is triggered by temperature variation. Specifically, an increase in temperature from one summer to the next stimulates the production of more seeds in the following summer (Kelly et al, 2013). Our understanding of this process allows us to predict large masting events and plan animal pest management strategies (see figure 14).
The year-to-year temperature difference trigger means masting events won’t occur every year. Even though our temperatures are increasing over time, they do not increase in a straight line – some years will be cooler than the previous year. We still have a lot to learn about the potential impact of climate change on masting events, and it is an area that requires ongoing research.
Figure 14

40 New Zealand’s Environmental Reporting Series: Our atmosphere and climate 2017
Soil moisture and drought Soil moisture is vital for plant growth. When plants cannot access the water they need, growth is reduced, affecting crops and food for livestock and native biodiversity. A drought can have significant social and economic costs, particularly for rural communities.
From 1972 to 2016, our soils became drier at 7 of 30 sites. Soil moisture increased at only one site – Timaru. Over the three years from 2013 to 2016, most of New Zealand had drier than normal soils.
The frequency and intensity of drought in drought-prone regions are expected to increase as temperatures rise and rainfall patterns change (Ministry for the Environment, 2016).
The 2012–13 drought was one of the most extreme New Zealand had experienced in the previous 41 years and was unusual for being especially widespread, affecting the entire North Island and the west coast of the South Island. The worst effects were felt in the North Island (southern Northland, South Auckland, Waikato, Bay of Plenty and the central plateau, Wairarapa, Rangitikei, Ruapehu, Gisborne, and Hawke’s Bay), as well as parts of the north and west of the South Island (Ministry for Primary Industries, 2013).
The New Zealand Treasury estimated that reduced agricultural production alone from the 2012–13 drought would reduce GDP by about 0.7 percent or about $1.5 billion in 2013 (New Zealand Treasury, 2013). Research suggests that, while not causing the drought, human-induced climate change played an important role in its intensity (Harrington et al, 2014).
Drought in Wairarapa 2012–13. (Photo: NIWA)
Most of New Zealand had drier than normal soils over the period 2013–16.
See Environmental indicators Te taiao Aotearoa: Soil moisture and drought

New Zealand’s Environmental Reporting Series: Our atmosphere and climate 2017 41
Implications
Soil moisture and drought is one indicator of a range of potential future impacts for agriculture and other primary industries. Impacts are regionally and locally specific and may be both positive and negative. Alongside drought, for example, impacts may include: change in yield and quality of pasture, trees, broad-acre crops (such as wheat, barley, oats), and pasture species; changes in pressures from weeds, pests, and diseases; stress on animals and plants from increased warm days (above 25 degrees Celsius); and water shortages and increased irrigation demand (Clark et al, 2012).
The Māori economy is vulnerable to climate impacts as a large proportion of Māori authorities’ operations are directly or indirectly involved in natural resource management (Statistics NZ, 2016), for example, farming and forestry. In 2015, agriculture accounted for one in five Māori authority enterprises (Statistics NZ, 2016).
Occurrence of food- and water-borne diseases and influenza The natural variability of New Zealand’s climate can influence the prevalence of diseases from year to year and season to season. In the longer term, the incidence of such diseases may increase or decrease as the climate warms and rainfall patterns change (Hambling, 2012; Tompkins et al, 2012; Lal et al, 2015).
We report on data for the incidences of disease caused by the bacteria Campylobacter and Salmonella and water-borne disease caused by the microscopic parasite Cryptosporidium. Data from 2007 to 2016 associate warmer summer months with higher incidences of Salmonellosis and Campylobacter, while incidences of Cryptosporidiosis peak in spring.
A warming climate may influence the prevalence of cold-related illness over the long term. We report on the occurrence of influenza. Data from 2000 to 2016 correlate the year’s cooler months with higher incidences of influenza.
Implications
We can expect to face a range of climate-related health risks as our climate continues to warm. Direct impacts of climate change may include increased exposure to heat waves, flooding, and fires. Indirect impacts may include exposure to increasing pollen levels and allergenicity (and therefore risk of allergies) and new diseases borne on carriers (such as mosquitos) whose ranges are influenced by climatic factors. Other indirect health risks stem from socio-economic and mental health stressors, for example, through climate-related migration, housing pressures, and reduced food security (Royal Society Te Āparangi, 2017).
A Māori world view of health incorporates the importance of the state and condition of the environment to identity, health, and well-being, recognising the deep kinship between humans and the natural world (Harmsworth & Awatere, 2013). Thus, climate change could affect Māori sense of well-being, for example, the anxiety and grief at being forced to leave ancestral homelands due to sea-level rise and losing access to traditional coastal food gathering sites.
Data from 2007 shows a clear link between warmer summer months and the incidence of some food-borne diseases.
See Environmental indicators Te taiao Aotearoa: Occurrence of food- and water-borne diseases
Data from 2000 correlate the year’s cooler months with higher incidences of influenza.
See Environmental indicators Te taiao Aotearoa: Occurrence of influenza

42 New Zealand’s Environmental Reporting Series: Our atmosphere and climate 2017
New Zealand’s future climate and climate risks The speed and scale of changes to New Zealand’s climate, and the subsequent risks that we face from climate change, depend on what the global community does about greenhouse gas emissions and how the climate system responds to those emissions.
To assist decision-making in the face of uncertainty about future global emissions, scientists use models to project climate change under different concentration pathways, associated with low to high emissions during the 21st century. Over 40 climate models have been developed by different research agencies around the world, and each simulation has different strengths and weaknesses for particular regions and climate properties. In general, they show impressive skill in simulating details of the climate system and continue to improve as we learn more. Observations and qualitative comparisons supported by models provide important evidence when assessing how human activities affect climate change.
Figure 15 shows the distribution of a range of projected climate-related changes across New Zealand. More detailed information on these projections is provided in Appendix: Climate change projections for New Zealand.
Climate risks: avoiding dangerous climate change
The size of the risks New Zealand faces from future climate change depends on the extent to which countries reduce their greenhouse gas emissions (mitigation). The faster and larger the reduction, the lower the risk of severe and enduring impacts on the natural environment and people’s lives.
From another world view, our future climate may depend on a much broader response from global citizens than lowering emissions alone. At Ministry for the Environment consultations with hapū and iwi in 2007, Māori elders described the changing climate as an imbalance in the natural order that resulted from people becoming distanced from their relationships with each other, the environment, and their ancestors.
Global emission scenarios and climate risk
Understanding climate risks from a global perspective is important because New Zealand is both vulnerable to some of these risks and cannot be isolated from impacts of global warming experienced by the rest of the world. Figure 16 shows two possible pathways of greenhouse gas emissions and atmospheric greenhouse gas concentrations with associated global warming and climate-related risks – low and high. High risk, for example, indicates severe, widespread, and irreversible impacts. Many risks will be particularly challenging for the least developed countries and vulnerable communities, given their limited capacity for adapting to change (IPCC, 2014b).
The low-emissions scenario (RCP2.6) would require countries to achieve ambitious reductions in emissions and is likely to result in global warming kept below 2 degrees Celsius above pre-industrial temperatures. The high emissions scenario (RCP8.5) assumes no additional efforts are made to constrain emissions (IPCC, 2014a).
Actions to achieve the low-emissions scenario include capturing carbon during industrial processes and storing it in long-term reservoirs, such as the deep ocean, or enhancing natural processes that increase the removal of carbon from the atmosphere, for example, through afforestation.

New Zealand’s Environmental Reporting Series: Our atmosphere and climate 2017 43
Without additional measures to reduce greenhouse gas emissions beyond those already in place today (a high emissions scenario), then global warming by the end of the 21st century is likely to be between 2.6 and 4.8 degrees Celsius (relative to 1986–2005)(see box 7). This magnitude of warming will lead to high to very high global risk of severe, widespread impacts for natural and human systems (IPCC, 2014a), with far-reaching implications for humanity.
Figure 15

44 New Zealand’s Environmental Reporting Series: Our atmosphere and climate 2017
Figure 16 A global perspective on climate-related risks
Source: IPCC, 2014b
Note: The figure on the right shows five integrative reasons for concern about human influence on the climate system. Unique and threatened systems includes ecosystems and cultures, some of which are already at risk from climate change. Extreme weather events includes heat waves, extreme precipitation, and coastal flooding. Distribution of impacts recognises that risks are generally greater for disadvantaged people and communities. Global aggregate impacts includes impacts to Earth’s biodiversity and overall global economy. Large-scale singular events recognises that with increasing warming some physical systems or ecosystems may be at risk of abrupt and irreversible changes. For more detail see IPCC (2014b).
Box 7 1.5 degrees… 2 degrees… 4 degrees Celsius and beyond Human civilisation has never experienced global average temperatures 2 degrees Celsius warmer than pre-industrial times. For at least the last 10,000 years, the global average temperature has fluctuated by less than 1 degree Celsius (Marcott et al, 2013). However, without efforts to reduce greenhouse gas emissions and atmospheric concentrations, Earth could warm by more than 4 degrees Celsius – making it warmer than any time since Homo sapiens first appeared.
Scientists have warned that the greater the magnitude of global warming, the greater the risk of severe and pervasive detrimental impacts on humanity and the world’s natural ecosystems (IPCC, 2014a). The difference between 1.5 and 2 degrees warming presents increased risk for some vulnerable ecosystems and parts of the world, for example, low-lying Pacific islands.
The 2015 Paris Agreement is an international agreement instigated under the United Nations Framework Convention on Climate Change. The Agreement seeks to hold the increase in the global average temperature to well below 2 degrees Celsius above pre-industrial levels and to pursue efforts to limit the temperature increase to 1.5 degrees Celsius. This would limit the amount of warming and other climate changes New Zealand will experience.
Whether the global community can keep warming below 2 degrees Celsius is one of the biggest uncertainties in climate predictions. While the Paris Agreement requires parties to take stock of progress and increase the ambition of their emissions reduction targets, some scientists think it is highly unlikely that we can keep warming below 2 degrees Celsius because countries’ current pledges to reduce emissions are insufficient (Rogelj et al, 2016). Meeting this goal will require substantial and sustained global reductions of greenhouse gas emissions (IPCC, 2014a). Any delay in reducing emissions will increase the size of the emission reductions required in the future.

New Zealand’s Environmental Reporting Series: Our atmosphere and climate 2017 45
Adaptation and vulnerabilities
Alongside global mitigation, the future impacts of climate change on New Zealand also depend on the extent to which New Zealand communities, businesses, and governments are able to adjust to a changing climate (adaptation). Adaptation includes, for example, local councils’ flood protection and spatial planning measures and the introduction of drought-resistant plant species in agriculture.
For example, after serious flooding in 2005, Tauranga City Council reviewed and upgraded its stormwater services to cope with the large rainfall events that are expected to occur with climate change (Ministry for the Environment, 2008).
Communities with fewer resources and less resilience are more likely to be negatively affected by climate risks such as flooding and extreme weather events. The resilience of New Zealand communities will depend on their location, the adequacy of existing local infrastructure, the resources communities have available to respond and adapt, and the influence of other pressures such as population growth or decline.
Climate change is highly likely to exacerbate existing economic and social disparities for Māori (King et al, 2010); although any impacts will vary widely across different regions, organisations, communities, and groups. Projected impacts are speculative but may include, for example, increased insurance premiums, reduced work opportunities associated with drought, water shortages for isolated rural communities, or flood control and coastal infrastructure that restrict access and Māori customary activities.
More information
Further research on New Zealand’s environmental, economic, and social sensitivity to climate-related impacts is a priority over the next five years (Ministry for the Environment & Department of Conservation, 2017).
Data and research on the impacts and implications of future climate change for Māori are also limited. A series of research programmes and projects is currently underway across the country to help fill these gaps and develop practical tools and knowledge that will strengthen the capacity and capability of iwi, hapū, whānau, and Māori business to deal with the potential consequences of climate change (eg see The Deep South’s Vision Mātauranga).
For a comprehensive discussion of the future impacts and implications of climate change for New Zealand, see:
• IPCC report: Australasia chapter in: Climate Change 2014: Impacts, Adaptation, and Vulnerability
• Royal Society Te Apārangi reports:
− Climate changes, impacts and implications for New Zealand to 2100
− Human health impacts of climate change for New Zealand
• Parliamentary Commissioner for the Environment report: Preparing New Zealand for rising seas: Certainty and uncertainty.

46 New Zealand’s Environmental Reporting Series: Our atmosphere and climate 2017
Exposure to ultraviolet sunlight
Exposure to ultraviolet (UV) sunlight has positive and negative effects on human health, but importantly for New Zealand, contributes to our high rates of the skin cancer melanoma.
In this chapter, we consider stratospheric ozone, which absorbs UV sunlight and is important in controlling the levels of UV sunlight that reach Earth’s surface. We report on the global production of ozone-depleting substances, the changing state of the ozone hole, and ozone concentrations over New Zealand. With the successful phasing out of ozone-depleting substances through the 1987 Montreal Protocol (see box 8), a gradual recovery of ozone is expected in the years ahead (McKenzie et al, 2011).
Pressure on the atmosphere from ozone-depleting substances is now well-managed, but this is not the end of the story. Natural influences on New Zealand’s UV levels – for example, the natural seasonal variability in the ozone layer – help explain why our UV levels fluctuate during the year. Understanding these influences can help us to make good decisions on our exposure to UV sunlight.
Importance of stratospheric ozone Ozone is a greenhouse gas that exists throughout our atmosphere. Four billion years ago, before life on Earth, the planet’s atmosphere contained much lower levels of ozone, and much higher levels of UV sunlight reached the planet’s surface than today. It took the development of the ozone layer in the atmosphere for life to be able to withstand the damaging effects of intense UV sunlight (Cnossen et al, 2007).
In the troposphere, the layer of the atmosphere closest to Earth, ozone is typically present only in low concentrations. Its concentrations are greatest in the second layer of Earth’s atmosphere, the stratosphere, and peak at around 25 kilometres altitude. At this level of the atmosphere, ozone is beneficial because it absorbs damaging UV sunlight, reducing the levels experienced at Earth’s surface.
Ozone-depleting substances and the ozone hole Ozone-depleting substances are synthetic gases that destroy stratospheric ozone. These harmful substances are mostly used as refrigerants in air conditioners and refrigerators, as propellants in aerosol cans, in fire extinguishers, and as solvents. Most ozone-depleting substances are also greenhouse gases.
In the 1980s, scientists were concerned that stratospheric ozone was at risk from ozone-depleting substances, with associated increases in UV sunlight reaching Earth’s surface. Increases in UV sunlight due to depleted ozone were observed globally during the 1980s and 1990s, particularly at high latitudes (McKenzie et al, 2011).
From 1986 to 2015 global production of ozone-depleting substances fell 98 percent.
See Environmental indicators Te taiao Aotearoa: Global production of ozone-depleting substances

New Zealand’s Environmental Reporting Series: Our atmosphere and climate 2017 47
The thickness of the ozone layer in a column of air is measured in Dobson units (DU). One DU represents the amount of ozone molecules needed to produce a 0.01-millimetre layer of pure ozone at Earth’s surface. The ozone ‘hole’ is an area where the ozone layer is less than 220 DU (NASA, 2017a). Each spring, the hole forms over Antarctica. It is caused mostly by ozone-depleting substances.
In winter, ozone-depleting substances are trapped within the polar vortex, an ever-present clockwise flow of air around Antarctica that strengthens over winter. Polar stratospheric clouds form within the polar vortex. Ozone-depleting substances react with these clouds, producing reservoirs of chlorine and bromine. In spring, UV sunlight reacts with these chemicals in a process that quickly breaks down the ozone layer, leading to the springtime hole over Antarctica.
Since the 1987 Montreal Protocol under the Vienna Convention (see box 8), the global production of ozone-depleting substances has decreased by 98 percent (data from 1986 to 2015). The ozone hole has started to shrink in response. In 2016, the mean maximum size of the ozone hole was 20.9 million square kilometres, a 21 percent decrease from its largest mean maximum size in 2006 (26.6 million square kilometres). It is possible that the ozone hole will cease to form by the middle of this century, and ozone levels will return to their normal levels, more than 60 years since the world took action to reduce emissions of the harmful substances (Solomon et al, 2016). This is an excellent example of the benefits of international policy on environmental outcomes.
Box 8 The Montreal Protocol
The Montreal Protocol under the Vienna Convention was agreed in 1987. Under the protocol, countries agreed to phase out the production and consumption of certain ozone-depleting substances by specific deadlines. Most ozone-depleting substances being phased out are also greenhouse gases, so the protocol has an important climate benefit.
There was international concern that the climate benefit could be diminished as a result of an increased reliance on hydrofluorocarbons to replace ozone-depleting substances in refrigeration and air-conditioning equipment. Hydrofluorocarbons do not destroy ozone but are potent greenhouse gases and serve as precursors to ozone destroyers. For this reason, they were included in the protocol’s scope.
The Kigali Amendment requires developed countries such as New Zealand to begin phasing down hydrofluorocarbon consumption in 2019. Most developing countries will follow with a freeze on consumption levels in 2024, while a second group of 10 countries will freeze their consumption levels in 2028. The Kigali Amendment will take effect on 1 January 2019, provided it is ratified by at least 20 parties to the Montreal Protocol (EIA Briefing, 2016).
In 2016, the mean maximum size of the ozone hole was 20.9 million square kilometres, a 21 percent decrease from its largest mean maximum size in 2006.
See Environmental indicators Te taiao Aotearoa: Ozone hole

48 New Zealand’s Environmental Reporting Series: Our atmosphere and climate 2017
New Zealand’s use of ozone-depleting substances
New Zealand does not manufacture ozone-depleting substances and has phased out their importation and domestic use as required by the Montreal Protocol. We do, however, use some ozone-depleting substances in essential cases. For example, we use hydrochlorofluorocarbons for health and safety, such as in inhalers and fire extinguishers. We use methyl bromide for quarantine, to prevent the introduction of harmful pest organisms into our environment, and for pre-shipment purposes required by our trading partners. There is currently no internationally accepted alternative to methyl bromide. Common goods that are fumigated include log and timber products for export, imported fruits and vegetables, and contaminated shipping containers (Minister for the Environment, 2015).
New Zealand’s ozone concentrations, UV levels, and global warming
The ozone layer over New Zealand thins during summer, providing less protection from UV sunlight at a time when Earth is closest to the sun. Long-term average daily ozone concentrations vary during the year by about 29 percent, with minimum concentrations in March and maximum concentrations in October.
The ozone hole does not have a large effect on ozone concentrations over New Zealand, and therefore on our UV levels. In early spring when the ozone hole forms over Antarctica, ozone amounts are naturally relatively high in New Zealand. However, when the ozone hole breaks up in late spring, it can send ‘plumes’ of ozone-depleted air over New Zealand. This briefly decreases column ozone levels by about 5 percent, about the same amount as daily variation (Ajtić et al, 2004).
Studies are beginning to emerge about how UV levels and ozone concentrations over New Zealand might be affected by changes in winds and cloud patterns associated with global warming and its interactions with ozone depletion (UNEP, 2017). These complex interactions are likely to result in both risks and benefits of exposure to UV sunlight for the environment and society (Williamson et al, 2014).
New Zealand’s UV levels New Zealand’s daytime UV levels are variable across the country and could be both very high and very low, depending on the time of the year (see figure 17). In summer, daytime levels of UV are often extreme on UV indexes, a level that can damage fair skin in minutes. In winter, daytime UV levels are often low, particularly in the south of the country.
We report on data from five sites, monitored by NIWA, between September 1981 and February 2017: Leigh (Auckland region), Paraparaumu (Wellington region), Christchurch, Lauder (Otago region), and Invercargill. Over the reporting period Leigh had 74 days when UV levels were rated extreme while Invercargill had only three days. UV levels were rated as extreme in Paraparaumu, Christchurch, and Lauder for 45, 18, and 30 days, respectively.
Long-term average daily ozone concentrations vary across the year by about 29 percent, with the lowest concentrations in March and the highest in October.
See Environmental indicators Te taiao Aotearoa: Ozone concentrations in the stratosphere
In summer, daytime levels of UV are often extreme on UV indexes, a level which can cause damage to fair skin in minutes.
See Environmental indicators Te taiao Aotearoa: UV intensity

New Zealand’s Environmental Reporting Series: Our atmosphere and climate 2017 49
New Zealand’s peak summer UV levels are roughly 40 percent higher than those at comparable latitudes in the Northern Hemisphere (McKenzie et al, 2006). There are three main reasons for this (McKenzie et al, 2003; 2006):
1. Earth’s orbit is elliptical, which means the Southern Hemisphere is closer to the sun during our summer.
2. The thickness of the ozone layer in the atmosphere varies seasonally (see figure 17). At mid-latitudes, such as New Zealand, it is thickest during spring and thinnest during autumn. This means the ozone layer over New Zealand thins during summer, providing less protection from UV sunlight when we are closest to the sun and the sun is highest in the sky. Moreover, our summertime ozone layer is thinner than the summertime ozone layer experienced at corresponding Northern Hemisphere latitudes.
3. The air in New Zealand tends to be clearer than that in many other locations. UV sunlight travelling through the atmosphere to Earth’s surface is scattered or absorbed by clouds and aerosols (air pollution).
Figure 17
UV sunlight and health Almost every living organism on Earth relies on exposure to some level of UV from sunlight, and many biological processes have evolved to either take advantage of its abundance or minimise the potential harm associated with exposure to it.
Exposure to UV sunlight has positive and negative effects on human health. A small amount of UV exposure throughout the year is critical for producing vitamin D, which is difficult to acquire in our diets. Vitamin D helps the body absorb calcium to support bone growth, and low vitamin D levels are related to several adverse health outcomes, such as rickets (Thacher & Clarke, 2011). Vitamin D may also help the body produce serotonin, a compound that contributes to feelings of happiness and well-being (Spedding, 2014; Lesch et al, 1996).
0
2
4
6
8
10
12
250
270
290
310
330
350
370
Dec Jan Feb Mar Apr May Jun Jul Aug Sep Oct Nov
Ozone thickness and UV intensity by season, at Lauder 1997–2016
Average total ozone column thickness Average peak UV index
Source: NIWA
Summer Autum Winter Spring
Ozone thickness (Dobson units) Peak UV index

50 New Zealand’s Environmental Reporting Series: Our atmosphere and climate 2017
Conversely, and more importantly for New Zealand, too much exposure to UV sunlight leads to skin damage (including melanoma, a form of skin cancer) and cataracts. It also affects plant growth and decomposition. Australasia has the world’s highest rates of melanoma (Ferlay et al, 2014; Ministry of Health, 2016; Whiteman et al, 2016), the most serious type of skin cancer. The age-standardised rate of melanoma for males in New Zealand increased from 1996 to 2013, but there was no discernible trend in the melanoma rate for females in New Zealand over the same period (see figure 18). This difference is likely due to both behavioural and genetic factors (Dunford et al, 2017; Geller et al, 2006).
Melanoma rates are partly linked to our relatively high UV levels, but other factors also contribute to our high incidence of melanoma. New Zealanders with fair skin are particularly prone to skin damage and our general outdoor lifestyle can also lead to more exposure to the sun. Furthermore, our comparatively cool summer temperatures encourage overexposure.
Figure 18
Note: 2014–2015 data are provisional and subject to change.
30
32
34
36
38
40
42
44
0
200
400
600
800
1,000
1,200
1,400
96 97 98 99 00 01 02 03 04 05 06 07 08 09 10 11 12 13 14 15
Registrations
Total registrations and age-standardised rates of melanoma occurrence
Per 100,000 people, 1996–2015
Male registrations Female registrationsTotal rate Male rateFemale rate Source: Ministry of Health
Rate per 100,000 population
The age-standardised rate of melanoma in New Zealand increased for males from 1996 to 2013.
See Environmental indicators Te taiao Aotearoa: Occurrence of melanoma

New Zealand’s Environmental Reporting Series: Our atmosphere and climate 2017 51
Acknowledgements
We would like to thank the following people and organisations for their invaluable contribution to Our atmosphere and climate 2017 and Environmental Indicators Te taiao Aotearoa.
Data providers
We would like to thank the following for providing data for this report.
Climate Research Unit, University of East Anglia; GEOMAR, Helmholtz Centre for Ocean Research Kiel; Hannah, John (Emeritus professor University of Otago); Institute of Environmental Science and Research (ESR); Met Office, Hadley Centre for Climate Change; MetService courtesy of Transpower New Zealand Limited; Ministry for the Environment; Ministry of Health; National Aeronautics and Space Administration (NASA); National Institute for Water and Atmospheric Research (NIWA); National Oceanic and Atmospheric Administration; National Weather Service Climate Prediction Center; Ozone Secretariat – United Nations Environment Programme; World Resources Institute
Peer reviewers
We would like to thank the following people and organisations for reviewing a draft of this report.
Andy Reisinger – New Zealand Agricultural Greenhouse Gas Research Centre
Brett Mullan – NIWA
Darren Ngaru King – NIWA
Kevin Hennessy – Climate Comms, Australia
Technical advisory group
The technical advisory group provided advice on potential measures and feedback on an earlier draft version of the report.
Alex Thompson – Ministry of Business, Innovation and Employment
Andrew Tait – NIWA
David Wratt – Emeritus scientist NIWA and adjunct professor Victoria University of Wellington
Gerald Rys – Ministry for Primary Industries
James Renwick – Victoria University of Wellington
Jocelyn Turnbull – GNS Science
Kathleen Kozyniak – Hawke’s Bay Regional Council
Peter Kreft – MetService
Richard McKenzie – Emeritus scientist NIWA
Tammy Hambling – ESR
Warren Gray – Ministry for the Environment

52 New Zealand’s Environmental Reporting Series: Our atmosphere and climate 2017
Appendix: Climate change projections for New Zealand
Climate change projections for New Zealand in table 3 were produced by NIWA following the release of the IPCC Fifth Assessment Report. Projections for ocean acidification, ocean warming, and sea-level rise come from IPCC (2013; 2014a). For more projections and scenarios see the Ministry for the Environment’s climate change projections for New Zealand and NIWA’s climate change scenarios for New Zealand.
Table 3 Magnitude and variation of climate-related changes for New Zealand, data to 2016 and projections
Climate variable Description of projected change
Timeframe of change
Our data to 2016
Projected changes (compared with 1995) by:
2040 2090
Average temperature
Warming greatest at higher elevations and during summer/autumn
Warming peaks, then declines slightly during the 21st century only under low carbon projections
Average land surface temperature increased by 1°C since 1909
+0.7°C to +1.0°C +0.7°C to +3.0°C
2110: +0.7°C to +3.7°C
Frost days Decrease in frost days (0°C or lower)
Decline in frost days greatest in coldest regions
Reduced frequency of frost days at 10 of 30 locations, increased frequency at 1 location; earliest data 1972
30% to 50% decrease
30% to 90% decrease
Warm days Increase in warm days (maximum temperature of 25°C or higher)
Increase in warm days at 8 of 30 locations, decrease at one location; earliest data 1972
40% to 100% increase
40% to 300% increase
Average rainfall
Varies around the country and with season
Annual pattern of increases in west and south of New Zealand and decreases in north and east
Seasonal spring decrease in 5 upper North Island locations; seasonal spring increase in 1 site in south of South Island and 2 sites in southwest of North Island; earliest data 1960
Substantial variation around the country, increasing in magnitude with increasing emissions
Not available
Extreme rainfall
Increased extreme daily rainfall, especially where mean rainfall increases, such as on the West Coast
Strongest increases in western regions and in south of the South Island
Decrease in extremes in parts of north and east of the North Island
Increase in annual maximum one-day rainfall at 2 eastern South Island locations and decrease at 4 North Island locations; earliest data 1960
Not available More than 20% increase in 99th percentile of daily rainfall in southwest of South Island (high emissions scenario)

New Zealand’s Environmental Reporting Series: Our atmosphere and climate 2017 53
Climate variable Description of projected change
Timeframe of change
Our data to 2016
Projected changes (compared with 1995) by:
2040 2090
Snow and ice
Decreases
Large decreases confined to high altitude or southern regions of the South Island
Glaciers lost an estimated 25% in ice volume (about 13.3 cubic kilometres); since 1977
Not available Snow days per year reduce by 30 days or more (high emissions scenario)
Globally, loss of many glaciers (high emissions scenario) (IPCC, 2014a)
Drought Increase in severity and frequency in most areas, except for Taranaki-Manawatu, West Coast and Southland
Increases most marked in already dry areas
Soils became drier at 7 of 30 sites and wetter at 1 site; since 1972
Not available More than 20% increase in drought magnitude per year (July–June) on average
Extreme wind speeds
Most robust increases occur in southern half of the North Island and throughout the South Island
Decreases in the North Island from Northland to Bay of Plenty
Decreased extreme wind speeds at nearly one-third of sites; earliest data 1972
Up to 10% or more in parts of the country
Ocean warming (IPCC, 2013)
Globally, progressive increase.
At greater depth the warming will be most pronounced for the Southern Ocean (IPCC, 2013)
Our data (satellite data from 1993) shows no trend
Long-term data shows warming of 0.71°C from 1909–2009 (Mullan et al, 2010)
Best estimates of global ocean warming by 2100 are about 0.6°C (low emissions scenario) to 2.0°C (high emissions scenario) in the top 100 metres of the sea (compared with 1986–2005 climate normal) (IPCC, 2013)
Ocean acidification (lowering pH) (IPCC, 2014a)
Globally, decreasing pH (increasing acidity) to 2100 under all emissions scenarios (IPCC, 2014a)
Decreased pH (increased acidity) of subantarctic waters since 1998
Globally a pH decline ranging from 0.06–0.07 (low emissions scenario) to 0.30–0.32 (high emissions scenario) by 2100 (IPCC, 2014a)
Sea level rise (IPCC, 2013)
Globally, progressive increase faster than over the last century and continuing for many centuries
Relative sea-level rise will vary at different locations around New Zealand
Rates of 1.4 to 2.2 mm each year depending on location (earliest data as far back as 1891 for some sites; data to 2015 for all sites)
Global projections (relative to 1986-2005):
• 2060: 0.2 m to 0.4 m rise
• 2100: 0.3 m to 1.0 m rise (IPCC, 2013)
The collapse of parts of the Antarctic ice sheets could substantially increase the upper end of this range
New Zealand’s offshore sea-level rise may be up to 0.05 m more than global average sea level rise (Ackerley et al, 2013)

54 New Zealand’s Environmental Reporting Series: Our atmosphere and climate 2017
References Ackerley, D, Bell, R, Mullan, B, & McMillen, H (2013). Estimation of regional departures from global average sea-level rise around New Zealand from AOGCM simulations. Weather and Climate, 33, 2–22. Retrieved from www.researchgate.net.
Ajitć, J, Connor, BJ, Lawrence, BN, Bodeker, GE, Hoppel, KW, Rosenfield, JE, Heuff, DN (2004). Dilution of the Antarctic ozone hole into southern midlatitudes, 1998. Journal of Geophysical Research 109, D17107. DOI: 10.1029/2003JD004500.
Anderson, A (2013). A fragile plenty: pre-European Māori and the New Zealand environment. In Pawson, E, & Brooking, T (Eds), Making a new land: environmental histories of New Zealand (2nd ed). Dunedin: Otago University Press.
Anderson, B, Kerr, T, & Milner, A (2016). Alpine processes. In Jellyman, PG, Davie, TJA, Pearson, CP, & Harding, JS (Eds), Advances in New Zealand freshwater science. Christchurch: New Zealand Freshwater Sciences Society.
Barnosky, AD, Matzke, N, Tomiya, S, Wogan, GOU, Swartz, B, Quental, TB, … Ferrer, EA (2011). Has the Earth’s sixth mass extinction already arrived? Nature 471, 51–57. DOI: 10.1038/nature09678.
Barron, M, Pech, R, Christie, J, Tait, A, Byrom, A, & Elliott, G (2016). Climate change impacts and implications for New Zealand to 2100. Synthesis report: RA2 alpine case study. The beech forests of New Zealand. Retrieved from http://ccii.org.nz
Bates, NR, Astor, YM, Church, MJ, Currie, K, Dore, JE, Gonzálex-Dávila, M,… Santana-Casiano, JM (2014). A time-series view of changing ocean chemistry due to ocean uptake of anthropogenic CO2 and ocean acidification. Oceanography, 27(1), 126–141.
Bickler, S, Clough, R, & Macready, S (2013). The impact of climate change on the archaeology of New Zealand’s coastline. Retrieved from www.doc.govt.nz.
CAIT (2017). CAIT climate data explorer. Retrieved from http://cait.wri.org.
Chinn, TJ (2001). Distribution of the glacial water resources of New Zealand. Journal of Hydrology: New Zealand, 40(2), 139–187.
Clark, AJ, Nottage, RAC, Wilcocks, L, Lee, JM, Burke, C, Kalaugher, E, & Cowie, B (2012). Impacts of climate change on land-based sectors and adaptation options. Stakeholder report 2012. Retrieved from www.mpi.govt.nz.
Cnossen, I, Sanz-Forcada, J, Favata, F, Witasse, O, Zegers, T, & Arnold, NF (2007). Habitat of early life: Solar X-ray and UV radiation at Earth’s surface 4–3.5 billion years ago. Journal of Geophysical Research, 112(E). DOI: 10.1029/2006JE002784.
Dean, SM, Rosier S, Carey-Smith T, & Stott PA (2013). The role of climate change in the two-day extreme rainfall in Golden Bay, New Zealand, December 2011. In Explaining extreme events of 2012 from a climate perspective. Bulletin of the American Meteorological Society, 94(9), S61–S63.
Dunford, A, Weinstock, DM, Savova, V, Schumacher, SE, Cleary, JP, Yoda, A, & Lane, AA (2017). Tumor-suppressor genes that escape from X-inactivation contribute to cancer sex bias. Nature Genetics, 49(1), 10–16.
EIA Briefing (2016). Kigali amendment to the Montreal Protocol: A crucial step in the fight against catastrophic climate change. EIA briefing to the 22nd conference of the parties to the UNFCCC. Retrieved from www https://eia-international.org.
Ferlay, J, Soerjomataram, I, Dikshit, R, Eser, S, Mathers, C, Rebelo, M,… Bray, F (2014). Cancer incidence and mortality worldwide: Sources, methods and major patterns in GLOBOCAN 2012. International Journal of Cancer, 136(5), E359–E386. DOI: 10.1002/ijc.29210.

New Zealand’s Environmental Reporting Series: Our atmosphere and climate 2017 55
Geller, AC, Miller, DR, Swetter, SM, Demierre, M, & Gilchrest, BA (2006). A call for the development and implementation of a targeted national melanoma screening program. Archives of Dermatology, 142(4), 504–507. DOI: 10.1001/archderm.142.4.504.
Grayson, KL, Mitchell, NJ, Monks, JM, Keall, SN, Wilson, JN, & Nelson, NJ (2014). Sex ratio bias and extinction risk in an isolated population of tuatara (Sphenodon punctatus). PLoS One, 9(4), e94214.
Hambling, T (2012). Environmental health indicators: development of a tool to assess and monitor the impacts of climate change on human health. Health Analysis & Information for Action (HAIFA). Retrieved from www.esr.cri.nz.
Harmsworth GR, & Awatere S (2013). Indigenous Māori knowledge and perspectives of ecosystems. In Dymond JR ed. Ecosystem services in New Zealand – conditions and trends. Lincoln, New Zealand: Manaaki Whenua Press.
Harrington, L, Rosier, S, Dean, S, Stuart, S, & Schaill, A (2014). The role of anthropogenic climate change in the 2013 drought over North Island New Zealand. In Explaining extremes of 2013 from a climate perspective. Bulletin of the American Meteorological Society, 95 (9), S15–S18. Retrieved from www.ametsoc.org.
Hartmann, DL, Klein Tank, AMG, Rusticucci, M, Alexander, LV, Brönnimann, S, Charabi, Y, & Zhai, PM (2013). Observations: atmosphere and surface. In Stocker, TF, Qin, D, Plattner, GK, Tignor, M, Allen, SK, Boschung, J, & Midgley, PM (Eds), Climate change 2013: the physical science basis. Contribution of Working Group I to the Fifth Assessment Report of the Intergovernmental Panel on Climate Change. Cambridge and New York: Cambridge University Press.
Herring, SC, Hoell, A, Hoerling, MP, Kossin, JP, Schreck III, CJ, & Stott, PA (Eds) (2016). Explaining extreme events of 2015 from a climate perspective. Bulletin of the American Meteorological Society, 97(12), S1–S145.
Intergovernmental Panel on Climate Change (IPCC) (2007). The Physical Science Basis. Contribution of Working Group I to the Fourth Assessment Report of the Intergovernmental Panel on Climate Change [Solomon, S, Qin, D, Manning, M, Chen, Z, Marquis, M, Averyt, KB, M,… Miller, HL (Eds)]. Cambridge and New York: Cambridge University Press, page 996.
Intergovernmental Panel on Climate Change (IPCC) (2012). Managing the risks of extreme events and disasters to advance climate change adaptation. A special report of working groups I and II of the Intergovernmental Panel on Climate Change. [Field, CB, Barros, V, Stocker, TF, Qin, D, Dokken, DJ, Ebi, KL,… Midgley, PM (Eds)]. Cambridge and New York: Cambridge University Press.
Intergovernmental Panel on Climate Change (IPCC) (2013). Climate Change 2013: The Physical Science Basis. Contribution of Working Group I to the Fifth Assessment Report of the Intergovernmental Panel on Climate Change [Stocker, TF, Qin, D, Plattner, GK, Tignor, M, Allen, SK, Boschung, J, … Midgley, PM (Eds)]. Cambridge, United Kingdom and New York: Cambridge University Press.
Intergovernmental Panel on Climate Change (IPCC) (2014a). Climate change 2014: Synthesis report. Contribution of Working Groups I, II and III to the Fifth Assessment Report of the Intergovernmental Panel on Climate Change [core writing team, Pachauri RK & Meyer LA (Eds)]. Geneva: Author.
Intergovernmental Panel on Climate Change (IPCC) (2014b). Summary for policymakers. In Field, CB, Barros, VR, Dokken, DJ, Mach, KJ, Mastrandrea, MD, Bilir, TE, … L.L. White, LL (Eds), Climate Change 2014: Impacts, Adaptation, and Vulnerability. Part A: Global and Sectoral Aspects. Contribution of Working Group II to the Fifth Assessment Report of the Intergovernmental Panel on Climate Change Cambridge and New York: Cambridge University Press.
Kanawa, L (2010). Climate change implications for Māori. In Selby, R, Moore, P, & Mulholland, M (Eds), Maori and the environment: Kaitiaki. Wellington: Huia Publishers.
Kelly, D, Geldenhuis, A, James, A, Penelope Holland, E, Plank, MJ, Brockie, RE, & Mark, AF (2013). Of mast and mean: differential-temperature cue makes mast seeding insensitive to climate change. Ecology Letters, 16(1), 90–98.

56 New Zealand’s Environmental Reporting Series: Our atmosphere and climate 2017
King, D, Penny, G, & Severne, C (2010). The climate change matrix facing Māori society. In Nottage, R, Wratt, D, Borman, J & Jones, K (Eds), Climate change adaptation in New Zealand: Future scenarios and some sectoral perspectives, 110–111. Wellington: New Zealand Climate Change Centre.
King, D, Tawhai, W, Skipper, A, & Iti, W (2005) Anticipating local weather events and climate using traditional Māori indicators. NIWA Client report AKL-2005-129. Retrieved from www.niwa.co.nz.
Lal, A, Lill, AWT, McIntyre, M, Hales, S, Baker, MG, & French, NP (2015). Environmental change and enteric zoonoses in New Zealand: A systematic review of the evidence. Australian and New Zealand Journal of Public Health, 39(1), 63-68. DOI: 10.1111/1753-6405.12274.
Lesch, K-P, Bengel, D, Heils, A, Sabol, SZ, Greenberg, BD, Petri, S, & Murphy, DL (1996). Association of anxiety-related traits with a polymorphism in the serotonin transport gene regulatory region. Science, 274(5292), 1527–1531.
Lester, PJ, Haywood, J, Archer, ME, & Shortall, CR (2017). The long-term population dynamics of common wasps in their native and invaded range. Journal of Animal Ecology, 86(2), 337–347.
Liley, JB (2009). New Zealand dimming and brightening. Journal of Geophysical Research, 114, D00D10. DOI: 10.1029/2008JD011401.
Manning, M, Lawrence, J, King, DN, Chapman, R (2015). Dealing with changing risks: a New Zealand perspective on climate change adaptation. Regional Environmental Change, Vol 15(4), 581–594.
MacDiarmid, A, McKenzie, A, Sturman, J, Beaumont, J, Mikaloff-Fletcher, S, & Dunne, J (2012). Assessment of anthropogenic threats to New Zealand marine habitats. New Zealand Aquatic Environment and Biodiversity report no 93. Wellington: Ministry for Primary Industries.
Marcott, SA, Shakun, JD, Clark, PU, & Mix, AC (2013). A reconstruction of regional and global temperature for the past 11,300 years. Science, 339(6124), 1198–1201. DOI: 10.1126/science.1228026
Marshall, G (2003). Trend in the Southern Annular Mode from observations and reanalyses. Journal of Climate, 16, 4134–4143.
McFadgen, BG (2007). Hostile shores: Catastrophic events in pre-historic New Zealand and their impact on Māori coastal communities. Auckland: Auckland University Press.
McKenzie, RL, Aucamp, PJ, Bais, AF, Bjorn, LO, Ilyas, M, & Madronich, S (2011). Ozone depletion and climate change: Impacts on UV radiation. Photochemical and Photobiological Sciences, 10, 182–198.
McKenzie, RL, Bodeker, GE, Scott, G, & Slusser, J, (2006). Geographical differences in erythemally-weighted UV measured at mid-latitude USDA sites. Photochemical and Photobiological Sciences, 5(3), 343–352.
McKenzie, RL, Smale, D, Bodeker, G (2003). Ozone profile differences between Europe and New Zealand: Effects on surface UV irradiance and its estimation from satellite sensors. Journal of Geophysical Research, 108, D6, 4179. DOI: 10.1029/2002JD002770.
Minister for the Environment (2015). Report of the Minister for the Environment on the operation of the Ozone Layer Protection Act 1996 for the period ended 31 December 2015. Presented to the House of Representatives Pursuant to Subsection (2) of Section 30, of the Ozone Layer Protection Act 1996. Retrieved from www.parliament.nz.
Ministry for the Environment (2008). Tauranga City Council prepares for more intense rainfall. Retrieved from www.mfe.govt.nz.
Ministry for the Environment (2016). Climate change projections for New Zealand: Atmosphere projections based on simulations undertaken for the IPCC 5th assessment. Retrieved from www.mfe.govt.nz.
Ministry for the Environment (2017a). New Zealand’s Greenhouse Gas Inventory 1990–2015. Wellington: Ministry for the Environment. Retrieved from www.mfe.govt.nz.
Ministry for the Environment (2017b). New Zealand’s seventh national communication under the United Nations Framework Convention on Climate Change and Kyoto Protocol. Manuscript in preparation.

New Zealand’s Environmental Reporting Series: Our atmosphere and climate 2017 57
Ministry for the Environment & Department of Conservation (2017). Conservation and environment science roadmap. Wellington: Ministry for the Environment and Department of Conservation.
Ministry for Primary Industries (2013). The 2012–13 drought: an assessment and historical perspective. MPI technical paper no 2012/18. Prepared for MPI by NIWA. Retrieved from www.niwa.co.nz.
Ministry of Health (2016). Cancer: New registrations and deaths 2013. Retrieved from www.moh.govt.nz.
Mullan, AB, Stuart, SJ, Hadfield, MG, & Smith, MJ (2010). Report on the review of NIWA’s ‘seven-station’ temperature series. NIWA information series no 78. Retrieved from www.niwa.co.nz.
NASA (2017a). Ozone hole watch. Retrieved from https://ozonewatch.gsfc.nasa.gov.
NASA (2017b). Satellite data confirm annual carbon dioxide minimum above 400 ppm. Retrieved from https://climate.nasa.gov.
New Zealand Treasury (2013). Budget economic and fiscal update 2013: 16 May 2013, pp 7–26. Retrieved from www.treasury.govt.nz.
NIWA (nd-a). El Niño and La Niña. Retrieved July 2017 from www.niwa.co.nz.
NIWA (nd-b). New Zealand temperature record. Retrieved July 2017 from www.niwa.co.nz.
NIWA (2006). The Southern Annular Mode and New Zealand climate. Retrieved from www.niwa.co.nz.
NIWA (2007). El Niño and climate forecasting. Retrieved from www.niwa.co.nz.
NIWA (2010). Report on the Review of NIWA’s ‘seven-station’ temperature series. Retrieved from www.niwa.co.nz.
NIWA (2016). New Zealand reaches climate change milestone. Retrieved from www.niwa.co.nz.
Norris, JR, Allen, RJ, Evan, AT, Zelinka, MD, O’Dell, CW, & Klein, SA (2016). Evidence for climate change in the satellite cloud record. Nature, 536(7614), 72–75.
Organisation for Economic Co-operation and Development (OECD) (2017). Environmental pressures rising in New Zealand. Retrieved from www.oecd.org.
Parliamentary Commissioner for the Environment (PCE) (2015). Preparing New Zealand for rising seas: Certainty and uncertainty. Retrieved from www.pce.parliament.nz.
Reisinger, A, Kitching, RL, Chiew, F, Hughes, L, Newton, PCD, Schuster, SS, & Whetton, P (2014). Australasia. In Barros, VR, Field, CB, Dokken, DJ, Mastrandrea, MD, Mach, KJ, Bilir, TE, & White, LL (Eds), Climate change 2014: Impacts, adaptation, and vulnerability. Part B: Regional Aspects. Contribution of Working Group II to the Fifth Assessment Report of the Intergovernmental Panel on Climate Change (pp 1371–1438). Cambridge and New York: Cambridge University Press.
Rogelj, J, den Elzen, M, Höhne, N, Fransen, T, Fekete, H, Winkler, H,… Meinshausen, M (2016). Paris Agreement climate proposals need a boost to keep warming well below 2°C. Nature, 534, 631–639. DOI: 10.1038/nature18307.
Rosier, S, Dean, S, Stuart, S, Carey-Smith, T, Black, MT, & Massey, N (2015). Extreme rainfall in early July 2014 in Northland, New Zealand – was there an anthropogenic influence? In Explaining extreme events of 2014 from a climate perspective. Bulletin of the American Meteorological Society, 96 (12), S136–140.
Royal Society Te Āparangi (2017). Human health impacts of climate change for New Zealand. Manuscript in preparation; to be available from https://royalsociety.org.nz/climate-change-health.
Salinger, MJ, & Mullan, AB (1999). New Zealand climate: temperature and precipitation variations and their link with atmospheric circulation 1930–1994. International Journal of Climatology, 19(10), 1049–1071. Available from http://onlinelibrary.wiley.com.
Salinger, MJ, Renwick, JA, & Mullan, AB (2001). Interdecadal Pacific Oscillation and South Pacific climate. International Journal of Climatology, 21(14), 1705–1721.

58 New Zealand’s Environmental Reporting Series: Our atmosphere and climate 2017
Selby, R, Moore, P, & Mulholland, M (2010). Maori and the environment: Kaitiaki. Wellington: Huia Publishers.
Solomon, S, Ivy, DJ, Kinnison, D, Mills, MJ, Neely III, RR, & Schmidt, A (2016). Emergence of healing in the Antarctic ozone layer. Science, 353(6296), 269–274.
Spedding, S (2014). Vitamin D and depression: A systematic review and meta-analysis comparing studies with and without biological flaws. Nutrients, 6(4), 1501–1518. DOI: 10.3390/nu6041501.
Statistics NZ (2016). Tatauranga Umanga Māori 2016: Statistics on Māori businesses. Retrieved from www.stats.govt.nz.
Steffen, W, Richardson, K, Rockström, J, Cornell, SE, Fetzer, I, Bennett, EM, Biggs, R, … Sörlin, S (2015). Planetary Boundaries: Guiding human development on a changing planet. Science, 347(6223).
Thacher, TD, & Clarke, BL (2011). Vitamin D insufficiency. Mayo Clinic Proceedings, 86(1), 50–60. DOI: 10.4065/mcp.2010.0567.
Tompkins, D, Brock, A, Jones, G, Mcbride, G, Tait, A, Benschop, J, & Slaney, D (2012). Modelling the impacts of climate change on infectious diseases in New Zealand. Prepared by the Institute of Environmental Science and Research with NIWA, Landcare Research, and Massey and Waikato Universities. Retrieved from http://haifa.esr.cri.nz.
United Nations Environment Programme (UNEP) (2017). Environmental effects of ozone depletion and its interactions with climate change: Progress report, 2016. Retrieved from http://ozone.unep.org.
United Nations Framework Convention on Climate Change (UNFCCC) (2006). United Nations framework Convention on Climate Change Handbook. Retrieved from https://unfccc.int.
University of Colarado (nd). 2016_rel4: Global mean sea level time series (seasonal signals removed). Retrieved 19 September 2017 from http://sealevel.colorado.edu/.
Whiteman, DC, Green, AC, Olsen, CM (2016). The growing burden of invasive melanoma: Projections of incidence rates and numbers of new cases in six susceptible populations through 2031. Journal of Investigative Dermatology, 136 (6), 1161–1171.
Williamson, CE, Zepp, RG, Lucas, RM, Madronich, S, Austin, AT, Ballaré, CL,… Bornman, JF (2014). Solar ultraviolet radiation in a changing climate. Nature Climate Change, 4, 434–441.
World Resources Institute (2015). CAIT country greenhouse gas emissions: Sources & methods. Retrieved from www.cait.wri.org.