otter tail power company big stone generating station...
TRANSCRIPT

Otter Tail Power CompanyBig Stone Generating Station
Unit 1
Best Available Retrofit Technology Analysis
November 2, 2009
Project 53777

i 11/2/2009
Otter Tail Power Company Big Stone Plant
Unit I Best Available Retrofit Technology Analysis
Table of Contents LIST OF TABLES ...........................................................................................................iii EXECUTIVE SUMMARY ........................................................................................ES-1 1.0 INTRODUCTION ............................................................................................................1 1.1 BACKGROUND ................................................................................................ 2 1.2 BART ANALYSIS PARAMETERS.................................................................. 3 1.3 APPROACH ....................................................................................................... 5 1.3.1 IDENTIFICATION OF RETROFIT CONTROL TECHNOLOGIES............... 6 1.3.2 FEASIBILITY ANALYSIS................................................................................ 6 1.3.3 EVALUATE TECHNICALLY FEASIBLE CONTROL OPTIONS BY
EFFECTIVENESS.............................................................................................. 6 1.3.4 IMPACT ANALYSIS......................................................................................... 6 1.3.5 METHODOLOGY FOR ESTIMATED COSTS................................................ 7 1.3.6 METHODOLOGY FOR VISIBILITY IMPACTS DETERMINATION .......... 9 1.3.7 ADDITIONAL APPROACH METHODS....................................................... 10 1.4 THE ROLE OF MODELING AND CALPUFF IN A BART ANALYSIS ..... 10 1.4.1 CALPUFF MODELING METHODOLOGY................................................... 11 1.4.2 MODELING SCENARIOS.............................................................................. 11 2.0 NOX BART EVALUATION ..........................................................................................13 2.0.1 BART GUIDELINE NOX LIMITS FOR CYCLONE-FIRED BOILERS ....... 13 2.1 IDENTIFICATION OF RETROFIT NOX CONTROL TECHNOLOGIES .... 13 2.2 TECHNICAL DESCRIPTIONS AND FEASIBILITY ANALYSIS OF NOX CONTROL TECHNOLOGIES ........................................................................................ 14 2.2.1 FEASIBILITY OF COMBUSTION NOX CONTROLS.................................. 14 2.2.2 FEASIBILITY OF POST-COMBUSTION NOX CONTROLS....................... 15 2.2.3 RESULTS OF FEASIBILITY ANALYSIS ............................................................ 16 2.3 CONTROL EFFECTIVENESS EVALUATION OF NOX CONTROL TECHNOLOGIES ............................................................................................................ 16 2.4 EVALUATION OF IMPACTS FOR FEASIBLE NOX CONTROLS............. 18 2.4.1 COST IMPACTS OF NOX CONTROLS ......................................................... 18 2.4.2 ENERGY IMPACTS OF NOX CONTROL ALTERNATIVES ...................... 25 2.4.3 NON AIR QUALITY AND OTHER ENVIRONMENTAL IMPACTS OF NOX
CONTROL ALTERNATIVES......................................................................... 27 2.4.4 VISIBILITY IMPAIRMENT IMPACTS OF NOX CONTROLS .................... 28 2.4.5 SUMMARY OF IMPACTS OF NOX CONTROLS – BSP UNIT I ................ 30 3.0 SO2 BART EVALUATION............................................................................................32 3.0.1 BART GUIDELINE SO2 LIMITS FOR CYCLONE-FIRED BOILERS ........ 32

ii 11/2/2009
3.1 IDENTIFICATION OF RETROFIT SO2 CONTROL TECHNOLOGIES ..... 32 3.2 TECHNICAL DESCRIPTION AND FEASIBLITY ANALYSIS .................. 33 3.2.1 PRE-COMBUSTION FUEL TREATMENTS - FUEL SWITCHING ............ 33 3.2.2 POST-COMBUSTION FLUE GAS DESULFURIZATION ........................... 33 3.2.3 RESULTS OF FEASIBILITY ANALYSIS ..................................................... 34 3.3 EVALUATE TECHNICALLY FEASIBILE SO2 CONTROL OPTIONS BY EFFECTIVENESS............................................................................................................ 35 3.4 EVALUATION OF IMPACTS FOR FEASIBLE SO2 CONTROLS .............. 36 3.4.1 COST ESTIMATES ......................................................................................... 36 3.4.2 ENERGY IMPACTS........................................................................................ 43 3.4.3 NON-AIR QUALITY ENVIRONMENTAL IMPACTS................................. 43 3.4.4 VISIBILITY IMPACTS ................................................................................... 44 3.4.5 IMPACT SUMMARY...................................................................................... 45 4.0 PARTICULATE MATTER BART EVALUATION...................................................46 4.1 IDENTIFICATION OF AVAILABLE RETROFIT PM CONTROL TECHNOLOGIES ............................................................................................................ 46 4.2 TECHNICAL DESCRIPTION AND FEASIBLITY ANALYSIS .................. 47 4.2.1 FABRIC FILTER (FF) ..................................................................................... 47 4.2.2 COHPAC .......................................................................................................... 47 4.2.3 ELECTROSTATIC PRECIPITATOR (ESP)................................................... 48 4.3 RANK OF TECHNICALLY FEASIBLE PM CONTROL OPTIONS BY EFFECTIVENESS............................................................................................................ 48 4.4 EVALUATION OF IMPACTS FOR FEASIBLE PM CONTROLS – UNIT I49 4.4.1 VISIBILITY IMPACTS ................................................................................... 49 5.0 BART RECOMMENDATIONS....................................................................................49 5.1 NOX BART ....................................................................................................... 50 5.2 SO2 BART ........................................................................................................ 50 5.3 PM BART ......................................................................................................... 51 5.4 COMBINED BART.......................................................................................... 52 Appendix A Technical Feasibility Assessment Details for NOX Controls (A1) Summary of CUECost Inputs (A2) Summary of Modeling Results (A3) Appendix B Technical Description of SO2 Controls (B1) Appendix C Technical Description of Particulate Matter Controls (C1) Appendix D Visibility Modeling and Impairment Improvement Analysis Details (D1)

iii 11/2/2009
List of Tables 1.2-1 – Unit Design and Operating Parameters
1.2-2 – Coal Parameters
1.2-3 – Economic Factors
1.4-1 – Big Stone Plant Modeling Scenarios
2.1-1 – Potentially Available NOX Control Alternatives Identified for BART Analysis
2.2-1 – NOX BART Feasibility Analysis Results
2.3-1 – Evaluated NOX Control Technologies
2.3-2 – Estimated Control Options NOX Emission Rates Evaluated
2.4-1 – Unit Capital Cost Factors of Feasible NOX Control Options
2.4-2 – Estimated O&M Costs for NOX Control Options
2.4-3 – Capital and Annualized Costs Estimated for NOX Control Alternatives
2.4-4 – Estimated Annual Emissions and LTAC for NOX Control Alternatives
2.4-5 – Estimated Incremental Annual Emissions and LTAC for NOX Control Alternatives
2.4-6 – Visibility Impairment Impacts from Emission Controls
2.4-7 – Cost for Incremental Visibility Improvement
2.4-8 – Impacts Summary for BSP Unit I NOX Controls
3.1-1 – SO2 Control Technologies Identified for BART Analysis
3.2-1 – SO2 BART Feasibility Analysis Results
3.3-1 – SO2 Control Technologies Identified for BART Analysis
3.4-1 – First Year O&M Cost Estimate for BSP FGD Systems
3.4-2 – Capital and Annualized Costs Estimated for SO2 Control Alternatives
3.4-3 – Estimated Annual Emissions and LTAC for SO2 Control Alternatives
3.4-4 – Estimated Incremental Annual Emissions and LTAC for SO2 Control Alternatives
3.4-5 – Energy Requirements of SO2 BART Alternatives
3.4-6 – Visibility Impairment Impacts from Emission Controls
3.4-7 – Cost for Incremental Visibility Improvement
3.4-8 – Impacts Summary for BSP Unit I SO2 Controls
4.1-1 – PM Control Technologies Identified for BART Analysis
4.2-1 – PM BART Feasibility Analysis Results
5.4-1 – Visibility Impairment Impacts from Combined Emissions

ES-1 11/2/2009
EXECUTIVE SUMMARY
The U.S. Environmental Protection Agency (EPA) finalized the Regional Haze Regulations and
Guidelines for Best Available Retrofit Technology (BART) Determinations in 2005 (40 CFR 51, Subpart
P; 40 CFR 51, App. Y). BART is defined as “an emission limitation based on the degree of reduction
achievable through the application of the best system of continuous emission reduction for each pollutant
which is emitted by a BART-eligible source. The emission limitation must be established, on a case-by-
case basis, taking into consideration the technology available, the costs of compliance, the energy and
non-air quality environmental impacts of compliance, any pollution control equipment in use at the
source, the remaining useful life of the source, and the degree of improvement in visibility which may
reasonably be anticipated to result from the use of such technology” (40 CFR 51.301). This document
presents the BART analysis for each of three major pollutants (nitrogen oxides (NOX), sulfur dioxide
(SO2), and particulate matter (PM)) for Otter Tail Power Company’s (OTPC’s) Big Stone Plant (BSP)
Unit I located near Big Stone City, South Dakota. Otter Tail Power Company is operating agent for the
Big Stone Plant co-owners: NorthWestern Energy, Montana-Dakota Utilities, Co., a division of MDU
Resources Group, and Otter Tail Power Company.
BSP is a steam electric generating plant with one generating unit burning Powder River Basin coal and a
net electrical output of 475 MW. Particulate control for Unit I is provided by a conventional pulse-jet
fabric filter installed in 2007. Nitrogen oxides (NOx) emissions from the unit are controlled with an over-
fire air system (OFA). The unit does not have controls for sulfur dioxide emissions other than firing low-
sulfur Powder River Basin coal. Unit I began operation in 1975 and is presumed to be subject to the
requirements for BART analysis under the Regional Haze Rule absent a formal determination to the
contrary from the DENR.
The BART analysis steps 1 through 5 for NOX, SO2 and PM emissions from BSP are described in this
report. Potentially applicable control technologies are first identified. A brief description of the
processes and their capabilities are then reviewed for availability and feasibility. Subsequently, those
available technologies deemed feasible for retrofit application are ranked according to control capability.
The impacts analysis then reviews the estimated capital and O&M costs for each alternative, the energy
impacts and non-air quality impacts. The impact based on the remaining useful life of the source is
reviewed as part of the cost analysis. In the final step of the analysis, feasible and available technologies
are assessed for their potential visibility impairment impact reduction capability via visibility modeling
results. The results of the impact analyses are tabulated and potential BART control options are listed.

ES-2 11/2/2009
The final result of this analysis is a recommendation of the Best Available Retrofit Technology (BART)
based upon the detailed analysis conducted in this report. For NOX, five control alternatives were
identified and evaluated using the 5 steps. Over-fire air (OFA), separated over-fire air (SOFA), Selective
Non-Catalytic Reduction (SNCR) with SOFA and Selective Catalytic Reduction (SCR) with SOFA were
the technologies that remained after completing steps 1 though 4 of the analysis. To reduce visibility
impacts due to NOX emissions below a discernable level of 0.5 dV, SOFA is recommended as BART for
BSP Unit I. Application of SOFA for NOX control translates into a BART emission rate of 2,804 pounds
per hour.
For SO2, three control alternatives were identified and evaluated using the 5 steps. Wet FGD and semi-
dry FGD at two levels of control were selected for visibility impacts evaluation after completing steps 1
though 4 of the analysis. To reduce visibility impacts due to SO2 emissions below a discernable level of
0.5 dV, semi-dry FGD is recommended as BART for BSP Unit I. Application of semi-dry FGD for SO2
control translates into a BART emission rate of 505 pounds per hour.
For the PM evaluation, three post combustion control technologies were selected for evaluation in
addition to the existing pulse-jet fabric filter. BSP Unit I currently uses a pulse-jet fabric filter (installed
in 2007) that is the best technology available for particulate control, the impact review was abbreviated
and maintaining the existing pulse-jet fabric filter is recommended as BART for BSP Unit I. The
corresponding BART emission rate for the existing fabric filter is 84.1 pounds per hour
Modeling to determine visibility impairment was performed using the recommended BSP Unit I BART
emission rates for NOX, SO2, and PM. The 98th percentile results are provided in Table ES-1.

ES-3 11/2/2009
TABLE ES-1 – Visibility Impairment Impacts from Combined Emissions
Control Technique
NOX Emission
Rate
(lb/hr)
SO2 Emission
Rate
(lb/hr)
PM Emission
Rate
(lb/hr)
Visibility Impairment
Impact (dV)
BART 2,804 505 84.1 0.493
The modeling showed that the proposed BART emissions rates for NOX, SO2 and PM caused no Class I
area to exceed 0.5 dV for predicted visibility impairment impact (98th percentile) with Boundary Waters
Canoe Area Wilderness (Boundary Waters) showing the highest predicted visibility impairment impact at
0.493 dV for the 2007 modeled year.

1 11/2/2009
1.0 INTRODUCTION The EPA finalized the Regional Haze Regulations and Guidelines for Best Available Retrofit Technology
(BART) Determinations in 2005 (40 CFR 51, Subpart P; 40 CFR 51, App.Y). BART is defined as “an
emission limitation based on the degree of reduction achievable through the application of the best system
of continuous emission reduction for each pollutant which is emitted by a BART-eligible source. The
emission limitation must be established, on a case-by-case basis, taking into consideration the technology
available, the costs of compliance, the energy and non-air quality environmental impacts of compliance,
any pollution control equipment in use at the source, the remaining useful life of the source, and the
degree of improvement in visibility which may reasonably be anticipated to result from the use of such
technology” (40 CFR 51.301). This document presents the BART analysis for each of three major
pollutants (nitrogen oxides (NOX), sulfur dioxide (SO2), and particulate matter (PM)) for Otter Tail Power
Company’s (OTPC’s) Big Stone Plant (BSP) Unit I located near Big Stone City, South Dakota. Otter
Tail Power Company is operating agent for the Big Stone Plant co-owners: NorthWestern Energy,
Montana-Dakota Utilities, Co., a division of MDU Resources Group, and Otter Tail Power Company.
A BART eligible source is one that meets three criteria identified by EPA: (1) source is BART eligible if
operations fall within one of 26 specifically listed source categories, (2) the source entered into service
between August 7, 1962 and August 7, 1977, and (3) the source has the potential to emit 250 tons per year
or more of any air (40 CFR 51.301)). The South Dakota Department of Environment & Natural
Resources (DENR) reviewed the sources within South Dakota and independently determined which
sources are BART eligible. The DENR classified the electric generating unit (EGU) at Big Stone Plant as
BART eligible. Once a source is determined to be eligible, baseline modeling is performed to determine
if the source “contributes” to visibility impairment by exceeding EPA’s recommended 0.5 deciView (dV)
threshold. Baseline modeling results show that Unit I at BSP exceeds the 0.5 dV impact threshold and is
subject to a BART analysis.
The EPA has established guidelines for states to follow when determining BART. These guidelines are
discretionary for sources other than 750 MW power plants (40 CFR 51.308(e); 40 CFR 51, App, Y, I.H).
Per EPA’s guidelines, the general steps for determining BART for each pollutant are (40 CFR 51, Appy.
Y, IV.D.):
STEP 1 - Identify all available retrofit control technologies (within the BART Guidelines).
STEP 2 - Eliminate technically infeasible options.

2 11/2/2009
STEP 3 - Evaluate control effectiveness of remaining control technologies.
STEP 4 - Evaluate the following impacts for each feasible control technology and document results:
• The cost of compliance.
• The energy impacts.
• The non-air quality environmental impacts.
• The remaining useful life of the source.
STEP 5 – Evaluate the visibility impacts.
OTPC retained Burns & McDonnell to assist in the completion of the Best Available Retrofit Technology
analysis for Big Stone Plant (BSP) Unit I.i This report includes steps 1 through 5 of the BART
Determination for emissions from Unit I at BSP. Section 1 of the report summarizes the plant conditions,
provides the parameters used in the analysis and discusses the approach to the BART Determination. The
BART analysis for each pollutant (NOX, SO2 and PM) is provided in Sections 2 through 5. Within the
section for each pollutant, the results of each step of the BART analysis are summarized for the unit.
Summaries are provided at the end of the report that communicate the results of each step in the analyses,
that combine results obtained for each pollutant and that develop permit limit recommendations based
upon a 30 day rolling average.
1.1 BACKGROUND
Otter Tail Power Company operates the Big Stone Plant near Big Stone City, South Dakota. BSP is a
steam electric generating plant with one Babcock & Wilcox (B&W) cyclone-fired steam generating unit
burning Powder River Basin coal and a net electrical output of 475 MW. Particulate control for Unit I
was originally provided by an electrostatic precipitator. In 2001, a new developmental technology, the
Advanced Hybrid™ system, was installed. The Advanced Hybrid™ technology used both an
electrostatic precipitator and a fabric filter (baghouse) for exhaust gas particulate removal. However, the
demonstration technology encountered operational problems during its testing phase, which resulted in
decreased fabric filter life, decreased particulate removal efficiencies, and limited plant operations.
Consequently, the Advanced Hybrid™ system was deemed unacceptable for particulate emissions control
and was removed and replaced with a conventional pulse-jet fabric filter in 2007. The Advanced
Hybrid™ system is not currently used in any coal-fired power plant. Nitrogen oxides (NOx) emissions
i Burns & McDonnell plans, designs and constructs electric generating facilities and has been providing environmental services to the power industry since the 1970s. As a result of its long history providing these services, Burns & McDonnell has extensive experience in permitting, Best Available Control Technology (BACT) studies, BART analysis and control technology analysis.

3 11/2/2009
from the unit are controlled with an over-fire air system (OFA). The unit does not have controls for sulfur
dioxide emissions other than firing low-sulfur Powder River Basin coal. Unit I began operation in 1975
and is presumed to be subject to the requirements for BART analysis under the Regional Haze Rule
absent a formal determination to the contrary from the DENR.
1.2 BART ANALYSIS PARAMETERS
Table 1.2-1 contains the design and operating parameters for BSP Unit I used in the analysis. Typical
coal parameters used in the BART analysis are provided in Table 1.2-2. The economic factors for this
study are presented in Table 1.2-3.
TABLE 1.2-1 – Unit Design and Operating Parameters
Unit Characteristics
Unit I Parameters
Boiler Type Cyclone Boiler Manufacturer B&W Boiler Heat Input Capacity (descriptive), mmBtu/hr 5,609 Unit Generator Output Capacity, MW (net) 475 NOX Emissions
lb/mmBtu 0.86 lb/hr1 4,854.8
SO2 Emissions lb/mmBtu 0.86 lb/hr1 4,832.2
PM Emissions lb/mmBtu 0.015 lb/hr2 84.1
1Highest 24-hour actual average emission rates during 2001-2003 as recommended by the BART Guideline. The SO2 emission rate does not correspond to fuel sulfur content. 2Highest achievable 24-hour average emission rate based on the existing control technology emission rate and the unit heat input

4 11/2/2009
TABLE 1.2-2 – Coal Parameters
Ultimate Coal Analysis (% by mass):
PRB Typical
Moisture 29.75 Carbon 49.30 Hydrogen 3.32 Nitrogen 0.66 Chlorine 0.01 Sulfur 0.33 Ash 4.63 Oxygen 12.00 Total 100.00 Higher Heating Value, Btu/lb 8,547 Ash Mineral Analysis (% by mass): Silica 35.51 Alumina 17.11 Titania 1.26 Calcium Oxide 26.67 Magnesium Oxide 5.30 Sodium Oxide 1.68 Iron Oxide 6.07 Sulfur Trioxide 1.56 Potassium Oxide 2.87 Phosphorus Pentoxide 0.97 Strontium Oxide not reported Barium Oxide not reported Manganese Oxide not reported Total 99.00

5 11/2/2009
TABLE 1.2-3 – Economic Factors
Total Possible Operating Hours per Year 8,760 Amortization Life, Years 30 Discount Rate 9% Construction Cost Escalation 3% O&M Escalation 2% Auxiliary Electric Power Cost, $/MW-hr $25 Fly Ash Disposal Cost ($/ton) $2 Bottom Ash Disposal ($/ton) $3.50 Gypsum Waste Disposal ($/ton) $1 Operating Labor Rate, $/hr $48 Lime Cost ($/ton delivered) $145 Limestone Cost ($/ton delivered) $24 Urea Cost, ($/ton delivered) $380 Ammonia Cost ($/ton delivered) $325
1.3 APPROACH
The purpose of the Regional Haze Rule is to address visibility impairment in mandatory Class I areas that
results from the emission of SO2, NOX, PM, Volatile Organic Compounds (VOCs) and ammonia from
certain major sources. The visibility impact of VOCs and ammonia are considered negligible and are not
addressed further in this report. Before the actual BART analysis can begin, a basis must be defined for
establishing emission rates to be used for BSP Unit I. For NOX and SO2, the highest 24-hour actual
average emission rates for 2001-2003 were used for the basis as recommended by the BART guideline.
For PM, the achievable emission rate for the fabric filter installed in 2007 was used as the basis of the
study. A sulfuric acid mist (SAM) emission rate of 3.604 pounds per hour as approved in the Modeling
Protocol was used for the baseline evaluation and for all control scenarios.
In Part IV of the Guidelines for BART Determination, and discussed in Section 1.0 of this report, the
EPA provides five basic steps for a case-by-case BART analysis although states have the discretion to
adopt approaches that differ from the guidelines for sources other than 750 MW power plants. The
format of this report follows these basic steps. The approach used to complete each step is summarized
below.

6 11/2/2009
1.3.1 IDENTIFICATION OF RETROFIT CONTROL TECHNOLOGIES
The initial step in the BART determination is the identification of retrofit control technologies. In order
to identify the applicable control technologies, several reference works are consulted. A preliminary list
of control technologies and their estimated capabilities is developed.
1.3.2 FEASIBILITY ANALYSIS
The second step of the BART process is to evaluate the control processes that have been identified and
determine if any of the processes are technically infeasible. The BART guidelines discuss consideration
of two key concepts during this step in the analysis. The two concepts to consider are the “availability”
and “applicability” of each control technology.
A control technology is considered available, “if the source owner may obtain it through commercial
channels, or it is otherwise available in the common sense meaning of the term” or “if it has reached the
stage of licensing and commercial availability.” On the contrary, a control technology is not considered
available “in the pilot scale testing stages of development.” (70 FR 39165) When considering a source’s
applicability, technical judgment must be exercised to determine “if it can reasonably be installed and
operated on the source type.” The EPA also does not “expect a source owner to conduct extended trials to
learn how to apply a technology on a totally new and dissimilar source type.” (70 FR 39165) “A
technology that is available and applicable is technically feasible.” (70 FR 39165)
1.3.3 EVALUATE TECHNICALLY FEASIBLE CONTROL OPTIONS BY EFFECTIVENESS
The third step in the BART analysis is to evaluate the control effectiveness of the technically feasible
alternatives. During the feasibility determination in step 2 of the BART analysis, the control efficiency is
reviewed and presented with the description of each technology. The evaluation of the technically
feasible BART alternatives concludes with the alternatives ranked in descending order of control
effectiveness.
1.3.4 IMPACT ANALYSIS
Step four in the BART analysis procedure is the impact analysis. The BART Guidelines lists four factors
to be considered in the impact analysis:
• The costs of compliance;
• Energy impacts;
7 11/2/2009
• Non-air quality environmental impacts; and
• The remaining useful life of the source.
The first three of the four factors considered in the impact analysis are discussed in the associated
pollutant section. The remaining useful life of the source is included as part of the cost of compliance.
Due to the complexity involved with estimating costs, additional discussion is provided below.
1.3.5 METHODOLOGY FOR ESTIMATED COSTS
The economic evaluations of each control alternative are presented together for each pollutant in the
respective sections of the report. Capital and O&M cost estimates for each control alternative are
presented. The Levelized Total Annual Cost (LTAC) and Unit Control Costs for the control alternatives
are calculated and presented. The Levelized Total Annual Cost (LTAC) represents the levelized annual
cost of procurement, construction and operation over a 30 year design life in current (2009) dollars. As a
minimum, the design life for any alternative was taken to be that recommended by “The EPA Air
Pollution Control Cost Manual”, Sixth Edition, January 2002, EPA/452/B-02-001.
The LTAC is used to calculate the average annual and incremental cost effectiveness of each alternative.
The differences between alternatives are also presented graphically in the form of a plot of the LTAC
versus the annual emissions reduction (tpy) for each alternative. This form of plot graphically depicts the
cost effectiveness (in $/ton of pollutant reduction) of each alternative relative to all of the others. The
average cost effectiveness is defined as the LTAC divided by the annual emissions reduction (ton/yr).
The area on the plot indicated by the various data points represents the cost effectiveness envelope for the
alternatives under consideration. A smooth line is drawn on this plot connecting the rightmost points
(those with the lowest cost for a given level of emissions reduction). This line is referred to as the
Dominant Control Curve (DCC). The DCC defines the right hand boundary of the envelope
encompassing all of the alternatives considered. The DCC is used as a screening tool between considered
alternatives. Those alternatives whose plotted position is above and/or to the left of the DCC are not as
cost effective as those forming the line and thus can be eliminated from further analysis. An example
DCC chart was provided in the BART Guidelines.

8 11/2/2009
To more accurately compare alternatives having different costs and control efficiencies; the incremental
cost effectiveness is also determined for those alternatives on the DCC. The incremental cost
effectiveness is defined as the LTAC of a given control option minus the LTAC of an alternative, divided
by the difference between the annual emissions reduction (tpy) of the given control option and the
alternative being evaluated. The combination of these two economic analyses can be used as an argument
for the elimination of control technologies with significantly greater marginal control costs than the given
case. The equation used for the incremental cost effectiveness is shown below.

9 11/2/2009
)()(
21
21
AEAELTACLTACICF
−−
=
Where, ICF = Incremental cost effectiveness ($/incremental ton removed) LTAC1 = Levelized Total Annual Cost of control alternative No. 1 ($/yr) LTAC2 = Levelized Total Annual Cost of control alternative No. 2 ($/yr) AE1 = Control option No. 1 Annual Emissions Reduction (ton/yr) AE2 = Control option No. 2 Annual Emissions Reduction (ton/yr) (The higher cost, more effective control option is subscript 1 in this equation.)
The economic analyses presented in this report include not only the estimated capital and O&M costs for
each alternative, but also the LTAC for economic comparison of the various alternatives. In addition, the
average cost effectiveness is presented for each alternative. Finally, a comparison between alternatives,
in the form of the incremental cost effectiveness, is presented in both numerical and graphical form. Thus
a comprehensive comparison of the economic impacts of each alternative, as well as the differences in
economic impact between alternatives is clearly presented.
1.3.6 METHODOLOGY FOR VISIBILITY IMPACTS DETERMINATION
In the BART Determination Guidelines, and discussed in Section 1.0 of this report, the EPA provides five
basic steps for a case-by-case BART analysis. The fifth step involves evaluating visibility impacts
utilizing dispersion modeling. Visibility impairment impacts for modeled baseline (pre-control) and post-
control emission levels and visibility improvements are to be assessed in deciViews (dV). The BART
guidelines describe the thresholds for visibility impairment as:
“A single source that is responsible for a 1.0 dV change or more should be considered to “cause”
visibility impairment; a source that causes less than a 1.0 dV change may still contribute to
visibility impairment..... any threshold that you (the States) use for determining whether a source
“contributes” to visibility impairment should not be higher than 0.5 dV.” (70 FR 39161)
This study follows the EPA’s Regional Haze Rule threshold recommendations and thus, 0.5 dV is the de
minimis threshold level of visibility impairment impact for an otherwise BART-eligible source. In other
words, a BART-eligible source for which modeling predicts a visibility impairment impact of greater than
0.5 dV is deemed to contribute to a visibility impairment impact and thus is subject to a case-by-case
BART analysis. A BART-eligible source for which the modeling predicts less than a 0.5 dV impact

10 11/2/2009
would be deemed to not have a visibility impairment impact, and thus could be exempted from a case-by-
case BART analysis on that basis. Most noticeably, the EPA fails to address the question of whether or
not a difference in visibility impairment impact improvement of less than 0.5 dV between two BART
alternatives would constitute equivalency under the visibility analysis, or if any difference in the model
results, no matter how slight, should be interpreted as ranking one solution over the other.
The approach taken in the BART analysis for BSP incorporates the visibility analysis results as part of the
decision making process. If two alternatives have an identical potential for visibility improvement, the
remaining criteria identified for consideration as part of the impact analysis are then used to differentiate
between the two alternatives. Where similar visibility improvement potentials are identified for two or
more alternatives, the incremental cost to achieve the slightly greater visibility improvement is
determined and evaluated against incremental costs for the next most stringent alternative. This approach
identifies the more effective BART alternative in terms of regional haze considerations, not in terms of
the most stringent control alternative, as would happen if a strictly top-down approach had been
implemented.
1.3.7 ADDITIONAL APPROACH METHODS
In addition to the steps discussed above, the presumptive limits and their application to power plants
smaller than 750 MW in size warrant mention due to their effects on the contents of the report. For power
plants greater than 750 MW in size, the EPA requires state agencies to apply the presumptive limits for
BART as a floor for NOX or SO2 control. However, for power plants smaller than 750 MW in size, the
presumptive limits are described as being “generally cost-effective” but not set as a minimum
performance requirement (see, e.g., 40 CFR 51, App. Y, IV.E.4). Thus, EGUs at power plants smaller
than 750 MW in size, like BSP, are not required to meet the presumptive BART limits. This BART
analysis for BSP will evaluate potential control options that can attain presumptive limits on typical
EGUs. However, based upon the feasibility analysis, the recommended control options may not achieve
the EPA’s presumptive BART limits for specific pollutants.
1.4 THE ROLE OF MODELING AND CALPUFF IN A BART ANALYSIS
The BART guidelines list visibility impact at a Class I area as one of the factors in a BART
determination. For Class I areas more than 50 km from a source, the EPA has identified CALPUFF as a
guideline model for long-range transport that is suitable for predicting potential changes in visibility.

11 11/2/2009
CALPUFF is a non-steady-state meteorological and air quality dispersion modeling system used to assess
long-range transport of pollutants. Seven Class I areas have been identified for inclusion in the visibility
analysis for BSP. These are the Theodore Roosevelt National Park (NP), the Lostwood National Wildlife
Refuge (WR), Voyagers NP, Isle Royal NP, Boundary Waters Canoe Area Wilderness, Badlands NP, and
Wind Cave NP, the closest of which is more than 400 km (248 miles) from BSP.
1.4.1 CALPUFF MODELING METHODOLOGY
The specific version of CALPUFF, coordinate grid points, wind field options, terrain, dispersion options,
receptor coordinates and plume characteristics and other model parameters approved by the DENR were
used for modeling. Meteorological data for the years 2002, 2006 and 2007 were used for the modeling.
In order to predict the change in light extinction at the Class I areas, SO2, NOX, and PM were modeled
with CALPUFF using pre-control (baseline) and post-control emission scenarios. A variety of post-
control scenarios were modeled to determine the reduction in visibility impact for each control
technology.
The BART guideline states that a visibility improvement is based upon the modeled change in visibility
impacts, measured in deciViews, for the pre-control and post-control emission scenarios. The comparison
should be made for the 98th percentile days (40 CFR 51, App. Y, IV.D.5). In other words, visibility
impacts should be compared on an annual basis using the eighth highest day for comparison (365 * (1-
.98) ≈ 7 days of acceptable exceedance). Therefore, the visibility impairment impact reduction presented
for each control scenario in this section is based on the 98th percentile value or eighth highest day.
1.4.2 MODELING SCENARIOS
Since a BART analysis is based on the degree of visibility impairment reduction achieved by the
application of control technologies, the CALPUFF analysis examined multiple emission scenarios based
upon the feasible control technologies identified for each pollutant. These scenarios represent the
emissions of SO2, NOX, and PM under the following conditions:
• Baseline NOX, SO2 and PM emissions
• PM emissions based upon existing controlled baseline conditions, and NOX and SO2 emissions
based upon application of several control technologies
The modeled emission rates in each scenario are presented in Table 1.4-1.

12 11/2/2009
TABLE 1.4-1 – Big Stone Plant Modeling Scenarios
Unit I
Scenario NOX (lb/h)
SO2 (lb/h)
PM (lb/h)1
0 Baseline 4,854.8 4,832.2 84.1
1 Over-fire Air (OFA) Presumptive Dry FGD 3,645.9 841.4 84.1
2 OFA Presumptive Wet FGD 3,645.9 841.4 84.1
3 OFA Dry FGD at 90% Control 3,645.9 504.8 84.1
4 OFA Wet FGD at 95% Control 3,645.9 241.2 84.1
5 Separated OFA (SOFA) Presumptive Dry FGD 2,804.5 841.4 84.1
5A SOFA Dry FGD at 90% Control 2,804.5 504.8 84.1
5B SOFA Wet FGD at 95% Control 2,804.5 241.2 84.1
6 SNCR with SOFA Presumptive Dry FGD 1,963.2 841.4 84.1
7 RRI+SNCR with SOFA Presumptive Dry FGD 1,121.8 841.4 84.1
8 SCR with SOFA Presumptive Dry FGD 560.9 841.4 84.1
1 – The PM technology for all modeling scenarios is the existing pulse-jet fabric filter.
These scenarios represent the range of emissions evaluated for consideration in making a BART
determination. The baseline scenario is based on the historical, highest 24-hour actual average SO2 and
NOX emission rates for BSP between 2001 and 2003. The emission rate for PM is the achievable
controlled emission rate for the existing fabric filter. Due to the number of variations involved for each
pollutant, the scenarios are discussed in the section related to the controlled pollutant.

13 11/2/2009
2.0 NOX BART EVALUATION The BART analysis steps 1 through 5 for NOX emissions from BSP are described in this section.
Potentially applicable NOx control technologies are first identified. A brief description of the processes
and their capabilities are then reviewed for availability and feasibility. A detailed technical description of
each control technology is provided in Appendix A1. Subsequently, those available technologies deemed
feasible for retrofit application are ranked according to nominal NOx control capability. The impacts
analysis then reviews the estimated capital and O&M costs for each alternative, including Balance Of
Plant (BOP) requirements. Following the cost determination, the energy impacts and non-air quality
impacts are reviewed for each technology. The impact based on the remaining useful life of the source is
reviewed as part of the cost analysis. In the final step of the analysis, feasible and available technologies
are assessed for their potential visibility impairment impact reduction capability via visibility modeling
results. The results of the impact analyses are tabulated and potential BART control options are listed.
2.0.1 BART GUIDELINE NOX LIMITS FOR CYCLONE-FIRED BOILERS
EPA’s presumptive limit for emissions of nitrogen oxides from cyclone-fired boilers, which does not
apply to BSP, was established in the final BART Guidelines1:
“The use of SCRs at cyclone units burning bituminous coal, sub-bituminous coal, and lignite
should enable the units to cost-effectively meet NOX rates of 0.10 lbs/mmBtu. As a result, [the
EPA] are establishing a presumptive NOx limit of 0.10 lbs/mmBtu based on the use of SCR for
coal-fired cyclone units greater than 200 MW located at 750 MW power plants. ” [70 FR 39172]
40 CFR 51, App. Y, IV.E.5. While Unit I at BSP is greater than 200 MW output, it is not located at a 750
MW power plant. Thus, Unit I is not subject to presumptive limits.
2.1 IDENTIFICATION OF RETROFIT NOX CONTROL TECHNOLOGIES
The first step in the BART evaluation for NOx emissions is to identify potentially applicable retrofit
control alternatives. A comprehensive literature search was performed, with sources including technical
papers and presentations made by parties involved with design, construction, and testing of NOX control
techniques at conferences sponsored by nationally-recognized technical organizations, plus hardware
supplier experience lists.

14 11/2/2009
There are two basic categories of NOX emission control alternatives:
• Combustion controls; and
• Post-Combustion controls.
A summary of the potentially available alternatives identified for NOX emissions control on coal-fired
cyclone units is shown in Table 2.1-1.
TABLE 2.1-1 – Potentially Available NOX Control Alternatives Identified for BART Analysis
Combustion Controls
Low-NOX Burners (LNBs)
Over-fire Air (OFA)
Separated Over-fire Air (SOFA)
Post-Combustion Controls
Selective Non-Catalytic Reduction (SNCR)
Rich Reagent Injection (RRI)
Selective Catalytic Reduction (SCR)
2.2 TECHNICAL DESCRIPTIONS AND FEASIBILITY ANALYSIS OF NOX CONTROL TECHNOLOGIES
The second step of the BART process is to evaluate the control processes that have been identified and
eliminate any that are technically infeasible for application at the source. The following paragraphs
summarize the evaluation of the processes for technical feasibility for BSP Unit I NOX controls. A detailed
description of the various NOX control technology retrofits and their technical feasibility is included in
Appendix A1, with the associated references for technical literature.
2.2.1 FEASIBILITY OF COMBUSTION NOX CONTROLS
The following combustion controls are potentially feasible technologies that are applied to a cyclone-fired
boiler.
• An over-fire air (OFA) system has already been implemented on the Unit I boiler with the ability to
significantly lower NOX emissions. Implementation of more stringent operational procedures to

15 11/2/2009
maintain significantly lower NOX emissions with the existing OFA system was considered a
feasible application at BSP for Unit I.
• Separated over-fire air (SOFA) systems have been retrofit to many cyclone boilers for combustion
NOX control. 2,3,4,5,6 SOFA offers the highest performing version of this technology for cyclone
boilers, and may include relocating vent ports and/or flue gas recirculation ports. SOFA is a
feasible technology for BSP Unit I and is included in the control effectiveness analysis for
additional NOX. The NOX control improvements through use of SOFA on Unit I will be limited by
potential adverse impacts on cyclone operation associated with air-staged (sub-stoichiometric
air/fuel) cyclone operation, which are described in Appendix A1.
Low-NOX burners (LNBs), while commonly applied to pulverized coal-fired boilers, are not applicable to
cyclone fired units since initial combustion occurs in the barrel-shaped cyclone and not in the furnace
chamber as is the case for the pulverized coal-fired boiler. Therefore, they will not be considered further.
2.2.2 FEASIBILITY OF POST-COMBUSTION NOX CONTROLS
Post-combustion controls involve technologies that are applied to the flue gas after the combustion
process. Typically these processes involve the use of a reagent to chemically react with NOX. These are
summarized as follows; for more details, refer to the technical feasibility evaluation included in Appendix
A1:
• SNCR has been applied on several cyclone-fired boilers since 1995 and its installation on the Unit I
cyclone boiler is considered feasible. 7,8,9 Because BSP Unit I already has OFA for NOX control,
SNCR will be evaluated in conjunction with the existing OFA or SOFA.
• Rich Reagent Injection (RRI) injects aqueous urea into the high-temperature lower furnace zone
and requires an “air-starved” atmosphere to avoid creating instead of reducing NOX. RRI has been
developed and demonstrated with application intended only on cyclone boilers.9,10,11,12 RRI has
been installed and is commercially available.
o RRI is susceptible to impairment due to fouling by ash slag deposits and heat-related damage of
injection nozzles, which are located near the cyclones in the lower furnace.
o RRI is considered feasible for application on cyclone boilers operating under substoichiometric
conditions with advanced forms of SOFA and in combination with SNCR for NOX control at BSP
Unit I.
• Selective Catalytic Reduction (SCR) technology has been installed on 22 cyclone-fired boilers in
the U.S., burning bituminous or sub-bituminous coals, and its installation on BSP Unit I for

16 11/2/2009
additional NOX control is considered technically feasible. 34 As with SNCR, SCR will be evaluated
in conjunction with the existing OFA or SOFA.
2.2.3 RESULTS OF FEASIBILITY ANALYSIS
The results of the evaluation of the identified BART alternatives following the feasibility analysis are
summarized in Table 2.2-1.
TABLE 2.2-1 – NOX BART Feasibility Analysis Results
Control Technology
In service on Existing Utility
Boilers Commercially
Available
Technically Applicable To Big
Stone Plant Over-fire Air (OFA) Yes Yes Yes Separated OFA (SOFA) Yes Yes Yes Selective Non-catalytic Reduction (SNCR) with OFA or SOFA
Yes Yes Yes
Rich Reagent Injection (RRI) + SNCR with SOFA
Yes Yes Yes
Selective Catalytic Reduction (SCR) with OFA or SOFA
Yes Yes Yes
2.3 CONTROL EFFECTIVENESS EVALUATION OF NOX CONTROL TECHNOLOGIES
Control options that offer zero or very small additional control performance at a significant cost impact
were not included in impact analysis. Alternatives that are equally effective in predicted emission
reduction percentage but are more expensive to install and operate, or have more substantial operational
limitations compared to other feasible alternatives, were also eliminated from further analysis. Table
2.3-1 lists the feasible control technologies and indicates the technologies evaluated in the analysis.

17 11/2/2009
TABLE 2.3-1 – Evaluated NOX Control Technologies
Control Technology
Approximate Control
Efficiency Evaluated Over-fire Air (OFA) 25 Yes
Separated OFA (SOFA) 42 Yes Selective Non-catalytic Reduction (SNCR) with OFA 60 No1 SNCR with SOFA 60 Yes Rich Reagent Injection (RRI)+SNCR with SOFA 77 Yes Selective Catalytic Reduction (SCR) with OFA
88 No2
SCR with SOFA 88 Yes
1 – Due to an estimated $1,810,000 increase in levelized annual costs for the same level of control as SNCR with SOFA, this technology would be above the dominant controls curve and are not evaluated further as described in Section 1.3.5. 2 – Due to an estimated $140,000 increase in levelized annual costs for the same level of control as SCR with SOFA, this technology would be above the dominant controls curve and are not evaluated further as described in Section 1.3.5
Available NOX emission control options considered feasible for BSP Unit I boiler are listed in Table 2.3-2
in descending order of control effectiveness. Ranking of the alternatives in Table 2.3-2 assumes that the
baseline level of NOX emissions for the BSP Unit I boiler is associated with the emission rate of 0.86
lb/mmBtu.
The emission reduction (control effectiveness) percentages developed for the feasible alternatives shown
in Table 2.3-2 are estimates based upon engineering judgments with considerations of:
• the general combustion properties of Powder River Basin (PRB) coal;
• published and available emission reduction performance achieved at other similar utility power
plants (wet-bottom cyclone-fired boilers); and
• inclusion of performance margins to allow for variations in fuel, weather, equipment condition,
and other factors that prevent the ultimate peak short-term performance from being reliably
sustained over the course of long-term operation.
The potential operational limitations mentioned in the detailed feasibility discussions included in
Appendix A1 for deeply air-staged cyclones associated with separated over-fire air and Rich Reagent
Injection alternatives are expected to limit the amount of NOX control potential possible compared to
other boiler types where this technique or technology was applied.

18 11/2/2009
TABLE 2.3-2 – Estimated Control Options NOX Emission Rates Evaluated
NOX Control Technique
Emission
Rate
(lb/mmBtu)
Control
Percentage
Hourly
Emission (lb/hr)
SCR w/ SOFA 0.10 88 560.9
Rich Reagent Injection (RRI)+SNCR w/ SOFA 0.20 77 1,121.8
SNCR w/ SOFA 0.35 60 1,963.2
Separated Over-fire Air (SOFA) 0.50 42 2,804.5
Over-fire Air (OFA) 0.65 25 3,645.9
Baseline 0.86 -- 4,854.8
2.4 EVALUATION OF IMPACTS FOR FEASIBLE NOX CONTROLS
The fourth step of a BART analysis is to evaluate the following impacts of feasible emission controls:
• The cost of compliance.
• The energy impacts.
• The non-air quality environmental impacts.
• The remaining useful life of the source.
The purpose of the impacts evaluation is to determine if there are any energy, economic, non-air quality
environmental reasons, or aspects of the remaining useful life of the source, which would eliminate the
remaining control technologies from consideration for BSP Unit I.
2.4.1 COST IMPACTS OF NOX CONTROLS
An evaluation was performed to determine the compliance costs of installing various feasible NOX control
alternatives on BSP Unit I boiler. This evaluation included estimates for:
• Capital costs;
• Fixed and variable operating and maintenance (O&M) costs; and
• Levelized total annual costs to engineer, procure, construct, install, startup, test, and place into
commercial operation a particular control technology.

19 11/2/2009
The results of this evaluation are summarized in Tables 2.4-1 through 2.4-6.
2.4.1.1 CAPITAL COST ESTIMATES FOR NOX CONTROLS The capital costs to implement the various NOX control technologies were largely estimated from unit
output capital cost factors ($/kW) published in technical papers discussing those control technologies.
Anticipated costs unique to BSP that are necessary for installation of the control technology were also
identified. In the cases involving SNCR or RRI, vendor budgetary cost information was obtained and
used in place of, or to adjust, the published unit output cost factors. These cost estimates were considered
to be study grade, which is + or – 30% accuracy.
A review of the unit capital cost factor and associated capital costs for the feasible NOX emission
reduction technology evaluated for BSP are presented in Table 2.4-1.
TABLE 2.4-1 – Unit Capital Cost Factors of Feasible NOX Control Options
NOX Control Technique
Unit Capital
Cost1 ($/kW)
Capital Cost ($1000)
SCR with SOFA 1722 81,800
RRI + SNCR with SOFA 343 16,200
SNCR with SOFA 25 11,900
Separated Over-fire Air (SOFA) 10 4,800
Over-fire Air (OFA) Existing Existing
1 – Unit capital cost factors ($/kW) of these individual technologies were combined by simple addition. Actual installed costs may differ due to positive or negative synergistic effects.
2 – Estimate taken from CUECost adjusted to reflect Burns & McDonnell project experience included in Appendix A2.
3 – RRI estimate is taken from the DOE report, “Field Testing of Advanced Layered Technology Approach (ALTA™) for NOx Control in Sioux Unit 1”.
2.4.1.2 OPERATING AND MAINTENANCE COST ESTIMATES FOR NOX CONTROLS
The operation and maintenance costs to implement the NOX control technology evaluated for BSP Unit I
were largely estimated from cost factors established in the EPA’s Air Pollution Control Cost Manual

20 11/2/2009
(OAQPS), and from engineering judgment applied to that control technology. These cost estimates were
considered to be study grade, which is + or – 30% accuracy.
Fixed and variable operating and maintenance costs considered and included in each NOX control
technology’s O&M costs are estimates of:
• Auxiliary electrical power consumption for operating the additional control equipment;
• Reagent consumption, and reagent unit cost for SCR, SNCR and RRI alternatives;
• Catalyst replacement for SCR; and
• General operating labor, plus maintenance labor and materials devoted to the additional emission
control equipment and its impact on existing boiler equipment.
A review of the estimated operation and maintenance costs for the feasible NOX emission reduction
technology evaluated for BSP are presented in Table 2.4-2.
TABLE 2.4-2 – Estimated O&M Costs for NOX Control Options
NOX Control Alternative
First Year O&M Cost
($1,000) SCR with SOFA 4,110
RRI+SNCR and SOFA 7,260
SNCR with SOFA 2,120
Separated Over-fire Air (SOFA) 152
Over-fire Air (OFA) 106
In order to compare a particular NOX emission reduction alternative during the cost of compliance impact
analysis portion of the BART selection process, the basic methodology defined in the BART Guidelines
was followed. The Levelized Total Annual Cost (LTAC) of these NOX control alternatives was
calculated based on the same economic conditions and a 30 year project life (see Section 1.3.5 of this
BART evaluation for methodology details). Estimated capital costs were split evenly over a two year
construction period for all alternatives and a present value was calculated. Table 2.4-3 shows the
estimated present value capital cost and annualized cost values for the various feasible NOX emission
reduction technologies. These are listed in order of control effectiveness, with the highest ranked options
at the top.

21 11/2/2009
TABLE 2.4-3 – Capital and Annualized Costs Estimated for NOX Control Alternatives
NOX Control Alternative
Capital Cost1
($1000)
Present ValueCapital
Cost
($1,000)
First Year O&M Cost
($1,000)
Levelized Cost2
($1,000) SCR with SOFA 81,800 76,800 4,110 13,210 RRI+SNCR and SOFA 16,200 15,200 7,260 11,390 SNCR with SOFA 11,900 11,200 2,120 3,990 Separated Over-fire Air (SOFA) 4,800 4,500 152 650
Over-fire Air (OFA) 0 0 106 140
1 – Installed capital cost is estimated for determination of total capital cost for a control technology, assuming maximum unit output capacity is based on 475,000 kW.
2 – Levelized Total Annual Cost = Annualized Installed Capital Cost + Levelized Annual O&M cost. The Annualized O&M cost factor = 1.361 and the Capital Recovery Factor = 0.0991
The average cost effectiveness was then determined as the LTAC divided by baseline annual tons of
pollutant emissions that would be avoided by implementation of the respective alternative. Table 2.4-4
shows the average cost effectiveness comparison for the NOX control technologies. The feasible control
alternatives were also compared by calculating the change in LTAC per incremental ton of pollutant
removed for the next most stringent alternative (incremental cost effectiveness). This identified which
alternatives produced the highest increment of expected pollutant reduction for the estimated lowest
average LTAC increment compared with the pre-control baseline emission rate. The expected annual
number of tons of pollutant removed versus estimated LTAC for each remaining control alternative was
then plotted.

22 11/2/2009
TABLE 2.4-4 – Estimated Annual Emissions and LTAC for NOX Control Alternatives
NOX Control Alternative
Annual NOX
Emissions1
(Tons/yr)
Annual NOX Emissions Reduction1
(Tons/yr)
Levelized Total
Annual Cost
($1,000)
Average Cost
Effectiveness($/ton)
SCR with SOFA 2,090 16,000 13,210 825
RRI+SNCR and SOFA 4,180 13,910 11,390 818
SNCR with SOFA 7,310 10,780 3,990 197
Separated Over-fire Air (SOFA) 10,440 7,640 650 85
Over-fire Air (OFA) 13,570 4,510 140 31
Baseline 18,080 - - -
1 – Annual NOX emissions and control level based upon 8,760 hours of operation and 85% capacity factor.
The comparison of the cost-effectiveness of the control options evaluated for BSP is shown in Figure
2.4-1. The estimated annual amount of NOX removal (emission reduction) in tons per year is plotted on
the abscissa (horizontal axis) and the estimated LTAC in thousands of U.S. dollars per year on the
ordinate (vertical axis).

23 11/2/2009
Figure 2.4-1 – NOX Control Cost Effectiveness
SNCR/ SOFA
SCR / SOFA
SOFAOFA
RRI/SNCR/SOFA
0
2,000
4,000
6,000
8,000
10,000
12,000
14,000
- 2,000 4,000 6,000 8,000 10,000 12,000 14,000 16,000 18,000
Emissions Reduction (tpy)
Tota
l Lev
eliz
ed C
osts
($10
00)
The purpose of Figure 2.4-1 is to show the range of control and cost for the evaluated NOX reduction
alternatives and identify the least-cost controls so that the Dominant Controls Curve (DCC) can be created.
The DCC is the best fit line through the points forming the lower rightmost boundary of the data zone on a
scatter plot of the LTAC versus the annual NOX removal tonnage for the various remaining BART
alternatives. Points distinctly to the left of and above this curve are inferior control alternatives per the
BART Guidelines on a cost effectiveness basis. Following a “bottom-up” graphical comparison approach,
each of the NOX control technologies represented by a data point to the left of and above the least cost
envelope should be excluded from further analysis on a cost efficiency basis. Of the highest-performing
versions of the technically feasible NOX control alternatives evaluated for cost-effectiveness, the data point
for RRI/SNCR/SOFA is seen to be more costly for fewer tons of NOX removed than for SCR with SOFA.
This appears to be an inferior control, and thus should not be included on the least cost and DCC boundary.
Figure 2.4.2 provides the DCC.
24 11/2/2009
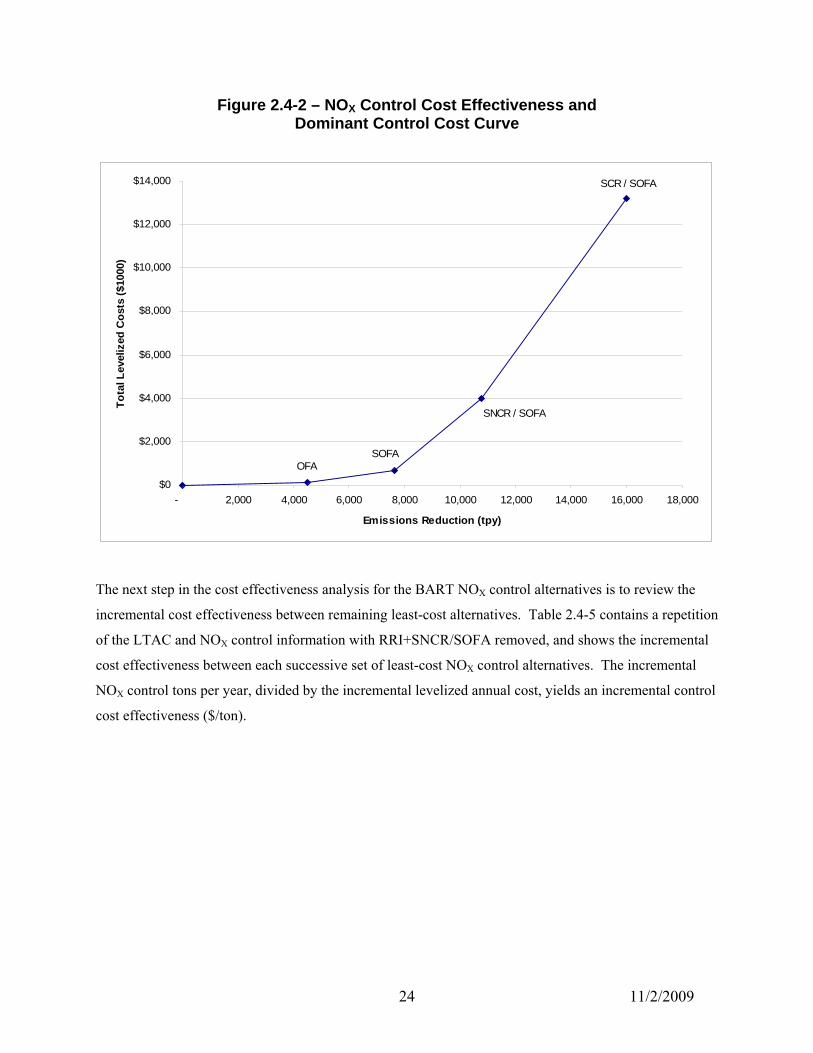
Figure 2.4-2 – NOX Control Cost Effectiveness and Dominant Control Cost Curve
OFASOFA
SCR / SOFA
SNCR / SOFA
$0
$2,000
$4,000
$6,000
$8,000
$10,000
$12,000
$14,000
- 2,000 4,000 6,000 8,000 10,000 12,000 14,000 16,000 18,000
Emissions Reduction (tpy)
Tota
l Lev
eliz
ed C
osts
($10
00)
The next step in the cost effectiveness analysis for the BART NOX control alternatives is to review the
incremental cost effectiveness between remaining least-cost alternatives. Table 2.4-5 contains a repetition
of the LTAC and NOX control information with RRI+SNCR/SOFA removed, and shows the incremental
cost effectiveness between each successive set of least-cost NOX control alternatives. The incremental
NOX control tons per year, divided by the incremental levelized annual cost, yields an incremental control
cost effectiveness ($/ton).

25 11/2/2009
TABLE 2.4-5 – Estimated Incremental Annual Emissions and LTAC for NOX Control Alternatives
NOX Control Technique
Levelized Total
Annual Cost
($1,000)
Annual Emission
Reduction1
(Tons/yr)
Incremental Levelized
Total Annual Cost2
($1,000)
Incremental
Annual Emission
Reduction1,2
(Tons/yr)
Incremental Control Cost Effectiveness
($/ton)3
SCR with SOFA 13,210 16,000 9,220 5,220 1,766
SNCR with SOFA 3,990 10,780 3,340 3,140 1,063
SOFA 650 7,640 510 3,130 163
OFA 140 4,510 140 4,510 31
1 – Annual NOX emissions and control level based upon 8,760 hours of operation and 85% capacity factor. 2 – Increment based upon comparison between consecutive alternatives (points) from lowest to highest. 3 – Incremental control cost effectiveness is incremental LTAC divided by incremental annual emission reduction (tons per
year).
In the final BART Guidelines, the EPA does not propose hard definitions for reasonable or unreasonable
average or incremental cost effectiveness values. As can be seen from a review of Table 2.4-4, the
average levelized control cost effectiveness of control alternatives ranges from $31/ton to $825/ton.
The incremental cost effectiveness is a measure of the increase in marginal cost effectiveness between
two specific alternatives. The incremental cost analysis indicates that from a cost effectiveness
viewpoint, the most costly alternative is SCR with SOFA. This control option is considered technically
feasible for BSP, but incurs a significant annual (levelized) incremental cost compared to the other
feasible NOX control techniques.
2.4.2 ENERGY IMPACTS OF NOX CONTROL ALTERNATIVES
The feasible NOX control alternatives were reviewed for significant or unusual energy penalties or
benefits associated with their use. There are several basic kinds of energy impacts for NOX emissions
controls:
• Potential increase or decrease in power plant energy consumption resulting from a change in
thermal (heat) energy to net electrical output conversion efficiency of the unit, usually expressed
as an hourly unit heat rate (Btu/kW-hr). This may or may not change the net electrical output

26 11/2/2009
(MW) capacity of the EGU depending on if there are physical or imposed limits on the total heat
input to the boiler or electrical power output.
• Potential increase or decrease in net electrical output of the unit resulting from changes in
physical operational limitations imposed on the ability to sustain a fuel heat input rate
(mmBtu/hr), which results in a potentially lower or higher unit net electrical output (MW)
capacity. This is effectively a change in net electrical output (MW) capacity of the EGU.
• Potential increase or decrease in net electrical output of the unit resulting from changes in
auxiliary electrical power demand and usage (kW, kW-hrs). This is effectively a change in net
electrical output (MW) capacity of the EGU.
• Potential increase or decrease in reliability and availability to generate electrical power. This
results in a change to the number of hours of annual operation, not necessarily a change in net
electrical output (MW) capacity of the EGU.
There should not be a major impact on energy consumption by the operation of the variations of an over-
fire air (OFA) system, such as separated over-fire air (SOFA). An OFA system does not significantly
change the total amount of air introduced into the boiler, only the location where it is introduced.
Combustion air damper actuators’ electrical power demand would be an insignificant (+ 1 kW) change in
net electrical power consumption. For cyclone boilers, providing effective volumes and velocities of
separated over-fire air at the injection ports should not require higher forced draft fan power consumption
resulting from higher fan discharge pressure. Higher vent ductwork pressure drop impacts of the OFA
system on the forced draft fans’ auxiliary electrical power consumption are expected to be negligible (less
than 1% of the annual auxiliary power consumed by these fans) so that unit net electrical output (MW)
capacity is essentially the same as the current nameplate rating.
Boiler furnace exit gas temperature and superheater steam / reheater steam outlet temperatures may be
slightly elevated during air-staged cyclone operation with OFA. This impact on the boiler’s operation is
typically small, and within the design capabilities of the boiler from a heat transfer and mechanical stress
standpoint. This small negative impact (much less than 1%) on the plant unit heat rate (higher Btu/kW-
hr) was not quantified, as the historical variation in coal heat content that influences plant unit heat rate is
expected to have more significant impacts.
OFA is not expected to significantly reduce unit reliability and availability to generate electrical power,
once the amount of secondary combustion air that can be withdrawn from the cyclones is established for
consistent combustion and continuous slag tapping under substoichiometric air/fuel operating conditions.

27 11/2/2009
There may be some changes in the degradation rate of the boiler’s furnace waterwall tubes resulting from
exposure of more area of the furnace walls to slightly air-starved conditions during OFA operation. Such
conditions can promote corrosion from sulfur compounds in the furnace gases being created above the
cyclones and below the OFA injection ports. Due to the relatively small amounts of sulfur content in the
PRB coal and the modest amount of air-staging of the existing cyclones during OFA operation, the
expected change in corrosion rate of the boiler tubes should be minor. This degradation is expected to
occur over many years of operation, and normally requires periodic replacement of the deteriorated
sections of boiler furnace waterwall tubes to avoid forced outages to repair tube leaks or failed sections.
The potential change in the frequency of furnace wall tube failures and changeouts is difficult to estimate,
and has not been quantified.
For SNCR-related NOX control alternatives, the injection of a diluted urea solution requires some
additional auxiliary power for heating and pumping the liquid, and using compressed air for atomization
and cooling the reagent injection nozzles/lances, on the order of 150 to 400 kW. The injection of water
(used for urea dilution) into the boiler flue gas also has a small negative impact on the plant heat rate
(higher Btu/kw-hr), which is approximately equal to the heat released from the reaction of the reagent
with NOX or oxygen. The impact of additional flue gas created by operation of an SNCR-related system
on induced draft fan power consumption should be insignificant.
For the SCR NOX control alternative, the system requires the same 150 to 400 kW of auxiliary power for
heating and pumping the reagent (ammonia) as SNCR, and using compressed air for atomization and
cooling the reagent injection nozzles/lances, on the order of 150 to 400 kW. If a urea based reagent feed
system is used, an additional 400 kW of auxiliary power is required to convert the urea to ammonia.
However, the major consumer of auxiliary power for a SCR is additional induced draft fan power needed
to overcome the additional 6 to 9 inches of water column pressure drop created by the addition of catalyst
and ductwork. In most cases, the addition of an SCR would require replacement of the induced draft fans
and depending upon the fan and motor efficiency additional 400 to 1000 kW of auxiliary power.
2.4.3 NON AIR QUALITY AND OTHER ENVIRONMENTAL IMPACTS OF NOX CONTROL ALTERNATIVES
Operation using OFA or SOFA systems for NOX emissions control will increase the amount of unburned
carbon in the flyash produced by the boiler and collected for disposal by small increments. The potential

28 11/2/2009
changes in the annual amounts of flyash disposal rates are expected to be inconsequential, and have not
been quantified.
Operation of an SCR or SNCR system will normally create a small amount of unreacted ammonia or urea
to be emitted into the flue gas. The amount of ammonia slip produced depends on the amount of reagent
utilization and location of the injection points. Higher NOX reduction performance involves greater
amounts of reagent usage and ammonia slip. This is typically controlled to less than 10 ppmvd,
especially since the possible formation of sulfates such as ammonium sulfate [(NH4)2SO4] and ammonium
bisulfate [NH4HSO4] will be more problematic at higher slip levels. Sulfur trioxide (SO3) can also be
formed during combustion in the boiler or conversion in the SCR to combine with ammonia during
passage through the flue gas ductwork to form the sulfates.
Some of the unreacted ammonia and other compounds discussed above will be collected with the flyash
in the pulse-jet fabric filter. If a scrubber is installed, some of the ammonia and other compounds will be
captured. These collected materials may impact the disposal of fly ash or scrubber blow down.
Storage of ammonia reagent on-site creates the potential for accidents, leaks, and subsequent releases to
air, ground, and surface water immediately surrounding the facility. Regulation of storage and
containment of such reagents s will be under the requirements of various federal Acts.
2.4.4 VISIBILITY IMPAIRMENT IMPACTS OF NOX CONTROLS
The final impact analysis conducted was to assess the visibility impairment impact reduction for the NOX
control technologies. The analysis used a baseline NOX emission rate which assumed the highest 24-hour
actual emission rate for 2001-2003 as recommended by the BART guideline and listed in the Modeling
Protocol. Four CALPUFF model runs for BSP were conducted with the constant SO2 emission rate of
0.15 lb/mmBtu, constant PM emission rate of 0.015 lb/mmBtu, and various levels of NOX control. Table
2.4-6 shows the modeled emission rates.
The difference between the modeled impacts at the 98th percentile level from various controlled emission
rates represents the visibility impairment impact reduction in deciViews (dV). Table 2.4-6 shows the
results of the visibility impact modeling attributable to NOx reductions while maintaining PM and SO2
emissions constant. A table containing the 98th percentile results for all modeled years and Class I areas
is included in Appendix A3. Combined impacts from all pollutants are addressed later in the report.

29 11/2/2009
TABLE 2.4-6 – Visibility Impairment Impacts from Emission Controls
NOX Control Technique
Emission
Rate
(lb/mmBtu)
Visibility Impairment
Impact (dV)
Visibility Impairment Reduction
(Δ dV)1
Technology Incremental Reduction
(Δ dV)
SCR with SOFA 0.10 0.170 0.487 0.218
SNCR with SOFA 0.35 0.388 0.269 0.136
Separated Over-fire Air (SOFA) 0.50 0.524 0.133 0.133
Over-fire Air (OFA) 0.65 0.657 - -
Baseline 0.86 1.079 - -
1 – Impairment reduction is from OFA levels.
The results of the baseline visibility impairment modeling for BSP showed that NOX emissions caused a
Class I area to exceed 0.5 dV for predicted visibility impairment impact (98th percentile). Modeled
visibility impairment impacts decreased with the addition of NOX controls.
The 0.5 dV value is the lowest visibility impairment impact that is considered discernible by the human
eye and the EPA set this threshold as the point where a given source is considered a “contributing source”
(40 CFR 51, App. Y, III.A.1.). Thus, an impairment impact of less than 0.5 dV is considered visibly
indiscernible. The difference in impacts between OFA (lowest control level) and SCR (highest control
level) is less than 0.5 dV, which is visibly indiscernible. To assess the cost effectiveness of the various
controls with respect to visibility improvement, the incremental cost to achieve the visibility improvement
is determined and evaluated against incremental costs for the next most stringent alternative. Table 2.4-7
shows the costs to achieve the incremental reduction in visibility impairment.

30 11/2/2009
TABLE 2.4-7 – Cost for Incremental Visibility Improvement
NOX Control Technique
Incremental Levelized Total Annual Cost1
($)
Impairment Reduction
(Δ dV)
Incremental Reduction
(Δ dV)
Cost for Incremental
Improvement ($/dV)
SCR with SOFA 9,220,000 0.487 0.218 42,290,000
SNCR with SOFA 3,340,000 0.269 0.136 24,560,000
Separated Over-fire Air (SOFA) 510,000 0.133 0.133 3,830,000
Over-fire Air (OFA) 140,000 - - -
1 – Increment based upon comparison between consecutive alternatives (points) from lowest to highest.
2.4.5 SUMMARY OF IMPACTS OF NOX CONTROLS – BSP UNIT I
Table 2.4-8 summarizes the various quantifiable impacts discussed in Sections 2.4.1 through 2.4.4 for the
NOX alternatives evaluated for BSP Unit I.
TABLE 2.4-8 – Impacts Summary for BSP Unit I NOX Controls
NOX Control Technique
Emission
Rate
(lb/mmBtu)
Levelized Total
Annual Cost
($1,000)
Incremental Levelized
Total Annual Cost1
($1,000)
Visibility
Impairment Impact
(dV)
Visibility
Impairment Reduction
(dV)
Technology Incremental Reduction
(Δ dV)
SCR with SOFA 0.10 13,210 9,220 0.170 0.487 0.218
SNCR with SOFA 0.35 3,990 3,140 0.388 0.269 0.136
Separated Over-fire Air (SOFA) 0.50 650 510 0.524 0.133 0.133
Over-fire Air (OFA) 0.65 140 140 0.657 - -
Baseline 0.86 - - 1.079 - -
1 – Increment based upon comparison between consecutive alternatives (points) from lowest to highest.

31 11/2/2009
NOX SECTION REFERENCES: 1. “Regional Haze Regulations and Guidelines for Best Available Retrofit Technology (BART)
Determinations”; Environmental Protection Agency; Federal Register, Volume 70, No. 128; July 6, 2005. 2. “The State of the Art in Cyclone Boiler NOX Reduction”, by O’Connor, Dave, Himes, Rick, and Facchiano,
Tony (Electric Power Research Institute), presented at the EPRI-DOE-EPA Combined Utility Air Pollutant Control Symposium, Atlanta, GA, August 16-20, 1999.
3. “B&W’s Advances on Cyclones NOX Control Via Fuel and Air Staging Technologies”, by Farzan, H.,
Maringo, G., Johnson, D. W., and Wong, D.K. (Babcock & Wilcox, Co.), Beard, C.T. (Eastman Kodak Company), and Brewster, S.E. (Tennessee Valley Authority), presented at the EPRI-DOE-EPA Combined Utility Air Pollutant Control Symposium, Atlanta, GA, August 16-20, 1999. Available at B&W’s internet website: http://www.babcock.com/pgg/tt/pdf/BR-1683.pdf
4. B&W experience list September 18, 2002. 5. “Reburning Projects in the Department of Energy’s Clean Coal Technology Demonstration Program”, by
Mann, Al and Ruppel, Tom (Parsons Corporation), and Sarkus, Tom (National Energy Technical Laboratory), presented at the 2004 DOE-NETL Conference on Reburning for NOX Control, Morgantown, WV, May 18, 2004. A reburn-related document (an updated version of a poster from the May 18 Conference) is titled “Scorecard on Reburning 6/1/2004” by Al Mann and Tom Ruppel, Parsons Corporation, available on-line at: http://www.netl.doe.gov/publications/proceedings/04/NOx/posters/Reburning%20Scorecard.pdf
6. GE Energy (formerly GE-EER) experience list September 29, 2005. 7. “Demonstration of Rich Reagent Injection for NOX Control in AmerenUE’s Sioux Unit 1” by Cremer, Marc
A. and Adams, Bradley R. (Reaction Engineering International), Boll, David E. (AmerenUE), and O’Connor, David C. (Electric Power Research Institute), presented at the US DOE Conference on SCR/SNCR for NOX Control, Pittsburgh, PA, May 15-16, 2002.
8. “Evaluation of Cost Effective Non-SCR Options for NOX Control in PRB Fired Cyclone Boilers” by Cremer,
Marc A., Wang, David H. and Adams, Bradley R. (Reaction Engineering International); Boll, David E. and Stuckmeyer, Kenneth B. (AmerenUE), presented at the Western Fuels Symposium, 19th International Conference on Lignite, Brown, and Subbituminous Coals (formerly Low-Rank Fuels), October 12-14, 2004, Billings, MT.
9. “NOX Emissions Below 0.15 lb/Mbtu Achieved in a Cyclone-Fired Boiler Using In-Furnace Control”, by
Cremer, M., Adams, B., and Chiodo, A., (Reaction Engineering International); Giesmann, C., Stuckmeyer, K., and Boyle, J. (AmerenUE), presented at the Powergen International 2005 conference, December 6-8, 2005, Las Vegas, Nevada.
10. RJM experience list September 3, 2004. 11. “Design and Demonstration of Rich Reagent Injections (RRI) Performance For NOX Reduction at
Connectiv’s B.L. England Station” by Cremer, Marc A. and Adams, Bradley R. (Reaction Engineering International); O’Connor, David C. (Electric Power Research Institute); Bhamidipati, Venkata (Conectiv B.L. England Station), and Broderick, R. Gifford (RJM Corporation), presented at the 2001 US EPA/DOE/EPRI MEGA Symposium on SCR and SNCRs, Chicago, IL, August 20-23, 2001. (available from REI’s internet website http://www.reaction-eng.com/donwloads/rri_mega.pdf)
12. “Improved Rich Reagent Injection (RRI) Performance For NOX Control In Coal Fired Utility Boilers” by
Cremer, Marc A. and Wang, Huafeng D. (Reaction Engineering International), Boll, David E. (AmerenUE), Schindler, Edmund (RJM Corporation), and Vasquez, Edmundo RMT, Inc. (Alliant Energy Corp.), presented at 2003 U.S. DOE Conference on SCR and SNCR for NOX Control, Pittsburgh, PA, October 29-30, 2003.

32 11/2/2009
3.0 SO2 BART EVALUATION In this section, steps 1 through 5 of the BART determination for BSP are described for SO2. Potentially
applicable SO2 control technologies are first identified. A brief description of the processes and their
capabilities are then reviewed for availability and feasibility. A detailed technical description of each
control technology is provided in Appendix B1. Subsequently, those available technologies deemed
feasible for retrofit application are ranked according to nominal SO2 control capability. The impacts
analysis then reviews the estimated capital and O&M costs for each alternative, including Balance Of
Plant (BOP) requirements. Following the cost determination, the energy impacts and non-air quality
impacts are reviewed for each technology. The impact based on the remaining useful life of the source is
reviewed as part of the cost analysis. In the final step of the analysis, feasible and available technologies
are assessed for their potential visibility impairment impact reduction capability via visibility modeling
results. The results of the impact analyses are tabulated and potential BART control options are listed.
3.0.1 BART GUIDELINE SO2 LIMITS FOR CYCLONE-FIRED BOILERS
EPA’s recommended limit for emissions of sulfur dioxides from cyclone-fired boilers was established in
the final BART Guidelines:
“You [meaning States] must require 750 MW power plants to meet specific control levels for SO2
of either 95 percent control or 0.15 lbs/mmBtu, for each EGU greater than 200 MW that is
currently uncontrolled unless you determine that an alternative control level is justified based on a
careful consideration of the statutory factors.”
40 CFR 51, App. Y, IV.E.4. While Unit I at BSP is greater than 200 MW output, it is not located at a 750
MW power plant. Thus, Unit I is not subject to presumptive limits.
3.1 IDENTIFICATION OF RETROFIT SO2 CONTROL TECHNOLOGIES
The initial step in the BART determination is the identification of retrofit SO2 control technologies. In
order to identify the applicable SO2 control technologies, several reference works were consulted,
including “Controlling SO2 Emissions: A Review of Technologies (EPA-600/R-00-093, October 2000)
and the RACT/BACT/LAER Clearinghouse (RLBC). From these and other literature sources, a
preliminary list of control technologies and their estimated capabilities was developed.

33 11/2/2009
Removal of SO2 from flue gas can either be accomplished prior to combustion, or post combustion. The
primary method for pre-combustion controls is fuel switching. Post combustion methods include wet
Flue Gas Desulfurization (FGD) typically using limestone reagent and semi-dry FGD technologies using
lime reagent. Following are descriptions and technical analyses of the identified technologies for
application to BSP Unit I. Table 3.1-1 contains the results of this effort.
TABLE 3.1-1 – SO2 Control Technologies Identified for BART Analysis
Control Technology Fuel Switching Semi-Dry Flue Gas Desulfurization Wet Flue Gas Desulfurization
3.2 TECHNICAL DESCRIPTION AND FEASIBLITY ANALYSIS
The second step in the BART analysis procedure is a technical feasibility analysis of the options
identified in Step 1. The two concepts to consider are the “availability” and “applicability” of each
control technology. The technical and feasibility analysis is presented below for each identified option.
3.2.1 PRE-COMBUSTION FUEL TREATMENTS - FUEL SWITCHING
Fuel switching can be a viable method of fuel sulfur content reduction in certain situations. The PRB coal
listed in Table 1.2-2 is one of the lower sulfur coals available in the U.S. and switching to a different
lower sulfur coal (if available) would achieve little to no additional reduction in SO2 emissions.
Therefore, for the purpose of this BART analysis, fuel switching is not considered a viable option for SO2
control for BSP Unit I.
3.2.2 POST- COMBUSTION FLUE GAS DESULFURIZATION
Two different post combustion processes for reducing SO2 emissions were evaluated as BART
alternatives in this analysis. These include two well established Flue Gas Desulfurization (FGD)
processes, wet and semi-dry. Commercially-available wet and semi-dry FGD processes achieve SO2
removal by absorption of the SO2 into an aqueous slurry which contains a neutralizing agent, normally
either lime or ground limestone. Chemical reaction(s) between the SO2 and the neutralizing agent convert
the SO2 to a stable compound that can be readily sold or disposed of in a permitted facility.

34 11/2/2009
3.2.2.1 WET FLUE GAS DESULFURIZATION Wet FGD technology utilizing lime or limestone as the reagent and employing forced oxidation to
produce gypsum (calcium sulfate dihydrate, CaSO4 2H2O) as the byproduct is commonly applied to coal-
fired boilers. Absorbed SO2 is converted to calcium sulfite and then oxidized to calcium sulfate dihydrate
(gypsum) which is filtered from the scrubber solution and either disposed of in a permitted disposal
facility, or possibly sold for wallboard production.
Based on commercial availability and applicability, wet FGD systems were found to be an acceptable
BART alternative for SO2 emission control.
3.2.2.2 SEMI-DRY FLUE GAS DESULFURIZATION The most common semi-dry FGD system is the lime Spray Dryer Absorber (SDA) using a fabric filter for
downstream particulate collection. This report addresses the spray dryer FGD process. Two other
variations, the Novel Integrated Desulfurization (NID ™) and Circulating Dry Scrubber are similar
technologies that achieve similar levels of control effectiveness. They primarily differ by the type of
reactor vessel used, the method in which water and lime are introduced into the reactor and the degree of
solids recycling. Due to similar nature of the different semi-dry technologies and the similar levels of
control efficiency achieved by all the technologies, semi-dry technologies are grouped together for the
analysis. Technical characteristics associated with the semi-dry technologies are described in Appendix
B1.
Based upon availability and applicability, semi-dry FGD is considered a viable alternative for SO2
emission control.
3.2.3 RESULTS OF FEASIBILITY ANALYSIS
The results of the evaluation of the identified BART alternatives following the feasibility analysis are
summarized in Table 3.2-1.
TABLE 3.2-1 – SO2 BART Feasibility Analysis Results
Control
Technology
In service on Existing
Utility Boilers Commercially
Available Technically Applicable
To Big Stone Plant Fuel Switching Yes Yes No Wet FGD Yes Yes Yes Semi-dry FGD Yes Yes Yes

35 11/2/2009
3.3 EVALUATE TECHNICALLY FEASIBILE SO2 CONTROL OPTIONS BY EFFECTIVENESS
The third step in the BART analysis procedure is to evaluate the control effectiveness of the technically
feasible alternatives.
Historically, wet FGD systems have operated with SO2 control efficiency anywhere from 70% to in
excess of 95%. For the purposes of this study, wet FGD performance was evaluated at presumptive
BART limit of 0.15 lb/mmBtu and also at the 95% SO2 control as representative of the performance of
this technology on PRB coal. Further technical characteristics associated with wet FGD are described in
Appendix B1.
No variation of semi-dry FGD systems has clearly demonstrated the ability to achieve SO2 removal levels
similar to wet FGD systems in the U.S. Table B-1, in Appendix B, lists many of the recent lime spray
dryer system installations in the U.S. The information in Table B-1 was obtained from the
RACT/BACT/LAER Clearing House. Burns & McDonnell completed a study of the emission reduction
performance of existing, electric utility, semi-dry FGD systems.3 Information utilized for the evaluation
was derived from EIA coal quality data and EPA SO2 stack emissions and heat input data. The evaluation
determined that the highest SO2 removal efficiency maintained by semi-dry FGD on a continuous basis
was just above 90%. No unit was able to maintain an efficiency of 95%. Semi-dry FGD is considered a
viable alternative to achieve the presumptive SO2 BART level, but the upper bound on SO2 removal
efficiency was set at 90% based on a review of the historic performance of this technology.
Table 3.3.1 presents the remaining BART alternatives following the feasibility analysis ranked in
descending order according to their effectiveness in SO2 control.

36 11/2/2009
TABLE 3.3-1 – SO2 Control Technologies Identified for BART Analysis
SO2 Control Technique
Emission
Rate
(lb/mmBtu)
Control
Percentage
Hourly
Emission (lb/hr)
Wet Limestone FGD 0.043 95 241.2
Semi-dry Lime FGD 0.09 90 504.8
Presumptive Wet Limestone FGD 0.15 83 841.4
Presumptive Semi-dry Lime FGD 0.15 83 841.4
Baseline 0.86 -- 4,832.2
3.4 EVALUATION OF IMPACTS FOR FEASIBLE SO2 CONTROLS
Step four in the BART analysis procedure is the impact analysis. The BART Guidelines lists four factors
to be considered in the impact analysis.
• The costs of compliance;
• Energy impacts;
• Non-air quality environmental impacts; and
• The remaining useful life of the source.
Three of the four impacts required by the BART Guidelines are discussed in the following sections. The
remaining useful life of the source was determined to be greater than the project life definition in the
EPA’s OAQPS Control Cost Manual (EPA/453/B-96-001) and thus had no impact on the BART
determination for BSP. In addition, the visibility impairment impact of each alternative was evaluated as
part of the impact analysis.
3.4.1 COST ESTIMATES
Cost estimates for the wet and semi-dry (including SDA and fabric filter) SO2 control technologies were
completed utilizing the Coal Utility Environmental Cost (CUECost) computer model (Version 1.0)
available from the EPA. The CUECost model is a spreadsheet-based computer model that was
specifically developed to estimate the cost of air pollution control technologies for utility power plants
within +/- 30 percent accuracy. The EPA released the version of the model used for this study in

37 11/2/2009
February 2000. The model is available for download from the EPA website at
http://www.epa.gov/ttncatc1/products.html.
The user must specify the design parameters for the air pollution control technologies in CUECost. Unit
costs for consumables, labor, and other variables can be modified by the user to fit the specific situation
under evaluation. Because these models are in spreadsheet form, the calculation procedures and
assumptions can be readily determined and adjusted by the experienced user as necessary to fit the unique
requirements of the evaluation being conducted. The program itself is also somewhat user adjustable to
compensate for local conditions. The CUECost default case is a generic facility located in Pennsylvania.
Burns & McDonnell has adjusted the CUECost spreadsheets as described in the following sections to
account for known facility and local conditions.
Operating information utilized as input into the model for the purpose of cost estimating is listed in
Tables 1.2-1 and 1.2-2. Economic information utilized as input into the model is given in Table 1.2-3.
The model was run with 2008 designated as the cost basis year because equipment cost estimating in the
model is based on the Chemical Engineering Cost Index and the composite 2008 index is the latest
version available. Following completion of the estimating on a 2008 cost basis year, all costs were
escalated to a 2009 basis year utilizing the inflation rates designated in Table 1.2-3.
3.4.1.1 WET FGD CAPITAL COST ESTIMATE The capital cost estimate for the wet FGD system includes the SO2 control system and major support
facilities. This capital cost estimate for wet FGD applies to either evaluated emission rate as the accuracy
of the estimate cannot account for the cost differential due to minor equipment differences. The SO2
control system cost is representative of a typical furnish and erect contract by a wet FGD system supplier.
The “typical” furnish and erect contract would not include costs for foundations. The wet FGD system
cost estimated by CUECost is broken down into the major subsystems of reagent preparation, SO2
absorption tower, dewatering systems, flue gas handling systems (booster fans and ductwork) and support
systems. The estimated capital cost associated with a wet FGD system is $171,800,000 or a unit capital
cost of $362/kW.
3.4.1.2 SEMI-DRY FGD CAPITAL COST ESTIMATE Estimated direct costs for the semi-dry FGD system include the absorbers and major support facilities. It
was assumed that the existing fabric filter can be used to collect the reaction products from the semi-dry
FGD absorber. The SO2 control system cost is representative of a typical furnish and erect contract by a

38 11/2/2009
lime semi-dry FGD system supplier. This capital cost estimate for semi-dry FGD applies to either
evaluated emission rate as the accuracy of the estimate cannot account for the cost differential due to
minor equipment differences. The “typical” furnish and erect contract would not include costs for
foundations. The system costs estimated by CUECost are broken down into the major subsystems of
reagent preparation, absorber, waste handling systems, flue gas handling systems (booster fans and
ductwork) and support systems. The estimated capital cost associated with a semi-dry FGD system is
$141,300,000 or a unit capital cost of $297/kW.
3.4.1.3 O&M COST ESTIMATE The annual operating and maintenance costs (O&M) costs are comprised of fixed costs (maintenance and
labor) and variable cost (consumables). These costs were developed as part of the CUECost model and
include operating labor, administrative and support labor and maintenance. Table 3.4-1 summarizes the
O&M cost estimates for the wet and semi-dry FGD systems.
TABLE 3.4-1 – First Year O&M Cost Estimate for BSP FGD Systems
SO2 Control System Fixed Costs ($1000/yr)
Variable Costs ($1000/yr)
Total O&M ($1000/yr)
Wet FGD $7,000 $2,600 $9,600 Presumptive Wet FGD $7,000 $2,490 $9,490 Semi-dry FGD $4,500 $3,160 $7,660 Presumptive Semi-dry FGD $4,490 $2,990 $7,480
3.4.1.4 LEVELIZED TOTAL ANNUAL COST In order to compare a particular SO2 emission reduction alternative during the cost of compliance impact
analysis portion of the BART selection process, the basic methodology defined in the BART Guidelines
was followed [70 FR 39167-39168]. The Levelized Total Annual Cost (LTAC) for these SO2 control
alternatives was calculated based on the same economic conditions and a 30 year project life (see Section
1.3.5 of this BART evaluation for methodology details). Estimated capital costs were split evenly over a
two year construction period for all alternatives and a present value was calculated. Table 3.4-2 shows
the estimated present value capital cost and the annualized cost for the two feasible SO2 emission
reduction technologies. These are listed in order of control effectiveness, with the highest ranked options
at the top.

39 11/2/2009
TABLE 3.4-2 – Capital and Annualized Costs Estimated for SO2 Control Alternatives
SO2 Control Alternative Capital Cost1
($1000)
Present ValueCapital
Cost
($1,000)
First Year O&M Cost
($1,000)
LevelizedCost2
($1,000) Wet FGD 171,800 161,400 9,600 29,050 Presumptive Wet FGD 171,800 161,400 9,490 28,900 Semi-dry FGD 141,300 132,700 7,660 23,570 Presumptive Semi-dry FGD 141,300 132,700 7,480 23,330
1 – Installed capital cost is estimated for determination of total capital cost for a control technology, assuming maximum unit output capacity is based on 475,000 kW.
2 – Levelized Total Annual Cost = Annualized Installed Capital Cost + Levelized Annual O&M cost. The Annualized O&M cost factor = 1.361 and the Capital Recovery Factor = 0.0991
The average cost effectiveness was then determined as the LTAC divided by the annual tons of pollutant
emissions that would be avoided by implementation of the respective alternative. Table 3.4-3 shows the
average cost effectiveness comparison for the SO2 control technologies. The feasible control alternatives
were also compared by calculating the change in LTAC per incremental ton of pollutant removed for the
next most stringent alternative (incremental cost effectiveness). This identified which alternatives
produced the highest increment of expected pollutant reduction for the estimated lowest average LTAC
increment compared with the pre-control baseline emission rate. The expected annual number of tons of
pollutant removed versus estimated LTAC for each remaining control alternative was then plotted.
TABLE 3.4-3 – Estimated Annual Emissions and LTAC for SO2 Control Alternatives
SO2 Control Alternative
Annual SO2Emissions1
(Tons/yr)
Annual SO2 Emissions Reduction1
(Tons/yr)
Levelized Total
Annual Cost
($1,000)
Average Cost
Effectiveness
($/ton)
Wet FGD 900 17,100 29,050 1,699
Semi-dry FGD 1,880 16,120 23,570 1,462
Presumptive Wet FGD 3,130 14,870 28,900 1,944
Presumptive Semi-dry FGD 3,130 14,870 23,330 1,569
Baseline 18,000 - - -
1 – Annual SO2 emissions and control level based upon 8,760 hours of operation and 85% capacity factor.

40 11/2/2009
The comparison of the cost-effectiveness of the control options evaluated for BSP is shown in Figure 3.4-
1. The estimated annual amount of SO2 removal (emission reduction) in tons per year is plotted on the
abscissa (horizontal axis) and the estimated levelized total annual cost in thousands of U.S. dollars per
year on the ordinate (vertical axis).
Figure 3.4-1 – SO2 Control Cost Effectiveness
Presumptive Semi-dry FGD
Wet FGD
Semi-dry FGD
Presumptive Wet FGD
0
5,000
10,000
15,000
20,000
25,000
30,000
35,000
- 2,000 4,000 6,000 8,000 10,000 12,000 14,000 16,000 18,000
Emissions Reduction (tpy)
Tota
l Lev
eliz
ed C
osts
($10
00)
The purpose of Figure 3.4-1 is to show the range of control and cost for the evaluated SO2 reduction
alternatives and identify the least-cost controls so that the Dominant Controls Curve (DCC) can be created.
The DCC is the best fit line through the points forming the lower rightmost boundary of the data zone on a
scatter plot of the LTAC versus the annual SO2 removal tonnage for the various remaining BART
alternatives. Points distinctly to the left of and above this curve are inferior control alternatives per the
BART Guidelines on a cost effectiveness basis. Following a “bottom-up” graphical comparison approach,
each of the SO2 control technologies represented by a data point to the left of and above the least cost
envelope should be excluded from further analysis on a cost efficiency basis. Of the highest-performing
versions of the technically feasible SO2 control alternatives evaluated for cost-effectiveness, the data point
for presumptive wet FGD is seen to be more costly for the same tons of SO2 removed than for presumptive

41 11/2/2009
semi-dry FGD, semi-dry FGD or wet FGD. The presumptive wet FGD appears to be an inferior control,
and thus should not be included on the least cost and DCC boundary. Figure 3.4.2 provides the DCC for the
SO2 Controls
Figure 3.4-2 – SO2 Control Cost Effectiveness and Dominant Cost Control Curve
Semi-dry FGD
Wet FGD
Presumptive Semi-dry FGD
$0
$5,000
$10,000
$15,000
$20,000
$25,000
$30,000
$35,000
- 2,000 4,000 6,000 8,000 10,000 12,000 14,000 16,000 18,000
Emissions Reduction (tpy)
Tota
l Lev
eliz
ed C
osts
($10
00)
The next step in the cost effectiveness analysis for the BART SO2 control alternatives is to review the
incremental cost effectiveness between remaining least-cost alternatives. Table 3.4-4 contains a repetition
of the levelized total annual cost and SO2 control information with presumptive wet FGD removed, and
shows the incremental cost effectiveness between each successive set of least-cost SO2 control
alternatives. The incremental SO2 control tons per year, divided by the incremental levelized annual cost,
yields an incremental average unit cost ($/ton).

42 11/2/2009
TABLE 3.4-4 – Estimated Incremental Annual Emissions and LTAC for SO2 Control Alternatives
SO2 Control
Technique
LevelizedTotal
Annual Cost
($1,000)
Annual Emission
Reduction1
(Tons/yr)
IncrementalLevelized
Total Annual Cost2
($1,000)
Incremental
Annual Emission
Reduction1,2
(Tons/yr)
Incremental Control CostEffectiveness
($/ton)3
Wet FGD 29,050 17,100 5,480 980 5,592
Semi-dry FGD 23,570 16,120 240 1,250 192
Presumptive Semi-dry FGD
23,330 14,870 23,330 14,870 1,569
1 – Annual SO2 emissions and control level based upon 8,760 hours of operation and 85% capacity factor. 2 – Increment based upon comparison between consecutive alternatives from lowest to highest. 3 – Incremental control cost effectiveness is incremental LTAC divided by incremental annual emission reduction (tons per
year).
As can be seen from a review of Table 3.4-4, the incremental levelized control cost effectiveness of
control alternatives ranges from $192/ton to $5,592/ton. In the final BART Guidelines, the EPA state
that:
“For example, you may be faced with a choice between two available control devices at a source,
control A and control B, where control B achieves slightly greater emission reductions. The
average cost (total annual cost/total annual emission reductions) for each may be deemed to be
reasonable. However, the incremental cost (total annual cost A – B/total annual emission
reductions A – B) of the additional control B may be very great. In such an instance, it may be
inappropriate to choose control B, based on its high incremental costs, even though its average
cost may be considered reasonable.” (40 CFR 51, App. Y, IV.D.e.5.)
The incremental cost effectiveness is a measure of the increase in marginal cost effectiveness between
two specific alternatives. The incremental cost analysis indicates that from a cost effectiveness
viewpoint, the most costly alternative is wet FGD. The wet FGD control option is considered technically
feasible for BSP, but incurs a significant annual (levelized) incremental cost compared to the other
feasible SO2 control techniques and is an inappropriate control option based upon high incremental costs.

43 11/2/2009
3.4.2 ENERGY IMPACTS
The energy impacts of each alternative, in terms of both estimated kW of energy usage and the percent of
total generation, are given in Table 3.4-5. The primary energy impact of the wet FGD alternative consists
of the additional electrical load resulting from pumps, blowers, booster fans, ball mills for limestone
grinding and vacuum pumps for byproduct slurry dewatering. The largest energy users for the semi-dry
alternatives are pumps, atomizers and booster fans. Building HVAC and interior and exterior lighting
loads are also included, but the major energy consumption is due to the primary systems described above.
TABLE 3.4-5 Energy Requirements of SO2 BART Alternatives
BART
Alternative
Energy Demand
(kW)
Percent of Nominal
Generation Wet FGD 9,500 2.0% Semi-dry FGD 3,325 0.7%
3.4.3 NON-AIR QUALITY ENVIRONMENTAL IMPACTS
Non-air quality environmental impacts of the installation and operation of the various BART alternatives
include solid and aqueous waste streams, and salable products that could result from the implementation
of various BART alternatives. Captured mercury would be present in the solid waste stream from any
post combustion alternative as a trace contaminant in the solid waste. Under current regulation, the
presence of trace amounts of mercury would not affect its disposal.
A wet FGD system for BSP Unit I is estimated to produce approximately 6 tons per hour of solid waste.
The waste stream would be composed of gypsum solids and inerts at approximately 15% moisture. Over
the course of a year, the total solid waste quantity is estimated to be approximately 44,700 tons of gypsum
solids which would need to be landfilled.
The annual quantity of aqueous waste that would be produced by a wet FGD system is difficult to
quantify because the blowdown rate from a wet FGD system is primarily a function of the dissolved
chloride levels in the absorber reaction tank. Most of the chloride reaching the scrubber is in the form of
hydrochloric acid which is readily absorbed and neutralized. Based upon the use of relatively low
chloride coal, one can assume the chlorides to be removed via the blowdown stream as CaCl2 and would
leave the plant in the entrained moisture in the solid waste. No blowdown specifically for chloride
disposal or special treatment of the waste would be required under these conditions.

44 11/2/2009
3.4.4 VISIBILITY IMPACTS
The final impact analysis conducted was to assess the visibility impairment impact reduction for the SO2
control technologies. The analysis used a baseline SO2 emission rate which assumed the highest 24-hour
actual emission rate for 2001-2003 as recommended by the BART guideline and listed in the Modeling
Protocol. Three CALPUFF model runs for BSP were conducted with the constant NOX emission rate of
0.65 lb/mmBtu, constant PM emission rate of 0.015 lb/mmBtu, and various levels of SO2 control applied.
Table 3.4-6 shows the modeled emission rates.
The modeling for this analysis was performed using CALPUFF. The difference between the modeled
impacts at the 98th percentile level from various controlled emission rates represents the visibility
impairment impact reduction in deciViews (dV). Table 3.4-6 shows the results of the visibility impact
modeling attributable to SO2 reductions while maintaining NOX and PM emissions constant. The
modeling results with combined impacts from all pollutants are addressed later in the report.
TABLE 3.4-6 – Visibility Impairment Impacts from Emission Controls
SO2 Control Technique
Emission
Rate
(lb/mmBtu)
Visibility Impairment
Impact (dV)
Visibility Impairment Reduction1
(Δ dV)
Technology Incremental Reduction
(Δ dV)
Wet FGD 0.043 0.611 0.046 0.009
Semi-dry FGD 0.09 0.620 0.037 0.037
Presumptive Semi-dry FGD 0.15 0.657 - -
Baseline 0.86 1.079 - -
1 – Impairment reduction is from presumptive semi-dry FGD levels.
The results of the baseline visibility impairment modeling for BSP showed that SO2 emissions caused a
Class I area to exceed 0.5 dV for predicted visibility impairment impact (98th percentile). Modeled
visibility impairment impacts decreased with the addition of all SO2 controls.
As previously discussed, the 0.5 dV value is the lowest visibility impairment impact that is considered
discernible by the human eye and the EPA set this threshold as the point where a given source is
considered a “contributing source”. Thus, an impairment impact or a difference in impairment impacts of
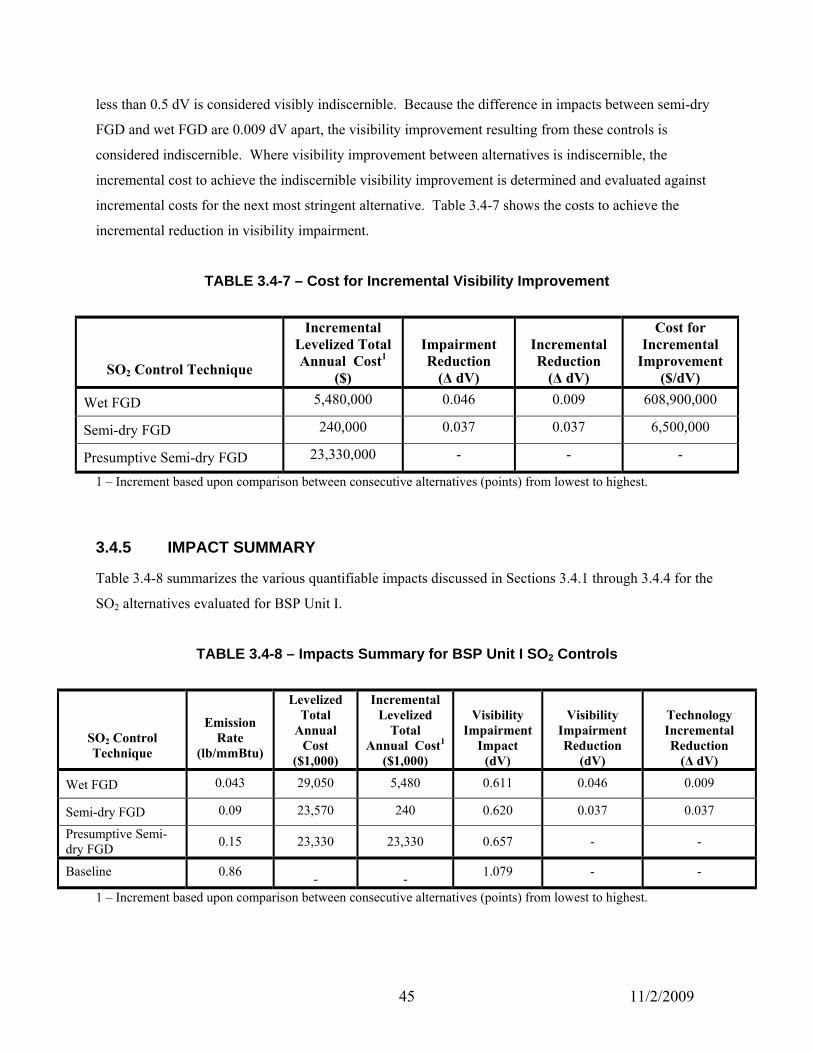
45 11/2/2009
less than 0.5 dV is considered visibly indiscernible. Because the difference in impacts between semi-dry
FGD and wet FGD are 0.009 dV apart, the visibility improvement resulting from these controls is
considered indiscernible. Where visibility improvement between alternatives is indiscernible, the
incremental cost to achieve the indiscernible visibility improvement is determined and evaluated against
incremental costs for the next most stringent alternative. Table 3.4-7 shows the costs to achieve the
incremental reduction in visibility impairment.
TABLE 3.4-7 – Cost for Incremental Visibility Improvement
SO2 Control Technique
Incremental Levelized Total Annual Cost1
($)
Impairment Reduction
(Δ dV)
Incremental Reduction
(Δ dV)
Cost for Incremental
Improvement ($/dV)
Wet FGD 5,480,000 0.046 0.009 608,900,000
Semi-dry FGD 240,000 0.037 0.037 6,500,000
Presumptive Semi-dry FGD 23,330,000 - - -
1 – Increment based upon comparison between consecutive alternatives (points) from lowest to highest.
3.4.5 IMPACT SUMMARY
Table 3.4-8 summarizes the various quantifiable impacts discussed in Sections 3.4.1 through 3.4.4 for the
SO2 alternatives evaluated for BSP Unit I.
TABLE 3.4-8 – Impacts Summary for BSP Unit I SO2 Controls
SO2 Control Technique
Emission
Rate
(lb/mmBtu)
Levelized Total
Annual Cost
($1,000)
Incremental Levelized
Total Annual Cost1
($1,000)
Visibility
Impairment Impact
(dV)
Visibility
Impairment Reduction
(dV)
Technology Incremental Reduction
(Δ dV)
Wet FGD 0.043 29,050 5,480 0.611 0.046 0.009
Semi-dry FGD 0.09 23,570 240 0.620 0.037 0.037
Presumptive Semi-dry FGD 0.15 23,330 23,330 0.657 - -
Baseline 0.86 - - 1.079 - -
1 – Increment based upon comparison between consecutive alternatives (points) from lowest to highest.

46 11/2/2009
4.0 PARTICULATE MATTER BART EVALUATION In this section, steps 1 through 5 of the BART determination for BSP Unit I are described for PM. All
PM control technologies are first identified. A technical description of the processes and their capabilities
are then reviewed to determine availability and feasibility. Subsequently, those available technologies
deemed feasible for retrofit application are ranked according to nominal PM control capability. The
impacts analysis then reviews the estimated cost, energy, and non-air quality impacts for each technology.
The impact of the remaining useful life of the source is reviewed as part of the cost analysis. In the final
step of the analysis, the remaining technologies are assessed for their potential visibility impairment
impact reduction capability via visibility modeling results. The results of the complete analyses are
tabulated and possible BART control options are listed.
The BART guidelines published in the Federal Register on July 6, 2005 (70 FR 39104) do not specify
presumptive BART levels for particulate matter (PM) emissions. The guidelines suggest the use of PM10
as the indicator for all PM2.5, because all PM2.5 is encompassed within the PM10 emissions fraction. (40
CFR 51, App. Y, II.A.3.) The BART guidelines specify the distinction between coarse (PM10 minus
PM2.5) or fine (PM2.5) PM in determining visibility impacts, which was made during the CALPUFF
visibility modeling.
The BART Guidelines indicate that one of the evaluated emission limits must be at least as stringent as
the New Source Performance Standard (NSPS) requirement for the source (40 CFR 51, App. Y, IV.D.1).
The BSP pulse-jet fabric filter meets the current NSPS emission rate 0.015 lb/mmBtu as required of new
sources under 40 CFR § 60.42Da(c). All of the evaluated control technologies used a PM emission rate
of 0.015 lb/mmBtu.
4.1 IDENTIFICATION OF AVAILABLE RETROFIT PM CONTROL TECHNOLOGIES
The initial step of the BART determination is the identification of available retrofit PM control
technologies. In order to produce a list of control technologies and their estimated capabilities, sources
such as the RACT/BACT/LAER Clearinghouse (RBLC) were used. The results of the investigation
determined that the removal of PM from flue gas is accomplished using post combustion technology. The
two most common post combustion technologies used to control PM emissions include fabric filters (FF)

47 11/2/2009
and electrostatic precipitators (ESPs). The existing BSP configuration contains a pulse-jet fabric filter
that was installed in 2007. Table 4.1-1 contains the results of the available PM control technologies.
TABLE 4.1-1 PM Control Technologies Identified for BART Analysis
Control Technology Existing Fabric Filter
New Fabric Filter COHPAC Baghouse
Electrostatic Precipitator
4.2 TECHNICAL DESCRIPTION AND FEASIBLITY ANALYSIS
The second step in the BART analysis procedure is a technical feasibility analysis of the options
identified in Step 1. This analysis is presented below for each identified option.
4.2.1 FABRIC FILTER (FF)
A fabric filter or baghouse removes particulate by passing flue gas through filter bags. A pulse-jet fabric
filter (PJFF), a common type of fabric filter, consists of isolatable compartments and a tube sheet which
separates the particulate laden flue gas from the clean flue gas. The flue gas passes through the PJFF by
flowing from the outside of the bag to the inside up the center of the bag through the hole in the tube sheet
and out the PJFF. Fly ash particles are collected on the outside of the bags and the cleaned gas stream
passes through the bag to the outlet of the fabric filter. Each filter bag alternates between relatively long
periods of filtering and short periods of cleaning. During the cleaning period, fly ash that has
accumulated on the bags is removed by pulses of air and falls into a hopper for disposal.
The existing fabric filter on BSP Unit I can achieve a filterable PM emission rate of 0.015 lb/mmBtu.
Therefore, continuing the use of the existing fabric filter is a technically feasible option. Replacement of
the existing fabric filter with a new fabric filter is feasible, but would provide little to no increase in
removal efficiency or reduction in emission rate.
4.2.2 COHPAC
A COmpact Hybrid PArticulate Collector (COHPAC) is a high air-to-cloth ratio pulse jet fabric filter
located downstream of an existing ESP. The COHPAC acts as a polishing device for control of
particulate emissions. The difference between a COHPAC and the fabric filter described above is that a
COHPAC is installed after an ESP. Because Big Stone Plant does not have an ESP and already uses a
fabric filter for particulate control, the use of a COHPAC is not considered further.

48 11/2/2009
4.2.3 ELECTROSTATIC PRECIPITATOR (ESP)
ESPs are commonly used as the primary filterable PM control device on coal fired units. The ESP
discharge electrodes generate a high voltage electrical field that gives the particulate matter an electric
charge (positive or negative). The charged particles will then be collected on a collection plate.
Technical characteristics associated with ESPs are described in Appendix C1.
It is anticipated that a new ESP installed at BSP could achieve a PM emission rate of approximately 0.015
lb/mmBtu. Therefore, the use of a new electrostatic precipitator is a technically feasible option.
Replacement of the existing fabric filter with a new ESP is feasible, but would provide little to no
increase in removal efficiency or reduction in emission rate.
The results of the feasibility analysis for the available BART alternatives are summarized in Table 4.2-1.
TABLE 4.2-1 – PM BART Feasibility Analysis Results
Control Technology
In Service on Existing
Utility Boilers Commercially
Available Technically Applicable
To Big Stone Plant Existing Fabric Filter Yes Yes Yes New Fabric Filter Yes Yes Yes COHPAC Baghouse No1 Yes No New ESP Yes Yes Yes
1 – While COHPAC has been installed on existing EGUs, it has not been installed in conjunction with an existing fabric filter.
4.3 RANK OF TECHNICALLY FEASIBLE PM CONTROL OPTIONS BY EFFECTIVENESS
The third step in the BART analysis procedure is to rank the technically feasible alternatives. However,
because BSP Unit I currently uses a pulse-jet fabric filter that is the best technology available for
particulate control and can achieve similar emission rates to new versions of the same technology or a
new ESP replacing the existing fabric filter with new particulate control is inappropriate. Thus, the
existing fabric filter is the highest ranked and only option evaluated further.

49 11/2/2009
4.4 EVALUATION OF IMPACTS FOR FEASIBLE PM CONTROLS – UNIT I
Step four in the BART analysis procedure is the impact analysis. The BART Guidelines list four factors
to be considered in the impact analysis:
• The costs of compliance;
• Energy impacts;
• Non-air quality environmental impacts; and
• The remaining useful life of the source.
Because Big Stone Plant Unit I currently uses a pulse-jet fabric filter that is the best technology available
for particulate control and can achieve similar emission rates to new versions of the same technology
replacing the existing fabric filter with new particulate control is inappropriate. Reviewing the four
impacts listed above would provide no additional information regarding the type of technology to be
selected to best achieve visual emissions improvement. However, as described in Section 1.3.6, the
visibility impairment impacts due to particulate matter were included as part of the analysis.
4.4.1 VISIBILITY IMPACTS
A visibility analysis specifically for PM was not conducted due to the selection of the existing fabric filter
and the conclusion that the alternatives would result in the same emission rate. Per the BART Guidelines,
because BSP has “elected to apply the most stringent controls available…you need not conduct, or require
the source to conduct, an air quality modeling analysis for the purpose of determining its visibility
impacts.” (40 CFR 51. App. Y, IV.D.5.)
5.0 BART RECOMMENDATIONS The presented emission rates in this section are the BART recommendation. However, because the
accuracy of the cost estimate is + 30% and in some cases is greater than the variance of the estimated
costs between control alternatives, the technology selected by Big Stone Plant to meet the BART
recommendation may change. This section summarizes the analysis performed for each pollutant.

50 11/2/2009
5.1 NOX BART
Five types of NOX control processes were identified for evaluation. Over-fire air (OFA), separated over-
fire air (SOFA), Selective Non-Catalytic Reduction (SNCR), Rich Reagent Injection (RRI), Selective
Catalytic Reduction (SCR) and combinations these technologies were evaluated for control effectiveness.
Of these alternatives, stand alone SNCR and SCR were eliminated from further impacts analysis as BSP
already has an OFA system in operation. A cost analysis of the remaining technologies eliminated
RRI/SNCR/SOFA due to the operating costs.
Predicted visibility impairment impacts decreased significantly with the NOX control technologies. The
largest incremental impact reduction came from the application of SCR. However, the difference in
impacts between OFA (lowest control level) and SCR (highest control level) is less than 0.5 dV,
which is visibly indiscernible. The modeling also shows that SOFA must be applied to reduce
visibility impacts due to the NOX contribution below a discernable level of 0.5 dV. An analysis of the
incremental cost-effectiveness of consecutively more stringent controls was performed for BSP Unit I.
Installing and operating any control technology beyond SOFA would cost more than 24 million dollars
per dV of visibility impairment improvement and would only improve predicted visibility impacts by an
amount that is not discernable to the human eye.
Based on the analysis, SOFA is recommended as BART for BSP Unit I. Application of SOFA for NOX
control translates into a BART emission rate of 2,804 pounds per hour (0.50 pounds per million Btu of
fuel heat input at 5,609 mmBtu/hr). The emission rate of 2,804 pounds per hour is recommended as the
permit limit based upon a 30 day rolling average.
5.2 SO2 BART
Three types of SO2 control processes were identified for evaluation. While evaluating each process for
BSP SO2 control, fuel switching was eliminated due to the current use of low sulfur PRB coal. Wet FGD
and semi-dry FGD at two levels of control were selected for further evaluation. A cost analysis of the
remaining technologies eliminated wet FGD at the presumptive emissions rate due to the higher cost for
achieving the same emission rate as semi-dry FGD.
The difference in impacts between semi-dry FGD and wet FGD are 0.009 dV apart, which is visibly
indiscernible. The modeling also shows that semi-dry FGD at 90% control must be applied to reduce

51 11/2/2009
visibility impacts due to the SO2 contribution below a discernable level of 0.5 dV. An analysis of the
incremental cost-effectiveness of consecutively more stringent controls was performed for BSP Unit I.
Installing and operating wet FGD over semi-dry FGD would cost 608 million dollars per dV of visibility
impairment improvement and would only improve predicted visibility impacts by an amount that is not
discernable to the human eye.
Based on the analysis, semi-dry FGD is recommended as BART for BSP Unit I. Application of semi-dry
FGD for SO2 control translates into a BART emission rate of 505 pounds per hour (0.09 pounds per
million Btu of fuel heat input at 5,609 mmBtu/hr heat input). The emission rate of 505 pounds per hour is
recommended as the permit limit based upon a 30 day rolling average.
5.3 PM BART
For the PM evaluation, three post combustion control technologies were selected for evaluation in
addition to the existing pulse-jet fabric filter. While evaluating each technology for BSP Unit 1 PM
control, a COHPAC baghouse was eliminated from the evaluation. A new fabric filter and ESP were
eliminated in the analysis because the existing fabric filter provides a similar level of control effectiveness
without the additional capital costs.
Because BSP Unit I currently uses a pulse-jet fabric filter that is the best technology available for
particulate control and is the only technology remaining in the analysis, the impact review can be
abbreviated.
Reviewing the cost of compliance, the energy and non-air quality environmental impacts, other pollution
control equipment in use at the source, and the remaining useful life of the source would provide no
additional information to change technologies from the existing fabric filter. The modeling was
conducted with a constant PM emission rate of 84.1 pounds per hour.
Based upon selection of the best available PM control technology, maintaining the existing pulse-jet
fabric filter is recommended as BART for BSP Unit I. The corresponding BART emission rate for the
existing fabric filter is 84.1 pounds per hour (0.015 pounds per million Btu of fuel heat input at 5,609
mmBtu/hr heat input). The emission rate of 84.1 pounds per hour is recommended as the permit limit
based upon a 30 day rolling average.

52 11/2/2009
5.4 COMBINED BART
As indicated previously, this report presents the analysis of control technologies for NOX, SO2, and PM
for BSP Unit I. The BART control technology recommendations for the individual pollutants are based
upon the steps outlined in the EPA guideline. Modeling to determine visibility impairment was
performed using the recommended BSP Unit I BART emission rates for NOX, SO2, and PM. The 98th
percentile results are provided in Table 5.4-1.
TABLE 5.4-1 – Visibility Impairment Impacts from Combined Emissions
Control Technique
NOX Emission
Rate
(lb/hr)
SO2 Emission
Rate
(lb/hr)
PM Emission
Rate
(lb/hr)
Visibility Impairment
Impact (dV)
BART 2,804 505 84.1 0.493
The results of the visibility impairment modeling for BSP showed that the proposed BART emissions
rates for NOX, SO2 and PM caused no Class I area to exceed 0.5 dV for predicted visibility impairment
impact (98th percentile) with Boundary Waters Canoe Area Wilderness (Boundary Waters) showing the
highest predicted visibility impairment impact at 0.493 dV for the 2007 modeled year. Modeled visibility
impairment impacts decreased significantly with the addition of the BART controls.

A-1
APPENDIX A Technical Feasibility Assessment Details for NOX Controls (A1)
CUECost Input Summary (A2) Summary of Modeling Results (A3)

A-2 11/2/2009
A1 Technical Feasibility Assessment of NOX Control Alternatives
Uncontrolled NOX emissions from a coal-fired electric generating unit are highly dependent on type of
firing method, amount of solid fuel fired per unit time and furnace volume, and the fuel’s basic
combustion properties and elemental composition. The methods for reduction of such emissions:
• either prevent pollution, i.e., use inherently lower-emitting processes/practices which produce
fewer NOX emissions during the power generation process; or
• involve improvements to, or provide new add-on controls that, reduce emissions after they are
produced before they are emitted from the facility; or
• are combinations of inherently lower-emitting processes and add-on controls.
There are two basic categories of NOX emission control alternatives:
• Combustion controls; and
• Post-Combustion controls.
A significant number of the identified control options have been commercially-available, installed, and
operating in many full-scale, permanent installations in the United States for five years or more.
Similar to the dependency of the uncontrolled emissions being based on the unit type, the applicability of
the control technologies are also dependent upon the type of coal-fired unit. Combustion controls, such as over-fire air (OFA) or separated over-fire (SOFA) air are applicable to
cyclone fired units. Low-NOX burners (LNBs), while commonly applied to pulverized coal-fired boilers,
are not applicable to cyclone fired units since initial combustion occurs in the barrel-shaped cyclone and not
in the furnace chamber as is the case for the pulverized coal-fired boiler.
Selective Catalytic Reduction (SCR) and Selective Non-Catalytic Reduction (SNCR) are post-combustion
technologies that have been applied on bituminous or sub-bituminous coal-fired boilers. Others, mostly
comprised of a combination of available control technologies, are often referred to as “hybrid” or “layered”
control technologies. Variations of SNCR, such as more recently developed “Rich Reagent Injection” (RRI)
technology, have only been demonstrated on a limited number of cyclone-fired boilers. In most of the
“layered” control combination and emerging control cases, the NOX control technology has been
demonstrated to be capable of controlling the targeted pollutant(s) on either:
• a full-scale basis, but only with temporary equipment; or

A-3 11/2/2009
• a full-scale basis, with permanent equipment but in a limited number of installations.
A1.1 Combustion Controls Nitrogen oxides (NOX) are produced when nitrogen in the fuel and combustion air are exposed to high
temperatures. Nitrogen oxide (NO) is the most predominant form of NOX emissions, along with nitrogen
dioxide (NO2). The formation of these compounds in utility powerplant boilers is sensitive to the method
of firing and combustion controls utilized. The techniques employed for mixing the combustion air and
fuel, which creates flames and high temperature combustion products, results from the rapid oxidization
of carbon, hydrogen, and other exothermic reactions. Cyclone-fired boilers, by design, create intense heat
release rates to melt and fluidize the coal ash introduced into the barrel-shaped furnaces. This produces
very high uncontrolled NOX emissions.
Combustion controls employ methods that reduce the amount of NOX emissions created in the
combustion zone of the boiler prior to exhausting the flue gases from the furnace (upstream of the
convective heat transfer zones). This results in fewer emissions that may require subsequent reduction
from applicable post-combustion techniques.
A1.1.1 Low-NOx Burners (LNB) LNBs are not applicable to cyclone-fired boilers1. This is due to the physical constraints imposed by the
cyclone furnaces’ (barrels) length and diameter, and the incompatibility with the amount of heat released
and flame dispersion patterns, and insufficient amount of fine coal particles required to sustain stable
combustion associated with air-staged firing of coal using low-NOX burners with pulverized fuel. This
alternative was eliminated from consideration for potential additional NOX emissions reductions from Big
Stone’s boiler.
A1.1.2 Over-fire Air (OFA) or Separated Over-fire Air (SOFA) Over-fire Air (OFA) and Separated overf-ire air (SOFA) systems are commonly-applied, combustion-
related NOX emission reduction technology. Separated Overfire Air (SOFA) is an air-staging NOX
reduction technique that is usually based on withholding 15 to 20 percent of the total combustion air
conventionally supplied to the firing zone. It is believed that Big Stone’s boiler would be a suitable
candidate for the installation of SOFA and for additional NOX control, if this is necessary.

A-4 11/2/2009
For typical cyclone coal-fired boilers, the operation of SOFA involves diverting approximately 20 percent
of the secondary combustion air from the burner barrels, forcing the cyclones to operate fuel-rich. The
diverted combustion air is then injected in the upper furnace, where combustion is completed.
SOFA can achieve significant NOX reduction, typically 30 to 70 percent on typical cyclone coal-fired
boilers with this typical amount of air staging. A summary of several of the first OFA retrofits to
cyclone-fired boilers is described in published technical papers1,2. At least thirty nine existing cyclone-
fired boilers, firing eastern bituminous, midwestern bituminous, and western subbituminous (“Powder
River Basin”) coals in units ranging in size from 50 to 1150 MW, have been retrofitted with commercial
SOFA since 19983. Additional cyclone-fired boilers have installed separated overfire air systems in
conjunction with commercial fuel reburn retrofit projects4. Other NOX emission reduction demonstration
projects, primarily sponsored by U.S. Department of Energy National Energy Technology Laboratory’s
Clean Coal Technology Program5, and other fuel reburn retrofit projects6 have also installed separated
overfire air on cyclone boilers.
A basic form of separated overfire air (SOFA) can be applied and installed on Big Stone. There are
potential impacts and limitations unique to cyclone boilers firing PRB that should be recognized as part of
this emission reduction technology application.
A key aspect of successfully applying and operating separated overfire air on a cyclone-fired boiler is the
ability to maintain adequate molten coal ash (slag) formation and flow within the barrels and slag taps.
As secondary combustion air is diverted, less heat is released during air-staged combustion from the
intentional formation of carbon monoxide, and temperatures within the cyclones decreases. The degree to
which the cyclones can be operated with less than theoretical (stoichiometric) combustion air directly
contributes to less NOX formation and further in-furnace emission reduction but also risks solidification
of the molten coal ash. There are several challenges anticipated for implementing SOFA, primarily
involving the ability to route large SOFA ductwork for diverting secondary air from the windboxes.
These are believed to be solvable. Using a basic SOFA system, assuming a sustainable level of NOX
emissions control with the operation of modestly air-staged cyclone furnaces with suitable combustion
controls, is considered feasible for Big Stone.

A-5 11/2/2009
A1.2 Post-Combustion Controls Post-combustion controls deal with techniques that thermally or chemically-treat the flue gases to reduce
NOX emissions after they have exited the boiler’s lower furnace. In the case of Big Stone Unit I, this
primarily involves forms of selective catalytic reduction (SCR) and selective non-catalytic reduction
(SCR) technologies.
A1.2.1 Selective Non-Catalytic Reduction (SNCR) Selective Non-Catalytic Reduction (SNCR) technologies are all post-combustion types of boiler NOX
emission controls. These technologies promote NOX reduction with chemical reactions that are
insensitive to the specific fuel types whose combustion products are being treated. While the large
majority of boiler applications to date have been on pulverized coal-fired units burning eastern
bituminous fuels, SNCR has been used to reduce NOX emissions on utility boilers burning eastern
bituminous coal, midwestern bituminous coal, and, to a lesser extent, western subbituminous coal. SNCR
has also been used with fuel oil and natural gas-fired units. SNCR (and hydrocarbon-enhanced SNCR)
technologies can each be applied to fossil fuel-fired boilers with or without the use of a SOFA system.
The ability to apply SNCR does not appear to be dependent directly on the type of burners (wall-fired,
tangentially-fired, and cyclone-fired) employed in the boilers where it has been installed, with or without
overfire air in full operation. Operation at these plants has demonstrated that SNCR can decrease NOX
emissions as much as 15-40% at full load, most typically between 25-35%.7, 8, 9
In the conventional SNCR process, urea or ammonia is injected into the boiler in a region where the
combustion gas temperature is in the 1700 to 2100 degrees F range. Under these temperature conditions,
the urea reagent [CO(NH2)2 ] or ammonia [NH3 ] reacts with the nitrogen oxides [NOX], forming
elemental nitrogen [N2 ] and water, reducing NOX emissions.
SNCR can be applied and installed on the Big Stone boiler in combination with basic or separated form of
over-fire air (OFA).
A1.2.2 Rich Reagent Injection (RRI) Rich Reagent Injection (RRI) is a NOX control technology that has been developed and demonstrated
specifically for use on cyclone boilers. Rich Reagent Injection is an SNCR process that involves the
injection of urea into the lower furnace between the cyclones and the SOFA ports. RRI targets a high

A-6 11/2/2009
temperature, fuel-rich zone within the boiler-furnace environment immediately adjacent to the cyclone
burners, and requires temperatures in the range of 2400 to 3100 degrees F. The combustion gases must be
essentially devoid of free oxygen, in order to avoid oxidizing the nitrogen contained in the injected
reagent, which would create NOX emissions instead of reducing them.
The RRI process for NOX reduction must be used in conjunction with air-starved (substoichiometric
staged-air) cyclone combustion resulting from the installation and operation of an OFA system. The
cyclones’ air/fuel stoichiometry must be carefully controlled to maintain fuel-rich conditions for the RRI
process to be effective. This introduces oxygen in the same vicinity as the reagent injection ports, and
will disrupt the beneficial action of the fuel-rich zone and amine reagent to significantly reduce NOX
emissions. Without SOFA, RRI will not contribute positively to NOX emissions control on Big Stone
Unit I boiler. This places a large emphasis on the expected performance of SOFA in order for RRI to be
successful in producing significant additional NOx emissions reduction on PRB-fired cyclone boilers.
The three zones of a Rich Reagent Injection SNCR application on a boiler with separated overfire air are
shown as a sectional side elevation view of the furnace11 in Figure A.1-4.

A-7 11/2/2009
Figure A.1-4 Rich Reagent Injection Application on Boiler With Overfire Air10
The Rich Reagent Injection (RRI) process has been successfully demonstrated on at least two cyclone-
fired boilers, with the most recent installation at Ameren’s Sioux Unit I, a 500 MW boiler firing a blend
of PRB and midwestern bituminous coals.
The NOX emission reduction reagent injection for RRI processes must be precisely located and carefully
controlled to be effective. Operation outside of the required operating ranges can even result in increased
NOX emissions. Extensive computational fluid dynamic (CFD) simulations are needed to determine the
optimum injection points. Boiler operating conditions will change with unit load and varying fuel
characteristics. The RRI process control systems must be able to adjust for these changing conditions.
2400-3100oF
NOx
N2
ChemicalInjection
NHi NCO
StagedCombustion Zone
Fuel Rich Zone
Burnout ZoneOFA
Fuel
2400-3100oF
NOx
N2
ChemicalInjection
NHi NCO
StagedCombustion Zone
Fuel Rich Zone
Burnout ZoneOFA
Fuel

A-8 11/2/2009
RRI has the potential to provide a moderate degree of NOX reduction on coal-fired cyclone boilers. Rich
Reagent Injection can be applied and installed on Big Stone boiler only with separated over-fire air
(SOFA).
A1.2.3 Selective Catalytic Reduction (SCR) The lowest NOx emission levels from coal-fired utility boilers are typically achieved by installing and
operating selective catalytic reduction (SCR) technology. In the SCR process, the gas stream is passed
through a catalyst bed in the presence of ammonia to reduce NOX to molecular nitrogen and water. The
process is termed “selective” because the ammonia preferentially reacts with the NOX rather than with the
oxygen in the flue gas. A catalyst is used to enhance NOX reduction and ammonia utilization at
appropriate flue gas temperatures. SCR is usually applied to flue gas in the 600°F to 750°F temperature
range. There are variations in the SCR process for coal-fired boilers that mostly involve locations in the
flue gas path where the catalyst is placed in order to promote the desired NOX emission reduction effect.
These are described below.
For coal-fired boilers, a conventional SCR reactor utilizes readily-available catalyst materials and reagent
in the form of ammonia. A conventional SCR reactor is commonly installed in a high-dust, hot-side
arrangement, located between the economizer outlet and air heater inlet, where the flue gas temperature is
within the desired operating range for the SCR catalyst.
A schematic graphic diagram for a conventional high-dust, hot-side SCR system on a boiler with a flue
gas desulfurization system and stack gas reheat is provided in Figure A.1-5.

A-9 11/2/2009
Figure A.1-5 Conventional SCR Arrangement with FGD Scrubber Outlet Reheat
(figure copied from Wheelabrator Air Pollution Control literature)

A-10 11/2/2009
SCR technology has been installed on several pulverized coal and cyclone boilers firing bituminous and
subbituminous coal in the United States. The installation of SCR systems has been completed on
approximately 22 cyclone units. Several SCR installations have been retrofit on existing cyclone-fire
boilers burning western subbituminous coal (or PRB blended with midwestern bituminous coal). For
cyclone coal-fired utility boilers retrofitted with SCR technology, all were originally designed to burn
bituminous coal.
Two byproducts from the high-dust, hot-side SCR process are ammonia slip and SO3:
• Ammonia Slip: Slip is ammonia that is unreacted in the NOx emission reduction process.
Maximum ammonia slip for a gas fired unit is usually 10 ppmvd whereas, on a coal fired unit,
ammonia slip below 2 ppm is desired. For certain applications, this concentration can be
problematic, therefore requiring more catalyst to reduce slip. Most new SCR applications have
ammonia slip guaranteed at a 2 ppmvd maximum for an initial operating period, and are expected to
continue to operate at these low ammonia slips levels beyond the end of the initial period.
• SO3: Due to the composition of typical SCR catalysts, a small percentage of inherent SO2 will be
oxidized to SO3. This oxidation can be controlled by catalyst selection and can be less than 1%.
SO2 to SO3 oxidation must be carefully controlled to avoid creating SO3 levels sufficiently high to
raise the possibility of air heater fouling. A unit firing high-sulfur coal with SCR technology is
especially vulnerable to SO2 oxidation and ammonia slip-related fouling problems. The deposition
and fouling is due to formation of solid ammonium sulfate ((NH4)2SO4) and liquid ammonium
bisulfate (NH4HSO4). The most important design variable is optimizing the catalyst selection and
amount of catalyst that will reduce NOX emissions, control ammonia slip, and minimize SO2
oxidation.
As posted on Electric Power Research Institute Inc.’s (EPRI’s) website regarding the impact of coal type
on SCR catalyst life and performance, a recent EPRI study11 produced field data analyzed from an “In-
Situ Mini SCR Reactor” system installed in a typical “high-dust” location at seven different test sites,
including four firing PRB coal, one firing Texas lignite, one firing high-sulfur eastern bituminous coal,
and one firing a PRB/eastern bituminous coal blend. The PRB/bituminous coal blend test was performed
at AmerenUE’s Sioux Station, on one of the two 500 MW cyclone-fired boilers. This study found that
the cyclone unit firing the PRB/bituminous coal blend exhibited the fastest rate of catalyst activity
degradation. Also, the higher deactivation rates seen at this site were due to economizer exit flue gas
temperatures being significantly higher than at the other sites. A comparison of the Texas lignite and one

A-11 11/2/2009
of the PRB-fired sites of two different catalysts’ deactivation was more a function of trace elements in the
flue gas and flyash than the specific catalyst type or formulation.
Based upon this technical assessment that looked at the various design and operational issues associated
with the installation of hot-side, high-dust SCR technology, SCR is considered a feasible option for Unit I
at Big Stone.

A-12 11/2/2009
References for Appendix A1:
1. “The State of the Art in Cyclone Boiler NOx Reduction”, by O’Connor, Dave, Himes, Rick, and
Facchiano, Tony (Electric Power Research Institute), presented at the EPRI-DOE-EPA Combined Utility Air Pollutant Control Symposium, Atlanta, GA, August 16-20, 1999.
2. “B&W’s Advances on Cyclones NOx Control Via Fuel and Air Staging Technologies”, by Farzan,
H., Maringo, G., Johnson, D. W., and Wong, D.K. (Babcock & Wilcox, Co.), Beard, C.T. (Eastman Kodak Company), and Brewster, S.E. (Tennessee Valley Authority), presented at the EPRI-DOE-EPA Combined Utility Air Pollutant Control Symposium, Atlanta, GA, August 16-20, 1999. Available at B&W’s internet website: http://www.babcock.com/pgg/tt/pdf/BR-1683.pdf
3. Burns & McDonnell internal database for NOX reduction projects. 4. B&W experience list September 18, 2002. 5. “Reburning Projects in the Department of Energy’s Clean Coal Technology Demonstration
Program”, by Mann, Al and Ruppel, Tom (Parsons Corporation), and Sarkus, Tom (National Energy Technical Laboratory), presented at the 2004 DOE-NETL Conference on Reburning for NOx Control, Morgantown, WV, May 18, 2004. A reburn-related document (an updated version of a poster from the May 18 Conference) is titled “Scorecard on Reburning 6/1/2004” by Al Mann and Tom Ruppel, Parsons Corporation, available on-line at: http://www.netl.doe.gov/publications/proceedings/04/NOx/posters/Reburning%20Scorecard.pdf
6. GE Energy (formerly GE-EER) experience list September 29, 2005. 7. Fuel Tech experience list dated 1/28/2005. 8. SNCR “White Paper”, Institute of Clean Air Companies, Inc. (ICAC), SNCR Committee, May
2000, Fuel Tech website http://www.fueltechnv.com/pdf/TPP-534.pdf. 9. RJM experience list September 3, 2004. 10. “Improved Rich Reagent Injection (RRI) Performance For NOx Control In Coal Fired Utility
Boilers” by Cremer, Marc A. and Wang, Huafeng D. (Reaction Engineering International), Boll, David E. (AmerenUE), Schindler, Edmund (RJM Corporation), and Vasquez, Edmundo RMT, Inc. (Alliant Energy Corp.), presented at 2003 U.S. DOE Conference on SCR and SNCR for NOx Control, Pittsburgh, PA, October 29-30, 2003.
11. “Ash Impacts on SCR Catalyst Performance”, Energy & Environmental Research Center (EERC)
of the University of North Dakota”, Benson, Steven A., Ph.D., October 2005.

11/2/2009
A2 CUECost Input Summary

CUECost - Air Pollution Control Systems Economics Spreadsheet
APC Technology Choices
Description Units Case 1 Case 2 Case 3
FGD Process Integer 1 1 1 (1 = LSFO, 2 = LSD)Particulate Control Integer 1 1 1 (1 = Fabric Filter, 2 = ESP)NOx Control Integer 1 1 1 (1 = SCR, 2 = SNCR, 3 = LNBs, 4 = NGR)
INPUTS
Description Units Case 1 Case 2 Case 3
General Plant Technical Inputs
Location - State Abbrev. SD SD SDMW Equivalent of Flue Gas to Control System MW 475 475 475Net Plant Heat Rate Btu/kWhr 11,809 11,809 11,809Plant Capacity Factor % 85% 85% 85%Total Air Downstream of Economizer % 120% 120% 120%Air Heater Leakage % 10% 10% 10%Air Heater Outlet Gas Temperature °F 320 320 320Inlet Air Temperature °F 70 70 70Ambient Absolute Pressure In. of Hg 28.75 28.75 28.75Pressure After Air Heater In. of H2O -15 -15 -15Moisture in Air lb/lb dry air 0.013 0.013 0.013Ash Split: Fly Ash % 80% 80% 80% Bottom Ash % 20% 20% 20%Seismic Zone Integer 0 0 0Retrofit Factor Integer 1.5 1.5 1.5 (1.0 = new, 1.3 = medium, 1.6 = difficult)Select Coal Integer 1 1 1Is Selected Coal a Powder River Basin Coal? Yes / No Yes Yes Yes
Economic Inputs
Cost Basis -Year Dollars Year 2008 2008 2007Sevice Life (levelization period) Years 30 30 30Inflation Rate % 3% 3% 3%After Tax Discount Rate (current $'s) % 9% 9% 9%AFDC Rate (current $'s) % 11% 11% 11%First-year Carrying Charge (current $'s) % 10% 10% 10%Levelized Carrying Charge (current $'s) % 10% 10% 10%First-year Carrying Charge (constant $'s) % 10% 10% 10%Levelized Carrying Charge (constant $'s) % 10% 10% 10%Sales Tax % 6% 6% 0%Escalation Rates: Consumables (O&M) % 3% 3% 3%
BSGS 102709 CUECost Rev15PrelimR4.XLS, Input & Calculation Summary1 11/2/2009, 1:01 PM

CUECost - Air Pollution Control Systems Economics Spreadsheet
Capital Costs: Is Chem. Eng. Cost Index available? Yes / No Yes Yes Yes If "Yes" input cost basis CE Plant Index Integer 575.4 575.4 575.4 If "No" input escalation rate. % 3% 3% 3%Construction Labor Rate (Not Used N Calc) $/hr $35 $35 $35Prime Contractor's Markup % 3% 3% 3%Operating Labor Rate $/hr $48 $48 $48Power Cost Mills/kWh 25 25 25Steam Cost $/1000 lbs 3.5 3.5 3.5
Limestone Forced Oxidation (LSFO) Inputs
Any By-Pass around the scrubber 2 2 2 (1 = yes, 2 = no)Percent of By-Passed Gas % 0.0% 0.0% 0.0%
SO2 Removal Required % 95.0% 83.0% 95.0%L/G Ratio gal / 1000 acf 125 125 110Design Scrubber with Dibasic Acid Addition? Integer 2 2 2 (1 = yes, 2 = no)Adiabatic Saturation Temperature °F 132 132 135Reagent Feed Ratio Factor 1.05 1.05 1.03 (Mole CaCO3 / Mole SO2 removed)Scrubber Slurry Solids Concentration Wt. % 15% 15% 15%Stacking, Landfill, Wallboard Integer 2 2 3 (1 = stacking, 2 = lanfill, 3 = wallboard)Number of Absorbers Integer 1 1 1 (Max. Capacity = 700 MW per absorber)Absorber Material Integer 1 1 1 (1 = alloy, 2 = RLCS)Absorber Pressure Drop in. H2O 6 6 6Reheat Required ? Integer 2 2 2 (1 = yes, 2 = no)Amount of Reheat °F 0 0 0Reagent Bulk Storage Days 60 60 30Reagent Cost (delivered) $/ton $24 $24 $12Landfill Disposal Cost $/ton $4 $4 $30Stacking Disposal Cost $/ton $2 $2 $6Credit for Gypsum Byproduct $/ton $0 $0 $0Maintenance Factors by Area (% of Installed Cost) Reagent Feed % 3% 3% 3% SO2 Removal % 3% 3% 3% Flue Gas Handling % 3% 3% 3% Waste / Byproduct % 3% 3% 3% Support Equipment % 3% 3% 3%Contingency by Area (% of Installed Cost) Reagent Feed % 20% 20% 20% SO2 Removal % 20% 20% 20% Flue Gas Handling % 20% 20% 20% Waste / Byproduct % 20% 20% 20% Support Equipment % 20% 20% 20%General Facilities by Area (% of Installed Cost) Reagent Feed % 10% 10% 10% SO2 Removal % 10% 10% 10%
BSGS 102709 CUECost Rev15PrelimR4.XLS, Input & Calculation Summary2 11/2/2009, 1:01 PM

CUECost - Air Pollution Control Systems Economics Spreadsheet
Flue Gas Handling % 10% 10% 10% Waste / Byproduct % 10% 10% 10% Support Equipment % 10% 10% 10%Engineering Fees by Area (% of Installed Cost) Reagent Feed % 10% 10% 10% SO2 Removal % 10% 10% 10% Flue Gas Handling % 10% 10% 10% Waste / Byproduct % 10% 10% 10% Support Equipment % 10% 10% 10%
Lime Spray Dryer (LSD) Inputs
SO2 Removal Required % 90% 83% 90%Adiabatic Saturation Temperature °F 132 132 135Flue Gas Approach to Saturation °F 20 20 25Spray Dryer Outlet Temperature °F 152 152 160Reagent Feed Ratio Factor 0.92 0.85 0.92 (Mole CaO / Mole Inlet SO2)Recycle Rate Factor 30 30 30 (lb recycle / lb lime feed)Recycle Slurry Solids Concentration Wt. % 35% 35% 35%Number of Absorbers Integer 2 2 1 (Max. Capacity = 300 MW per spray dryer)Absorber Material Integer 1 1 2 (1 = alloy, 2 = RLCS)Spray Dryer Pressure Drop in. H2O 5 5 5Reagent Bulk Storage Days 60 60 30Reagent Cost (delivered) $/ton $145 $145 $60Dry Waste Disposal Cost $/ton $4 $4 $30Maintenance Factors by Area (% of Installed Cost) Reagent Feed % 2% 2% 2% SO2 Removal % 2% 2% 2% Flue Gas Handling % 2% 2% 2% Waste / Byproduct % 2% 2% 2% Support Equipment % 2% 2% 2%Contingency by Area (% of Installed Cost) Reagent Feed % 20% 20% 20% SO2 Removal % 20% 20% 20% Flue Gas Handling % 20% 20% 20% Waste / Byproduct % 20% 20% 20% Support Equipment % 20% 20% 20%General Facilities by Area (% of Installed Cost) Reagent Feed % 10% 10% 10% SO2 Removal % 10% 10% 10% Flue Gas Handling % 10% 10% 10% Waste / Byproduct % 10% 10% 10% Support Equipment % 10% 10% 10%Engineering Fees by Area (% of Installed Cost) Reagent Feed % 10% 10% 10% SO2 Removal % 10% 10% 10% Flue Gas Handling % 10% 10% 10% Waste / Byproduct % 10% 10% 10% Support Equipment % 10% 10% 10%
BSGS 102709 CUECost Rev15PrelimR4.XLS, Input & Calculation Summary3 11/2/2009, 1:01 PM

CUECost - Air Pollution Control Systems Economics Spreadsheet
Particulate Control Inputs
Outlet Particulate Emission Limit lbs/MMBtu 0.015 0.015 0.015Fabric Filter: Pressure Drop in. H2O 9 9 9 Type (1 = Reverse Gas, 2 = Pulse Jet) Integer 1 2 1 Gas-to-Cloth Ratio ACFM/ft2 2.3 3.5 2.3 Bag Material (RGFF fiberglass only) Integer 1 3 1 (1 = Fiberglass, 2 = Nomex, 3 = Ryton) Bag Diameter inches 12 6 12 Bag Length feet 30 26 30 Bag Reach 3 3 3 Compartments out of Service % 10% 10% 10% Bag Life Years 5 3 5 Maintenance (% of installed cost) % 5% 5% 5% Contingency (% of installed cost) % 20% 20% 20% General Facilities (% of installed cost) % 10% 10% 10% Engineering Fees (% of installed cost) % 10% 10% 10%ESP: Strength of the electric field in the ESP = E kV/cm 10.0 10.0 10.0 Plate Spacing in. 12 12 16 Plate Height ft. 36 36 36 Pressure Drop in. H2O 3 3 2 Maintenance (% of installed cost) % 5% 5% 5% Contingency (% of installed cost) % 20% 20% 20% General Facilities (% of installed cost) % 10% 10% 10% Engineering Fees (% of installed cost) % 10% 10% 10%
NOx Control Inputs
Selective Catalytic Reduction (SCR) Inputs
NH3/NOX Stoichiometric Ratio NH3/NOX 0.8 0.8 0.800641299NOX Reduction Efficiency Fraction 0.80 0.84 0.70Inlet NOx lbs/MMBtu 0.5 0.65 0.15Space Velocity (Calculated if zero) 1/hr 0 0 0Overall Catalyst Life years 2 2 3Ammonia Cost $/ton 325 325 325Catalyst Cost $/ft3 150 150 150Solid Waste Disposal Cost $/ton 11.48 11.48 11.48Maintenance (% of installed cost) % 1.5% 1.5% 1.5%Contingency (% of installed cost) % 20% 20% 20%General Facilities (% of installed cost) % 5% 5% 5%Engineering Fees (% of installed cost) % 10% 10% 10%Number of Reactors integer 2 2 2Number of Air Preheaters integer 2 2 2
Selective NonCatalytic Reduction (SNCR) Inputs
Reagent 1:Urea 2:Ammonia 1 1 1Number of Injector Levels integer 3 3 3Number of Injectors integer 18 18 18Number of Lance Levels integer 0 0 0
BSGS 102709 CUECost Rev15PrelimR4.XLS, Input & Calculation Summary4 11/2/2009, 1:01 PM

CUECost - Air Pollution Control Systems Economics Spreadsheet
Number of Lances integer 0 0 0Steam or Air Injection for Ammonia integer 1 1 1NOX Reduction Efficiency Fraction 0.30 0.60 0.46Inlet NOx lbs/MMBtu 0.5 0.5 0.65NH3/NOX Stoichiometric Ratio NH3/NOX 2 4 2Urea/NOX Stoichiometric Ratio Urea/NOX 2 4 2Urea Cost $/ton 380 380 380Ammonia Cost $/ton 325 325 325Water Cost $/1,000 gal 0.407 0.407 0.407Maintenance (% of installed cost) % 1.5% 1.5% 1.5%Contingency (% of installed cost) % 20% 20% 20%General Facilities (% of installed cost) % 5% 5% 5%Engineering Fees (% of installed cost) % 10% 10% 10%
Low NOX Burner Technology Inputs
NOX Reduction Efficiency fraction 0.35 0.35 0.35Boiler Type T:T-fired, W:Wall T T T
Retrofit DifficultyL:Low, A:Average,
H:High A A AMaintenance Labor (% of installed cost) % 0.8% 0.8% 0.8%Maintenance Materials (% of installed cost) % 1.2% 1.2% 1.2%
Natural Gas Reburning Inputs
NOX Reduction Efficiency fraction 0.61 0.61 0.61Gas Reburn Fraction fraction 0.15 0.15 0.15Waste Disposal Cost $/ton 11.48 11.48 11.48Natural Gas Cost $/MMBtu 2.31 2.31 2.31Maintenance (% of installed cost) % 1.5% 1.5% 1.5%Contingency (% of installed cost) % 20% 20% 20%General Facilities (% of installed cost) % 2% 2% 2%Engineering Fees (% of installed cost) % 10% 10% 10%
Sulfuric Acid Mist Control Inputs
BSGS 102709 CUECost Rev15PrelimR4.XLS, Input & Calculation Summary5 11/2/2009, 1:01 PM

11/2/2009
A3 Summary of Modeling Results

Modeling Report for a BART Assessment of the Big Stone I Coal-Fired Power Plant, Big Stone City, South Dakota Part 2 – BART Controls October 2009
Prepared For: Big Stone I Otter Tail Power Company, Big Stone City, South Dakota Prepared By: TRC Environmental Corporation 650 Suffolk Street Lowell, Massachusetts 01854 (978) 970-5600

i
TABLE OF CONTENTS
Page
1. INTRODUCTION .......................................................................................................................... 1-1
2. SOURCE DESCRIPTION ............................................................................................................ 2-1
3. GEOPHYSICAL AND METEOROLOGICAL DATA, AIR QUALITY MODELING OPTIONS ........................................................................................................................................ 3-1
4. RESULTS ....................................................................................................................................... 4-1
5. REFERENCES ............................................................................................................................... 5-1
LIST OF FIGURES
Page Figure 3-1. Terrain elevations for the CALMET and CALPUFF modeling domain at 4 km
resolution. The locations of the Big Stone facility and Class I areas are also shown. ..... 3-3
LIST OF TABLES
Page Table 2-1: Point Source Parameters and Emission Rates .................................................................. 2-2 Table 2-2: PM10 Size Distribution ..................................................................................................... 2-3 Table 2-3: PM10 Speciation and Size Distribution ............................................................................. 2-4 Table 4-1. Visibility Impacts for 2002 .............................................................................................. 4-2 Table 4-1. Visibility Impacts for 2002 (continued). .......................................................................... 4-3 Table 4-2. Visibility Impacts for 2006. ............................................................................................. 4-4 Table 4-2. Visibility Impacts for 2006 (continued). .......................................................................... 4-5 Table 4-3. Visibility Impacts for 2007. ............................................................................................. 4-6 Table 4-3. Visibility Impacts for 2007 (continued). .......................................................................... 4-7

Introduction 1-1
1. INTRODUCTION
TRC Environmental Corporation has conducted a site-specific BART (Best Available Retrofit Technology) modeling assessment of the Big Stone I coal-fired power plant facility located near Milbank and Big Stone City in South Dakota to determine if this facility is subject to BART controls on emissions. Part I of the October 2009 report presented a modeling assessment of baseline emissions from the Big Stone I power plant facility to determine whether the facility is subject to BART controls. This report (Part 2) represents the results of 10 emission control scenarios.
On July 6, 2005 the U.S. Environmental Protection Agency (U.S. EPA) published in the Federal Register the “Regional Haze Regulations and Guidelines for Best Available Retrofit Technology (BART) Determinations” (40 CFR Part 51). The regional haze rule requires States to submit implementation plans (SIPs) to address regional haze visibility impairment in 156 Federally-protected parks and wilderness areas, commonly referred to as “Class 1 Areas”. The final rule addresses BART-eligible sources, which are defined as sources that have the potential to emit 250 tons or more of a visibility-impairing air pollutant, were put in place between August 7, 1962 and August 7, 1977 and whose operations fall within one or more of 26 specifically listed source categories, of which Coal-Fired Power Plants are one.
The modeling described in this report is consistent with modeling described in baseline report. All CALMET/CALPUFF switches used in this BART analysis are identical with the switches used and described in previous report. In this report, ten BART control scenarios were analyzed and results of these modeling presented.
The purpose of the modeling is to assess the visibility impacts of sulfur dioxide (SO2), particulate matter (PM) and nitrogen oxides (NOx) emissions from the Big Stone I boiler and compare the impacts to the 0.5 change in deciview threshold at all the federally mandatory Class I areas. Since there is no Class I area within the 300 km radius usually applied, the South Dakota Department of Environment and Natural Resources requested that the Class I areas between 300 km and up to 625 km away from the Big Stone I facility sources be modeled. A total of eight Class I areas are located between these distances: two wilderness areas: Boundary Waters Canoe Area Wilderness and Rainbow Lake Wilderness, one National Wildlife Refuge (NWR): Lostwood and five National Parks: Voyageurs NP, Theodore Roosevelt NP, Badlands NP, Wind Cave NP and Isle Royale NP. However, Rainbow Lake Wilderness is one of two Class I areas where the visibility analysis is not required (http://www.dnr.state.wi.us/org/aw/air/modeling/ psd.htm), so it is not included in the modeling analysis. The MM5 datasets distributed by WRAP did not extend far enough in the East to include the Isle Royale NP or cover all of the Boundary Waters Class I area. The re-extracted MM5 data for 2002 and new MM5 domains for 2006 and 2007 include these areas.
The CALMET and CALPUFF non-steady-state models (Scire et al., 2000a,b) are recommended by the U.S. EPA (Federal Register, 6 July 2005) to perform source-specific subject-to-BART

Introduction 1-2
screening. The CALPUFF system was therefore used for this modeling analysis. The U.S. EPA has promulgated the CALPUFF modeling system as a Guideline Model for Class I impact assessments and other long range transport applications or near field applications involving complex flows (U.S. EPA, 2000), and the model is recommended by both the Federal Land Managers (FLM) Air Quality Workgroup (FLAG, 2000) and the Interagency Workgroup on Air Quality Modeling (IWAQM, 1998). The CALPUFF modeling system is also recommended in new proposed guidance by the FLMs (FLAG, 2008). On August 31, 2009 EPA issued new recommendations on CALMET switch settings. The current modeling is based on the August 2009 recommendations.
The Big Stone I BART modeling analysis was performed with the EPA-approved Version 5.8 of the CALMET and CALPUFF models. Version 6.221 of CALPOST was used because it contains the FLM-approved implementation of Method 8 (FLAG, 2008), but in other respects is identical to the EPA-approved Version 5.6394.
CALMET is a diagnostic meteorological model that produces three-dimensional wind fields based on parameterized treatments of terrain effects such as slope flows and terrain blocking effects. Normally, meteorological observations are blended with gridded data from the NCAR-PSU Mesoscale Model, Version 5 (MM5). For this evaluation, MM5 data were generated by TRC with a 12-km grid spacing for two years (2006 and 2007) to define the initial guess wind fields. For 2002, 12-km MM5 data were re-extracted from the EPA MM5 dataset to cover entire region including the Isle Royale NP to the east.
CALPUFF is a non-steady-state puff dispersion model. It accounts for spatial changes in the CALMET-produced meteorological fields, variability in surface conditions (elevation, surface roughness, vegetation type, etc.), chemical transformation, wet removal due to rain and snow, dry deposition, and terrain influences on plume interaction with the surface. CALPUFF contains a module to compute visibility effects, based on a humidity-dependent relationship between particulate matter concentrations and light extinction, as well as wet and dry acid deposition fluxes. The meteorological and dispersion modeling simulations were conducted for three years (2002, 2006 and 2007). SO2, SO4, PM, and NOx, emissions and their secondary products resulting from chemical conversions from the Big Stone I facility were modeled and their impacts on visibility evaluated at receptors in the Class I areas. Visibility impacts were estimated with the new FLM-recommended visibility algorithm and monthly average relative humidity adjustment factors (Method 8 in Version 6.221).
This report outlines the techniques and data sources used in the BART analyses. In Section 2, a general description of the source configurations for the baseline case and 10 control scenarios are provided. Section 3 refers to the baseline report where descriptions of the site characteristics and data bases (meteorological, geophysical, and aerometric) were provided, as well as an overview of the CALMET and CALPUFF models settings and parameters that were used in the analysis. The results of the control scenario evaluations are summarized in Section 4.

Source Description 2-1
2. SOURCE DESCRIPTION
The 450-megawatt Big Stone I facility is a coal-fired power plant situated close to Big Stone City and Milbank in Grant County, South Dakota, at the border of Minnesota State. A BART applicability analysis was completed for the facility to determine those sources subject to the BART controls. The BART-eligible source is the Big Stone I cyclone-fired boiler with one stack 152 meters (498 feet) high.
The proposed emissions for the BART analysis were described in a Modeling Protocol dated June 2009. These emissions were reviewed and approved by SD DENR. In addition, 10 different control scenarios were modeled. Table 2-1 shows the source parameters and emission rates for the source considered in this report both for the baseline case and ten control scenarios. The highest 24-hour average actual emission rates of SO2, NOx and PM under normal conditions over the 2001-2003 period were used for the baseline case in this analysis.
As shown in Table 2-2, the filterable PM10 are divided into a particle size distribution based on AP-42, Table 1.1-6 for baghouse controlled emissions because the facility currently uses a fabric filter for PM control. Approximately 57.6% of the filterable mass is in the fine (PM2.5) size category, and 42.4% in the coarse (2.5 to 10 µm diameter) size range. Each of the particle size categories was modeled as a separate PM species in CALPUFF. The filterable PM10 emission rate is reported by the facility at 10.48 g/s (83.2 lb/hr). Based on AP-42 Table 1.1-5, the total condensable PM10 is approximately 0.01 lb/mmBtu based on approximately 0.4% sulfur coal or 7.07 g/sec (56.1 lb/hr) assuming an heat input of 5609 mmBtu/hr. This estimate is consistent with the stack test data (August, 2006) at Otter Tail Power’s Hoot Lake Plant, Unit 2, (which burns PRB coal) where the ratio of the filterable/total PM10 ratio was 0.66, resulting in a 2/3 filterable and 1/3 condensable split to the total PM10.1
Elemental Carbon (EC) emissions were assumed to be 3.7% of the fine filterable fraction based on U.S. EPA (2002) and were assigned to the smallest particle size category. The primary H2SO4 emissions are 0.454 g/s (3.604 lb/hr) based on annual emission inventories and Toxic Release Inventory reports. The remaining condensable emissions were assigned to organic carbon and distributed equally into the two smallest particle size categories.
Table 2-3 provides a summary of the PM10 speciation and size distribution.
Note that since all Class I areas are more than 50 km away from the facility, as recommended by the Federal Land Managers (FLMs) (US Fish and Wildlife, National Park Service and U.S. Forest Service), no downwash computations was performed.
1 AP-42 Table 1.1-8 was not used to estimate the particulate matter size distribution for Big Stone I because the emission factors were derived for cyclones burning bituminous coal, not sub-bituminous coal which is burned at Big Stone I.

Source Description 2-2
Table 2-1: Point Source Parameters and Emission Rates
Main Stack
LCC1 East (km)
LCC1 North (km)
Stack Ht (m)
Base Elevation
(m)
Stack Diameter
(m)
Exit Velocity
(m/s)
Exit Temp. (K) 2
SO2 Emission
Rate (g/s)
H2SO4
Emission Rate (g/s)
NOx Emission
Rate (g/s)
Filterable PM10 2
Emission
Rate (g/s)
Condensable PM10
Emission Rate (g/s)
Baseline Case 38.141 587.875 151.79 328.90 7.37 20.14 423.1 608.9 0.454 611.7 10.48 7.07
Control 1 Over-fire Air (OFA) Presumptive Dry FGD '' '' '' '' '' 19.57 352.6 106.0 '' 459.4 '' ''
Control 2 OFA Presumptive Wet FGD '' '' '' '' '' 18.23 330.4 106.0 '' 459.4 '' ''
Control 3 OFA Dry FGD at 90% Control '' '' '' '' '' 19.57 352.6 63.6 '' 459.4 '' ''
Control 4 OFA Wet FGD at 95% Control '' '' '' '' '' 18.23 330.4 30.4 '' 459.4 '' ''
Control 5 Separated OFA (SOFA) Presumptive Dry FGD '' '' '' '' '' 19.57 352.6 106.0 '' 353.4 '' ''
Control 5a SOFA Dry FGD at 90% Control '' '' '' '' '' 19.57 352.6 63.6 '' 353.4 '' ''
Control 5b SOFA Wet FGD at 95% Control '' '' '' '' '' 18.23 330.4 30.4 '' 353.4 '' ''
Control 6 SNCR with SOFA, Presumptive Dry FGD '' '' '' '' '' 19.57 352.6 106.0 '' 247.4 '' ''
Control 7 RRI+SNCR with SOFA Presumptive Dry FGD '' '' '' '' '' 19.57 352.6 106.0 '' 141.3 '' ''
Control 8 SCR with SOFA Presumptive Dry FGD '' '' '' '' '' 19.57 352.6 106.0 '' 70.7 '' ''
1 Lambert Conformal Projection with an origin of 40.0N, 97.0W and standard parallels at 33N and 45N. Datum is NWS-84. 2 The PM technology for all modeling scenarios is the existing pulse-jet fabric filter.

Source Description 2-3
Table 2-2: PM10 Size Distribution1
Particle Size2 (µm)
Cumulative Mass (PM) (%)
Cumulative Mass (PM10)
(%) 15 97 - 10 92 100 6 77 83.7
2.5 53 57.6 1.25 31 33.7 1.00 25 27.2
1 From AP-42, Table 1.1-6, Cumulative particle size distribution and size-specific emission factors for dry bottom boilers burning pulverized bituminous and subbituminous coal.
2 Expressed as aerodynamic equivalent diameter.

Source Description 2-4
Table 2-3: PM10 Speciation and Size Distribution
input Data: H2SO4 PM10 PM2.5 g/s g/s g/s
PM10 and H2SO4 Emissions (g/s) 0.454 17.550 13.106
filterable condensable condensable % 59.7% 40.3%
g/s g/s 10.480 7.070 non H2SO4 condensable g/s 6.616 AP-42, Table 1.1-6 coarse coarse soil soil soil soil EC H2SO4 OC OC IC (soil) IC (soil) PM800 PM425 PM187 PM112 PM081 PM056 PM056 PM081 PM056 PM081 PM056
6.00 - 10.00 2.50-6.00
1.25-2.50
1.00-1.25 0.625-1.00
0.50-0.625 0.50-0.625
0.625-1.00
0.50-0.625
0.625-1.00
0.50-0.625
16.3% 26.1% 23.9% 6.5% 12.0% 15.2% 57.6% 50.0% 50.0% 50.0% 50.0% EC % of filterable 96.3% 3.7% 100% 0%
inorganic % of g/s g/s g/s g/s g/s g/s g/s g/s g/s g/s condensable 1.708 2.735 2.412 0.656 1.211 1.534 0.223 0.454 3.308 3.308
inputs to POSTUTIL:
Extinction coefficient 0.6 0.6 1 1 1 1 10 3*f(RH) 4 4 coarse coarse soil soil soil soil EC H2SO4 OC OC PM800 PM425 PM187 PM112 PM081 PM056 PM056 PM081 PM056 g/s g/s g/s g/s g/s g/s g/s g/s g/s g/s 1.708 2.735 2.412 0.656 1.211 1.534 0.223 0.454 3.308 3.308

Geophysical and Meteorological Data 3-1
3. GEOPHYSICAL AND METEOROLOGICAL DATA, AIR QUALITY MODELING OPTIONS
The South Dakota Department of Environment and Natural Resources requested that the eight Class I areas shown in Figure 3-1 be considered in the BART analysis. Rainbow Lake Wilderness is one of two Class I areas where the visibility analysis is not required so it has been removed from the present analysis (see http://www.dnr.state.wi.us/org/aw/air/modeling/psd.htm). The MM5 dataset for this analysis were extended to include the Isle Royale National Park as well as all of the Boundary Waters Class I area.
Processing of the topography and land use for the domain shown in Figure 3-1 was described in detail in Section 3 of the October 2009 Big Stone Report (Report). In the same Report, all meteorological data and ozone data used in the modeling have been discussed. Locations of the stations were presented in Figures 3-3 and 3-4 of the Report.
CALMET was run with 4-km grid resolution using 12-km MM5 data for initial guess fields. CALMET and CALPUFF use terrain-following coordinates. In order to cover a large enough area for the refined analysis covering all seven Class I areas within a single domain, and including a buffer of at least 50 km around each Class I area, the domain dimensions of 1250 km x 720 km were used. For a 4-km grid spacing, this amounts to 313 x 181 grid cells. In the vertical, a stretched grid was used with finer resolution in the lower layers and somewhat coarser resolution aloft thus allowing adequate representation of the mixed layer. The ten vertical levels were centered at: 10, 30, 60, 120, 240, 480, 920, 1600, 2500 and 3500 meters.
CALMET and CALPUFF were run for three years, 2002, 2006 and 2007. A network of discrete receptors derived from the list of receptors developed by the National Park Service (NPS) are located within the boundaries of the seven Class I areas modeled: Boundary Water Canoe Area Wilderness, Voyageur National Park, Badlands National Park, Wind Cave National Park, Lostwood National Wildlife Refuge, Theodore Roosevelt National Park and Isle Royale National Park.
Meteorological modeling options including initial guess fields and step 1 and 2 wind fields, dispersion modeling options and visibility calculations were all described in Section 4 of the October 2009 report.
Calculations of the impact of the simulated plume particulate matter component concentrations on light extinction were carried out with the CALPOST postprocessor following the new proposed FLAG (2008) guidance. A revised new IMPROVE algorithm to compute the extinction (1/Mm) has been developed by the IMPROVE steering committee for estimating light extinction from particulate matter. That algorithm provides a better correspondence between the measured visibility and that calculated from particulate matter component concentrations (Tombach, 2006):
To represent background natural conditions, monthly background concentrations must be entered into the CALPOST input control file for all aerosols defining the background. The WRAP Protocol (2006) recommendations for natural conditions background are to use all three types of EPA default Natural Conditions: Best 20% Days, Annual Average and Worst 20% Days. In “Guidance for Estimating Visibility Conditions Under the Regional Haze Rule” (EPA, 2003), these three default values are defined only by their extinction coefficient in Mm-1. For CALPOST Method 8, explicit background

Geophysical and Meteorological Data 3-2
concentrations are required to allow the computation of the small and large sulfate particulates, nitrate particulates and organic carbon. So, in this analysis, the annual averaged background conditions were used to define the natural background for each of the seven Class I areas, following FLAG (2008). The concentrations used as background for each of the seven Class I areas are summarized in Table 4-2 of the October 2009 report. These concentrations were used to compute the natural background light extinction following the revised IMPROVE formulae described above, for each of the Class I areas.
Tables 4-3, 4-4, and 4-5 in October 2009 report, provide the monthly f(RH) values for each of the seven Class I areas, that are used to compute extinction coefficients for hygroscopic species, respectively for small ammonium sulfate and ammonium nitrate particles, large ammonium sulfate and ammonium nitrate particles, and sea salt particles.
The 8th highest (98th percentile) predicted light extinction change for each year modeled was compared to the threshold value of 0.5 deciview.

Geophysical and Meteorological Data 3-3
Figure 3-1. Terrain elevations for the CALMET and CALPUFF modeling domain at 4 km resolution. The locations of the Big Stone facility and
Class I areas are also shown.
-500 -400 -300 -200 -100 0 100 200 300 400 500 600 700LCC x (km), NWS-84
300
400
500
600
700
800
900
1000LC
C x
(km
), N
WS
-84
Projection:LCC; Center: 40N, 98WStandards: 20N, 60NDatum: NWS-84
100200300400500600700800900100011001200130014001500160017001800190020002100
FACILITY
WindCave
Badlands
TheodoreRoosevelt
LostwoodVoyageurs
BoundaryWaters
Isle Royale
Elevation(meters)

Results 4-1
4. RESULTS
The results for the BART analysis for the Big Stone I facility are presented in this section. The analysis consists of evaluating the visibility impact (percent change in light extinction due to the sources measured in deciview) at all the Class I areas modeled. The results are presented in three tables for the baseline case and ten control scenarios, each table gathering the impact at seven Class I areas for each of the years modeled: Table 4-1 for 2002, Table 4-2 for 2006 and Table 4-3 for 2007. The change in light extinction due to the source is compared to the annual average natural background light extinction. The interpretation of the results is done by comparing the 98th percentile of delta deciview for each year to the 0.5 delta deciview threshold. Analysis is performed by using CALPOST Method 8.

Results 4-2
Table 4-1. Visibility Impacts for 2002
Park Max Delta Deciview
4th Highest (99%)
8th Highest (98%)
Nb. Exceed. > 5%
Nb. Exceed. > 10%
Baseline
Boundary Waters 1.315 0.837 0.574 14 1 Voyageurs 2.162 0.690 0.623 9 3 Wind Cave 0.873 0.475 0.305 3 0
Theodore Roosevelt 1.390 0.555 0.215 4 1 Lostwood 0.564 0.388 0.232 2 0 Badlands 0.762 0.671 0.452 7 0
Isle Royale 1.182 0.789 0.629 10 2
Control 1
Boundary Waters 0.685 0.563 0.330 5 0 Voyageurs 1.252 0.541 0.329 4 1 Wind Cave 0.485 0.258 0.101 0 0
Theodore Roosevelt 0.530 0.298 0.092 1 0 Lostwood 0.329 0.171 0.111 0 0 Badlands 0.462 0.342 0.223 0 0
Isle Royale 0.780 0.471 0.377 2 0
Control 2
Boundary Waters 0.716 0.639 0.360 5 0 Voyageurs 1.191 0.586 0.349 5 1 Wind Cave 0.417 0.262 0.095 0 0
Theodore Roosevelt 0.476 0.278 0.099 0 0 Lostwood 0.320 0.155 0.118 0 0 Badlands 0.549 0.315 0.234 1 0
Isle Royale 0.809 0.497 0.367 3 0
Control 3
Boundary Waters 0.647 0.542 0.319 5 0 Voyageurs 1.210 0.534 0.307 4 1 Wind Cave 0.473 0.244 0.093 0 0
Theodore Roosevelt 0.453 0.287 0.087 0 0 Lostwood 0.317 0.150 0.109 0 0 Badlands 0.441 0.326 0.219 0 0
Isle Royale 0.758 0.448 0.363 2 0
Control 4
Boundary Waters 0.687 0.593 0.350 5 0 Voyageurs 1.121 0.574 0.312 4 1 Wind Cave 0.379 0.237 0.080 0 0
Theodore Roosevelt 0.421 0.260 0.084 0 0 Lostwood 0.298 0.138 0.103 0 0 Badlands 0.505 0.281 0.225 1 0
Isle Royale 0.762 0.456 0.351 2 0

Results 4-3
Table 4-1. Visibility Impacts for 2002 (continued).
Park Max Delta Deciview
4th Highest (99%)
8th Highest (98%)
Nb. Exceed. >
5%
Nb. Exceed. >
10%
Control 5
Boundary Waters 0.551 0.449 0.264 2 0 Voyageurs 0.997 0.426 0.263 3 0 Wind Cave 0.385 0.206 0.083 0 0
Theodore Roosevelt 0.458 0.237 0.076 0 0 Lostwood 0.263 0.144 0.089 0 0 Badlands 0.370 0.272 0.169 0 0
Isle Royale 0.618 0.375 0.298 2 0
Control 5a
Boundary Waters 0.513 0.428 0.250 2 0 Voyageurs 0.955 0.419 0.249 3 0 Wind Cave 0.372 0.191 0.074 0 0
Theodore Roosevelt 0.380 0.227 0.069 0 0 Lostwood 0.251 0.124 0.085 0 0 Badlands 0.349 0.256 0.165 0 0
Isle Royale 0.595 0.355 0.285 2 0
Control 5b
Boundary Waters 0.537 0.465 0.274 2 0 Voyageurs 0.876 0.449 0.244 2 0 Wind Cave 0.296 0.184 0.063 0 0
Theodore Roosevelt 0.325 0.204 0.066 0 0 Lostwood 0.234 0.109 0.081 0 0 Badlands 0.396 0.219 0.174 0 0
Isle Royale 0.594 0.357 0.274 2 0
Control 6
Boundary Waters 0.418 0.335 0.200 0 0 Voyageurs 0.740 0.309 0.196 2 0 Wind Cave 0.283 0.154 0.072 0 0
Theodore Roosevelt 0.384 0.176 0.063 0 0 Lostwood 0.196 0.118 0.075 0 0 Badlands 0.278 0.203 0.120 0 0
Isle Royale 0.464 0.275 0.221 0 0
Control 7
Boundary Waters 0.285 0.221 0.137 0 0 Voyageurs 0.481 0.192 0.130 0 0 Wind Cave 0.180 0.104 0.070 0 0
Theodore Roosevelt 0.309 0.115 0.050 0 0 Lostwood 0.129 0.085 0.051 0 0 Badlands 0.187 0.135 0.090 0 0
Isle Royale 0.310 0.174 0.142 0 0
Control 8
Boundary Waters 0.198 0.143 0.097 0 0 Voyageurs 0.309 0.125 0.086 0 0 Wind Cave 0.119 0.072 0.053 0 0
Theodore Roosevelt 0.262 0.074 0.036 0 0 Lostwood 0.085 0.053 0.037 0 0 Badlands 0.127 0.102 0.079 0 0
Isle Royale 0.207 0.113 0.092 0 0

Results 4-4
Table 4-2. Visibility Impacts for 2006.
Park Max Delta Deciview
4th Highest (99%)
8th Highest (98%)
Nb. Exceed. > 5%
Nb. Exceed. > 10%
Baseline
Boundary Waters 2.572 1.183 0.790 16 5 Voyageurs 1.578 0.862 0.574 11 2 Wind Cave 0.454 0.302 0.120 0 0
Theodore Roosevelt 2.232 0.772 0.459 6 3 Lostwood 1.110 0.662 0.385 5 1 Badlands 1.002 0.519 0.481 7 1
Isle Royale 1.806 0.635 0.506 8 2
Control 1
Boundary Waters 1.375 0.799 0.548 9 3 Voyageurs 1.262 0.554 0.399 5 1 Wind Cave 0.273 0.162 0.024 0 0
Theodore Roosevelt 1.234 0.469 0.247 3 1 Lostwood 0.619 0.355 0.168 2 0 Badlands 0.504 0.319 0.176 1 0
Isle Royale 1.010 0.467 0.296 2 1
Control 2
Boundary Waters 1.405 0.830 0.546 11 3 Voyageurs 1.549 0.594 0.494 7 2 Wind Cave 0.266 0.162 0.027 0 0
Theodore Roosevelt 1.116 0.454 0.244 3 1 Lostwood 0.588 0.366 0.171 3 0 Badlands 0.482 0.326 0.199 0 0
Isle Royale 1.014 0.462 0.273 3 1
Control 3
Boundary Waters 1.319 0.780 0.534 8 3 Voyageurs 1.218 0.540 0.391 5 1 Wind Cave 0.260 0.150 0.023 0 0
Theodore Roosevelt 1.196 0.455 0.234 3 1 Lostwood 0.594 0.339 0.153 2 0 Badlands 0.482 0.308 0.172 0 0
Isle Royale 0.983 0.454 0.287 2 0
Control 4
Boundary Waters 1.313 0.793 0.521 10 3 Voyageurs 1.469 0.571 0.464 6 1 Wind Cave 0.244 0.139 0.025 0 0
Theodore Roosevelt 1.052 0.431 0.230 3 1 Lostwood 0.554 0.335 0.144 2 0 Badlands 0.443 0.306 0.191 0 0
Isle Royale 0.966 0.440 0.250 3 0

Results 4-5
Table 4-2. Visibility Impacts for 2006 (continued).
Park Max Delta Deciview
4th Highest (99%)
8th Highest (98%)
Nb. Exceed. >
5%
Nb. Exceed. >
10%
Control 5
Boundary Waters 1.109 0.635 0.433 6 2 Voyageurs 1.013 0.440 0.314 2 1 Wind Cave 0.216 0.132 0.019 0 0
Theodore Roosevelt 0.987 0.372 0.199 2 0 Lostwood 0.494 0.281 0.136 0 0 Badlands 0.401 0.252 0.137 0 0
Isle Royale 0.804 0.366 0.235 2 0
Control 5a
Boundary Waters 1.051 0.615 0.419 6 2 Voyageurs 0.967 0.426 0.306 2 0 Wind Cave 0.204 0.120 0.018 0 0
Theodore Roosevelt 0.948 0.358 0.186 2 0 Lostwood 0.468 0.265 0.124 0 0 Badlands 0.378 0.242 0.133 0 0
Isle Royale 0.777 0.355 0.226 2 0
Control 5b
Boundary Waters 1.036 0.622 0.407 6 2 Voyageurs 1.160 0.449 0.365 3 1 Wind Cave 0.189 0.109 0.019 0 0
Theodore Roosevelt 0.827 0.336 0.180 2 0 Lostwood 0.430 0.259 0.114 0 0 Badlands 0.344 0.237 0.147 0 0
Isle Royale 0.758 0.342 0.195 1 0
Control 6
Boundary Waters 0.837 0.468 0.318 3 0 Voyageurs 0.759 0.325 0.228 2 0 Wind Cave 0.161 0.103 0.016 0 0
Theodore Roosevelt 0.736 0.274 0.150 1 0 Lostwood 0.369 0.209 0.103 0 0 Badlands 0.297 0.186 0.098 0 0
Isle Royale 0.595 0.268 0.174 1 0
Control 7
Boundary Waters 0.560 0.299 0.202 1 0 Voyageurs 0.502 0.204 0.157 1 0 Wind Cave 0.107 0.071 0.014 0 0
Theodore Roosevelt 0.479 0.176 0.101 0 0 Lostwood 0.244 0.138 0.082 0 0 Badlands 0.227 0.120 0.066 0 0
Isle Royale 0.382 0.169 0.115 0 0
Control 8
Boundary Waters 0.373 0.186 0.136 0 0 Voyageurs 0.328 0.128 0.107 0 0 Wind Cave 0.071 0.047 0.012 0 0
Theodore Roosevelt 0.306 0.111 0.070 0 0 Lostwood 0.162 0.092 0.064 0 0 Badlands 0.188 0.079 0.060 0 0
Isle Royale 0.239 0.104 0.077 0 0

Results 4-6
Table 4-3. Visibility Impacts for 2007.
Park Max Delta Deciview
4th Highest (99%)
8th Highest (98%)
Nb. Exceed. > 5%
Nb. Exceed. > 10%
Baseline
Boundary Waters 3.574 1.351 1.079 25 9 Voyageurs 2.062 1.376 0.724 19 5 Wind Cave 1.671 0.591 0.325 4 2
Theodore Roosevelt 0.744 0.491 0.322 3 0 Lostwood 0.959 0.722 0.409 6 0 Badlands 2.202 0.698 0.471 6 2
Isle Royale 1.224 0.745 0.665 13 2
Control 1
Boundary Waters 2.018 0.874 0.657 9 2 Voyageurs 1.260 0.750 0.460 7 2 Wind Cave 0.950 0.334 0.130 3 0
Theodore Roosevelt 0.393 0.211 0.190 0 0 Lostwood 0.547 0.415 0.245 1 0 Badlands 1.292 0.395 0.241 3 1
Isle Royale 0.665 0.436 0.339 2 0
Control 2
Boundary Waters 1.959 0.890 0.667 11 2 Voyageurs 1.232 0.768 0.521 8 2 Wind Cave 1.030 0.355 0.130 2 1
Theodore Roosevelt 0.395 0.228 0.161 0 0 Lostwood 0.558 0.426 0.253 2 0 Badlands 1.369 0.440 0.254 2 1
Isle Royale 0.720 0.439 0.323 2 0
Control 3
Boundary Waters 1.944 0.848 0.620 9 1 Voyageurs 1.225 0.717 0.450 7 1 Wind Cave 0.902 0.317 0.120 2 0
Theodore Roosevelt 0.380 0.204 0.173 0 0 Lostwood 0.520 0.394 0.226 1 0 Badlands 1.234 0.378 0.230 2 1
Isle Royale 0.641 0.418 0.323 2 0
Control 4
Boundary Waters 1.844 0.840 0.611 10 1 Voyageurs 1.171 0.705 0.502 8 1 Wind Cave 0.938 0.323 0.117 2 0
Theodore Roosevelt 0.373 0.197 0.138 0 0 Lostwood 0.509 0.381 0.234 1 0 Badlands 1.261 0.405 0.234 2 1
Isle Royale 0.677 0.406 0.290 2 0

Results 4-7
Table 4-3. Visibility Impacts for 2007 (continued).
Park Max Delta Deciview
4th Highest (99%)
8th Highest (98%)
Nb. Exceed. >
5%
Nb. Exceed. >
10%
Control 5
Boundary Waters 1.630 0.699 0.524 8 1 Voyageurs 0.997 0.602 0.364 4 0 Wind Cave 0.763 0.268 0.106 1 0
Theodore Roosevelt 0.311 0.175 0.156 0 0 Lostwood 0.439 0.328 0.211 0 0 Badlands 1.039 0.315 0.191 2 1
Isle Royale 0.525 0.349 0.272 2 0
Control 5a
Boundary Waters 1.554 0.671 0.493 6 1 Voyageurs 0.961 0.569 0.354 4 0 Wind Cave 0.715 0.251 0.096 1 0
Theodore Roosevelt 0.299 0.160 0.141 0 0 Lostwood 0.412 0.314 0.178 0 0 Badlands 0.979 0.298 0.180 2 0
Isle Royale 0.503 0.331 0.256 1 0
Control 5b
Boundary Waters 1.459 0.667 0.478 6 1 Voyageurs 0.915 0.554 0.393 6 0 Wind Cave 0.735 0.253 0.091 1 0
Theodore Roosevelt 0.291 0.155 0.108 0 0 Lostwood 0.399 0.301 0.182 0 0 Badlands 0.991 0.316 0.182 2 0
Isle Royale 0.527 0.319 0.227 1 0
Control 6
Boundary Waters 1.233 0.520 0.388 4 1 Voyageurs 0.737 0.454 0.267 3 0 Wind Cave 0.575 0.202 0.085 1 0
Theodore Roosevelt 0.230 0.143 0.121 0 0 Lostwood 0.331 0.241 0.157 0 0 Badlands 0.781 0.236 0.143 1 0
Isle Royale 0.388 0.259 0.199 0 0
Control 7
Boundary Waters 0.825 0.339 0.256 2 0 Voyageurs 0.501 0.304 0.176 1 0 Wind Cave 0.389 0.137 0.071 0 0
Theodore Roosevelt 0.149 0.112 0.080 0 0 Lostwood 0.223 0.155 0.101 0 0 Badlands 0.524 0.157 0.099 1 0
Isle Royale 0.268 0.172 0.134 0 0
Control 8
Boundary Waters 0.549 0.217 0.170 1 0 Voyageurs 0.383 0.205 0.123 0 0 Wind Cave 0.265 0.093 0.055 0 0
Theodore Roosevelt 0.102 0.090 0.064 0 0 Lostwood 0.152 0.122 0.063 0 0 Badlands 0.352 0.105 0.070 0 0
Isle Royale 0.189 0.124 0.098 0 0

References 5-1
5. REFERENCES
FLAG, 2000. Federal Land Manager' Air Quality Related Values Workgroup (FLAG). Phase I Report. U.S. Forest Service, National Park Service, U.S. Fish and Wildlife Service.
FLAG, 2008. Federal Land Manager' Air Quality Related Values Workgroup (FLAG). Phase I Report -Revised. U.S. Forest Service, National Park Service, U.S. Fish and Wildlife Service, June 27, 2008, Draft.
Scire, J.S., D.G. Strimaitis, and R.J. Yamartino, 2000a: A User’s Guide for the CALPUFF Dispersion Model (Version 5). Earth Tech, Inc., Concord, MA
Scire, J.S., F.R. Robe, M.E. Fernau, and R.J. Yamartino, 2000b: A User’s Guide for the CALMET Meteorological Model (Version 5). Earth Tech, Inc., Concord, MA.
Tombach, I, 2006: Instructions: A Postprocessor for Recalculating CALPOST Visibility Outputs with the New IMPROVE Algorithm, Version 2, 14 October, 2006.
U.S. EPA, 1998: Interagency Workgroup on Air Quality Modeling (IWAQM), Phase 2 Report: Summary Report and Recommendation for Modeling Long Range Transport and Impacts on Regional Visibility. EPA-454/R-98-019.
U.S. EPA, 2000: Federal Register Notice dated April 21, 2001.
U.S. EPA, 2003: Guidance for Estimating Natural Visibility Conditions Under the Regional Haze Program. EPA-454/B-03-005, September 2003.
U. S. EPA, 2005: Regional Haze Regulations and Guidelines for Best Available Technology (BART) Determinations. Fed. Reg./Vol. 70, No. 128/Wed. July 6, 2005, Rules and Regulations, pp. 39104-39172. 40 CFR Part 51, FRL-7925-9, RIN AJ31.
U.S. EPA, 2009: Clarification on EPA-FLM Recommended Settings for CALMET. EPA Memo by T. Fox dated August 31, 2009.
WRAP Air Quality Modeling Forum RMC, 2006: CALMET/CALPUFF Protocol for the BART Exemption Screening Analysis for Class I Areas in the Western United States, August 15, 2006.

B-1 11/2/2009
APPENDIX B Technical Description of SO2 Controls (B1)

B-2 11/2/2009
B1 Technical Description of SO2 Controls
B1.1 Fuel Switching
Fuel switching can be a viable method of fuel sulfur content reduction in certain situations. The PRB
burned by BSP Unit I is one of the lower sulfur coals available in the U.S. and switching to a lower
sulfur coal (if available) would achieve little to no additional reduction in SO2 emissions. Therefore,
for the purpose of this BART analysis, fuel switching is not considered a viable option for SO2
control.
B1.2 Wet Flue Gas Desulfurization Wet FGD technology utilizing lime or limestone as the reagent and employing forced oxidation to
produce gypsum (calcium sulfate dihydrate, CaSO4·2H2O) as the byproduct, is commonly applied to
coal-fired boilers. The gypsum byproduct is either landfilled or sold for commercial reuse. A flow diagram of the wet FGD process is provided in Figure B-1. In the wet FGD process, a slurry
of finely ground limestone (CaCO3) in water is recirculated through an absorber tower where it is
brought into turbulent contact with the flue gas. The contact between the flue gas and the slurry cools
and saturates the gas via evaporation of water from the slurry. SO2 is simultaneously absorbed into
the slurry where it forms sulfurous acid which reacts with the limestone, forming calcium sulfite
hemihydrate (CaSO3•½H2O) which can then be disposed of as a waste product or oxidized to calcium
sulfate dihydrate or gypsum (CaSO4•2H2O) before disposal or for commercial reuse. No commercial
uses for sulfite waste products have been identified.

B-3 11/2/2009
Figure B-1. Wet FGD Process Flow Diagram
Chemical reactions between the limestone and the absorbed SO2 take place within the slurry in the
absorber, and in the absorber reaction tank, resulting in the formation of particles of CaSO3·½ H2O.
Some of the oxygen in the flue gas may participate in the reaction, resulting in the formation of
particles of CaSO4•2H2O as well. Air may be injected into the absorber sump to promote the
formation of gypsum and minimize the formation of calcium sulfite solids where a gypsum product is
desired, either for ease of disposal or commercial use. The resultant slurry is then processed in a
dewatering system prior to disposal or commercial use.
As the limestone reagent in the recirculating slurry is depleted, it is replenished with fresh slurry
prepared by wet grinding of crushed limestone using reclaimed liquid from the dewatering system.
Fresh water is also required to replace water lost to evaporation in the flue gas cooling process. Fresh
water is often used to wash the mist eliminators, devices located at the scrubber exit to capture slurry
droplets entrained in the exiting flue gas stream and return them to the scrubber. The mist eliminator
wash removes accumulated materials from the mist eliminator chevrons, thus preventing solids
buildup and pluggage. In addition, depending upon the mineral content of the coal, a portion of the
reclaimed liquid from the dewatering process may be blown down, or disposed of, to prevent
excessive accumulation of mineral salts in the slurry which could result in mineral scaling within the
absorber equipment. The blow down rate varies with each plant. Fresh water makeup, both through
the mist eliminator wash system and in the limestone grinding process, replaces the blow down and
evaporative losses.
StackFlue Gas
from Air Heater
ESP
Booster Fan
Recycle Pump
Water
Limestone
To Dewatering System Oxidation Air
Reaction Tank
AbsorberTower
Mist Eliminators

B-4 11/2/2009
Lime scrubbers are very similar to limestone scrubbers. The use of lime rather than limestone can
reduce the liquid-to-gas ratio and/or absorber size required to achieve a given SO2 removal rate.
Lime is sometimes used in wet FGD systems where extremely high SO2 removal rates are desired or
where limestone is not readily available. However, since lime is more expensive than limestone, the
reagent cost is much higher for a lime system. Therefore, the vast majority of wet FGD systems are
designed to use limestone as the neutralizing reagent.
Tow advantages of the wet FGD systems include lower reagent costs, primarily due to the ability to
use limestone instead of lime as a reagent and the production of a salable by-product and high
removal efficiency. Also, wet FGD systems have a high turndown capability and plant operational
flexibility is not hindered to the same degree as the semi-dry processes. This last advantage is
important where wet FGD systems are applied to load following units. Disadvantages of wet FGD
systems include corrosion due to a wet environment with corrosive chemicals including salts of
sulfurous and sulfuric acid and hydrochloric acid. Also, because the wet systems are more
mechanically complex, they typically require larger maintenance staff than the semi-dry, CFB and
FDA alternatives. The greater mechanical complexity also contributes to a greater capital cost for
wet FGD systems. Finally, because wet FGD systems completely saturate the flue gas stream, nearly
all the SO3 or H2SO4 vapor in the entering flue gas is condensed into aerosol droplets which are too
small to be efficiently captured in the scrubber. Fifty percent or more of these droplets pass right
through the scrubber. Where units are burning high sulfur fuels, this can cause a plume opacity
problem. Wet FGD systems commonly achieve 95% percent SO2 removal efficiencies in commercial
applications.
B1.3 Semi-Dry Flue Gas Desulfurization As an alternative to wet FGD technology, the control of SO2 emissions can be accomplished using
semi-dry FGD technology. The most common semi-dry FGD system is the lime Spray Dryer
Absorber (SDA) using a fabric filter for downstream particulate collection. The semi-dry FGD
process became popular in the U.S. beginning in the late 1970s as a way to comply with the New
Source Performance Standards (NSPS) for electric utility steam generating units for which
construction commenced after September 18, 1978 (40 CFR Part 60, Subpart Da). These standards
require that all new coal-fired electric utility boilers be equipped with a “continuous system of
emission reduction” for SO2. However, the standards allowed SO2 removal efficiency as low as 70

B-5 11/2/2009
percent for facilities burning low-sulfur coal. The semi-dry FGD process could meet this
requirement, and was often selected as the SO2 control technology for many new coal-fired power
plants that were built in the 1970s and 1980s and designed to burn low-sulfur western coal. In the
late 1980s and through the 1990s, most of the new coal-fired boilers built in the U.S. were for small
Independent Power Producer (IPP) projects, and many of these also selected the semi-dry/lime FGD
process.
There are several variations of the semi-dry process in use today. This section addresses the spray
dryer FGD process. Two other variations, the Novel Integrated Desulfurization and Circulating
Fluidized Bed absorber are similar processes. They primarily differ by the type of reactor vessel
used, the method in which water and lime are introduced into the reactor and the degree of solids
recycling. They are considered similar technologies and are not discussed further.
A schematic diagram of the spray dryer FGD process is provided in Figure B-2. In the spray dryer
FGD process, boiler flue gas is introduced into a Spray Dryer Absorber (SDA) into which hydrated
lime (calcium hydroxide, Ca(OH)2) and water are added as dispersed droplets. The Ca(OH)2 reacts
with SO2 that has been absorbed into the water to form primarily calcium sulfite and some calcium
sulfate. The heat from the flue gas causes the water to evaporate, cooling the gas and drying the
reaction products. Because the total water feed rate is much lower than that of the wet FGD process,
the reaction products are dried in the SDA and the flue gas is only partially saturated. The amount of
water added to the process is carefully controlled so that the flue gas temperature is maintained well
above the saturation, or dewpoint, temperature (typically 30-40 0F above saturation) to avoid
corrosion problems. Cooling the gas to this point significantly increases the SO2 control efficiency
over injection into hot, dry flue gas. The reaction product leaves the SDA as fine dry particles
entrained in the flue gas. The flue gas enters the SDA at the top and flows downward, co-current with
the introduced neutralizing agent. This characteristic is the opposite of the wet FGD system which
introduces flue gas into the bottom of the absorber, countercurrent to the falling slurry spray.

B-6 11/2/2009
Figure B-2 Spray Dryer FGD Process Flow Diagram
In the lime spray drying process, quicklime (CaO) is slaked with water to form lime slurry which is
then injected into the SDA along with additional water through a rotary atomizer or dual fluid nozzle
or similar apparatus. Recycled PM from the PM control equipment downstream of the SDA is often
mixed with the lime slurry before injection into the SDA to provide additional surface area for SO2
absorption. The flue gas is introduced into the SDA in a manner designed to maximize the contact
between the gas and the droplets and to prevent slurry impingement on the walls of the SDA. The
turbulent mixing of the flue gas and the slurry droplets promotes rapid absorption of SO2 into the
water of the slurry droplets. The chemical reactions between the absorbed SO2 and the calcium
hydroxide take place within the droplet as the flue gas moves through the SDA. The flue gas is
cooled and partially humidified as the water evaporates, leaving a mixture of fly ash and dry
powdered reaction product entrained in the flue gas. Some of the solid particles fall to the bottom of
the reactor and are collected by a waste handling system. Entrained particles are collected in an
electrostatic precipitator (ESP) or fabric filter (FF) downstream of the SDA.
An additional distinguishing characteristic of the SDA is that it must be located upstream of a
particulate control device, as opposed to the wet FGD process which is normally the last flue gas
treatment process before discharge to the stack. For new plants, this point is not of such great
importance. However, when retrofitting FGD equipment to an existing coal-fired plant, which
Flue Gas from Air Heater
Lime SlurryPreparation
Lime
Water
Spray Dryer
To Solids Recycling
Fabric Filter
To Solids Recyclingor Disposal
Stack I.D. Booster Fan
Water or Ash Recycle Slurry

B-7 11/2/2009
already has particulate control equipment installed, this becomes an important point. If a suitable
location exists for the insertion of a new SDA upstream of an existing PM control device, and if the
performance of the existing PM control device would not be overly degraded by the additional PM
loading, then the retrofit process would consist only of installation of the SDA, reagent preparation
and waste handling systems. However, many times one, or both, of these conditions do not exist and
the choice to utilize an SDA requires the installation of a new PM control device, such as an ESP or
fabric filter. Where this situation exists, the capital cost of the SDA option increases significantly.
Semi-dry processes have some notable advantages compared to wet FGD processes including a dry
byproduct which can be handled with conventional ash handling systems. Because the semi-dry
system does not have a truly wet zone, corrosion problems in the SDA are eliminated, or significantly
reduced, to the point exotic materials of construction are not required. Spray dryer systems utilize
less complex equipment resulting in a reduced capital cost and allowing somewhat smaller operations
and maintenance staff. Where a fabric filter is utilized as the downstream particulate control device
for a semi-dry process, the lime content of the filter cake on the fabric filter reacts with condensed
SO3 in the flue gas stream capturing and neutralizing the acid aerosol. Consequently, semi-dry FGD
options, paired with a fabric filter for PM control, have virtually zero emissions of acid aerosols.
The primary disadvantages of the lime spray dryer process make it less likely to be applied to large
power plant boilers, especially those firing high-sulfur coal. The lime spray dryer requires the use of
lime, which is much more expensive than limestone. While lime contains approximately 1.8 times
more calcium than limestone on a mass basis, lime can cost up to five times more than limestone on a
mass basis. Therefore, reagent costs for a lime based process are typically higher than a limestone-
based process for a given application.
Wastes from semi-dry processes have very limited possibility for reuse due to fly ash contamination.
Also, where fly ash might be sold for other uses, contamination with the semi-dry FGD reaction
products typically eliminates commercial options for reuse. Where fly ash sales are to be maintained,
a second PM control device would be required for the semi-dry FGD system exhaust stream,
increasing both capital and O&M costs.
SDAs have much more stringent size limitations than wet FGD scrubbers. Typically units larger than
250 to 300 MW will require at least two SDAs, thus driving up capital costs and system complexity
for larger units, while wet FGD systems can handle up to 1000 MW in a single absorber module.

B-8 11/2/2009
SDAs do not have the same turndown capabilities as wet FGD absorbers, further limiting
applicability for load following units. Finally, lime spray dryer systems do not have the same level of
experience with high SO2 removal requirements in high sulfur applications that wet FGD systems
have.
No variation of semi-dry FGD systems has clearly demonstrated the ability to achieve SO2 removal
levels similar to wet FGD systems in the U.S. Table B-1 lists many of the recent lime spray dryer
system installations in the U.S. The information in Table B-1 was obtained from the
RACT/BACT/LAER Clearing House. As can be seen in the column titled Efficiency, two units were
permitted with an SO2 removal efficiency of 94.5% and one with 95%. However, these units
typically use a lower sulfur fuel and achieve an emissions limit in the range of 0.12 to 0.17 lb
SO2/mmBtu.

B-9 11/2/2009
Table B-1 – Recent Dry FGD Permits From RBLC
RBLC ID Facility Process Fuel Size Unit Control Device
Emission Limit
(lb/mmBtu)
Estimated Efficiency Permit Date
*NE-0018
Whelan Energy Center
Unit 2 Utility Boiler PRB coal 2,210 mmBtu/hr
Spray Dryer Absorber (SDA) 0.12 NA 3/30/2004
AR-0074 Plum Point Energy Boiler , Unit 1 - SN-01 Bituminous Coal 800 MW
Dry Flue Gas Desulfurization 0.16 NA 8/20/2003
MT-0022 Boiler, PC No. 1 Coal 390 MW
Dry Flue Gas Desulfurization (FGD) 0.12 94.5 7/21/2003
MT-0022
Bull Mountain, No. 1, LLC - Roundup
Power Project Boiler, PC No. 2 Coal 390 MW
Dry Flue Gas Desulfurization (FGD) 0.12 94.5 7/21/2003
IA-0067 MidAmerican Energy Company
CBEC 4 Boiler PRB Coal 7,675 mmBtu/hr
Lime Spray Dryer Flue Gas Desulfurization 0.1 92 6/17/2003
KS-0026 Holcomb Unit #2 Boiler, PC Subbituminous Coal 660 MW
Dry Flue Gas Desulfurization 0.12 94 10/08/2002
WY-0057 WYGEN 2
500 MW PC Boiler
Subbituminous Coal 500 MW
Semi-Dry Lime Spray Dryer Absorber 0.1 NA 9/25/2002
MO-0050
Kansas City Power & Light Co. - Hawthorn Station PC Boiler, Coal 384 T/H
Dry Flue Gas Desulfurization 0.12 NA 8/17/1999
WY-0039
Two Elk Generation Partners, Limited Partnership
PC Fired Boiler Coal 250 MW
Lime Spray Dry Scrubber 0.17 91 2/27/1998
WY-0047
Encoal Corporation-Encoal North Rochelle Facility
PC Fired Boiler
Subbituminous Coal 3,960 mmBtu/hr Lime Spray Dryer 0.2 73 10/10/1997
WY-0048
Wygen, Inc. - Wygen Unit One Boiler, PC
Subbituminous Coal 80 MW
Circulating Dry Scrubber 0.2 92 9/6/1996
PA-0133 Mon Valley Energy Limited Partnership
PC Fired Boiler Bituminous Coal 966 mmBtu/hr Spray Dry Absorption 0.25 92 8/8/1995

B-10 11/2/2009
Table B-1 – Recent Dry FGD Permits From RBLC (cont.)
RBLC ID Facility Process Fuel Size Unit Control Device
Emission Limit
(lb/mmBtu)
Estimated Efficiency Permit Date
VA-0213 SEI Birchwood, Inc. PC Fired Boiler Coal 2,200 mmBtu/hr
Lime Spray Drying System (FGD System) 220 94 8/23/1993
WY-0046
Black Hills P&L Neil Simpson U
PC Fired Boiler Coal 80 MW
Circulating Dry Scrubber 0.17 95 4/14/1993
MI-0228 Indelk Energy Services Of Otsego
Boiler (Coal) Coal 778 mmBtu/hr Dry Scrubber 0.32 90 3/16/1993
NC-0057 Roanoke Valley Project Ii
Boiler, PC-Fired Coal 517 mmBtu/hr Dry Lime Scrubbing 0.187 93 12/7/1992
SC-0027
Boiler, PC-Fired Unit No. 1 Coal 385 MW Spray Dryer Absorber 0.25 93 7/15/1992
SC-0027
PC-Fired Boiler, Unit No. 2 Coal 385 MW Spray Dryer Absorber 0.17 93 7/15/1992
SC-0027
South Carolina Electric And Gas
Company PC-Fired Boiler, Unit No. 3 Coal 385 MW Spray Dryer Absorber 0.17 93 7/15/1992
NJ-0015
Keystone Cogeneration Systems, Inc.
PC-Fired Boiler
Coal, Bituminous 2,116 mmBtu/hr Spray Dryer Absorber 0.16 93 9/6/1991
NC-0054 Roanoke Valley Project
Boiler, PC-Fired Coal 1,700 mmBtu/hr Dry Lime FGD 0.213 92 1/24/1991
NJ-0014
Chambers Cogeneration Limited Partnership
2 PC-Fired Boilers Coal 1,389
mmBtu/hr (each) Spray Dryer Absorber 0.22 93 12/26/1990
VA-0176 Hadson Power 13 Boiler Coal 30,228 lb/hr coal Lime Spray Dryer 0.162 92 8/17/1990
VA-0171
Mecklenburg Cogeneration Limited Partnership
PC Fired, Boiler, 4 Units Bituminous Coal 834.5 mmBtu/hr
Spray Dryer, Fabric Filter 0.172 92 5/9/1990

C-1 11/2/2009
APPENDIX C Technical Description of Particulate Matter Controls (C1)

C-2 11/2/2009
Appendix C1 – Technical Description of Particulate Matter Controls C1.0 FABRIC FILTER (FF)
A fabric filter or baghouse removes particulate by passing flue gas through filter bags. A pulse-
jet fabric filter (PJFF) unit (like the current Big Stone PM controls) consists of isolatable
compartments with common inlet and outlet manifolds containing rows of fabric filter bags. The
filter bags are made from a synthetic felted material that are suspended from a tube sheet mounted
at the top of each fabric filter compartment. The tube sheet separates the particulate laden flue
gas from the clean flue gas. This tube sheet is a flat sheet of carbon steel with holes designed to
accommodate filter bags through which the bags are hung. The flue gas passes through the PJFF
by flowing from the outside of the bag to the inside, up the center of the bag through the hole in
the tube sheet and out the PJFF. Fly ash particles are collected on the outside of the bags, and the
cleaned gas stream passes through the fabric filter and on to the chimney. A long narrow wire
cage is located within the bag to prevent collapse of the bag as the flue gas passes through it.
Each filter bag alternates between relatively long periods of filtering and short periods of
cleaning. During the cleaning period, fly ash that has accumulated on the bags is removed by
pulses of air and then falls into a hopper for storage and subsequent disposal.
Cleaning is either initiated at a preset differential pressure across the tubesheet or based on a
maximum time between cleanings. Bags in a PJFF are cleaned by directing a pulse of pressurized
air down the filter bag countercurrent to the flue gas flow to induce a traveling ripple (pulse) in
the filter bag. This pulse travels the length of the bag, deflecting the bag outward and separating
the dust cake as it moves.
An advantage of a fabric filter over an ESP is that a fabric filter is not dependent on the resistivity
of the fly ash. Since the fabric filter uses bags instead of an electric charge to remove the
particles, the resistivity of the particles is not an issue. Fabric filters also have a lower
dependence on particle size than ESPs. A disadvantage of fabric filters is that they have a
tendency to corrode and clog with high sulfur coal applications. The high sulfur coals produce
more SO3, which tends to create problems with the fabric filters. Therefore, ESPs are typically
used on high sulfur coal applications instead of fabric filters. Another disadvantage of fabric
filters is the associated pressure drop. The bags, which collect a cake of particles, create an
obstruction to the gas path. Fabric filters typically have approximately three times the pressure

C-3 11/2/2009
drop of an ESP. Fabric filters have been proven to control PM removal efficiency in excess of
99%.
C1.1 ELECTROSTATIC PRECIPITATOR (ESP)
ESPs are commonly used as the primary filterable PM control device on coal fired units. The
ESP discharge electrodes generate a high voltage electrical field that gives the particulate matter
an electric charge (positive or negative). The charged particles will then be collected on a
collection plate. A rapper or hammer system will be utilized to vibrate the collected particles off
of the plates so they can fall into the hoppers for storage and subsequent disposal.
The advantages of an ESP include the fact that an ESP can be applied to high sulfur coals, and the
pressure drop across an ESP is relatively low compared to other alternatives such as a fabric
filter. Unlike the fabric filter, which uses bags as the filter media, an ESP does not contain
elements that can plug in the presence of SO3. The unobstructed design of the ESP results in a
pressure drop that is approximately 1/3 of a corresponding fabric filter. The disadvantage of the
ESP is that its effectiveness to remove particulate is dependant on the resistivity of the fly ash and
particle size. ESPs have been proven to control PM removal efficiency in excess of 99%.
C1.1 COMPACT HYBRID PARTICULATE COLLECTOR (COHPAC)
A COmpact Hybrid PArticulate Collector (COHPAC) is a high air-to-cloth ratio pulse jet fabric
filter located downstream of an existing ESP. The COHPAC acts as a polishing device for
control of particulate emissions. The difference between a COHPAC and the fabric filter
described above is that a COHPAC is installed after an ESP. The ESP prior to the COHPAC will
remove the majority of the fly ash. This allows the COHPAC to have a higher air-to-cloth ratio
than a typical fabric filter. The air-to-cloth ratio for a COHPAC unit is typically greater than or
equal to 6 ACFM/ft2 while the air-to-cloth ratio for a typical pulse jet fabric filter is
approximately 3.5 to 4.0 ACFM/ft2. Because Big Stone Plant does not have an ESP and already
uses a fabric filter for particulate control, the use of a COHPAC is not considered further.