oto 2000 112 offshore hydrocarbon releases statistics, 2000
TRANSCRIPT
Offshore Hydrocarbon Releases
Statistics, 2000
Date of Issue: December 2000 Health & Safety Executive
OFFSHORE TECHNOLOGY REPORT
OTO 2000 112

This report is made available by the Health and Safety Executive as part of a series of reports of work carried out by HSE Offshore Safety Division. The Executive does not assume any liability for the reports, nor do they necessarly reflect the views or policy of the Executive.
Further copies of this report can be obtained from: HSE, Offshore Safety Division Data Management Team, OSD1.6 Room 201 Merton House Stanley Road BOOTLE L20 3DL Tel: 0151 951 3099 Fax: 0151 951 3098

Offshore Hydrocarbon Releases Statistics, 2000
Prepared by Health & Safety Executive
Page 1
OFFSHORE HYDROCARBON RELEASES
STATISTICS, 2000 (FOR THE PERIOD 1-10-92 TO 31-3-00 INCLUSIVE)
CONTENTS Page EXECUTIVE SUMMARY 2 1.0 INTRODUCTION 4 2.0 DATA CATEGORIES 6 3.0 STATISTICS 7 3.1 Hydrocarbon type 7 3.2 Reporting frequency 8 3.3 Severity analysis 8 3.4 Systems 10 3.5 Equipment 10 3.6 Installation type and location 11 3.7 Ignitions 13 3.8 Detection mode 14 3.9 Emergency actions 15 3.10 Causation 16 4.0 TABLES (See separate section index) 5.0 FIGURES (See separate section index) Appendix 1 - ‘OSD PROCESS INTEGRITY INITIATIVE’ Appendix 2 - ‘SEVERITY CLASSIFICATION’ FEEDBACK QUESTIONNAIRE

Page 2
EXECUTIVE SUMMARY
There were 1801 reported releases in the period between 1 October 1992 to 31
March 2000, of which 7.5% were classified major, 58.5% were classified significant,
and the remaining 34% were classified minor.
The total number of releases reported in 1999/2000 equalled the 1998/99 figure (i.e.
234), the incident “plateau” of the previous 4 years being sustained, and, in fact, the
numbers reported for the past two years are higher than in 1994/95. The monthly
average also remains “plateaued” at 18 to 20 over the five year period.
The overall number of major releases in 1999/2000 decreased from last year’s figure
(down from 15 to 12), but the number of major gas releases in that figure increased
from 8 to 11. The overall number of significant releases decreased from 134 to 127
over the same period, with significant gas releases also dropping from 85 to 79. In
contrast, the overall number of minor releases reported in 1999/2000 increased in
comparison with last year's figure (up from 85 to 95), and minor gas releases also
showed an increase (up from 31 to 45).
There were 118 reported ignitions (6.6% of all releases) over the period
1 October 1992 to 31 March 2000. Although there were no ignited major releases, 38
(32%) of all ignitions involved significant releases (15 gas and 23 liquids).
This report also contains statistics on detection modes, emergency actions, and cau-
sation, but offers no root cause analysis at this stage. However, because incident
numbers have reached a sustained plateau, and the absence of any downward
trend, OSD has launched a 3-part Process Integrity initiative (see Appendix 1) aimed
at raising industry awareness to the problem and identifying their root causes, with a
view to achieving a significant break through the existing plateau. The planned sepa-
rate analysis report, referred to in OTO 1999 0791, has consequently been post-
poned so it can include the conclusions and feedback from inspections and investi-
gations conducted within the initiative. The forthcoming report will also cover trends,
1Offshore Technology Report OTO 1999 079, Offshore Hydrocarbon Releases Statistics, 1999. Avail-able free on request from HSE-OSD on tel :0151-951-3099 or fax: 0151-951-3098.

Page 3
causation complexity, and other significant matters identified from an overall analysis
of the contents of the OSD Hydrocarbon Releases database.
NB Since the addition of a single year’s data has had no significant impact upon the
failure rates for individual systems or items of equipment, it has been agreed with
industry that detailed failure rate tables need only be included in the Offshore Hydro-
carbon Releases Statistics report in alternate years. The failure rate tables will there-
fore next be updated in the 2001 report. For current failure rates, reference should
be made to the tables as they appear in the 1999 report, OTO 1999 0792.
2See footnote 1
Page 4
1. INTRODUCTION
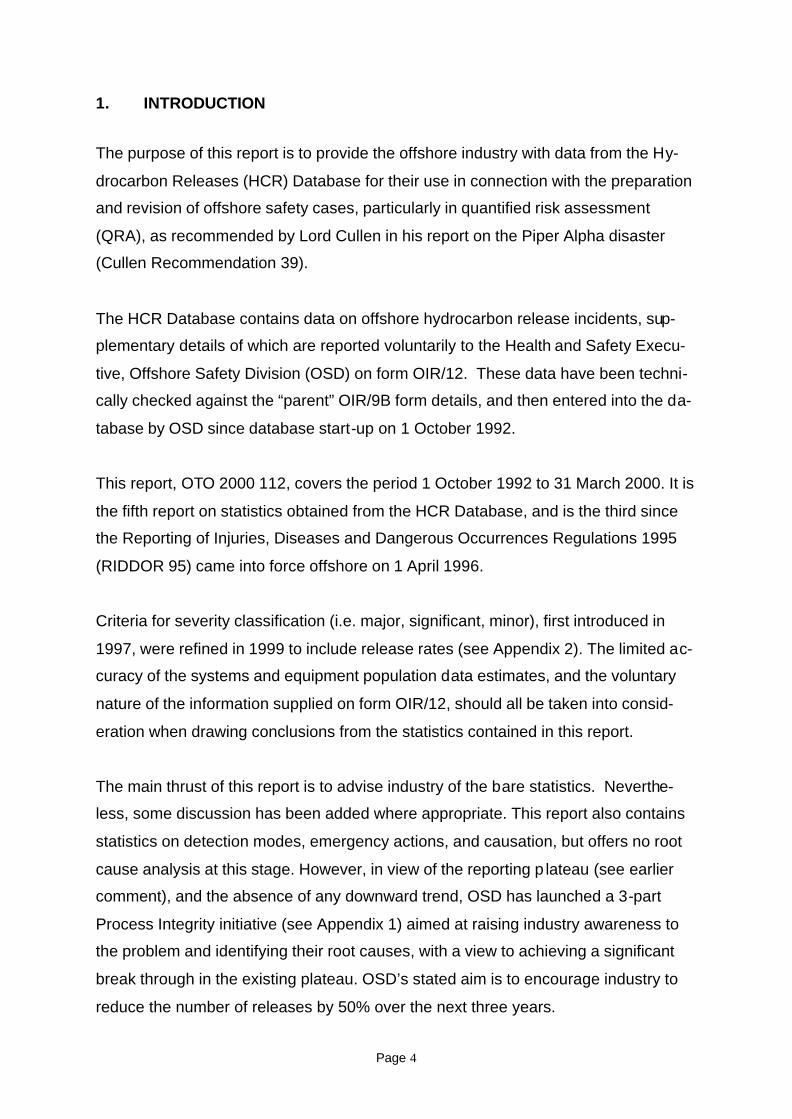
The purpose of this report is to provide the offshore industry with data from the Hy-
drocarbon Releases (HCR) Database for their use in connection with the preparation
and revision of offshore safety cases, particularly in quantified risk assessment
(QRA), as recommended by Lord Cullen in his report on the Piper Alpha disaster
(Cullen Recommendation 39).
The HCR Database contains data on offshore hydrocarbon release incidents, sup-
plementary details of which are reported voluntarily to the Health and Safety Execu-
tive, Offshore Safety Division (OSD) on form OIR/12. These data have been techni-
cally checked against the “parent” OIR/9B form details, and then entered into the da-
tabase by OSD since database start-up on 1 October 1992.
This report, OTO 2000 112, covers the period 1 October 1992 to 31 March 2000. It is
the fifth report on statistics obtained from the HCR Database, and is the third since
the Reporting of Injuries, Diseases and Dangerous Occurrences Regulations 1995
(RIDDOR 95) came into force offshore on 1 April 1996.
Criteria for severity classification (i.e. major, significant, minor), first introduced in
1997, were refined in 1999 to include release rates (see Appendix 2). The limited ac-
curacy of the systems and equipment population data estimates, and the voluntary
nature of the information supplied on form OIR/12, should all be taken into consid-
eration when drawing conclusions from the statistics contained in this report.
The main thrust of this report is to advise industry of the bare statistics. Neverthe-
less, some discussion has been added where appropriate. This report also contains
statistics on detection modes, emergency actions, and causation, but offers no root
cause analysis at this stage. However, in view of the reporting p lateau (see earlier
comment), and the absence of any downward trend, OSD has launched a 3-part
Process Integrity initiative (see Appendix 1) aimed at raising industry awareness to
the problem and identifying their root causes, with a view to achieving a significant
break through in the existing plateau. OSD’s stated aim is to encourage industry to
reduce the number of releases by 50% over the next three years.

Page 5
As stated in the Executive Summary, the planned separate analysis report has con-
sequently been postponed to take advantage of the feedback from the resultant in-
spections and investigations.
As also mentioned in the Executive Summary, the detailed failure rate tables:
(a) System Failure Rates & Severity / Hole Size Distribution; (b) Equipment Failure
Rates & Severity / Hole Size Distribution; and (c) Drilling / Well Operations : Severity
/Hole Size Distribution, are excluded from this report as they are now to be included
in the Offshore Hydrocarbon Releases Statistics report in alternate years. Thus the
tables, and the associated guidance and discussion, will be next updated in the 2001
report. In the meantime, reference should be made to the tables and text as they ap-
pear in the 1999 report (OTO 1999 0793).
Feedback on the contents of this statistics report for 2000 would be appreciated.
This can be provided by completing the single page questionnaire form at the back
of the report and returning it to OSD at the address indicated on the form.
.
3See footnote 1
Page 6
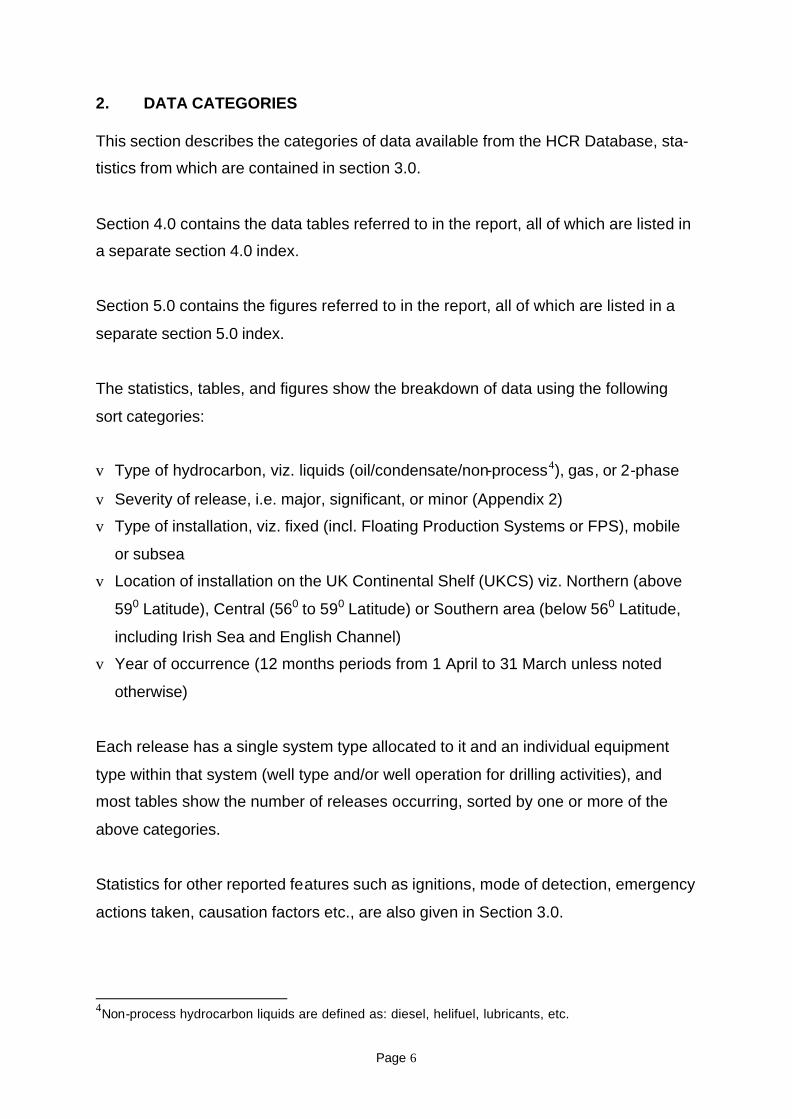
2. DATA CATEGORIES This section describes the categories of data available from the HCR Database, sta-
tistics from which are contained in section 3.0.
Section 4.0 contains the data tables referred to in the report, all of which are listed in
a separate section 4.0 index.
Section 5.0 contains the figures referred to in the report, all of which are listed in a
separate section 5.0 index.
The statistics, tables, and figures show the breakdown of data using the following
sort categories:
v Type of hydrocarbon, viz. liquids (oil/condensate/non-process4), gas, or 2-phase
v Severity of release, i.e. major, significant, or minor (Appendix 2)
v Type of installation, viz. fixed (incl. Floating Production Systems or FPS), mobile
or subsea
v Location of installation on the UK Continental Shelf (UKCS) viz. Northern (above
590 Latitude), Central (560 to 590 Latitude) or Southern area (below 560 Latitude,
including Irish Sea and English Channel)
v Year of occurrence (12 months periods from 1 April to 31 March unless noted
otherwise)
Each release has a single system type allocated to it and an individual equipment
type within that system (well type and/or well operation for drilling activities), and
most tables show the number of releases occurring, sorted by one or more of the
above categories.
Statistics for other reported features such as ignitions, mode of detection, emergency
actions taken, causation factors etc., are also given in Section 3.0.
4Non-process hydrocarbon liquids are defined as: diesel, helifuel, lubricants, etc.

Page 7
3. STATISTICS
A total of 1801 hydrocarbon release incident reports were received, checked and in-
put during the 7½ year period since the start-up of the Hydrocarbon Releases (HCR)
Database on 1 October 1992, up to 31 March 2000 inclusive.
The following subsections comprise detailed discussion of the statistics contained in
the tables and figures in sections 4.0 and 5.0 respectively.
Caution should be exercised when interpreting the statistics, in view of the limited
accuracy of population data, the voluntary nature of the information supplied on form
OIR/12, and the small number of releases involved in some cases.
3.1 Hydrocarbon type
Figure 1, in section 5.0, shows the breakdown of reported releases by hydrocarbon
type. It can be seen from this pie-chart that gas releases constituted, by far, the larg-
est proportion of releases reported, i.e. 1008 out of 1801 (56%). The other types,
ranked in decreasing order, were oil 287 (15.9%), non-process 205 (11.4%),
2-phase 163 (9.1%) and condensate 138 (7.7%).
The higher proportion of gas releases may have arisen from the fact that almost all
offshore installations handle gas, but only 37% of installations handle hydrocarbon
production liquids (see also section 3.7 - “Installations”). Other contributing factors to
the higher incidence of gas releases could be that gas is usually subjected to higher
pressures and temperatures than other forms of hydrocarbon, hence there are
greater challenges associated with gas containment.
Page 8
3.2 Reporting frequency
Figure 2, in section 5.0, shows the monthly reporting frequencies since October 1992
up to the end of March 2000. Major milestones which occurred during the reporting
period are also listed.
Reporting reached a peak of 325 in 1994/95, probably attributable to more detailed
reporting following the issue of the OIR/12 form in August, 1992, and to comprehen-
sive guidance5 in August, 1993. There then followed a substantial drop down to 212
in 1995/96, ostensibly due to the safety case regime and improved safety manage-
ment systems taking effect. Thereafter, the number of incidents seems to have
reached a plateau with the annual totals for the following years to date being 226,
218, 234 and 234, and the monthly reporting rate fluctuating between 18 to 20 in the
same period. In view of the reporting plateau comment, and the absence of any
downward trend, OSD has launched a 3-part Process Integrity initiative (see Appen-
dix 1) aimed at raising industry awareness to the problem and identifying their root
causes, with a view to achieving a significant break through the existing plateau.
3.3 Severity analysis
3.3.1 All releases
All releases have been classified according to agreed revised severity criteria which
now includes release rate (see Appendix 2).
Table 1 in Section 4.0 shows that, of the 1801 reported releases to 31 March 2000,
135 were classified major (7.5% of all leaks), 1058 were significant releases (58.5%)
and the remaining 608 were minor (34%).
Figure 3 in section 5.0 shows the reporting patterns by year for major, significant and
minor releases in both tabular and line graph form. The overall number of major re-
5Revised to encompass RIDDOR 95, OTO 96 956, Revised Guidance on Reporting Offshore Hydro-
carbon Release, is available free on request from HSE-OSD on tel :0151-951-3099 or fax: 0151-951-
3098.

Page 9
leases in 1999/2000 decreased from last year’s figures (down from 15 to 12), but
within that figure the number of major gas releases increased from 8 to 11. The
overall number of significant releases also decreased (from 134 to 127) over the
same period, with significant gas releases also dropping from 85 to 79. In contrast,
the overall number of minor6 releases reported in 1999/2000 increased in compari-
son with last year's figure (up from 85 to 95), and minor gas releases also showed an
increase (up from 31 to 45).
3.3.2 Gas releases
Figure 4 in section 5.0 shows the reporting patterns by year for major, significant and
minor gas releases in both tabular and line graph form.
The upward trend in the annual number of reported gas releases continued in
1999/2000, with a further increase of 9% over the previous year (up from 124 to
135). Major gas releases also showed an upward trend from the low of 6 in 1997/98,
and have now reached 11 in 1999/2000. However, this still falls short of the
1993/94 - 1994/95 high of 16.
3.3.3 Liquid releases
1Figure 5 in section 5.0 shows the reporting patterns by year for major, significant
and minor liquid releases in both tabular and line graph form. It can be seen from these that the annual numbers of reported liquid releases (i.e. oil, condensate and non-process combined) have fluctuated over the years since database start-up, with no discernible trend.
6It is important to note that reports of minor releases only cover those reportable under RIDDOR defi-
nitions which are based on the potential for fire/explosion. It should also be noted that all ignitions are
reported, however minor.

Page 10
3.3.4 2-phase releases
Figure 6 in section 5.0 shows the reporting patterns by year for major, significant and
minor 2-phase releases in both tabular and line graph form. From these, it can be
seen that the numbers of reported 2-phase releases have also fluctuated over the
years since database start-up. As with liquid releases, there is no discernible trend.
3.4 Systems
3.4.1 Systems : highest 15 failure rates
The barchart in figure 7, section 5.0, shows the failure rates in leaks per system year
for the highest ranked 15 release rates out of a total of 52 system types.
The system with the highest failure rate is gas compression with a failure rate of
2.80 x 10⁻¹ leaks per system year. High operating temperatures and pressures, vi-
bration, and the consequent effects of these on vulnerable equipment items such as
seals, instruments, and small bore pipework items etc. are considered to be major
contributors to the frequency of hydrocarbon releases from this system type, and
these factors have been taken into account in the current Process Integrity initiative
(Appendix 1).
Next highest ranking system failure rates were oil export (1.38 x 10⁻¹ leaks per sys-
tem year), and fuel gas (1.29 x 10⁻¹ leaks per system year).
3.5 Equipment
3.5.1 Equipment : highest 15 failure rates
The barchart in figure 8, section 5.0, shows the failure rates in leaks per equipment
year for the highest ranked 15 release rates out of a total of 119 equipment types.
The major equipment items with the highest failure rates are dual fuel turbines at
7.62 x 10⁻² leaks per equipment year, and reciprocating compressors at 5.79 x 10⁻²
leaks per equipment year, both of which indicate strong links with the high gas com-
pression system leak rates shown above.

Page 11
It should be noted that the equipment items having the highest numbers of reported
leaks were instruments (279 total), and pipework items such as valves, flanges and
piping. Their respective population numbers are also very large and thus their re-
spective failure rates in the rankings are reduced. However, the problems (with small
bore tubing in particular) have been recognised and guidlines7 have been produced
for addressing loss of containment, etc..
3.6 Installation type/location versus release type & severity
Table 2 in section 4.0 summarises the breakdown of all reported releases by hydro-
carbon type versus installation type, i.e. Fixed which includes Floating Production
Systems (FPS), Mobile including both drilling and accommodation units, and Sub-
sea. Each installation also has an associated location in either the Northern (above
590 Latitude North), Central (560 to 590 Latitude North), or Southern (below 560 Lati-
tude North, including Irish Sea and English Channel) areas of UKCS. The total cur-
rent population and the estimated number of installation years (as at 31 March 2000)
is also given for each installation type on the UKCS by area.
3.6.1 Installation type
The breakdown by installation type showed that fixed installations were responsible
for 1728 (95.95%) of releases reported. In contrast, only 73 releases (4.05%) were
reported by mobile drilling and accommodation installations. These proportions are
not considered unusual, because there is constant exposure to hydrocarbons on
fixed installations whereas the exposure on mobile installations is intermittent.
7Guidelines for the Management, Design, Installation and Maintenance of Small Bore Tubing Sys-tems. ISBN 0 85293 275 8. Published in 2000 by the Institute of Petroleum.

Page 12
3.6.2 Fixed installation failure rates
Failure rates have been calculated in terms of leaks per installation year, for each
type of installation, by dividing the total number of leaks for that type by the total
number of installation years.
Fixed floating installations (including FPSO and FSU) had the highest overall leak
rate of 2.81 leaks per installation year, with 6.79% major. Fixed attended installations
in the Central North Sea had the next highest leak rate of 2.7 leaks per installation
year, with 5.75% of these being major releases. Northern fixed attended installations
were next, with 2.66 leaks per installation year, with 6% major releases. Southern
fixed attended installations had a leak rate of 0.40 leaks per installation year, with
6.41% major, and Southern normally unattended installations (NUI) leak rate was
0.23 leaks per installation year, with 21.7% major releases.
The production equipment on the larger attended oil production platforms in the
Northern and Central areas is more complex and subject to much greater fluctuation
of operating parameters than on the simpler and smaller gas production platforms in
the Southern area. It is reasonably foreseeable that there may therefore be a greater
propensity for hydrocarbon releases of all types on the larger installations. In view of
the smaller numbers of these installations, it is also expected that failure rates would
be much greater than those in the Southern Sector.
3.6.3 Mobile installation failure rates
Using the population data held in the HCR database, leak rates have been calcu-
lated in terms of leaks per installation year, for each type of mobile installation. How-
ever, in the absence of accurate rig years data, it was necessary to assume that
each unit was present on the UKCS for the entire period since their arrival, and so
these leak rates must be considered very approximate (and tending toward best
case) as a result.
Combining Southern and Central release figures gave an overall leak rate for jack-up
mobile drilling and accommodation units of 0.27 leaks per installation year, with 7.9%
major releases.

Page 13
Northern and Central release figures combined gave an overall leak rate for semi-
submersible mobile drilling and accommodation units of 0.16 leaks per installation
year, with 20% major releases.
3.7 Ignitions
3.7.1 Ignition summary
Table 3, section 4.0, summarises the numbers of ignitions for each year versus the
number of releases for each type of hydrocarbon. It is important to note that the per-
centages shown are ignition rates (i.e. percentage of releases ignited) and NOT igni-
tion probabilities (i.e. the likelihood of a particular release igniting).
There was a grand total of 118 reported ignitions (i.e. 6.6% of all releases) over the
7½ year period, none of which were major.
There were 36 gas ignitions (30.5% of all ignitions), of which 15 were classed as sig-
nificant releases (ignition rate 2.3%), and 21 as minor (ignition rate 8.4%). There
were no major ignited gas releases.
There were 82 liquid ignitions (69% of all ignitions) of which 23 were classed as sig-
nificant releases (ignition rate 8.4%), and 59 as minor (ignition rate 17.3%). There
were no major ignited liquids releases.
There have been no reported 2-phase ignitions to date.
The higher ignition rates in the case of minor releases, and liquids releases in par-
ticular, is considered to be due to the fact that reports of unignited minor releases
cover only those reportable under RIDDOR definitions based on the potential for
fire/explosion, but that ALL ignitions are reportable no matter how minor.
Page 14
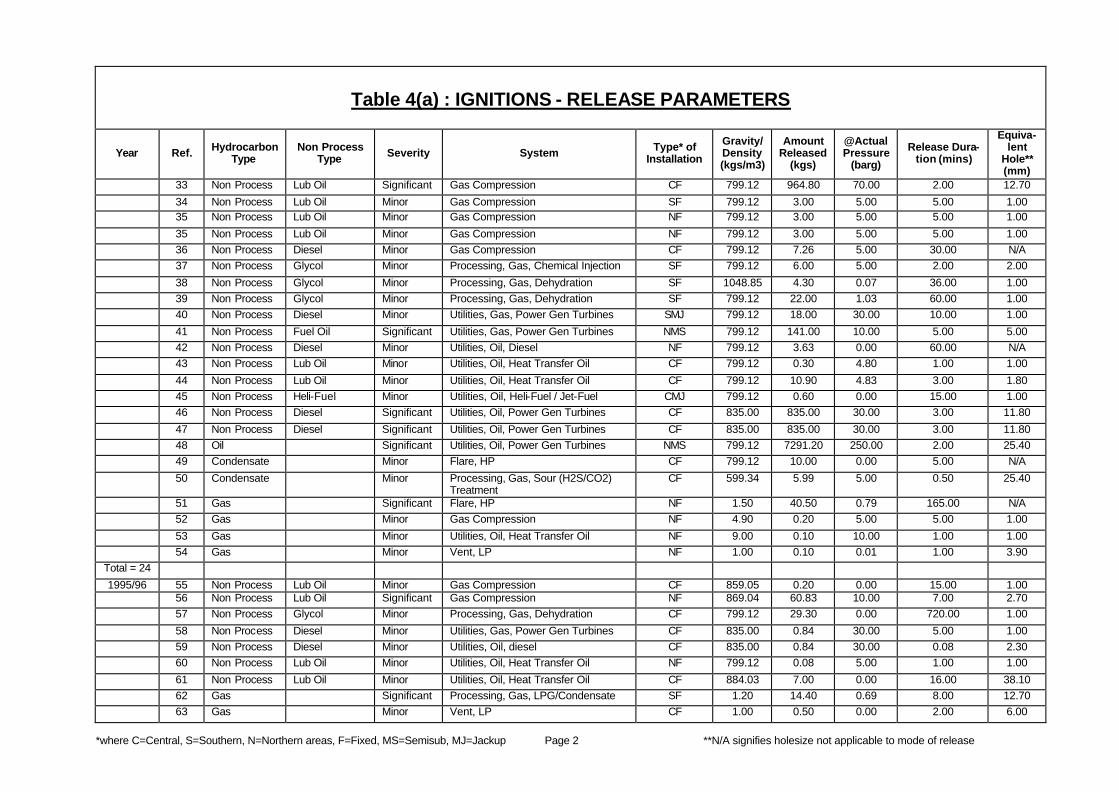
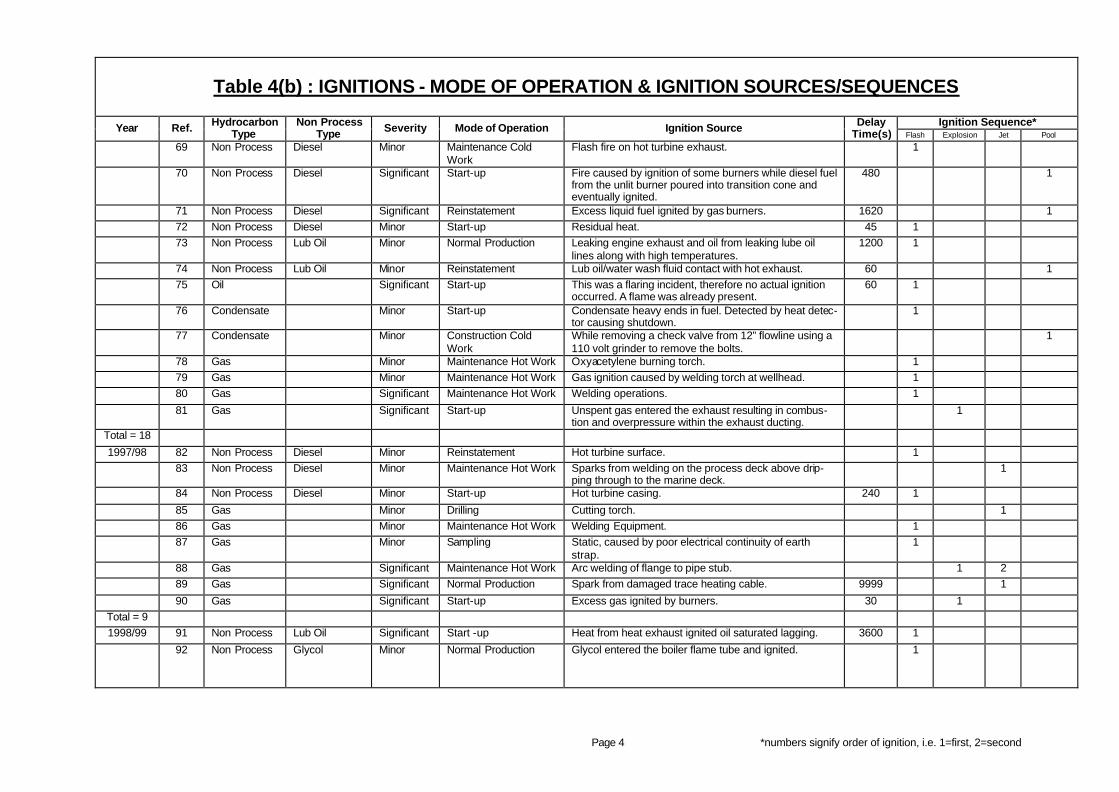
3.7.2 Ignition details
Table 4, section 4.0, comprises three parts which contain full details of every ignition
reported in the 7½ years to 31 March 2000.
The three parts cover the following details :
(a) Release parameters
(b) Mode of operation/ignition sources/ignition sequences, and
(c) Detection mode/emergency actions taken.
Each individual record has a unique number and so it is possible to read all three
parts for one ignition incident to obtain the full picture. The purpose of this report is to
provide statistics only, so any analysis of ignitions has been excluded here.
3.8 Means of detection
3.8.1 Summary
Table 5 in section 4.0, summarises the modes of detection employed during an inci-
dent versus the type of hydrocarbon and severity of release. The modes comprise
heat, smoke, flame, gas and ‘other’. It should be noted that more than one means of
detection may be reported for any one release, and so the totals for each column
may be more than the total number of releases reported.
There were 1925 detection modes connected with the total 1801 reported releases,
more than one mode being effective on some releases. Gas detectors detected 43%
of all releases (60% of gas releases), and the remaining releases were mainly de-
tected by means other than equipment designed for the purpose (see 3.8.2 over
page).

Page 15
3.8.2 Other detection modes
A breakdown of the ‘other’ category which includes detection by visual means, by
sound, by smell etc., is shown in table 6, section 4.0. It is considered important to
have a separate table for these, since they have made a substantial contribution to
the overall detection of offshore releases.
Of the total 1925 modes, 1084 (56%) involved means of detection other than by
dedicated detection systems. Of the 1084 occasions where ‘other’ means of detec-
tion were involved, 835 (77%) were visually detected. Of these, 48 (6% of visual de-
tection) involved major releases, 460 (55% of visual detection) involved significant
releases, and 327 (39%) minor releases.
Specific detection details for all reported ignitions are included in table 4 (c).
3.9 Emergency actions versus release type & severity
Table 7, section 4.0, shows a breakdown of the various types of emergency actions
taken against the types and severity of releases involved. These actions include ei-
ther automatic or manual initiation of shutdown, blowdown, deluge, and/or
CO2/Halon systems, plus whether any musters and/or any other emergency actions
were carried out.
Nearly two-thirds of releases (1184) required shutdown action (359 automatic, 825
manual), of which 98 (8% of shutdowns) were for major releases. Blowdown oper-
ated on 533 (220 auto, 313 manual = 30% of all releases) of which 59 (11% of blow-
downs) were for major releases. There were 493 musters (454 at stations, 39 at life-
boats = 27% of all releases), 56 of which (11% of musters) were for major releases.
In contrast, deluge only operated on 37 releases (2% of all releases), of which 9
(24% of deluge) were for major releases, and only 47 (3% of all releases) involved
the use of CO2/Halon systems, of which only 1 was for a major release.
There was a total of 62 releases (5 major, 36 significant, 21 minor) where no re-
ported emergency actions were taken. This represents 3.7% of all major releases,
3.5% of significant releases, and 3.4% of minor releases. This indicates that, regard-

Page 16
less of severity, 96.5% of all reported releases involved some sort of emergency ac-
tion (albeit only “other emergency action” in some cases).
Specific emergency actions taken for all ignitions reported to 31 March 2000 are in-
cluded in table 4(c).
3.10 Causation & operating mode versus release type & severity
Table 8, section 4.0, summarises the breakdown of all types of release into the four
main causation categories (i.e. design, equipment, operational and/or procedural
faults) plus details of the mode of operation in the area at the time of the incident. It
should be noted that more than one category may be involved in any one incident,
and so caution should be exercised when interpreting the figures shown.
The most frequently reported factor was equipment fault at 1192 (66%). Operational
faults were next with 986 (55%), procedural faults 517 (29%), and design faults 283
(16%).
The proportion of releases occurring during normal production was 48% compared to
that during intervention type activities such as start-up / reinstatement (18%), drilling
/ workover (10%), and maintenance / construction (9.5%). These proportions have
generally been maintained throughout each year since database start-up in October
1992.
The causation factor involved in most incidents was ‘mechanical failure’ which oc-
curred on 816 occasions (45% of all incidents), followed by ‘improper operation’
which occurred on 433 occasions (24%).

4.0 TABLES
CONTENTS (All single page tables unless noted otherwise)
Table 1. Severity analysis
2. Installation type/location versus release type & severity (2 pages incl. notes)
3. Ignitions : summary
4. Ignitions : details (3 tables of 4, 6 and 4 pages, plus 1 page of notes)
5. Means of detection : summary
6. Means of detection : other
7. Emergency actions versus release type & severity
8. Causation & operating mode versus release type & severity

Table 1 : HYDROCARBON TYPE versus SEVERITY OF RELEASE
SEVERITY HYD TYPE
92/93 93/94 94/95 95/96 96/97 97/98 98/99 99/00 TOTAL
LIQUID 1 4 1 2 3 1 2 0 14 GAS 9 16 16 12 14 6 8 11 92
2-PHASE 2 4 3 6 2 6 5 1 29 MAJOR
TOTAL 12 24 20 20 19 13 15 12 135 LIQUID 12 32 53 30 40 40 31 36 274
GAS 34 97 132 86 74 79 85 79 666 2-PHASE 4 22 9 18 15 20 18 12 118
SIGNIFICANT
TOTAL 50 151 194 134 129 139 134 127 1058 LIQUID 9 53 56 34 54 37 53 46 342
GAS 10 40 51 24 20 29 31 45 250 2-PHASE 0 3 4 0 4 0 1 4 16
MINOR
TOTAL 19 96 111 58 78 66 85 95 608 LIQUID 22 89 110 66 97 78 86 82 630
GAS 53 153 199 122 108 114 124 135 1008 2-PHASE 6 29 16 24 21 26 24 17 163
ALL
TOTAL 81 271 325 212 226 218 234 234 1801

Table 2 : INSTALLATION TYPE/LOCATION versus RELEASE TYPE & SEVERITY
NOTES : 1. Data covers the period from 1st October, 1992 to 31st March, 2000. 2. Northern Area (N) = 590 N Latitude and above. Central Area (C) = between 560 N Latitude and 590 N Latitude. Southern Area (S) = 560 N Latitude and below. (incl. Irish Sea and English Channel) 3. COUNT of fixed installation types comprises all installations of that type operating in that area of the UKCS as at 31st March 2000. 4. COUNT of mobile installations comprises known fleet operating in UK waters during 1999/2000. 5. COUNT of subsea installations excludes single well satellite/tie-backs. 6. YEARS = estimated number of installation years (as at 31st March 2000) including those for installations abandoned since 1st October 1992. 7. FPS includes FPSO and FSU. 8. Maj = Major release Sig = Significant release Min = Minor release (Please refer to APPENDIX 2 for definitions of severity) 9. Failure rates may be calculated by dividing Release Type TOTALS by Installation YEARS.

Table 2 : INSTALLATION TYPE/LOCATION versus RELEASE TYPE AND SEVERITY
INSTALLATION RELEASE TYPE 99/00 POPULATION LIQUIDS GAS 2-PHASE TYPE COUNT YEARS Maj Sig Min Maj Sig Min Maj Sig Min
TOTALS
(1) FIXED = 1728 or 95.95 % of TOTAL RELEASES MANNED 28 204 3 65 98 19 210 79 9 53 8 544 NORTHERN
FIXED NUI 3 22.5 0 0 0 0 0 0 0 0 0 0 MANNED 37 226 1 88 141 27 217 84 7 40 4 609 CENTRAL
FIXED NUI 8 58 0 0 1 0 0 0 0 1 0 2 MANNED 68 487 2 28 37 15 86 30 0 0 0 198 SOUTHERN
FIXED NUI 92 454 2 19 5 19 45 10 2 4 0 106 FPS 22 94 2 57 50 9 89 32 7 16 3 265
SUBSEA 19 - 0 0 0 0 2 0 1 0 1 4 TOTAL 277 - 10 257 332 89 649 235 26 114 16 1728
(2) MOBILES = 73 or 4.05 % of TOTAL RELEASES N 3 7 1 0 2 0 1 1 0 15 C 0 5 3 1 5 1 2 3 0 20
SEMI-SUB (incl. 1 Mobile Accomm. Unit) S
31 221 0 0 0 0 0 0 0 0 0 0
N 0 0 0 0 0 0 0 0 0 0 C 1 0 2 2 1 1 0 0 0 7
JACK-UP (0 Mobile Ac-comm. Unit) S
20 138 0 5 4 0 9 13 0 0 0 31
TOTAL 51 - 4 17 10 3 17 15 3 4 0 73 GRAND TOTAL 328 - 14 274 342 92 666 250 29 118 16 1801

Table 3 : IGNITIONS SUMMARY (1)
HYDROCARBON TYPE & SEVERITY LIQUIDS GAS 2-PHASE YEAR DETAILS
Maj Sig Min Maj Sig Min Maj Sig Min TOTAL
0 1 2 0 1 0 0 0 0 4 1 12 9 9 34 10 2 4 0 81
1992/93
(2)
IGNITIONS RELEASES
% (3) 0 8.3 22.2 0 2.9 0 0 0 0 4.9 0 7 10 0 4 5 0 0 0 26 4 32 53 16 97 40 4 22 3 271 1993/94
IGNITIONS RELEASES
% (3) 0 21.9 18.9 0 4.1 12.5 0 0 0 9.6 0 5 15 0 1 3 0 0 0 24 1 53 56 16 132 51 3 9 4 325 1994/95
IGNITIONS RELEASES
% (3) 0 9.4 26.8 0 0.8 5.9 0 0 0 7.4 0 1 6 0 1 1 0 0 0 9 2 30 34 12 86 24 6 18 0 212 1995/96
IGNITIONS RELEASES
% (3) 0 3.3 17.6 0 1.2 4.2 0 0 0 4.2 0 4 10 0 2 2 0 0 0 18 3 40 54 14 74 20 2 15 4 226 1996/97
IGNITIONS RELEASES
% (3) 0 10 18.5 0 2.7 10 0 0 0 8 0 0 3 0 3 3 0 0 0 9 1 40 37 6 79 29 6 20 0 218 1997/98
IGNITIONS RELEASES
% (3) 0 0 8.1 0 3.8 10.3 0 0 0 4.1 0 3 9 0 3 3 0 0 0 18 2 31 53 8 85 31 5 18 1 234 1998/99
IGNITIONS RELEASES
% (3) 0 9.7 17 0 3.5 9.7 0 0 0 7.7 0 2 4 0 0 4 0 0 0 10 0 36 46 11 79 45 1 12 4 234 1999/00
IGNITIONS RELEASES
% (3) 0 5.6 8.7 0 0 8.9 0 0 0 4.3 0 23 59 0 15 21 0 0 0 118
14 274 342 92 666 250 29 118 16 1801 ALL YEARS
IGNITIONS RELEASES
% (3) 0 8.4 17.3 0 2.3 8.4 0 0 0 6.6 Notes: (1) Total numbers in Hydrocarbon releases database for the period 01-10-92 TO 31-03-00 (2) 6 months period from 01-10-92 to 31-03-93 (3) No. of Ignitions ÷ No. of Releases = % Ignited NB: This is NOT an Ignition probability Full details of all Ignitions are given in Tables 4 a, b, and c.

Table 4 : IGNITION DETAILS NOTES : 1. The following table contains detailed information on all of the ignitions which have been reported and recorded in the Hydrocarbon Releases Database between 1 October, 1992 and 31 March, 2000. 2. The table is in three parts : (a) Release parameters (b) Mode of Operation/ignition sources and sequences (c) Detection modes and emergency actions 3. Each ignition has a reference number, and so it is possible to read all the details supplied for any one incident by referring to its unique reference number in each of the three parts.

*where C=Central, S=Southern, N=Northern areas, F=Fixed, MS=Semisub, MJ=Jackup Page 1 **N/A signifies holesize not applicable to mode of release
Table 4(a) : IGNITIONS - RELEASE PARAMETERS
Year Ref. Hydrocarbon Type
Non Process Type Severity System Type* of
Installation Gravity/ Density (kgs/m3)
Amount Released
(kgs) @Actual Pressure
(barg) Release Dura-
tion (mins) Equiva-
lent Hole** (mm)
1992/93 1 Non Process Lub Oil Minor Utilities, Oil, Heat Transfer Oil CF 799.12 6.00 3.72 1.00 3.00 2 Oil Minor Export, Oil CF 799.12 47.90 0.00 5.00 508.00 3 Oil Significant Separation, Oil Test CF 839.08 266.78 4.14 15.00 N/A 4 Gas Significant Utilities, Gas, Fuel Gas CF 9.00 54.00 10.00 30.00 5.00 Total = 4 1993/94 5 Non Process Lub Oil Significant Gas Compression CF 876.04 876.04 3.45 20.00 25.00
6 Non Process Lub Oil Minor Gas Compression CF 799.12 3.00 5.00 5.00 1.00 7 Non Process Lub Oil Minor Gas Compression CF 799.12 0.16 5.00 5.00 1.00 8 Non Process Methanol Significant Manifold, Other, (Condensate,
Methanol, Etc) SMJ 799.12 525.00 0.00 5.00 50.80
9 Non Process Methanol Minor Processing, Gas, Chemical Injection NF 799.12 0.80 0.00 5.00 25.40 10 Non Process Glycol Significant Processing, Gas, Dehydration SF 1123.76 766.20 0.07 300.00 10.00 11 Non Process Glycol Significant Processing, Gas, Dehydration SF 799.12 588.00 1.03 10.00 12.70 12 Non Process Diesel Minor Utilities, Gas, Power Gen Turbines NF 799.12 7.26 0.00 10.00 N/A 13 Non Process Diesel Minor Utilities, Gas, Power Gen Turbines NF 799.12 3.63 0.00 0.50 N/A 14 Non Process Diesel Minor Utilities, Gas, Power Gen Turbines NF 799.12 18.16 0.00 10.00 6.70 15 Non Process Diesel Significant Utilities, Oil, diesel CF 799.12 132.00 0.00 5.00 25.40 16 Non Process Heat Trans Oil Significant Utilities, Oil, Heat Transfer Oil CF 799.12 1044.00 10.34 10.00 9.53 17 Non Process Lub Oil Minor Utilities, Oil, Power Gen Turbines CF 877.03 1.00 3.93 2.00 1.00 18 Oil Significant Separation, Oil Production CF 839.08 666.94 4.14 20.00 N/A 19 Oil Minor Separation, Oil Test CF 799.12 3.63 0.00 1.00 12.70 20 Condensate Minor Flare, HP CF 599.34 10.00 10.00 5.00 76.20 21 Condensate Minor Processing, Gas, LPG/Condensate SF 599.34 27.00 0.00 5.00 12.70 22 Gas Minor Flowlines, Gas CF 74.60 0.60 75.86 1.00 1.00 23 Gas Minor Utilities, Gas, Fuel Gas NF 12.70 0.03 12.41 0.25 1.00 24 Gas Significant Utilities, Gas, Fuel Gas CF 1.60 153.00 1.00 17.00 25.40 25 Gas Significant Utilities, Gas, Fuel Gas SF 1.60 210.00 1.00 10.00 38.10 26 Gas Significant Vent, HP SF 0.78 41.10 0.00 0.25 152.40 27 Gas Minor Vent, HP SF 0.80 0.04 0.00 6.00 1.00 28 Gas Minor Vent, HP SF 0.80 0.06 0.00 8.00 1.00 29 Gas Minor Vent, HP SF 0.80 0.06 0.00 8.00 1.00 30 Gas Significant Vent, LP SF 0.80 210.00 0.00 5.00 76.20 Total = 26 1994/95 31 Non Process Lub Oil Minor Export, Oil NF 799.12 36.00 100.00 10.00 1.00
32 Non Process Lub Oil Minor Export, Oil CF 799.12 3.63 0.00 5.00 N/A
*where C=Central, S=Southern, N=Northern areas, F=Fixed, MS=Semisub, MJ=Jackup Page 2 **N/A signifies holesize not applicable to mode of release
Table 4(a) : IGNITIONS - RELEASE PARAMETERS
Year Ref. Hydrocarbon Type
Non Process Type Severity System Type* of
Installation Gravity/ Density (kgs/m3)
Amount Released
(kgs) @Actual Pressure
(barg) Release Dura-
tion (mins) Equiva-
lent Hole** (mm)
33 Non Process Lub Oil Significant Gas Compression CF 799.12 964.80 70.00 2.00 12.70 34 Non Process Lub Oil Minor Gas Compression SF 799.12 3.00 5.00 5.00 1.00 35 Non Process Lub Oil Minor Gas Compression NF 799.12 3.00 5.00 5.00 1.00 35 Non Process Lub Oil Minor Gas Compression NF 799.12 3.00 5.00 5.00 1.00 36 Non Process Diesel Minor Gas Compression CF 799.12 7.26 5.00 30.00 N/A 37 Non Process Glycol Minor Processing, Gas, Chemical Injection SF 799.12 6.00 5.00 2.00 2.00 38 Non Process Glycol Minor Processing, Gas, Dehydration SF 1048.85 4.30 0.07 36.00 1.00 39 Non Process Glycol Minor Processing, Gas, Dehydration SF 799.12 22.00 1.03 60.00 1.00 40 Non Process Diesel Minor Utilities, Gas, Power Gen Turbines SMJ 799.12 18.00 30.00 10.00 1.00 41 Non Process Fuel Oil Significant Utilities, Gas, Power Gen Turbines NMS 799.12 141.00 10.00 5.00 5.00 42 Non Process Diesel Minor Utilities, Oil, Diesel NF 799.12 3.63 0.00 60.00 N/A 43 Non Process Lub Oil Minor Utilities, Oil, Heat Transfer Oil CF 799.12 0.30 4.80 1.00 1.00 44 Non Process Lub Oil Minor Utilities, Oil, Heat Transfer Oil CF 799.12 10.90 4.83 3.00 1.80 45 Non Process Heli-Fuel Minor Utilities, Oil, Heli-Fuel / Jet-Fuel CMJ 799.12 0.60 0.00 15.00 1.00 46 Non Process Diesel Significant Utilities, Oil, Power Gen Turbines CF 835.00 835.00 30.00 3.00 11.80 47 Non Process Diesel Significant Utilities, Oil, Power Gen Turbines CF 835.00 835.00 30.00 3.00 11.80 48 Oil Significant Utilities, Oil, Power Gen Turbines NMS 799.12 7291.20 250.00 2.00 25.40 49 Condensate Minor Flare, HP CF 799.12 10.00 0.00 5.00 N/A 50 Condensate Minor Processing, Gas, Sour (H2S/CO2)
Treatment CF 599.34 5.99 5.00 0.50 25.40
51 Gas Significant Flare, HP NF 1.50 40.50 0.79 165.00 N/A 52 Gas Minor Gas Compression NF 4.90 0.20 5.00 5.00 1.00 53 Gas Minor Utilities, Oil, Heat Transfer Oil NF 9.00 0.10 10.00 1.00 1.00 54 Gas Minor Vent, LP NF 1.00 0.10 0.01 1.00 3.90 Total = 24 1995/96 55 Non Process Lub Oil Minor Gas Compression CF 859.05 0.20 0.00 15.00 1.00
56 Non Process Lub Oil Significant Gas Compression NF 869.04 60.83 10.00 7.00 2.70 57 Non Process Glycol Minor Processing, Gas, Dehydration CF 799.12 29.30 0.00 720.00 1.00 58 Non Process Diesel Minor Utilities, Gas, Power Gen Turbines CF 835.00 0.84 30.00 5.00 1.00 59 Non Process Diesel Minor Utilities, Oil, diesel CF 835.00 0.84 30.00 0.08 2.30 60 Non Process Lub Oil Minor Utilities, Oil, Heat Transfer Oil NF 799.12 0.08 5.00 1.00 1.00 61 Non Process Lub Oil Minor Utilities, Oil, Heat Transfer Oil CF 884.03 7.00 0.00 16.00 38.10 62 Gas Significant Processing, Gas, LPG/Condensate SF 1.20 14.40 0.69 8.00 12.70 63 Gas Minor Vent, LP CF 1.00 0.50 0.00 2.00 6.00

*where C=Central, S=Southern, N=Northern areas, F=Fixed, MS=Semisub, MJ=Jackup Page 3 **N/A signifies holesize not applicable to mode of release
Table 4(a) : IGNITIONS - RELEASE PARAMETERS
Year Ref. Hydrocarbon Type
Non Process Type Severity System Type* of
Installation Gravity/ Density (kgs/m3)
Amount Released
(kgs) @Actual Pressure
(barg) Release Dura-
tion (mins) Equiva-
lent Hole** (mm)
Total = 9 1996/97 64 Non Process Lub Oil Minor Export, Oil CF 799.12 0.40 17.24 7.00 1.00
65 Non Process Lub Oil Significant Utilities, Gas, Power Gen Turbines CF 799.12 79.91 2.40 5.00 5.40 66 Non Process Diesel Minor Utilities, Gas, Power Gen Turbines CF 799.12 1.60 9.00 1.30 1.00 67 Non Process Diesel Minor Utilities, Oil, Diesel SMJ 849.07 0.85 2.00 180.00 1.00 68 Non Process Diesel Minor Utilities, Oil, Diesel NF 849.07 0.85 2.07 2.00 1.00 69 Non Process Diesel Minor Utilities, Oil, Diesel NF 799.12 0.80 0.00 2.00 12.70 70 Non Process Diesel Significant Utilities, Oil, Diesel NF 799.12 150.00 103.45 8.00 12.70 71 Non Process Diesel Significant Utilities, Oil, Diesel NF 799.12 70.00 103.45 32.00 12.70 72 Non Process Diesel Minor Utilities, Oil, Diesel CF 799.12 0.40 23.00 1.00 1.00 72 Non Process Diesel Minor Utilities, Oil, Diesel CF 799.12 0.40 23.00 1.00 1.00 73 Non Process Lub Oil Minor Utilities, Oil, Diesel CF 799.12 0.80 0.00 20.00 1.00 74 Non Process Lub Oil Minor Gas Compression NF 799.12 15.98 1.75 1.00 N/A 75 Oil Significant Flare, HP CF 799.12 127.04 0.17 3.00 N/A 76 Condensate Minor Gas Compression SF 599.34 2.72 0.00 0.50 N/A 77 Condensate Minor Import, Gas SF 699.23 0.70 0.00 1.00 1.00 78 Gas Minor Drains, Closed CF 0.70 0.07 0.00 2.00 N/A 79 Gas Minor Drilling, Development, Gas Well,
<100 Metres SF 0.80 0.80 0.00 1.00 9.10
80 Gas Significant Processing, Gas, Sour (H2S/CO2) Treatment
CF 0.80 2.00 0.00 1.00 203.20
81 Gas Significant Utilities, Gas, Power Gen Turbines NF 9.00 5.00 10.00 2.00 N/A Total = 18 1997/98 82 Non Process Diesel Minor Utilites, Oil, Diesel CF 799.12 0.80 50.00 2.00 1.00
83 Non Process Diesel Minor Utilites, Oil, Diesel CF 799.12 10.00 16.70 3.00 84 Non Process Diesel Minor Utilites, Oil, Diesel CF 799.12 5.00 68.97 5.00 1.00 85 Gas Minor Drilling, Development, Gas Well,
<100 Metres SF 68.25 0.15 82.89 0.25 1.00
86 Gas Minor Export, Oil CF 0.80 0.90 0.00 0.50 25.40 87 Gas Minor Import, Oil NF 0.85 0.10 0.00 0.10 25.00 88 Gas Significant Metering, Oil NF 0.70 6.00 0.00 5.00 12.70 89 Gas Significant Processing, Gas, LPG/Condensate NF 52.20 121.90 49.00 300.00 1.00 90 Gas Significant Utilities, Gas, Fuel Gas NF 9.00 25.50 10.00 0.50 25.40 Total = 9 1998/99 91 Non Process Lub Oil Significant Gas Compression NF 869.04 465.00 100.00 5.00 5.00

*where C=Central, S=Southern, N=Northern areas, F=Fixed, MS=Semisub, MJ=Jackup Page 4 **N/A signifies holesize not applicable to mode of release
Table 4(a) : IGNITIONS - RELEASE PARAMETERS
Year Ref. Hydrocarbon Type
Non Process Type Severity System Type* of
Installation Gravity/ Density (kgs/m3)
Amount Released
(kgs) @Actual Pressure
(barg) Release Dura-
tion (mins) Equiva-
lent Hole** (mm)
92 Non Process Glycol Minor Processing, Gas, Dehydration SF 799.12 1.20 10.34 1.00 1.00 93 Non Process Lub Oil Minor Utilities, Gas, Power Gen Turbines NF 799.12 7.10 1.75 15.00 1.00 94 Non Process Lub Oil Minor Utilities, Gas, Power Gen Turbines NF 799.12 2.40 1.75 5.00 1.00 95 Non Process Lub Oil Significant Utilities, Gas, Power Gen Turbines CF 799.12 180.00 1.75 15.00 5.00 96 Non Process Hydraulic Oil Significant Utilities, Gas, Power Gen Turbines CF 799.12 163.82 81.00 5.00 3.20 97 Non Process Lub Oil Minor Utilities, Gas, Power Gen Turbines CF 799.12 9.00 3.00 15.00 1.00 98 Non Process Diesel Minor Utilities, Oil, Diesel CF 799.12 0.05 5.00 0.08 1.00 99 Non Process Diesel Minor Utilities, Oil, Diesel CF 799.12 0.80 82.80 3.00 1.00 100 Non Process Diesel Minor Utilities, Oil, Diesel CF 799.12 0.00 9.00 5.00 1.00 101 Oil Minor Processing, Gas, Dehydration NF 799.12 5.00 0.00 1.00 N/A 102 Condensate Minor Processing, Gas, Dehydration CF 599.34 0.20 0.00 5.00 N/A 103 Gas Minor Drains, Closed NF 0.80 0.90 0.00 0.50 457.20 104 Gas Significant Export, Oil CF 0.68 1.00 0.00 0.50 N/A 105 Gas Minor Separation, Oil Test CF 0.80 0.10 0.00 0.50 N/A 106 Gas Significant Utilities, Gas, Power Gen Turbines CF 9.00 5.00 10.00 2.00 N/A 107 Gas Significant Vent, HP NF 0.75 0.03 0.00 5.00 1.00 108 Gas Minor Vent, LP NF 0.80 0.10 0.00 13.80 1.00 Total = 18 1999/00 109 Non Process Diesel Minor Utilities, Gas, Power Gen Turbines NF 799.12 1.00 5.00 4.00 N/A
110 Non Process Diesel Minor Utilities, Oil, Diesel CF 799.12 11.99 124.00 4.50 1.40 111 Non Process Diesel Minor Utilities, Oil, Diesel NF 799.12 1.60 3.45 10.00 1.00 112 Non Process Diesel Minor Utilities, Oil, Diesel CF 799.12 31.96 124.00 4.00 1.40 113 Non Process Lub Oil Significant Utilities, Oil, Power Gen Turbines NF 849.07 85.00 10.00 20.00 1.90 114 Condensate Significant Flare, LP CF 471.00 100.00 8.50 2.00 N/A 115 Gas Minor Export, Oil CF 0.80 0.80 0.00 1.00 9.10 116 Gas Minor Manifold, Oil CF 1.20 0.09 0.14 10.00 1.00 117 Gas Minor Utilities, Gas, Fuel Gas NF 3.20 0.01 2.62 0.06 N/A 118 Gas Minor Utilities, Gas, Power Gen Turbines SF 2.90 0.00 2.76 0.50 3.50 Total = 10

Page 1 *numbers signify order of ignition, i.e. 1=first, 2=second
Table 4(b) : IGNITIONS - MODE OF OPERATION & IGNITION SOURCES/SEQUENCES
Ignition Sequence* Year Ref. Hydrocarbon
Type Non Process
Type Severity Mode of Operation Ignition Source Delay Time(s) Flash Explosion Jet Pool
1992/93 1 Non Process Lub Oil Minor Testing Imping on Hot Exhaust Manifold. 30 1 2 Oil Minor Construction Hot Work Sparks from welding operation ignited hydrocarbons. 1 3 Oil Significant Start-up The HP flare, which was lit at the time of oil carryover. 1 4 Gas Significant Shutting down Following shutdown to platform gas turbine driven gen-
erator, caused by loss of fuel gas pressure, fire started inside turbines inlet air plenum.
1
Total = 4 1993/94 5 Non Process Lub Oil Significant Testing Hot surface on the turbine exhaust pipework. 1
6 Non Process Lub Oil Minor Normal Production Hot surface of power turbine exhaust cowling. 60 1 7 Non Process Lub Oil Minor Start-up On restart, after shutdown, natural temperature rise
flashed off pool of oil. 30 1
8 Non Process Methanol Significant Drilling Fluid ran down to a beam where a welder was working, welders sparks ignited release. 1
9 Non Process Methanol Minor Maintenance Hot Work Hot w elding spelter falling from above. Hot work had been suspended, as was reinstated after drain down. At this point spillage occurred and was ignited.
1
10 Non Process Glycol Significant Normal Production Reboiler flame itself. The reboiler tube fails allowing glycol into contact with the heat source, ie the flame. 1 2
11 Non Process Glycol Significant Normal Production Glocol entered fire tube. 1 12 Non Process Diesel Minor Reinstatement Diesel in turbine exhaust space ignited by hot gases of
combustion. 1
13 Non Process Diesel Minor Reinstatement Ignited by burning gas / exhaust gases. 1 14 Non Process Diesel Minor Reinstatement Hot exhaust gases and hot surface caused ignition of
diesel fuel in duct. 1
15 Non Process Diesel Significant Maintenance Cold Work
Hot surface of diesel engine exhaust diffuser. 4800 1
16 Non Process Heat Trans Oil Significant Testing Oil reached ignition temperature upon contact with a hot, unlagged flange. 1
17 Non Process Lub Oil Minor Maintenance Cold Work
Vaporised oil ignited from hot turbine exhaust. 180 1
18 Oil Significant Start-up Ignition source was flare system, which was lit at the time of the carryover 1
19 Oil Minor Maintenance Cold Work
Possibly static electric ity from container and/or from operators clothing.
1
20 Condensate Minor Start-up Gas condensate spilled onto flare tip platform and ig-nited. 1
21 Condensate Minor Construction Hot Work Welder cutting into redundant pipework. 1 22 Gas Minor Maintenance Hot Work Welders spark from hot work site adjacent to (and
above) the leak. This produced a “gas ring” type of flame, - steady blue circular flame, two or three inches high.
1

Page 2 *numbers signify order of ignition, i.e. 1=first, 2=second
Table 4(b) : IGNITIONS - MODE OF OPERATION & IGNITION SOURCES/SEQUENCES
Ignition Sequence* Year Ref. Hydrocarbon
Type Non Process
Type Severity Mode of Operation Ignition Source Delay Time(s) Flash Explosion Jet Pool
23 Gas Minor Inspection Spark from a 24 volt lead going to earth. 1 24 Gas Significant Start-up Hot gases ignited in exhaust stack. 1 25 Gas Significant Shut Down Hot exhaust stack. 1 26 Gas Significant Construction Hot Work Local welding activity. 1 27 Gas Minor Normal Production Snow squall - lightning. 1 28 Gas Minor Normal Production Snow/sleet squall - lighntning. 1 29 Gas Minor Normal Production Sleet squall - lightning. 1 30 Gas Significant Normal Production Lightning strike. 1 Total = 26 1994/95 31 Non Process Lub Oil Minor Reinstatement Damaged seal ring blocked circulation of seal oil, caus-
ing localised heating. 1
32 Non Process Lub Oil Minor Construction Hot Work Stray welding spark from work ongoing. 1 33 Non Process Lub Oil Significant Normal Production Hot surfaces of running machinery within turbine enclo-
sure. (Particularly exhaust system) 1
34 Non Process Lub Oil Minor Normal Production Hot exhaust duct. 1 35 Non Process Lub Oil Minor Start-up Lub oil mist ignited on hot surface. (Turbine output shaft) 1 36 Non Process Diesel Minor Reinstatement Exhaust gases. 2 1 37 Non Process Glycol Minor Construction Hot Work Welding work in progress. 1 38 Non Process Glycol Minor Start-up Mechanical tube failure led to glycol ignition inside fire
tube. Ignited glycol burnt the flame arrestor which al-lowed burning glycol to exit the reboiler and drop to the deck with a resultant pool fire.
1
39 Non Process Glycol Minor Normal Production Flame was pres ent in addition to normal burner flame in central fire tube of regenerator. 1
40 Non Process Diesel Minor Normal Production Hot surface. 1 41 Non Process Fuel Oil Significant Normal Production Burst line on no.1 engine spraying fuel onto no.4 engine
exhaust manifold 1 2
42 Non Process Diesel Minor Reinstatement Excess diesel ignited in the transition duct (wet start on a hot engine) causing explosion and flame migration into engine compartment due to diesel drain in duct being partially blocked.
2 1
43 Non Process Lub Oil Minor Testing Turbocharger hot surface.
1
44 Non Process Lub Oil Minor Normal Production Hot surface of pump body had apparently ignited con-taminants within the perfecto fluid.
60 1
45 Non Process Heli-Fuel Minor Maintenance Cold Work
Heli-fuel made contact with engine exhausts. 1
46 Non Process Diesel Significant Normal Production Hot surface of gas turbine. 1

Page 3 *numbers signify order of ignition, i.e. 1=first, 2=second
Table 4(b) : IGNITIONS - MODE OF OPERATION & IGNITION SOURCES/SEQUENCES
Ignition Sequence* Year Ref. Hydrocarbon
Type Non Process
Type Severity Mode of Operation Ignition Source Delay Time(s) Flash Explosion Jet Pool
47 Non Process Diesel Significant Normal Production Hot surface of machine. 1 48 Oil Significant Drilling Fuel pipe fractured on no.1 diesel, spraying fuel onto
no.4 engine. No.4 engine exhaust manifold caused fuel to ignite.
1
49 Condensate Minor Construction Cold Work
Flare tip ignited condensate/vapour causing internal explosions within the flare system. A series of explo-sions resulted. (Approx. 12 in number)
1
50 Condensate Minor Sampling Condensate ignited due to electrostatic source. (Unsat-isfactory earthing bond)
1
51 Gas Significant Normal Production A series of explosions caused by ignition of low volume, low pressure, gas combined with air and inert gases from adjacent system. Flare itself was source of ignition.
1 2
52 Gas Minor Start-up Internal combustion of extraneous material/gas in ex-haust duc ting. 1
53 Gas Minor Construction Hot Work Sparks from welding of pipe supports above. 1 54 Gas Minor Maintenance Hot Work Wind blown sparks from ‘burning’ hot work approx. 10ft
from ignition. 1
Total = 24 1995/96 55 Non Process Lub Oil Minor Normal Production The heat from exhaust was sufficient to cause a small
flash fire when the lagging was disturbed during damp-ing down /removal.
1
56 Non Process Lub Oil Significant Normal Production Hot surface of exhaust ducting or power turbine. 30 1 2 57 Non Process Glycol Minor Normal Production Not known - surface temp of still column, 180 oC. 715 1 58 Non Process Diesel Minor Reinstatement Hot surface of machine. 1 59 Non Process Diesel Minor Reinstatement Hot surface of machine. 1 60 Non Process Lub Oil Minor Reinstatement Turbine exhaust collector. 1 61 Non Process Lub Oil Minor Testing Suspect heat from engine turbocharger. 1 62 Gas Significant Construction Hot Work Flame from burning torch. (Oxyacetylene) 1 63 Gas Minor Construction Hot Work Sparks from welding operations. 1 Total = 9
1996/97 64 Non Process Lub Oil Minor Reinstatement Heat generated between the rotating stationery me-chanical seal faces was the source of ignition.
1
65 Non Process Lub Oil Significant Shutting Down Hot metal surface of turbine casing. 300 1 66 Non Process Diesel Minor Testing Thought to be hot surface of burner inlet pipework. 1 67 Non Process Diesel Minor Normal Production Exhaust of number one main engine. 1 68 Non Process Diesel Minor Normal Production High temperature on top of caterpillar engine. 60 1
Page 4 *numbers signify order of ignition, i.e. 1=first, 2=second
Table 4(b) : IGNITIONS - MODE OF OPERATION & IGNITION SOURCES/SEQUENCES
Ignition Sequence* Year Ref. Hydrocarbon
Type Non Process
Type Severity Mode of Operation Ignition Source Delay Time(s) Flash Explosion Jet Pool
69 Non Process Diesel Minor Maintenance Cold Work
Flash fire on hot turbine exhaust. 1
70 Non Process Diesel Significant Start-up Fire caused by ignition of some burners while diesel fuel from the unlit burner poured into transition cone and eventually ignited.
480 1
71 Non Process Diesel Significant Reinstatement Excess liquid fuel ignited by gas burners. 1620 1 72 Non Process Diesel Minor Start-up Residual heat. 45 1 73 Non Process Lub Oil Minor Normal Production Leaking engine exhaust and oil from leaking lube oil
lines along with high temperatures. 1200 1
74 Non Process Lub Oil Minor Reinstatement Lub oil/water wash fluid contact with hot exhaust. 60 1 75 Oil Significant Start-up This was a flaring incident, therefore no actual ignition
occurred. A flame was already present. 60 1
76 Condensate Minor Start-up Condensate heavy ends in fuel. Detected by heat detec-tor causing shutdown. 1
77 Condensate Minor Construction Cold Work
While removing a check valve from 12” flowline using a 110 volt grinder to remove the bolts.
1
78 Gas Minor Maintenance Hot Work Oxyacetylene burning torch. 1 79 Gas Minor Maintenance Hot Work Gas ignition caused by welding torch at wellhead. 1 80 Gas Significant Maintenance Hot Work Welding operations. 1 81 Gas Significant Start-up Unspent gas entered the exhaust resulting in combus-
tion and overpressure within the exhaust ducting. 1
Total = 18 1997/98 82 Non Process Diesel Minor Reinstatement Hot turbine surface. 1
83 Non Process Diesel Minor Maintenance Hot Work Sparks from welding on the process deck above drip-ping through to the marine deck. 1
84 Non Process Diesel Minor Start-up Hot turbine casing. 240 1 85 Gas Minor Drilling Cutting torch. 1 86 Gas Minor Maintenance Hot Work Welding Equipment. 1 87 Gas Minor Sampling Static, caused by poor electrical continuity of earth
strap. 1
88 Gas Significant Maintenance Hot Work Arc welding of flange to pipe stub. 1 2 89 Gas Significant Normal Production Spark from damaged trace heating cable. 9999 1 90 Gas Significant Start-up Excess gas ignited by burners. 30 1 Total = 9 1998/99 91 Non Process Lub Oil Significant Start -up Heat from heat exhaust ignited oil saturated lagging. 3600 1
92 Non Process Glycol Minor Normal Production Glycol entered the boiler flame tube and ignited. 1

Page 5 *numbers signify order of ignition, i.e. 1=first, 2=second
Table 4(b) : IGNITIONS - MODE OF OPERATION & IGNITION SOURCES/SEQUENCES
Ignition Sequence* Year Ref. Hydrocarbon
Type Non Process
Type Severity Mode of Operation Ignition Source Delay Time(s) Flash Explosion Jet Pool
93 Non Process Lub Oil Minor Maintenance Cold Work
Turbine exhaust (two UV flame detectors activated and CO2 manually discharged). Turbine had been shutdown for approx 15 minutes prior to alarm.
1
94 Non Process Lub Oil Minor Shut Down Turbine exhaust - single UV flame detection (alarm on central control room fire and gas panel). CO2 operated manually by production operator. It is believed that a small fire was caused by oil coming in contact with the hot exhaust.
15 1
95 Non Process Lub Oil Significant Normal Production Hot surface. 15 1 96 Non Process Hydraulic Oil Significant Normal Production Not Known. 60 1 97 Non Process Lub Oil Minor Shutting Down Lub oil ignited by the hot surf ace of the power turbine
casing. 1
98 Non Process Diesel Minor Reinstatement Hot surface of burner inlet pipework. 1 99 Non Process Diesel Minor Start-up Hot surface of turbine fuel pipework at gas generator,
within turbine enclosure. 1
100 Non Process Diesel Minor Normal Production Hot surface of burner. Quantity so small no automatic detection picked up. Area operator noticed small amount of smoke from turbine vent.
1
101 Oil Minor Cleaning Filter basket had been removed from pipeline hydrocar-bon present. The basket was removed, and a blue flash was apparent when it was flushed with water. It is thought that the hose was not anti-static and was source of ignition.
1
102 Condensate Minor Maintenance Hot Work There was no hy drocarbon release. Affected system was completely isolated from hydrocarbon sources and had been isolated, purged, flushed, a small residue was contained in a section of pipe being cut up for removal. Ignited by sparks/heat from a grinder.
1
103 Gas Minor Maintenance Cold Work
Presumed to be static. Not proven. Other ignition sources considered. Residual current in the pump motor and the cathodic protection.
1
104 Gas Significant Start-up Hot surfaces in turbine. 1 105 Gas Minor Construction Hot Work Air operated grinder. 1 106 Gas Significant Construction Cold
Work Flames were seen at turbine exhaust - unburnt gas reached exhaust due to delay in ignition sequence soft-ware.
1
107 Gas Significant Normal Production Lightning 1 108 Gas Minor Normal Production Lightning during snow squalls. 1 Total = 18 1999/00 109 Non Process Diesel Minor Reinstatement Exhaust temperature. (ie hot exhaust) 480 1

Page 6 *numbers signify order of ignition, i.e. 1=first, 2=second
Table 4(b) : IGNITIONS - MODE OF OPERATION & IGNITION SOURCES/SEQUENCES
Ignition Sequence* Year Ref. Hydrocarbon
Type Non Process
Type Severity Mode of Operation Ignition Source Delay Time(s) Flash Explosion Jet Pool
110 Non Process Diesel Minor Normal Production Suspect hot turbine casing surface. No flame was seen during this incident. On the basis that 2xIR detectors had activated it is believed that a flash fire had occurred, investigations are ongoing.
1
111 Non Process Diesel Minor Reinstatement Smoke caused by diesel supply fitting to one of the combustion cans leaking onto hot surfaces.
1
112 Non Process Diesel Minor Reinstatement On removal of the heat shield an area of black carbon could be seen around the lower half of the turbine cas-ing this indicated that ignition did occur. Suspect hot turbine casing surface as ignition source.
120 1
113 Non Process Lub Oil Significant Shut Down Hot surfaces within the enclosure. 1 114 Condensate Significant Normal Production Platform flare tip. 1 115 Gas Minor Construction Hot Work Welders arc. 1 116 Gas Minor Maintenance Hot Work Burning torch from adjacent red hot work. 1 117 Gas Minor Maintenance Hot Work Welding operation. (Being undertaken) 1 118 Gas Minor Normal Production Very small ignition on backfire, resulting in flame path. 1 Total = 10

Page 1
Table 4(c) : IGNITIONS - DETECTION MODES & EMERGENCY ACTIONS
Year Ref. Hydrocarbon Type
Non Process Type
Severity Mode of Detection Emergency Actions Taken
1992/93 1 Non Process Lub Oil Minor Visual Manual Shutdown, Manual CO2/Halon 2 Oil Minor Visual Other Action 3 Oil Significant Visual Manual Shutdown 4 Gas Significant Heat Auto Shutdown, Auto CO2/Halon Total = 4 1993/94 5 Non Process Lub Oil Significant Visual Manual Shutdown, Muster at Stations, Other Action
6 Non Process Lub Oil Minor Visual Manual Shutdown, Other Action 7 Non Process Lub Oil Minor Flame Manual Shutdown, Manual Blowdown, Other Action 8 Non Process Methanol Significant Visual None 9 Non Process Methanol Minor Visual Other Action 10 Non Process Glycol Significant Flame Auto Shutdown, Auto Blowdown, Manual Deluge, Manual CO2/Halon, Muster at Stations, Other
Action 11 Non Process Glycol Significant Visual Manual Shutdown, Other Action 12 Non Process Diesel Minor Visual None 13 Non Process Diesel Minor Visual Auto Shutdown, Auto CO2/Halon 14 Non Process Diesel Minor Smoke, Flame Manual CO2/Halon 15 Non Process Diesel Significant Visual Manual Shutdown, Manual CO2/Halon, Muster at Stations 16 Non Process Heat Transfer
Oil Significant Visual Other Action
17 Non Process Lub Oil Minor Visual Manual Shutdown, Other Action 18 Oil Significant Visual Auto Shutdown 19 Oil Minor Flame Auto Shutdown, Auto Blowdown, Auto Deluge, Muster at Lifeboats, Other Action 20 Condensate Minor Visual None 21 Condensate Minor Visual Other Action 22 Gas Minor Visual Muster at Lifeboats, Other Action 23 Gas Minor Gas Other Action 24 Gas Significant Temperature
Change Auto Shutdown, Muster at Stations, Other Action
25 Gas Significant Visual Auto Shutdown, Manual CO2/Halon, Other Action 26 Gas Significant Visual Other Action 27 Gas Minor Visual Manual CO2/Halon 28 Gas Minor Visual Manual CO2/Halon 29 Gas Minor Visual Manual CO2/Halon 30 Gas Significant Visual Manual Shutdown, Manual CO2/Halon

Page 2
Table 4(c) : IGNITIONS - DETECTION MODES & EMERGENCY ACTIONS
Year Ref. Hydrocarbon Type
Non Process Type
Severity Mode of Detection Emergency Actions Taken
Total = 26 1994/95 31 Non Process Lub Oil Minor Visual Manual Shutdown, Other Action
32 Non Process Lub Oil Minor Visual Muster at Stations, Other Action 33 Non Process Lub Oil Significant Heat Auto Shutdown, Auto Blowdown, Manual CO2/Halon, Muster at Stations, Other Action 34 Non Process Lub Oil Minor Visual Other Action 35 Non Process Lub Oil Minor Visual Manual Shutdown, Muster at Stations, Other Action 36 Non Process Diesel Minor Sound Manual Shutdown, Other Action 37 Non Process Glycol Minor Visual Other Action 38 Non Process Glycol Minor Flame Auto Shutdown, Manual Blowdown, Manual Deluge, Manual CO2/Halon, Muster at Stations, Other
Action 39 Non Process Glycol Minor Visual Manual Shutdown, Other Action 40 Non Process Diesel Minor Visual Muster at Stations, Other Action 41 Non Process Fuel Oil Significant Visual Manual Shutdown, Other Action 42 Non Process Diesel Minor Flame Auto CO2/Halon 43 Non Process Lub Oil Minor Flame Manual Shutdown, Auto Deluge, Other Action 44 Non Process Lub Oil Minor Visual Other Action 45 Non Process Heli-Fuel Minor Visual Other Action 46 Non Process Diesel Significant Flame Manual Shutdown 47 Non Process Diesel Significant Flame Manual Shutdown 48 Oil Significant Smoke Manual Shutdown, Manual CO2/Halon, Muster at Stations, Other Action 49 Condensate Minor Sound Manual Shutdown, Muster at Stations, Other Action 50 Condensate Minor Visual Auto Deluge 51 Gas Significant Sound Other Action 52 Gas Minor Sound Other Action 53 Gas Minor Visual Other Action 54 Gas Minor Visual Other Action Total = 24 1995/96 55 Non Process Lub Oil Minor Visual Manual Shutdown, Muster at Stations, Other Action
56 Non Process Lub Oil Significant Heat Auto Shutdown, Manual Blowdown, Manual CO2/Halon, Other Action 57 Non Process Glycol Minor Visual Manual Shutdown, Muster at Stations 58 Non Process Diesel Minor Flame Manual Shutdown 59 Non Process Diesel Minor Flame Auto Shutdown, Auto CO2/Halon, Muster at Stations 60 Non Process Lub Oil Minor Visual Other Action

Page 3
Table 4(c) : IGNITIONS - DETECTION MODES & EMERGENCY ACTIONS
Year Ref. Hydrocarbon Type
Non Process Type
Severity Mode of Detection Emergency Actions Taken
61 Non Process Lub Oil Minor Heat Manual Shutdown, Auto Deluge, Muster at Stations, Other Action 62 Gas Significant Visual Other Action 63 Gas Minor Visual Manual Shutdown, Manual CO2/Halon, Muster at Stations, Other Action Total = 9 1996/97 64 Non Process Lub Oil Minor Flame Auto Shutdown, Auto Deluge, Muster at Stations, Other Action
65 Non Process Lub Oil Significant Smoke, Flame Auto Shutdown, Auto CO2/Halon, Muster at Stations 66 Non Process Diesel Minor Flame Auto Shutdown, Auto CO2/Halon, Muster at Stations 67 Non Process Diesel Minor Smoke Manual Shutdown, Other Action 68 Non Process Diesel Minor Visual Manual Shutdown, Other Action 69 Non Process Diesel Minor Visual Other Action 70 Non Process Diesel Significant Flame Manual Shutdown, Muster at Stations, Other Action 71 Non Process Diesel Significant Flame Manual CO2/Halon 72 Non Process Diesel Minor Flame Manual Shutdown 73 Non Process Lub Oil Minor Smoke Manual Shutdown 74 Non Process Lub Oil Minor Visual Auto Shutdown, Manual CO2/Halon, Muster at Stations 75 Oil Significant Visual Manual Shutdown, Manual Blowdown, Muster at Stations 76 Condensate Minor Heat Auto Shutdown 77 Condensate Minor Visual Other Action 78 Gas Minor Visual Muster at Stations, Other Action 79 Gas Minor Other Action 80 Gas Significant Visual Other Action 81 Gas Significant Visual Other Action Total = 18 1997/98 82 Non Process Diesel Minor Flame Auto Shutdown, CO2/Halon, Muster at Stations
83 Non Process Diesel Minor Visual Other Action 84 Non Process Diesel Minor Visual Manual Shutdown, Auto CO2/Halon 85 Gas Minor Visual Other Action 86 Gas Minor Gas Other Action 87 Gas Minor Visual Other Action 88 Gas Significant Visual Other Action 89 Gas Significant Flame Auto Shutdown, Auto Blowdown, Auto Deluge, Muster at Stations 90 Gas Significant Sound None Total = 9

Page 4
Table 4(c) : IGNITIONS - DETECTION MODES & EMERGENCY ACTIONS
Year Ref. Hydrocarbon Type
Non Process Type
Severity Mode of Detection Emergency Actions Taken
1998/99 91 Non Process Lub Oil Significant Visual Muster at Stations, Other Action 92 Non Process Glycol Minor Visual, Flame Manual Shutdown, Manual CO2/Halon, Muster at Stations, Other Action 93 Non Process Lub Oil Minor Visual Manual CO2/Halon 94 Non Process Lub Oil Minor Flame Auto Shutdown, Manual CO2/Halon 95 Non Process Lub Oil Significant Visual Manual Shutdown, Other Action 96 Non Process Hydraulic Oil Significant Flame Auto Shutdown, Manual CO2/Halon, Muster at Stations 97 Non Process Lub Oil Minor Visual Other Action 98 Non Process Diesel Minor Flame Manual Shutdown, Manual CO2/Halon 99 Non Process Diesel Minor Flame Auto Shutdown, Manual CO2/Halon 100 Non Process Diesel Minor Visual Manual Shutdown 101 Oil Minor Gas Other Action 102 Condensate Minor Other Action 103 Gas Minor Flame, Gas Auto Shutdown, Auto Blowdown, Auto Deluge, Muster at Stations 104 Gas Significant Sound Manual Shutdown, Other Action 105 Gas Minor Visual Other Action 106 Gas Significant Visual None 107 Gas Significant Flame Auto Shutdown, Manual CO2/Halon 108 Gas Minor Heat Manual CO2/Halon Total = 18 1999/00 109 Non Process Diesel Minor Flame Other Action
110 Non Process Diesel Minor Flame Auto Shutdown, Muster at Stations 111 Non Process Diesel Minor Heat, Gas Manual Shutdown 112 Non Process Diesel Minor Visual, Flame Auto Shutdown, Muster at Stations 113 Non Process Lub Oil Significant Flame Auto Shutdown, Auto CO2/Halon, Muster at Stations 114 Condensate Significant Visual Manual Shutdown 115 Gas Minor Visual Other Action 116 Gas Minor Visual Muster at Stations 117 Gas Minor Visual Other Action 118 Gas Minor Visual Manual Shutdown, Manual Blowdown, Other Action Total = 10

Table 5 : MEANS OF DETECTION : SUMMARY
DETECTION MODE TOTALS HYDRO- CARBON
TYPE
S E V
VE E R I
HEAT SMOKE FLAME GAS OTHER MODES LEAKS Maj 0 0 0 2 12 14 14 Sig 5 4 12 57 219 297 274 LIQUIDS Min 3 5 22 53 268 351 342 Maj 0 1 0 57 38 96 92 Sig 1 4 3 388 328 724 666 GAS Min 1 2 3 158 103 267 250 Maj 0 0 0 14 19 33 29 Sig 0 2 0 42 82 126 118 2-PHASE Min 0 0 1 1 15 17 16 Maj 0 1 0 73 69 143 135 Sig 6 10 15 487 629 1147 1058 TOTALS Min 4 7 26 212 386 635 608
GRAND TOTALS 10 18 41 772 1084 1925 1801
Notes: 1. Totals for the period 1-10-92 to 31-03-00 2. More than one type of detection may occur in relation to any one incident 3. Further breakdown of “OTHER” is shown in Table 6
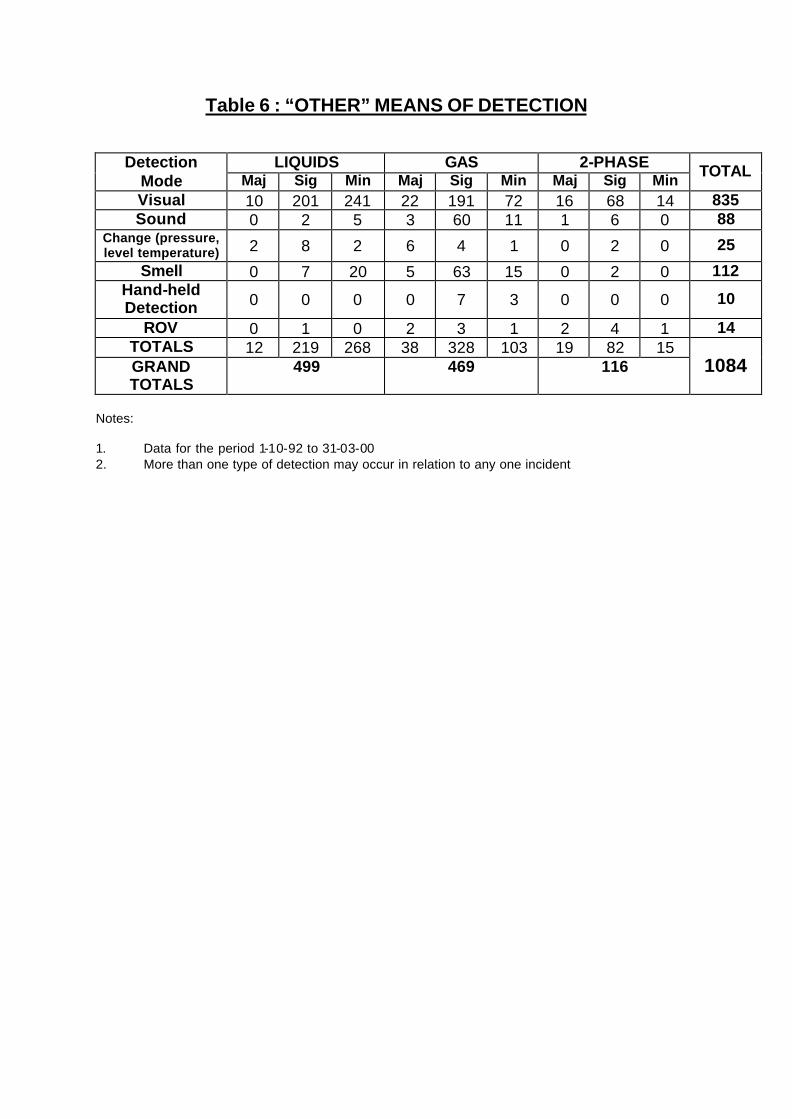
Table 6 : “OTHER” MEANS OF DETECTION
LIQUIDS GAS 2-PHASE Detection Mode Maj Sig Min Maj Sig Min Maj Sig Min TOTAL
Visual 10 201 241 22 191 72 16 68 14 835 Sound 0 2 5 3 60 11 1 6 0 88
Change (pressure, level temperature) 2 8 2 6 4 1 0 2 0 25
Smell 0 7 20 5 63 15 0 2 0 112 Hand-held Detection 0 0 0 0 7 3 0 0 0 10
ROV 0 1 0 2 3 1 2 4 1 14 TOTALS 12 219 268 38 328 103 19 82 15 GRAND TOTALS
499 469 116 1084
Notes: 1. Data for the period 1-10-92 to 31-03-00 2. More than one type of detection may occur in relation to any one incident

Table 7 : EMERGENCY ACTIONS versus RELEASE TYPE & SEVERITY
HYDROCARBON TYPE LIQUIDS GAS 2-PHASE TYPE OF ACTION
Maj Sig Min Maj Sig Min Maj Sig Min TOTALS
AUTO 1 32 45 32 153 67 7 21 1 359 MANUAL 8 137 172 35 290 83 15 72 13 825 SHUTDOWN
NONE 5 105 125 25 223 100 7 25 2 617 AUTO 1 13 20 20 120 27 4 14 1 220
MANUAL 2 30 29 25 143 38 7 33 6 313 BLOWDOWN NONE 11 231 293 47 403 185 18 71 9 1268 AUTO 0 0 6 2 14 2 0 1 0 25
MANUAL 0 2 1 4 2 0 3 0 0 12 DELUGE NONE 14 272 342 86 650 248 26 117 16 1771 AUTO 0 5 7 0 7 0 0 1 0 20
MANUAL 0 7 10 1 4 5 0 0 0 27 CO2/HALON NONE 14 262 325 91 655 245 29 117 16 1754
AT STATIONS 2 44 46 36 193 84 15 34 0 454 AT LIFEBOATS 0 2 4 3 19 9 0 2 0 39 MUSTER
NONE 12 228 292 53 454 157 14 82 16 1308 YES 5 138 171 39 262 100 13 45 7 780 OTHER ACTION
TAKEN NO 9 136 171 53 404 150 16 73 9 1021 TOTALS 14 274 342 92 666 250 29 118 16 1801
Notes : 1. Data for the period 1-10-92 to 31-03-00 2. There may be more than one type of action taken in relation to any one incident

Table 8 : CAUSATION & OPERATING MODE versus RELEASE TYPE & SEVERITY
HYDROCARBON TYPE & SEVERITY LIQUIDS GAS 2-PHASE
CAUSATION FACTORS
Maj Sig Min Maj Sig Min Maj Sig Min
TOTALS
DESIGN FAULT 2 40 50 22 118 28 3 17 3 283 CORROSION/EROSION 0 39 59 4 57 29 9 32 3 232 MECHANICAL DEFECT 6 128 164 48 304 91 13 52 10 816
MATERIAL DEFECT 2 11 8 2 30 9 0 3 1 66 EQUIPMENT
FAULT OTHER 2 11 15 4 28 11 0 7 0 78
1192
INCORRECTLY FITTED 0 26 47 17 106 28 5 10 1 240 IMPROPER OPERATION 5 76 80 22 153 61 7 25 4 433
DROPPED/IMPACT 1 7 9 2 6 3 3 2 0 33 LEFT OPEN/OPENED 2 28 30 13 74 44 0 13 0 204
OPERATIONAL FAULT
OTHER 2 12 9 3 35 7 1 5 2 76
986
NON-COMPLIANCE 0 34 27 15 79 26 3 10 0 194 DEFICIENT PROCEDURE 3 45 46 15 113 44 1 22 1 290
PROCEDURAL FAULT
OTHER 1 4 3 2 16 5 1 1 0 33 517
OPERATING MODE IN AREA AT TIME OF INCIDENT
DRILLING/WELL OPERATION 4 23 12 5 67 36 5 19 1 172 NORMAL PRODUCTION 6 137 189 47 309 79 15 67 12 861
SHUTDOWN/BLOWDOWN 2 22 15 10 56 13 2 7 0 127 PIG/FLUSH/CLEAN/INSPECT 1 8 8 4 31 15 1 4 0 72
MAINTENANCE/CONSTRUCTION 0 26 35 11 59 33 1 4 2 171 TESTING/SAMPLING 0 13 18 1 13 13 2 6 1 67
REINSTATEMENT/START-UP 1 45 65 14 131 61 3 11 0 331
1801
TOTAL No. OF RELEASES 14 274 342 92 666 250 29 118 16 1801
Notes: 1. Data for the period 1-10-92 to 31-03-00 2. There may be several causation factors contributing to any one incident
5.0 FIGURES
CONTENTS Figure 1. Pie-chart : Breakdown by hydrocarbon type, all incidents 2. Line graph : Monthly reporting frequency, Oct. 92 to Mar. 2000 3. Severity analysis : all releases 4. Line graph : Severity analysis, gas releases 5. Line graph : Severity analysis , liquid releases 6. Line graph : Severity analysis , 2 -phase releases 7. Bar graph : Highest 15 system failure rates 8. Bar graph : Highest 15 equipment failure rates

1. Total number of releases = 1801
2. Figures for the period 01-10-92 to 31-03-00
Figure 1 : BREAKDOWN BY HYDROCARBON TYPE
Non Process
205
11.4%
Oil
28715.9%
Condensate
138
7.7%
Gas
1008
56.0%
2-Phase
163
9.1%

Figure 2 : TRENDS IN REPORTING OCT 1992 TO MAR 2000
1992/93 1993/94 1994/95 1995/96 1996/97 1997/98 1998/99 1999/00 1. Reported releases for the period 01-10-92 to 31-03-00 = 1801 2. Monthly average for 1992/93 = 14 (81 in total) October 1992 Database Start-up Monthly average for 1993/94 = 23 (271 in total) August 1993 Guidance Issued Monthly average for 1994/95 = 27 (325 in total) October 1994 First Outputs Report Issued Monthly average for 1995/96 = 18 (212 in total) October 1995 Second Outputs Report Issued Monthly average for 1996/97 = 19 (225 in total) April 1996 RIDDOR Offshore Monthly average for 1997/98 = 18 (219 in total) October 1996 Third Outputs Report Issued Monthly average for 1998/99 = 20 (234 in total) November 1996 Revised Guidance Issued Monthly average for 1999/00 = 20 (234 in total) December 1999 Fourth Outputs Report Issue
ON
DJ
FM
AM
JJ
AS
ON
DJ
FM
AM
JJ
AS
ON
DJ
FM
AM
JJ
AS
ON
DJ
FM
AM
JJ
AS
ON
DJ
FM
AM
JJ
AS
ON
DJ
FM
AM
JJ
AS
ON
DJ
FM
AM
JJ
AS
ON
DJ
FM
0
10
20
30
40
50
TO
TA
L N
UM
BE
R O
F R
EL
EA
SE
S
Monthly Figures

ALL SEVERITY 92/93 93/94 94/95 95/96 96/97 97/98 98/99 99/00
MAJOR 12 24 20 20 19 13 15 12 SIGNIFICANT 50 151 194 134 129 139 134 127 MINOR 19 96 111 58 78 66 85 95 TOTAL 81 271 325 212 226 218 234 234
Severity Analysis
Figure 3 : All Offshore Hydrocarbon Releases
Start-up of Database on 01-10-1992 1. 1992/93 covers the period 01-10-92 to 31-03-93 only 2. Total number of releases reported to 31-03-00 = 1801
92/93 93/94 94/95 95/96 96/97 97/98 98/99 99/00
Year
0
20
40
60
80
100
120
140
160
180
200
220
No
. of
Rel
ease
s
MAJOR
SIGNIFICANT
MINOR

GAS SEVERITY 92/93 93/94 94/95 95/96 96/97 97/98 98/99 99/00
MAJOR 9 16 16 12 14 6 8 11 SIGNIFICANT 34 97 132 86 74 79 85 79 MINOR 10 40 51 24 20 29 31 45 TOTAL 53 153 199 122 108 114 124 135
Severity Analysis Figure 4 : Gas Releases
Start-up of Database on 01-10-1992 1. 1992/93 covers the period 01-10-92 to 31-03-93 only 2. Total number of gas releases reported to 31-03-00 = 1008
92/93 93/94 94/95 95/96 96/97 97/98 98/99 99/00
Year
0
10
20
30
40
50
60
70
80
90
100
110
120
130
140
No
. of
Rel
ease
s
MAJOR
SIGNIFICANT
MINOR

LIQUIDS SEVERITY 92/93 93/94 94/95 95/96 96/97 97/98 98/99 99/00
MAJOR 1 4 1 2 3 1 2 0 SIGNIFICANT 12 32 53 30 40 40 31 36 MINOR 9 53 56 34 54 37 53 46 TOTAL 22 89 110 66 97 78 86 82
Severity Analysis
Figure 5 : Liquid Releases (Oil, Condensate, etc.)
Start-up of Database on 01-10-1992 1. 1992/93 covers the period 01-10-92 to 31-03-93 only 2. Total number of liquid releases reported to 31-03-00 = 630
92/93 93/94 94/95 95/96 96/97 97/98 98/99 99/00
Year
0
10
20
30
40
50
60
No
. of
Rel
ease
s
MAJOR
SIGNIFICANT
MINOR
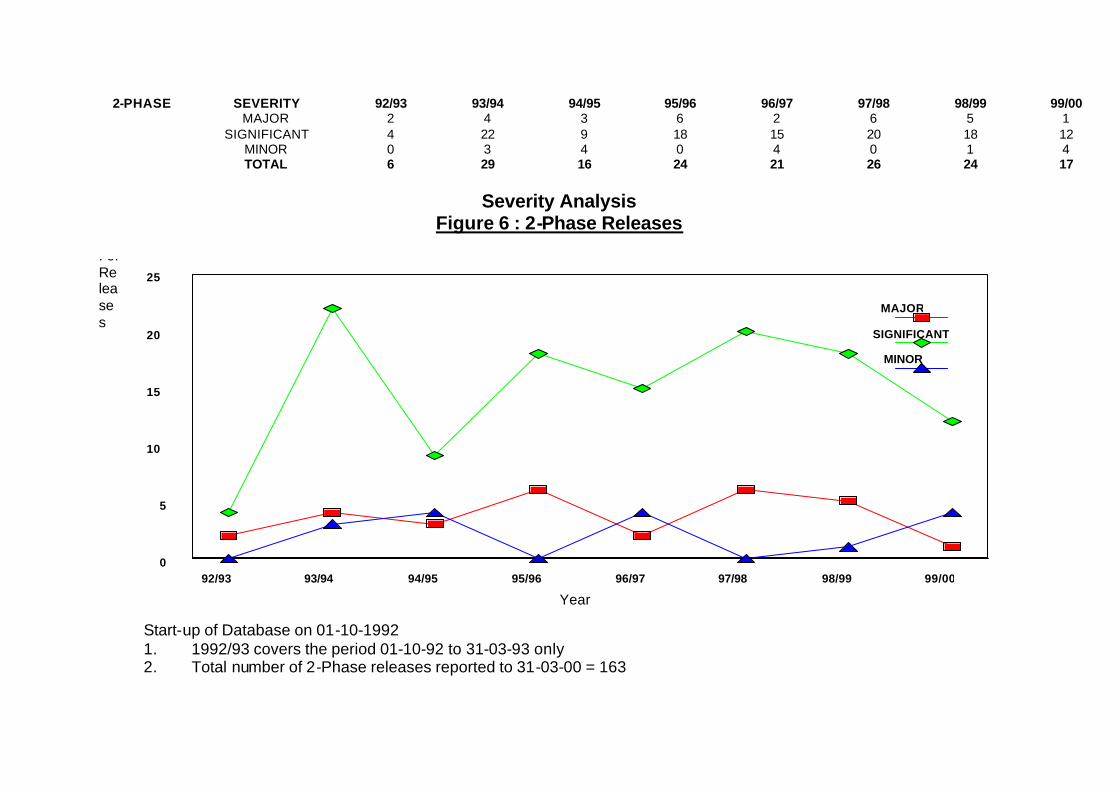
2-PHASE SEVERITY 92/93 93/94 94/95 95/96 96/97 97/98 98/99 99/00 MAJOR 2 4 3 6 2 6 5 1 SIGNIFICANT 4 22 9 18 15 20 18 12 MINOR 0 3 4 0 4 0 1 4 TOTAL 6 29 16 24 21 26 24 17
Severity Analysis
Figure 6 : 2-Phase Releases
Start-up of Database on 01-10-1992 1. 1992/93 covers the period 01-10-92 to 31-03-93 only 2. Total number of 2-Phase releases reported to 31-03-00 = 163
92/93 93/94 94/95 95/96 96/97 97/98 98/99 99/00 Year
0
5
10
15
20
25 . of Releases
MAJOR
SIGNIFICANT
MINOR
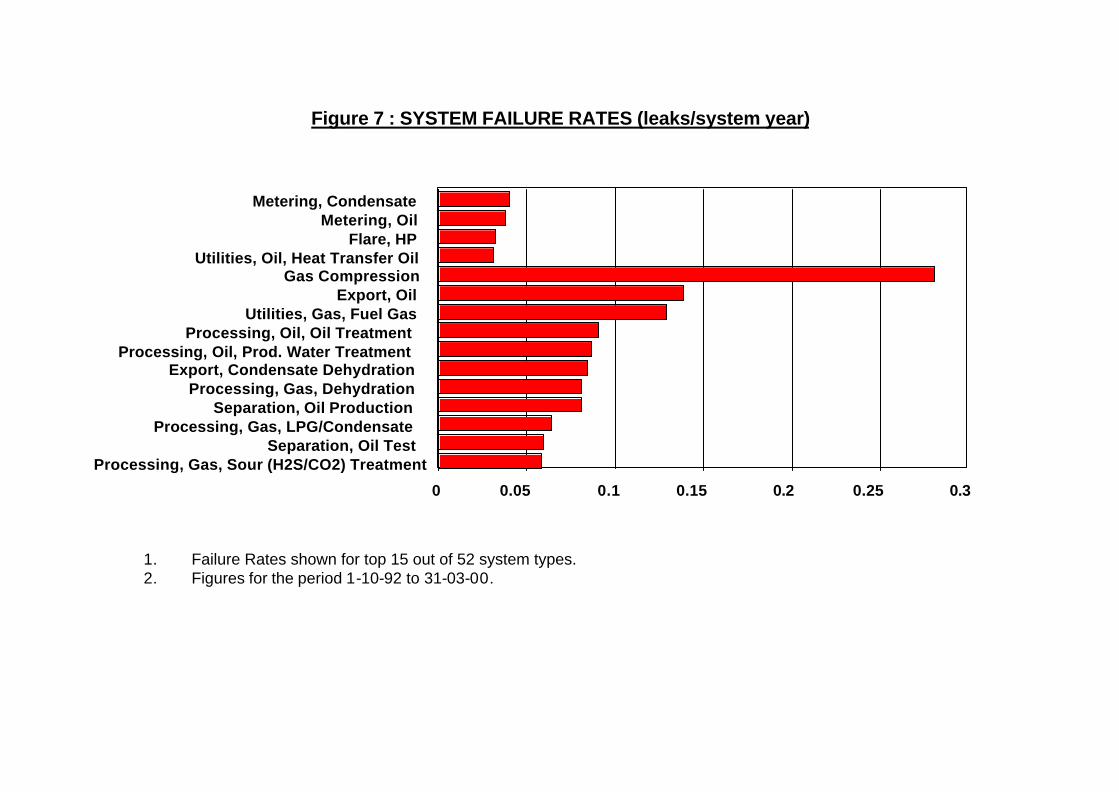
Figure 7 : SYSTEM FAILURE RATES (leaks/system year)
1. Failure Rates shown for top 15 out of 52 system types. 2. Figures for the period 1-10-92 to 31-03-00.
Metering, Condensate
Metering, Oil Flare, HP
Utilities, Oil, Heat Transfer Oil Gas Compression
Export, Oil Utilities, Gas, Fuel Gas
Processing, Oil, Oil Treatment Processing, Oil, Prod. Water Treatment
Export, Condensate Dehydration Processing, Gas, Dehydration Separation, Oil Production
Processing, Gas, LPG/Condensate Separation, Oil Test
Processing, Gas, Sour (H2S/CO2) Treatment 0 0.05 0.1 0.15 0.2 0.25 0.3

Figure 8 : EQUIPMENT FAILURE RATES (leaks/equipment year)
1. Failure Rates shown for top 15 out of 119 equipment types. 2. Figures for the period 1-10-92 to 31-03-00.
Pumps, Reciprocating, Double Seal
Turbines, Gas Pig Launchers, D>16"
Expanders Turbines, Dual Fuel
Valve Actuated,P/L SSIV Assy, 12”<D<=16” aaAAAAAAaAss1111121212”<D<=16” Compressors, Reciprocating
Xmas Tees, P>10000 psi Pressure Vessel, Horizontal, Other
Heat Exchangers, Plate Pressure Vessel, Horizontal, K.O. Drum Pig Receivers, 12"<D<=16”
Compressors, Centrifugal Pressure Vessel, Horizontal, Reboiler Pig Receivers, D>16"
0 0.01
0.02 0.03
0.04 0.05
0.06 0.07
0.08 0.09
APPENDIX 1
OSD PROCESS INTEGRITY INITIATIVE
As indicated in the executive summary and elsewhere in this report, OSD has
launched an initiative to deal with Process Integrity concerns as a result of the re-
porting plateau (see earlier comments) shown by recent offshore hydrocarbon re-
lease statistics, and by trends identified from these statistics.
The initiative is aimed at increasing the awareness of the current unsatisfactory
situation, to identify root causes to bring greater emphasis on the necessity to reduce
offshore hydrocarbon releases, and to influence those people in the best position to
bring that about.
The Process Integrity initiative commenced on 1 April 2000 and has three strands:
1) OSD will investigate all RIDDOR reportable hydrocarbon releases which oc-
cur during the next planning year to 31 March 2001, for major and significant re-
leases this will include offshore visits by Inspectors.
2) It is planned to conduct process integrity inspections of all manned production
installations which will be phased in over the next three years, i.e. 2000 to 2003.
3) A joint HSE/Industry Workshop on hydrocarbon releases was held on 9 No-vember at Ardoe House near Aberdeen. The separate offshore hydrocarbon releases analysis report planned for mid-2000
(OTO 1999 079 refers) has consequently been postponed to take advantage of the
feedback from the resultant inspections and investigations.

APPENDIX 2
SEVERITY CLASSIFICATION
As indicated in the introduction to this report, there have been discussions with the
offshore industry on a classification system for hydrocarbon releases. The consen-
sus reached is that all reported releases can be classified as minor, significant or
major by applying agreed definitions and provisional classification criteria.
DEFINITIONS : The definitions were agreed as follows :
MAJOR : "Potential to quickly impact outwith the local area, e.g. affect the Tem-
porary Refuge (TR), escape routes, escalate to other areas of the installation, caus-
ing serious injury or fatalities."
A major leak, if ignited, would be likely to cause a "major accident", i.e. it would be of
a size capable of causing multiple casualties or rapid escalation affecting TR, escape
routes, etc.
SIGNIFICANT : "Potential to cause serious injury or fatality to personnel within
the local area and to escalate within that local area, e.g. by causing structural dam-
age, secondary leaks or damage to safety systems."
A significant leak, if ignited, might have the potential to cause an event severe
enough to be viewed as a "majo r accident" or be of a size leading to significant esca-
lation within the immediate area or module.
MINOR : "Potential to cause serious injury to personnel in the immediate vicinity,
but no potential to escalate or cause multiple fatalities."
A minor leak, even if ignited, would not be expected to result in a multiple fatality
event or significant escalation, but could cause serious injuries or a fatality local to
the leak site or within that module only.

Any offshore hydrocarbon release reportable under RIDDOR 95 can be classified
under one of the above definitions, using criteria reported on the OIR/12 form. It was
also decided to group all releases of hydrocarbon liquid under one category of "liq-
uids", since oil, condensate, and non-process liquids (diesel, helifuel, glycol, etc.)
share the common characteristics of flammable fluids.
CRITERIA
The simplest criteria for classification is to use inventory released. This can be fur-
ther refined by taking into account hole size and duration, pressure, congestion fac-
tors and a variety of other mitigation factors. At the time of preparation of this report,
the preferred criteria were based on quantity released, release rate and duration. It
should be noted, however, that discussions with industry on further refinement of the
criteria are still ongoing. (See ‘Implementation’ at the end of this Appendix.)
MAJOR :
(i) Gas Releases :
EITHER [Quantity released > 300 kg]
OR [Mass release rate>1kg/s AND Duration >5 mins]
This could result in a jet fire of over 10 metres length (>1kg/s) capable of causing
significant escalation after 5 minutes duration, or a flash fire/explosion on reaching
LFL. Where 300 kg equates to approx. 3000 m3 explosive cloud at NTP, enough to
fill an entire module or deck area, and to cause serious escalation if ignited.

(ii) Liquid Releases (Oil/Condensate/Non-process) :
EITHER [Quantity released > 9,000 kg]
OR [Mass release rate>10kg/s AND Duration >15 mins]
This could result in a pool fire over 10 metres in diameter (>10kg/s) filling a module
or cutting off a deck, hindering escape and affecting more than one person directly if
lasting for over 15 minutes duration.
(iii) 2-Phase Releases :
EITHER [Quantity of liquids released > 300 kg]
OR [Liquids mass release rate>1kg/s AND Duration >5 mins]
Combinations of the major gas and liquids scenarios described above are possible,
depending on the gas to oil ratio (GOR) involved.
MINOR :
(i) Gas Releases :
EITHER [Quantity released < 1 kg]
OR [Mass release rate <0.1 kg/s AND Duration < 2 mins]
This could result in a jet fire of less than 5 metres length (< 0.1 kg/s) which is unsta-
ble (< 2 mins duration) and therefore unlikely to cause significant escalation , or a
flash fire/explosion on reaching LFL. Where <1 kg equates to <10 m3 explosive cloud
at NTP, probably insufficient to cause a significant hazard if ignited.
(ii) Liquid Releases (Oil/Condensate/Non-process) :
EITHER [Quantity released < 60 kgs]
OR [Mass release rate <0.2 kg/s AND Duration < 5 mins]
This could result in a pool fire smaller than 2 metres in diameter (< 0.2 kg/s) unlikely
to last long enough to hinder escape (< 5 mins), but could cause serious injury to
persons nearby.

(iii) 2-Phase Releases :
EITHER [Quantity released < 1 kg]
OR [Liquids release rate <0.1 kg/s AND Duration < 2 mins]
Combinations of the gas and liquids scenarios described above are possible, de-
pending on GOR involved.
SIGNIFICANT : ( Those between major and minor.)
(i) Gas Releases :
Capable of jet fires of 5 to 10 metres lasting for between 2-5 minutes, or release
rates between 0.1 to 1.0 kg/s lasting 2-5 minutes giving explosive clouds of between
10 and 3000 m3 in size.
(ii) Liquids Releases (Oil/Condensate/Non-process) :
Pool fires between 2 and 10 metres in diameter, lasting for between 5 and 15 min-
utes.
(iii) 2-Phase Releases :
Combinations of the gas and liquids scenarios described above are possible.
IMPLEMENTATION
All current and future releases will be classified according to the above agreed crite-
ria for the types of hydrocarbons involved, and the results used in HCR statistics re-
ports.
Any further refinement of the criteria will be retrospectively applied, and the sever-
ities adjusted where necessary.
It is important to note, however, that those releases with a hole size labelled N/A are
special cases where the release rate is not applicable to the mode of release (e.g.
open topped vessels such as shale shakers, or where carry-over of hydrocarbons
from one system to another was involved). All such releases were classified by i n-
spection of the amount released only.

HYDROCARBON RELEASE STATISTICS, 2000 QUESTIONNAIRE
To help improve the quality of offshore data dissemination, would you please answer the following questions on the hydrocar-bon release statistics contained in this report: 1. What is your connection with the UK Offshore Oil and Gas Industry? (Tick one box)
Oil Company management c Oil Company employee c Academic c Service Company management c Service Company employee c Consultant c Industry Assoc. Representative c Trade Union c Journalist c Other (specify) _________________________________________
2. Does this report satisfy your requirements with regard to Offshore Hydrocarbon releases? Completely c More than 50% c Poorly c Not at all c 3. Please indicate areas in which you think a change would be beneficial: * delete as necessary * More / less discussion c * More / less tables c * More / less graphs c * More / less analysis c (see Q4) Any other details as required: ____________________________________________________________________ 4. It is planned to publish a separate analysis report on offshore hydrocarbon release. Would you like to receive such reports on an annual basis? Yes c No c 5. Would you be prepared to pay a nominal charge to cover production costs for future reports? Statistics Report Yes c No c Analysis Report Yes c No c 6. To what use do you put the hydrocarbon release statistics?
Safety Case Development c Project Development c Ind. Relations c Reliability/Availability c Risk Assessment c Design c Health & Safety Management c Other (specify) ___________________________________________
Please return completed form to: HSE, Offshore Safety Division Data Management Team, OSD1.6 Room 201 Merton House Stanley Road Bootle L20 3DL
THANK YOU FOR COMPLETING THIS FORM