otete, harmony e. and orton, elizabeth and fleming, kate m...
TRANSCRIPT

Otete, Harmony E. and Orton, Elizabeth and Fleming, Kate M. and West, Joe (2016) Alcohol-attributable healthcare attendances up to 10 years prior to diagnosis of alcoholic cirrhosis: a population based case-control study. Liver international, 36 (4). pp. 538-546. ISSN 1478-3231
Access from the University of Nottingham repository: http://eprints.nottingham.ac.uk/38488/3/liver_international_finalproof.pdf
Copyright and reuse:
The Nottingham ePrints service makes this work by researchers of the University of Nottingham available open access under the following conditions.
This article is made available under the University of Nottingham End User licence and may be reused according to the conditions of the licence. For more details see: http://eprints.nottingham.ac.uk/end_user_agreement.pdf
A note on versions:
The version presented here may differ from the published version or from the version of record. If you wish to cite this item you are advised to consult the publisher’s version. Please see the repository url above for details on accessing the published version and note that access may require a subscription.
For more information, please contact [email protected]
1
Alcohol-attributable health care attendances up to 10 years prior to
diagnosis of alcoholic cirrhosis: a population based case control study
Harmony E Otete1, 2, Elizabeth Orton3, Kate M Fleming1.2, Joe West1
Author Affiliation:
1Division of Epidemiology and Public health, School of Medicine, City Hospital Campus, University
of Nottingham, Nottingham, NG5 1PB, UK
2 UK Centre for Tobacco and Alcohol Control Studies (UKCTAS), University of Nottingham,
Nottingham, NG5 1PB, UK
3 Division of Primary Care, School of Medicine, University of Nottingham, UK
Correspondence: Harmony E Otete, Division of Epidemiology and Public Health, City Hospital
campus, University of Nottingham, NG5 1PB, UK.
Fax: +44 (0)115 82 31337; Email: [email protected]
Keywords: Alcoholic liver disease, early identification, comorbidities, intervention, healthcare
utilisation
Abbreviations: CI, Confidence Interval; OR, Odds ratio; CPRD, Clinical Practice Research Datalink;
HES, Hospital Episodes Statistics; ICD, International Classification of Diseases; LRT, likelihood ratio
tests; IQR, Interquartile range.
Conflict of interest: None
Electronic word count: 4,988 (includes abstract, key points, tables, figures and references)
Number of tables: 5
Financial support: This work was supported by funding from a scholarship awarded to HEO
by The University of Nottingham. JW, through his Senior Clinical Research Fellowship, and
the UK Centre for Tobacco and Alcohol Studies (UKCTAS) also contribute to HEO’s
funding.

2
Author contributions: KMF and JW conceived the study idea. HEO carried out the data
management and analysis and wrote the first draft of the manuscript. All authors (HEO, EO,
KMF AND JW) were involved in the interpretation of the data, contributed towards to
revision of the manuscript and approved the final draft. JW had the responsibility of
providing the data and HEO had full access to the data.

3
Abstract
Background & Aims
Cirrhosis due to alcohol could be avoided if drinking behaviour could be altered earlier in the
disease course. Our aim was to quantify the burden of morbidities in patients prior to
alcoholic cirrhosis diagnosis, as this may inform the earlier identification of people at high
risk for targeted interventions.
Methods
We carried out a case-control study using 2,479 incident cases of alcoholic cirrhosis and
24,790 controls identified from 357 primary and secondary care centres in England. We
assessed the prevalence of morbidities that are partly attributable to alcohol (namely
malignant neoplasms, diabetes, epilepsy, injuries, cardiovascular and digestive diseases) prior
to alcoholic cirrhosis diagnosis. We compared prevalence in cases to the control population
and used logistic regression to derive odds-ratios (95% CI).
Results
58% of cases compared to 29% of controls had had at least one alcohol-attributable condition
before cirrhosis diagnosis. The most frequent conditions (proportion in cases versus controls)
were intentional injuries(35.9% versus 11.9%) and cardiovascular diseases(23.2%
versus15.6%), followed by diabetes(12.8% versus 5.3%), digestive diseases(6.1% versus
1.2%) and epilepsy(5.0% versus 1.1%). The strongest association with alcoholic cirrhosis
was found for digestive diseases(OR 5.4 [4.4-6.7]), epilepsy(OR4.4[3.5-5.5]) and injuries
(OR 4.0[3.7-4.4]) particularly among those aged 18-44years.
Conclusion
These data highlight the high burden of other alcohol-attributable conditions in patients prior
to alcoholic cirrhosis diagnosis. Reviewing those consistently presenting with any of these
conditions more closely could help practitioners reduce/avoid the long term consequences of
development of alcoholic liver disease.
4
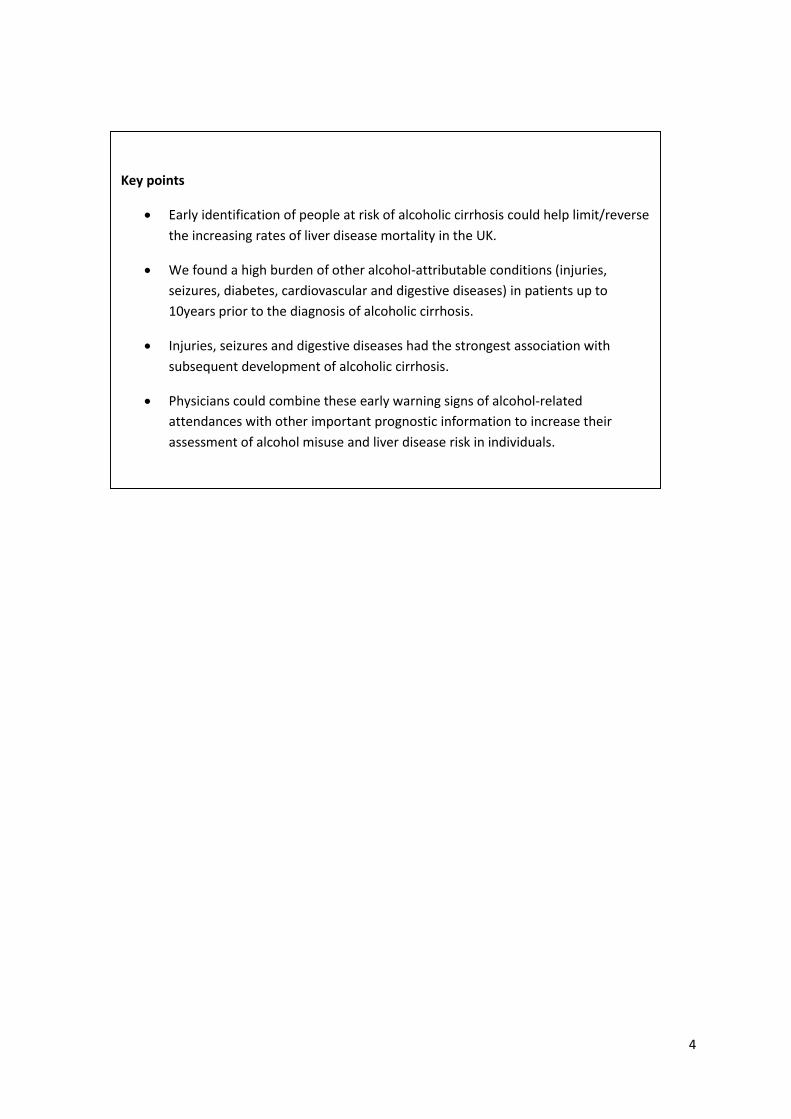
Key points
Early identification of people at risk of alcoholic cirrhosis could help limit/reverse
the increasing rates of liver disease mortality in the UK.
We found a high burden of other alcohol-attributable conditions (injuries,
seizures, diabetes, cardiovascular and digestive diseases) in patients up to
10years prior to the diagnosis of alcoholic cirrhosis.
Injuries, seizures and digestive diseases had the strongest association with
subsequent development of alcoholic cirrhosis.
Physicians could combine these early warning signs of alcohol-related
attendances with other important prognostic information to increase their
assessment of alcohol misuse and liver disease risk in individuals.

5
Introduction
Alcoholic cirrhosis is one of the major contributors to liver disease morbidity and
mortality(1,2). With some variation, it requires around 10-20 years to become fully
established(3,4). During this time people are likely to be drinking alcohol heavily(4–7) and
therefore likely to present to their family doctor/General Practitioner or to hospital emergency
departments for conditions that are related to alcohol, but not necessarily directly related to
cirrhosis. This is not dissimilar to the situation where patients persistently present to primary
care with smoking related symptoms e.g. weight loss and angina-like chest pain several years
before they are diagnosed with lung cancer(8–10). Knowledge of such symptoms that are
associated with the cause of a disease, rather than a disease itself, has been used in the past as
a proxy for risk stratification of individuals for targeted interventions(11,12). Such
stratification could result in improvement in early diagnosis rates and reduction in mortality
from chronic diseases which are otherwise extremely problematic both in terms of prognosis
and complications if identified at a late stage(13).
For alcoholic cirrhosis however there is lack of information on the likely burden of alcohol
related morbidity that may be present in patients before cirrhosis diagnosis. The morbidities
believed to be associated with alcohol are many including some malignancies, cardiovascular
diseases, epilepsy, unintentional and self-harm injuries, and therefore offer the potential for
stratification on a population level(14). Yet, limited studies have explored the occurrence of
these morbidities in patients with cirrhosis. We identified one prior small study of 94 people
with alcoholic liver disease which reported the occurrence of limited categories of
morbidities (injuries, seizures, oral malignancy and digestive diseases) as a secondary study
outcome(15) but there was no comparison population in this study and so the significance of
reported morbidities remains unclear.

6
Given the impact of alcoholic cirrhosis on life expectancy(16) and the potential benefits of
preventative interventions, there is a clear need to better understand which morbidities may
be present in patients before the disease is diagnosed. The aim of this study therefore was to
estimate the burden of diseases that are reported to be at least partly attributable to alcohol in
patients during the time leading up to a diagnosis of cirrhosis, in comparison with the general
population.

7
Methods
Design and data source
This was a case-control study using primary healthcare data from the Clinical Practice
Research Datalink (CPRD), a nationally representative database containing electronic
information on consultations and diagnoses delivered in primary care in the United Kingdom;
and linked hospital admissions data from the UK’s Hospital Episodes Statistics (HES)
database.
Data linkage: Primary care records in CPRD have been linked to secondary care records in
HES at the individual patient level since 1997; however primary care practices have to give
consent before the linkage of patient records can be carried out. At the time of this study, 357
English GP practices that contribute data to CPRD had given consent for linkage to occur.
The linkage is undertaken by a trusted third party prior to release for research, using patient’s
unique ID number, date of birth and gender. Research data are received in fully anonymised
form.
Study population
All adult (>18 years) patients from CPRD-HES linked practices diagnosed with alcoholic
cirrhosis between 1997 and 2012 were identified. Alcoholic cirrhosis was defined by the
presence of a recorded diagnostic code for the disease in either primary or secondary care.
The code lists were adapted and updated from our previously validated definition(17,18). We
excluded cases with a history of any condition that the differential diagnosis could have been
alcoholic cirrhosis (e.g. cirrhosis or oesophageal varices of unspecified aetiology), as this
may have introduced potential misclassification of the diagnosis date. We also ensured that
cases were at least registered with a practice for up to one year before their first diagnosis

8
record to ensure we included only incident cases. From the remaining CPRD-HES linked
patients without a history of cirrhosis or oesophageal varices, we selected 10 control patients
for each case frequency matched by age (+/- 5 years) and general practice. A date of
diagnosis, defined as the date for the first record of alcoholic cirrhosis, was assigned to cases.
Controls were assigned a “pseudo-diagnosis” date which was a randomly generated date
between 1 year after the start of the linked dataset(1997) up to the date they left the practice
or died.
Identifying partly alcohol-attributable morbidity in primary and secondary care
The conditions considered to be partly attributable to alcohol were based on England’s
national guide for alcohol-attributable fractions which has been validated against other
international sources(23,24). These were oral cancers(ICD-10: C00–C14);oesophageal
cancer(C15);colorectal cancers(C18–C21);breast cancer(C50);diabetes mellitus (E10–E14);
epilepsy(G40, G41);hypertensive disease(I10–I14);ischaemic heart disease(I20-I25);
haemorrhagic stroke(I60–I62);ischaemic stroke(I63);road traffic accidents (many V codes);
falls(W00–W19);drowning(W65–W74);poisonings(X40–X49);other unintentional injuries
(rest of V codes plus some W, X, Y codes);self-inflicted injuries(X60–X84, Y87.0);violence
(X85–Y09, Y87.1);and other intentional injuries(Y35). Read and ICD 10 codes for these
conditions were used to examine the records of all patients to identify people with these
diagnoses before cirrhosis diagnosis/pseudo-diagnosis. Where a patient had multiple
consultations or hospital admissions with a specific diagnostic code, only the first record was
kept for our analyses. Where codes for different diseases were first entered on the same date -
for example if an individual received a diagnosis code for hypertension and was also
diagnosed with diabetes on the same date, both records of unique diseases were included. We
grouped each first diagnosis into four exposure periods: within 12 months, between 13
months-2 years, between 3-5 years and between 6-10 years pre-diagnosis or pseudo-
9
diagnosis. For clarity of presentation we further grouped all diseases into
categories(malignant neoplasms, diabetes, diseases of the nervous system, cardiovascular
diseases, digestive diseases, and injuries) based on ICD10 chapter headings.
Covariates
We extracted data on patient sex, age, smoking history and alcohol use from CPRD. Age was
calculated as age at alcoholic cirrhosis diagnosis/pseudo-diagnosis and grouped into five age
bands. The most recent smoking record before diagnosis/pseudo-diagnosis was used to
classify individuals as non-smoker, smoker or ex-smoker. The highest level of recorded
alcohol use was used to classify individuals as never, moderate or harmful or hazardous
drinker. Patients with an alcohol record that did not specify consumption frequency and
volume e.g. “beer drinker”, “wine drinker” were assigned as having an “unclear” alcohol
consumption status. Missing data on smoking or alcohol use was addressed by including a
“no recorded data” category so that such patients were not excluded from the analyses.
Statistical analysis
We calculated the proportion of patients ever diagnosed with any alcohol-attributable
condition listed above. Logistic regression was used to explore the association between each
ICD category and alcoholic cirrhosis. We tested for effect modification by age and sex via
stratified analyses and the fitting of interaction terms in our logistic regression model; the
significance of models was tested using likelihood ratio tests(LRTs), with p<0.05 considered
significant.

10
To investigate whether the occurrence of each condition varied across the pre-diagnosis
period, frequencies and odds ratios were recalculated for each condition for the four pre-
defined pre-diagnosis exposure periods. Not all patients were included in this analysis. We
applied restriction based on completeness of follow up such that the analyses for any time
period were limited to those with complete follow up. For example, only patients with a
minimum of 2 years’ worth of pre-diagnosis data were included in 13 months-2 year time
period analyses and only those with up to 5 years’ worth of data were included in the 3-5 year
period. Additional analysis was carried out on injuries to take into account that injuries are
acute and therefore people could have multiple acute injuries over time. For this analysis, we
considered whether a patient had had any new injury in each time period rather than just in
the period of their first injury and reassessed frequencies and odds ratios using this additional
information.
All analyses were conducted using the statistical software Stata v12.0 (StataCorp, Texas).
Ethics statement
Ethical approval for this study was granted from the Independent Scientific Advisory
Committee of the CPRD (15_073R).
11
Results
A total of 2,479 cases and 24,790 controls were included in the study. The mean age at
cirrhosis diagnosis was 55.6 years. The median observation time prior to diagnosis/pseudo
diagnosis was higher in cases than controls: 5.7 years(IQR 3.0-9.2 years) and 4.6 years(IQR
2.4–7.9 years) respectively. Compared with controls, cases were more likely to be men,
current smokers and harmful/hazardous drinkers (Table 1).
As shown in table 2, nearly two-thirds (58%) of cases had presented with at least one
condition partially attributable to alcohol during a preceding primary care or hospital visit,
compared to 29% in the control population. Compared to the control population, we found a
stronger risk of alcoholic cirrhosis in those cases with three or more morbidities(OR 9.3,95%
CI [7.5-11.7]) than in those with one morbidity(OR 2.7,95%CI[2.5-3.0]). When we compared
cirrhosis risks across age groups, we found stronger associations with cirrhosis for younger
patients(OR for those <45 years 6.1, 95% CI[4.9-7.5]) who had presented with an attributable
morbidity compared to older patients(OR for those >75years 2.5, 95%CI[1.7-3.7]).
Comparing risks by sex, no substantial difference was observed between men and women.
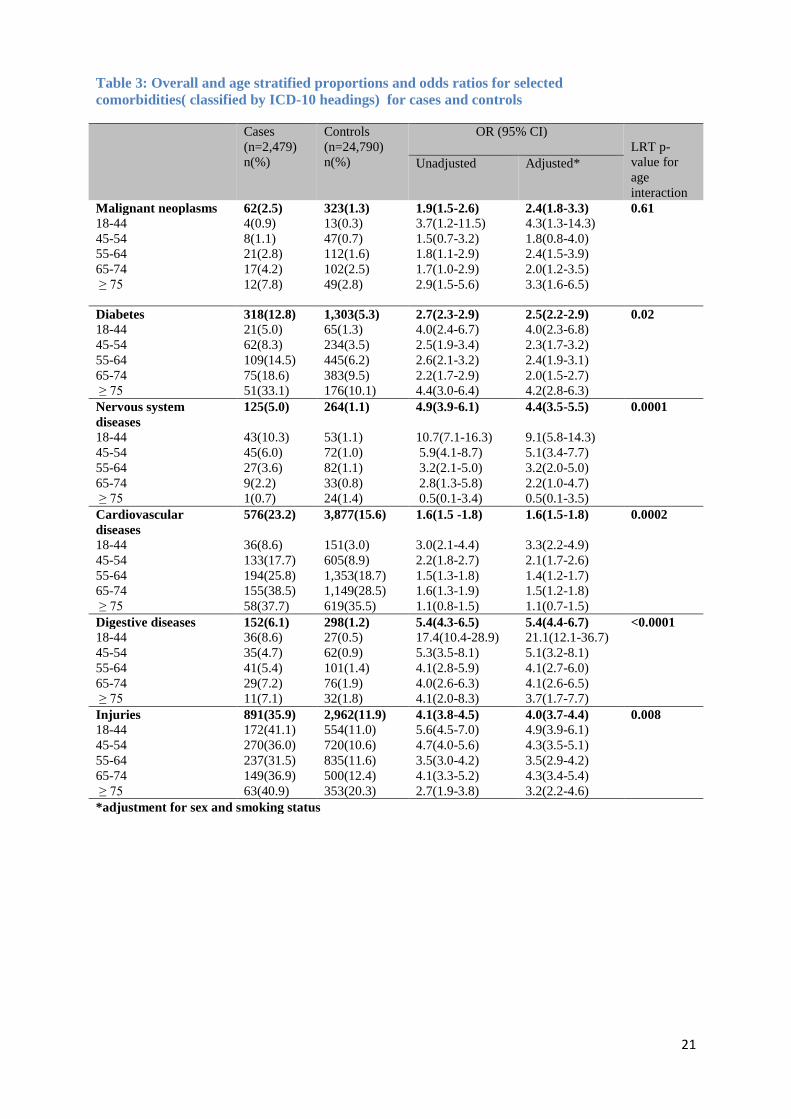
Table 3 shows age stratified proportions and ORs for each disease group. The most common
conditions among cases were injuries(35.9%), cardiovascular diseases(23.2%) and diabetes
(12.8) corresponding to adjusted odds ratios of 4.0(95%CI[3.7-4.4]), 1.6 (95%CI[1.5-1.8])
and 2.5 (95%CI[2.2-2.9]) (Table 3). Digestive(6.1%) and nervous system(5.0%) diseases
were relatively uncommon but had the highest odds ratios when comparing cases to controls
at 5.4(95%CI[4.4-6.7]) and 4.4(95%CI[3.5-5.5]) respectively. We observed a marked
variation in the magnitude of effect across age groups for most diseases. The odds of
cardiovascular, nervous system, digestive diseases and injuries for instance generally
decreased with increasing age, with the highest odds among those aged less than 45 years old.

12
For malignant neoplasms and diabetes, odds were highest for those less than 45 years and for
those over 75 years compared to the other age groups.
When proportions were calculated for the individual conditions within each ICD 10 category
(Table 4), we observed that within each category, certain conditions were more strongly
associated with subsequent diagnosis of alcoholic cirrhosis than others. For example, within
the cardiovascular disease category, cardiac arrhythmias had the strongest association with
alcoholic cirrhosis (Adjusted OR 4.2,95% CI[3.3-5.6]) compared to hypertension(adjusted
OR 1.5, 95%CI[1.3-1.7]) or cerebrovascular diseases (adjusted OR 1.8,95% CI[1.4-2.3]).
Among injuries, intentional injuries and self-harm (Adjusted OR 6.6, 95%CI[5.4-7.9]) were
more strongly associated with subsequent diagnosis with alcoholic cirrhosis than
unintentional injuries(OR 3.7, 95% CI [3.4-4.1]) (Table 4).
Table 5 shows proportions and ORs for assessed conditions at different time periods. There
were variations in the odds of the various conditions over time with some conditions
increasing and others decreasing. Digestive diseases and diabetes were more likely to occur
around cirrhosis diagnosis than at other times. ORs for cardiovascular diseases did not
change markedly throughout the entire 10 year window but were slightly higher in the 6-10
year period than in earlier periods. Epilepsy and intentional injuries had relatively high ORs
which persisted strongly throughout the entire 10 year period assessed. Reanalysing injuries
showed a stronger association between both intentional and unintentional injuries and
alcoholic cirrhosis particularly in the 3-5year time periods but did not markedly change the
overall time-specific patterns.

13
Discussion
We have found that compared with patients in the general population, those patients who
acquire a diagnosis of alcoholic cirrhosis attend both primary and secondary health care
providers more frequently with other conditions reported to be attributable to alcohol as far
back as 10 years before the diagnosis of alcoholic cirrhosis. The conditions with the highest
frequency in cases were injuries(unintentional), cardiovascular diseases (hypertension in
particular), and diabetes. However, these did not appear to be particularly specific to
alcoholic cirrhosis as they were also reasonably prevalent among the control population.
Digestive diseases, intentional injuries and epilepsy which were relatively uncommon among
cases, appeared to be more strongly associated with alcoholic cirrhosis. It could therefore be
argued that while targeting individuals with any alcohol-attributable disease may be
beneficial, focussing on those who present with any of these three conditions (digestive
diseases, intentional injuries and epilepsy) may be a more sensitive way of identifying people
who will be more likely to develop alcoholic cirrhosis of the liver later on.
The main strengths of our study are its large study size and that the morbidities we have
assessed were prospectively recorded in routinely collected data before the diagnosis of
alcoholic cirrhosis, thus avoiding recall bias. We frequency-matched cases and controls on
general practice and age to account for differences in data recording between practices and
differences in healthcare seeking behaviour between age groups respectively, but which also
allowed us to assess interaction by age where it occurred. Data held in CPRD are generally
representative of the UK population in terms of age, sex and geographical coverage(19).
However, because HES contains admission information for only English hospitals, CPRD
patients from Wales, Scotland and Northern Ireland were excluded. Our results are therefore
expected to be generalizable to the English population at the very least.

14
Some limitations of our study and potential alternative explanations for our findings should
be noted. First, although we have accounted for age differences in healthcare seeking
behaviour, there are other potential modifiers of this that we were unable to adjust for e.g.
socio-economic status, education and family history. We therefore cannot rule out the
possibility of residual confounding on our estimates. We have intentionally not adjusted our
estimates for level of alcohol use since alcohol consumption is directly on the causal pathway
of alcoholic cirrhosis and thus adjustment would be inappropriate.
The morbidities we have assessed were prospectively recorded in the medical record before
the diagnosis of alcoholic cirrhosis. However there is still the possibility of reverse causality,
particularly in the association between diabetes and cirrhosis that we observed. Several
studies have shown that metabolic syndrome related to pre-existing diabetes may result in an
increased predisposition to cirrhosis(20–22). Alternatively, it has also been implied that
impaired glucose metabolism in cirrhosis can lead to diabetes(23–25). Since, as with all
epidemiological studies of chronic diseases with long subclinical periods (i.e. both diabetes
and cirrhosis), we are only able identify the date of acquisition of cirrhosis (or diabetes)
diagnosis rather than the date of biological onset, it becomes difficult to definitively establish
the temporal association of the relationship.
The exceptionally high risk of digestive diseases and diabetes we found within the year of
cirrhosis diagnosis compared to other later periods may reflect another potential problem,
namely ascertainment bias. This may occur during gastro-intestinal based work-up for
cirrhosis diagnosis where clinical suspicion of liver disease was high in the year prior to
diagnosis of alcoholic cirrhosis. However, it could also be argued that perhaps the presence
of other digestive diseases may have led to quicker diagnosis of alcoholic cirrhosis, since
those with these morbidities would have been more likely to utilise healthcare services
leading to increased opportunities to identify cirrhosis.

15
Finally, we have shown a higher risk of several malignancies (oropharynx, oesophageal and
laryngeal cancers) among people with alcoholic cirrhosis. A common factor that is also
strongly associated with these malignancies is cigarette smoking(26,27). Since nearly half of
the cases included in our study were identified as smokers, it is likely that the higher risk of
laryngeal and oesophageal cancer we have found may well be related more importantly to
smoking and only partly to alcohol. Though we have adjusted for most recent documented
smoking status this is probably an imperfect measurement of true lifetime smoking habit (e.g.
we are unable to adjust for pack-years as this level of detail is not available in our data) and
there will likely be residual confounding by smoking in operation in our adjusted effect
estimates.
Previous literature
There are limited studies published on healthcare use and morbidities in people with
alcoholic cirrhosis with which we can compare our study. Verrill et al (2006) retrospectively
reviewed hospitalised patients with alcoholic cirrhosis in Southampton, UK between 1995
and 2000 to identify how often patients had made contact with primary or secondary care in
the five year period before they received a diagnosis of alcoholic cirrhosis. Similar to our
findings, they report that patients had presented with injuries, seizures, oral cancers and
digestive diseases during the period before alcoholic cirrhosis was diagnosed(15). However,
the inclusion of only hospitalised patients who may not be representative of the entire
population of people with alcoholic cirrhosis and the absence of any control population make
it difficult to directly compare this study with ours. In a second study in Scotland UK where
high healthcare utilisation of patients with alcohol use disorders including alcoholic liver

16
disease has been shown, morbidities that patients presented with before the disease were not
reported(28).
Conclusion and implications
We believe that the partly alcohol-attributable diseases that patients consult for can be useful
as an indication of potential development of alcoholic cirrhosis. We therefore think that
physicians could combine the early warning signs of these partially alcohol-attributable
diseases and injuries with other important prognostic information to increase their assessment
of alcohol misuse in individuals. Particular attention should also be paid to those diagnosed
with more than one partially alcohol attributable morbidity as the likelihood of a subsequent
diagnosis of alcoholic cirrhosis was 9-fold higher for patients with three or more of these
identified morbidities. The stronger associations found between all diseases and cirrhosis for
those less than 45 years of age suggests that the potential advantage of risk stratification
using alcohol-attributable health care attendances may be even greater in this age group.
In conclusion, we have shown that among most of the patients diagnosed with alcoholic
cirrhosis, prior primary or secondary care diagnoses for conditions known to be attributable
to alcohol are common. These findings suggest that practitioners may be able to identify
those who may later develop alcoholic cirrhosis of the liver by reviewing people presenting
with partially alcohol-attributable conditions more closely. We believe that if these high risk
groups of patients can be screened for alcohol misuse, and treated appropriately, practitioners
may be able to help reduce or avoid the long term consequences of development of alcoholic
liver disease.

17
References
1. Rehm J,Samokhvalov AV, Shield KD. Global burden of alcoholic liver diseases.
Journal of Hepatology 2013;59:160-8
2. Williams R,Aspinall R, Bellis M,Camps-Walsh G, Cramp M,Dhawan A, et al.
Addressing liver disease in the UK: a blueprint for attaining excellence in health care
and reducing premature mortality from lifestyle issues of excess consumption of
alcohol, obesity, and viral hepatitis. The Lancet. 2014; 384(9958):1953–97.
3. Kamper-Jørgensen M, Grønbæk M, Tolstrup J, Becker U. Alcohol and cirrhosis: dose–
response or threshold effect? Journal of Hepatology. 2004; 41(1):25–30.
4. Becker U, Deis A,Sorensen TI,Gronbaek M,Borch-Johnsen K,Muller CF, et al.
Prediction of risk of liver disease by alcohol intake, sex, and age: A prospective
population study. Journal of Hepatology. 1996;23(5):1025–9.
5. Verrill C, Markham H,Templeton A,Carr NJ,Sheron N. Alcohol-related cirrhosis—early
abstinence is a key factor in prognosis, even in the most severe cases. Addiction.
2009;104(5):768–74.
6. Huang Y-W,Yang S-S,Kao J-H. Pathogenesis and management of alcoholic liver
cirrhosis: a review. Hepatic Med Evid Res. 2011;3:1–11.
7. Bellentani S,Saccoccio G,Costa G,Tiribelli C,Manenti F,Sodde M, et al. Drinking habits
as cofactors of risk for alcohol induced liver damage. Gut. 1997;41(6):845–50.
8. Hubbard RB,Baldwin DR. Diagnosing lung cancer earlier in the UK. Thorax. 2010
;65(9):756–8.
9. Corner J,Hopkinson J,Fitzsimmons D,Barclay S,Muers M. Is late diagnosis of lung
cancer inevitable? Interview study of patients’ recollections of symptoms before
diagnosis. Thorax. 2005;60(4):314–9.
10. Hamilton W. Cancer diagnosis in primary care. British Journal of General Practice.
2010;60(571):121–8.
11. Georghiou T,Steventon A,Billings J,Blunt I,Lewis G,Bardsley M. Predictive risk and
health care: an overview. [Internet]. London: Nuffield Trust, 2011; Available from:
http://www.nuffieldtrust.org.uk/publications/predictive-risk-and-health-care-overview
12. Dixon J,Bardsley M.Predictive risk modelling using routine data: underexploited
potential to benefit patients. J Health Serv Res Policy. 2012;17(3):131–2.
13. NHS-Leeds North Clinical Commissioning Group. Risk Stratification (Pro-Active Care
Management). 2015. NHS 2015
14. Rehm J,Baliunas D,Borges GLG,Graham K, Irving H, Kehoe T, et al. The relation
between different dimensions of alcohol consumption and burden of disease: an
overview. Addiction. 2010;105(5):817–43.

18
15. Verrill C,Smith S,Sheron N. Are the opportunities to prevent alcohol related liver deaths
in the UK in primary or secondary care? A retrospective clinical review and prospective
interview study. Subst Abuse Treat, Prev Policy. 2006;1(1):1–5.
16. Ratib S,Fleming KM,Crooks CJ,Aithal GP,West J. 1 and 5 year survival estimates for
people with cirrhosis of the liver in England, 1998-2009: a large population study.
Journal of Hepatology. 2014;60(2):282–9.
17. Ratib S,West J,Crooks CJ,Fleming KM. Diagnosis of Liver Cirrhosis in England, a
Cohort Study, 1998-2009: A Comparison with Cancer. American Journal of
Gastroenterology. 2014;109(2):190–8.
18. Fleming KM,Aithal GP,Solaymani-Dodaran M,Card TR,West J. Incidence and
prevalence of cirrhosis in the United Kingdom, 1992–2001: A general population-based
study. Journal of Hepatology. 11;49(5):732–8.
19. Crooks CJ. Epidemiology of upper gastrointestinal bleeding. Ph.D. Thesis. University
Of Nottingham: UK; 2013.
20. Adams LA,Sanderson S,Lindor KD,Angulo P. The histological course of nonalcoholic
fatty liver disease: a longitudinal study of 103 patients with sequential liver biopsies.
Journal of Hepatology. 2005;42(1):132–8.
21. Angulo P, Keach JC,Batts KP,Lindor KD.Independent predictors of liver fibrosis in
patients with nonalcoholic steatohepatitis.Hepatology.1999;30(6):1356–62.
22. Hickman IJ,Macdonald GA. Impact of Diabetes on the Severity of Liver Disease.
American Journal of Medicine. 2007;120(10):829–34.
23. Petrides AS. Hepatogenic diabetes: pathophysiology, therapeutic options and prognosis.
Z Gastroenterol. 1999 ;Suppl 1:15–21.
24. Deschenes M,Somberg KA. Effect of transjugular intrahepatic portosystemic shunt
(TIPS) on glycemic control in cirrhotic patients with diabetes mellitus. American
Journal of Gastroenterology. 1998;93(3)483.
25. Picardi A,D’Avola D,Gentilucci UV,Galati G, Fiori E, Spataro S, et al. Diabetes in
chronic liver disease: from old concepts to new evidence. Diabetes Metab Res Rev.
2006;22(4):274–83.
26. Gandini S,Botteri E,Iodice S,Boniol M,Lowenfels AB,Maisonneuve P, et al. Tobacco
smoking and cancer: a meta-analysis. International Journal of Cancer. 2008
;122(1):155–64.
27. Dossus L,Boutron-Ruault M-C,Kaaks R,Gram IT,Vilier A,Fervers B, et al. Active and
passive cigarette smoking and breast cancer risk: results from the EPIC cohort.
International Journal of Cancer. 2014;134(8):1871–88.
28. Morris M,Johnson D,Morrison DS. Opportunities for prevention of alcohol-related
death in primary care: results from a population-based cross-sectional study. Alcohol
2012;46(7):703–7.

19
Table 1: Study population characteristics.
Cases
n=2,479
Controls
n=24,790
P-value
Age at diagnosis(years)
Mean(SD) 55.6(11.7) 55.4(12.4)
Age group (n, %)
min-44 419(16.9) 5,024(20.3)
45-54 750(30.3) 6,772 (27.3)
55-64 753(30.4) 7,222 (29.1)
65-74 403(16.3) 4,027 (16.2)
≥ 75 154(6.2) 1,742 (7.0)
Observation time(years)
Median(IQR) 5.7(3.0 – 9.2) 4.6(2.4 – 7.9)
Up to 12months 2,479(100.0) 24,790 (100.0)
Up to 2years 2,151(86.8) 20,162 (81.3)
Up to 5years 1,377(55.6) 11,422(46.1)
Up to 10 years 482 (19.4) 3,432(13.8)
Sex (n, %) <0.001
Male 1,660(67.0) 12,453(50.2)
Female 819(33.0) 12,337(49.8)
Smoking status <0.001
Non smoker 508(20.5) 9,995(40.3) Current smoker 1,175(47.4) 5,080(20.5) Ex-smoker 415(16.7) 4,543(18.3) No record available 381(15.4) 5,172(20.9)
Alcohol use status <0.001
Data available 2,088(84.2 ) 16,752( 67.6)
Never 48(1.9) 2,347(9.5)
moderate 377(15.2) 11,374(45.9)
Hazardous/harmful 1,507( 60.7) 2,344(9.5)
unclear 156( 6.3) 687(2.8)
No record available 391(15.8) 8,038(32.4)

20
Table 2: Number, proportion and odds ratios describing the likelihood of presenting with at
least one partially alcohol-attributable condition at any point during the study
Cases
(n= 2,479)
Controls
(n = 24,790)
OR(95% CI)
Prior diagnosis of an alcohol-attributable condition
Ever 1,443(58.2) 7,201(29.1) 3.3(3.1-3.7)
1 909(36.7) 5,627(22.7) 2.7(2.5-3.0)
2 407(16.4) 1,343(5.4) 5.1(4.5-5.8)
3 or more conditions 127(5.1) 231(0.9) 9.3(7.5-11.7)
Never 1,036(41.8) 17,589(70.9)
Sex
Male
Ever 970(58.4) 3,525(28.3) 3.6(3.2-3.9)
Never 690(41.6) 8,928(71.7) -
Female
Ever 473(57.8) 3,676(29.8) 3.2(2.8-3.7)
Never 346(42.3) 8,661(70.2) -
Age groups
18-44
Ever 222(52.9) 782(15.6) 6.1(4.9-7.5)
Never 197(47.0) 4,245(84.4) -
45-54
Ever 406(54.1) 5300(78.3) 4.2(3.6-4.9)
Never 344(45.9) 1,472(21.7) -
55-64
Ever 432(57.4) 2,347(32.5) 2.8(2.4-3.3)
Never 321(42.6) 4,875(67.5) -
65-74
Ever 270(67.0) 1,693(42.1) 2.8(2.2-3.5)
Never 133(33.0) 2,334(57.9) -
≥ 75
Ever 113(73.4) 907(52.1) 2.5(1.7-3.7)
Never 41(26.6) 835(47.9) -
*percentages are calculated as a fraction of those with alcohol attributable conditions, cases n=1,443 and
controls n=7,201.
Lrtest P value for sex interaction: p=0.26
Lrtest P value for age interaction: p < 0.0001
21
Table 3: Overall and age stratified proportions and odds ratios for selected
comorbidities( classified by ICD-10 headings) for cases and controls
Cases
(n=2,479)
n(%)
Controls
(n=24,790)
n(%)
OR (95% CI)
LRT p-
value for
age
interaction
Unadjusted Adjusted*
Malignant neoplasms 62(2.5) 323(1.3) 1.9(1.5-2.6) 2.4(1.8-3.3) 0.61
18-44 4(0.9) 13(0.3) 3.7(1.2-11.5) 4.3(1.3-14.3)
45-54 8(1.1) 47(0.7) 1.5(0.7-3.2) 1.8(0.8-4.0)
55-64 21(2.8) 112(1.6) 1.8(1.1-2.9) 2.4(1.5-3.9)
65-74 17(4.2) 102(2.5) 1.7(1.0-2.9) 2.0(1.2-3.5)
≥ 75 12(7.8) 49(2.8) 2.9(1.5-5.6) 3.3(1.6-6.5)
Diabetes 318(12.8) 1,303(5.3) 2.7(2.3-2.9) 2.5(2.2-2.9) 0.02
18-44 21(5.0) 65(1.3) 4.0(2.4-6.7) 4.0(2.3-6.8)
45-54 62(8.3) 234(3.5) 2.5(1.9-3.4) 2.3(1.7-3.2)
55-64 109(14.5) 445(6.2) 2.6(2.1-3.2) 2.4(1.9-3.1)
65-74 75(18.6) 383(9.5) 2.2(1.7-2.9) 2.0(1.5-2.7)
≥ 75 51(33.1) 176(10.1) 4.4(3.0-6.4) 4.2(2.8-6.3)
Nervous system
diseases
125(5.0) 264(1.1) 4.9(3.9-6.1) 4.4(3.5-5.5) 0.0001
18-44 43(10.3) 53(1.1) 10.7(7.1-16.3) 9.1(5.8-14.3)
45-54 45(6.0) 72(1.0) 5.9(4.1-8.7) 5.1(3.4-7.7)
55-64 27(3.6) 82(1.1) 3.2(2.1-5.0) 3.2(2.0-5.0)
65-74 9(2.2) 33(0.8) 2.8(1.3-5.8) 2.2(1.0-4.7)
≥ 75 1(0.7) 24(1.4) 0.5(0.1-3.4) 0.5(0.1-3.5)
Cardiovascular
diseases
576(23.2) 3,877(15.6) 1.6(1.5 -1.8) 1.6(1.5-1.8) 0.0002
18-44 36(8.6) 151(3.0) 3.0(2.1-4.4) 3.3(2.2-4.9)
45-54 133(17.7) 605(8.9) 2.2(1.8-2.7) 2.1(1.7-2.6)
55-64 194(25.8) 1,353(18.7) 1.5(1.3-1.8) 1.4(1.2-1.7)
65-74 155(38.5) 1,149(28.5) 1.6(1.3-1.9) 1.5(1.2-1.8)
≥ 75 58(37.7) 619(35.5) 1.1(0.8-1.5) 1.1(0.7-1.5)
Digestive diseases 152(6.1) 298(1.2) 5.4(4.3-6.5) 5.4(4.4-6.7) <0.0001
18-44 36(8.6) 27(0.5) 17.4(10.4-28.9) 21.1(12.1-36.7)
45-54 35(4.7) 62(0.9) 5.3(3.5-8.1) 5.1(3.2-8.1)
55-64 41(5.4) 101(1.4) 4.1(2.8-5.9) 4.1(2.7-6.0)
65-74 29(7.2) 76(1.9) 4.0(2.6-6.3) 4.1(2.6-6.5)
≥ 75 11(7.1) 32(1.8) 4.1(2.0-8.3) 3.7(1.7-7.7)
Injuries 891(35.9) 2,962(11.9) 4.1(3.8-4.5) 4.0(3.7-4.4) 0.008
18-44 172(41.1) 554(11.0) 5.6(4.5-7.0) 4.9(3.9-6.1)
45-54 270(36.0) 720(10.6) 4.7(4.0-5.6) 4.3(3.5-5.1)
55-64 237(31.5) 835(11.6) 3.5(3.0-4.2) 3.5(2.9-4.2)
65-74 149(36.9) 500(12.4) 4.1(3.3-5.2) 4.3(3.4-5.4)
≥ 75 63(40.9) 353(20.3) 2.7(1.9-3.8) 3.2(2.2-4.6)
*adjustment for sex and smoking status

22
Table 4: Proportions and ORs for all morbidities for cases and controls
aadjustment for age, sex and smoking status bexcludes gestational diabetes cUnintentional injuries include falls, fractures,
asphyxia, road traffic accidents and unintentional poisonings. dIntentional injuries include assault, intentional self-harm and intentional poisoning
Conditions Cases
(n=2479)
Controls
(n=24,790)
OR (95%CI)
Unadjusted Adjusteda
Malignant neoplasms of:
larynx 5(0.2) 6(0.02) 8.3(2.5-27.4) 6.8(1.9-23.5)
Colon and rectum 11(0.4) 82(0.3) 1.3(0.7-2.5) 1.3(0.7-2.5)
Breast 12(0.48) 212(0.9) 0.6(0.3-1.0) 0.9(0.5-1.6)
Oesophagus 4(0.2) 12(0.1) 3.3(1.1 -10.4) 3.5(1.1-11.3)
Lip, oral cavity and pharynx 7(0.3) 18(0.1) 3.9(1.6-9.3) 2.6(1.0-6.4)
Diabetesb 318(12.8) 1,303(5.3) 2.6(2.3-3.0) 2.6(2.2-2.9)
Diseases of the nervous system
Epilepsy and Status epilepticus 125(5.0) 264(1.1) 4.9(3.9-6.1) 4.4(3.5-5.5)
Cardiovascular diseases
Cardiac arrhythmias 84(3.4) 220(0.9) 3.9(3.0-5.1) 4.2(3.3-5.6)
Cerebrovascular diseases 96(3.8) 468(1.9) 2.1(1.7-2.6) 1.8(1.4-2.3)
Hypertensive diseases 359(14.5) 2,605(10.5) 1.4(1.3-1.6) 1.5(1.3-1.7)
Ischaemic heart disease 160(6.5) 1,161(4.6) 1.4(1.2-1.7) 1.2(0.9-1.4)
Digestive diseases
Pancreatitis 83(3.4) 49(0.2) 17.5(12.2-25.0) 15.4(10.6-22.5)
Cholelithiasis 81(3.3) 271(1.1) 3.1(2.4-3.9) 3.1(2.4-4.1)
Injuries
Unintentional injuriesc 790 (31.8) 2,752 (11.1) 3.7(3.4-4.1) 3.7(3.4-4.1)
Intentional injury/self-harmd 236 (9.5) 319 (1.3) 8.1 (6.8-9.6) 6.5(5.4-7.8)

23
Table 5: The proportion of patients presenting with each examined condition at different
periods before cirrhosis diagnosis with OR (95% CI) comparing cases to controls.
Time to diagnosis At risk
cases
n(%)
At risk
controls
n(%)
OR (95% CI)
Unadjusted Adjusted*
Malignant neoplasms
0-12months 38 (1.5) 83 (0.3) 4.6(3.1-6.8) 5.1(3.4-7.8)
13mths- 2yrs 9(0.4) 61(0.3) 1.4(0.7-2.8) 1.9(0.9-3.9)
3-5yrs 11(0.8) 68(0.6) 1.3(0.7-2.5) 1.6(0.8-3.1)
6-10yrs - 40(1.2) - -
Diabetes
0-12months 78 (3.2) 207 (0.8) 3.8(2.9-5.0) 3.9(2.9-5.1)
13mths- 2yrs 52 (2.4) 183(0.9) 2.7(1.9-3.7) 2.3(1.7-3.2)
3-5yrs 61(4.4) 228(2.0) 2.2(1.7-3.0) 2.1(1.5-2.8)
6-10yrs 28(5.9) 109(3.2) 1.9(1.2-2.9) 1.7(1.1-2.6)
Nervous system diseases
0-12months 38(1.5) 39(0.2) 9.9(6.3-15.5) 9.7(6.0-15.7)
13mths- 2yrs 13(0.6) 35(0.2) 3.5(1.8-6.6) 2.4(1.2-4.6)
3-5yrs 13(0.9) 42(0.4) 2.6(1.4-4.8) 2.4(1.2-4.6)
6-10yrs 18(3.7) 22(0.6) 6.0(3.2-11.3) 5.6(2.8-11.0)
Cardiovascular diseases
0-12months 96(3.9) 681(2.8) 1.4(1.1-1.8) 1.4(1.1-1.7)
13mths- 2yrs 71(3.3) 559(2.8) 1.2(0.9-1.5) 1.1(0.8-1.4)
3-5yrs 125(9.1) 827(7.2) 1.3(1.1-1.5) 1.2(0.9-1.5)
6-10yrs 71(14.7) 337(9.8) 1.6(1.2-2.1) 1.4(1.1-1.9)
Digestive diseases
0-12months 68(2.7) 63(0.3) 11.1(7.8-15.7) 11.9(8.3-17.2)
13mths- 2yrs 21(0.9) 49(0.2) 4.0(2.4-6.8) 3.3(1.9-5.7)
3-5yrs 23(1.7) 67(0.6) 2.9(1.8-4.6) 2.9(1.8-4.9)
6-10yrs 8(1.7) 29(0.8) 1.9(0.9-4.3) 1.7(0.8-4.0)
Unintentional injuries
0-12months 198(7.9) 525(2.1) 4.0(3.4-4.8) 3.9(3.2-4.6)
13mths- 2yrs 124 (5.8) 418(2.1) 2.9(2.4-3.5) 2.7(2.2-3.3)
3-5yrs 148(10.7) 701(6.1) 1.8(1.5-2.2) 1.8(1.5-2.2)
6-10yrs 94(19.5) 297(8.7) 2.5(1.9-3.3) 2.6(2.0-3.4)
Intentional injury/self-harm
0-12months 29(1.2) 73(0.3) 4.0(2.6-6.2) 3.0(1.9-4.7)
13mths- 2yrs 40(1.9) 53(0.3) 7.2(4.8-10.9) 5.9(3.8-9.0)
3-5yrs 50(3.6) 55(0.5) 7.8(5.3-11.5) 6.3(4.2-9.6)
6-10yrs 32(6.6) 32(0.9) 7.6(4.6-12.5) 6.8(3.9-11.7)
Numbers at risk within each analyses time period
0-12months 2,479 (100.0) 24,790 (100.0)
13months-2years 2,151 (86.8) 20,162 (81.3)
3-5years 1,377(55.6) 11,422(46.1)
6-10years 482 (19.4) 3,432(13.8)
*Adjustment for age, sex and smoking status
- number within cell <5