osvaldo rosales - amcham chile · before the crisis (2003-2008)…. three simultaneous...
TRANSCRIPT

Osvaldo RosalesOsvaldo RosalesDirector, Trade and Integration Division
ECLAC
AMCHAM-Chile
July 14th, 2010

2

Before the crisis (2003-2008)….� Three simultaneous macroeconomic developments:
o Sound fiscal policies and a better public debt profile
o More flexible exchange rates and unprecedentedly high international reserves (+150% between 2003 and 2008)
o A regional current-account surplus with economic growth
� Ready access to external financing� Ready access to external financing� Increase in trade (M + X) (value: 138%/volume: 49%)� Terms of trade improved by 25% in the region� Per capita GDP grew by more than 3% per year for five
consecutive years� Unemployment diminished from 11% to 7.5% with job
quality� Poverty rates fell by 10 percentage points (from 44% to
34%)

Region’s real economy has been severely
affected: trade, remittances, tourism, FDI
1%
15% 14% 13%
0%0%
10%
20%
Latin America and the Caribbean: Year-on-year change in goods and services exports,
foreign direct investment and remittances, 2008 and 2009
-10%
-15% -15%
-37%
-13%
-40%
-30%
-20%
-10%
0%
Export volume Price of export goods
Services exports
Foreign Direct Investment
Remittances
2008 2009
4Source: ECLAC.

The region’s goods exports and imports fell 23% and 25%, respectively, in 2009, after an increase of 16% and 22% in 2008
LATIN AMERICA AND THE CARIBBEAN: MERCHANDISE EXPORT GROWTH 2008 AND 2009
(Growth rates relative to the same period in the previous year)
Exports Imports
9%
7%
17%
-9%
-21%
-30%
Central America
Mexico
Caribbean countries
14%
9%
21%-23%
-24%
-25%Central America
Mexico
Caribbean countries
Source: ECLAC, based on official sources.
16%
22%
25%
7%
9%
-23%
-24%
-22%
-20%
-20%
-9%
-2%
30%-28%
-40% -20% 0% 20% 40%
Latin America and the Caribbean
South America
MERCOSUR
Andean countries
Chile
Mexico and Central America
Central America
2008-2007 2009-2008
22%
34%
41%
23%
31%
10%
14%
-21%
-25%
-24%
-31%
-27%
-26%
-25%
-40% -20% 0% 20% 40% 60%
Latin America and the Caribbean
South America
MERCOSUR
Andean countries
Chile
Mexico and Central America
Central America
2008-2007 2009-2008

Among its major trade partners, exports to Asia fell the least
LATIN AMERICA AND THE CARIBBEAN: MERCHANDISE EXPORT GROWTH 2008 AND 2009,
BY DESTINATION AND ORIGIN
(Growth rates relative to the same period in the previous year)
Exports Imports
18%
24%
-14%
-28%
Other Asia countries
LAC
19%
21%
-26%
-25%
Other Asia countries
LAC
Source: ECLAC, based on official sources.
16%
9%
15%
21%
25%
-23%
-26%
-28%
-6%
6%
-40% -20% 0% 20% 40%
World
United States
European Union
Asia
China
2008 - 2007 2009 - 2008
22%
17%
24%
24%
32%
-25%
-25%
-23%
-21%
-16%
-40% -20% 0% 20% 40%
World
United States
European Union
Asia
China
2008 - 2007 2009 - 2008

Intra-regional trade remains below the peak levels reached prior to
the Asian Crisis… and in 2009 it fell even more than total trade
25%
30%
35%Andean Community MERCOSURCentr. American Common Mkt CARICOM
LATIN AMERICA AND THE CARIBBEAN: INTRAREGIONAL TRADE, 1986-2009(As a share of each group or subregion’s total exports)
0%
5%
10%
15%
20%
25%
198
6
198
7
198
8
198
9
199
0
199
1
199
2
199
3
199
4
199
5
199
6
199
7
199
8
199
9
200
0
200
1
200
2
200
3
200
4
200
5
200
6
200
7
200
8
200
9p
7Source: ECLAC based on COMTRADE.

The drop in LAC exports has no recent precedent.
The nearest parallel happened 70 years ago
Latin America and the Caribbean: price and quantity of exports
1931-2009 (Annual growth rates)
40
60
80
Source: ECLAC, based on official sources. 2009 projections from ECLAC International Trade and Integration Division
-40
-20
0
20
40
1931
1934
1937
1940
1943
1946
1949
1952
1955
1958
1961
1964
1967
1970
1973
1976
1979
1982
1985
1988
1991
1994
1997
2000
2003
2006
2009
quantity price
8
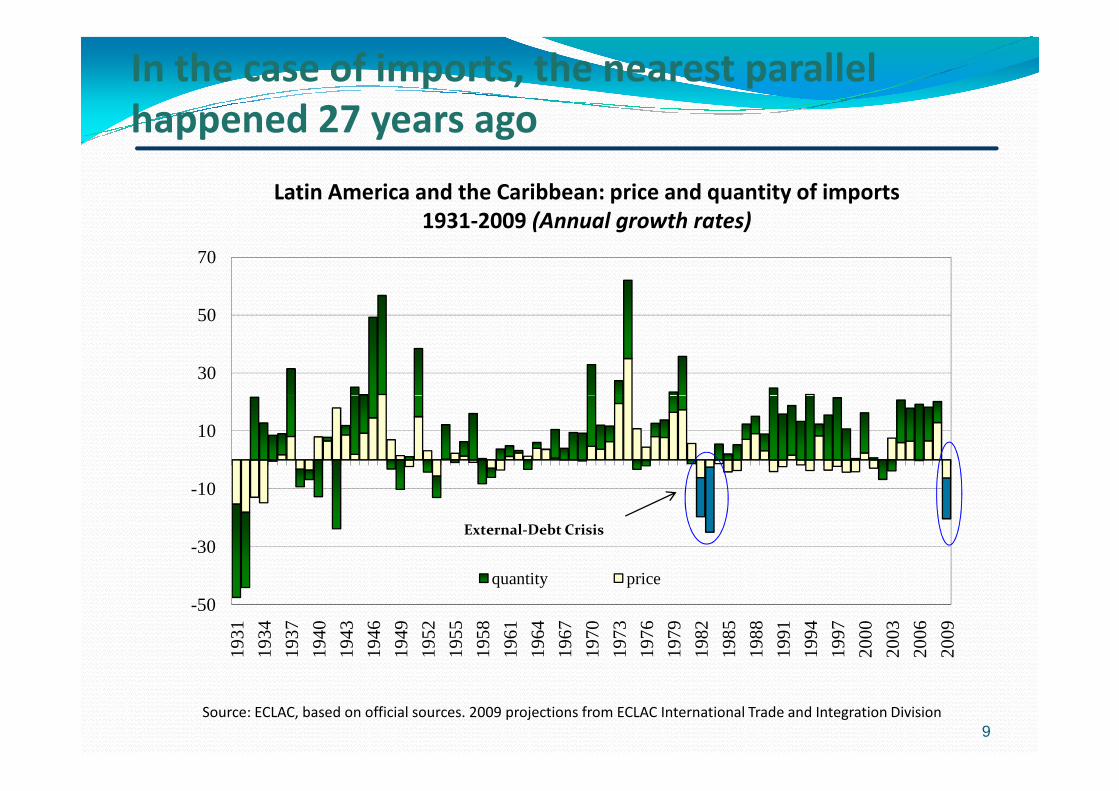
In the case of imports, the nearest parallel
happened 27 years ago
30
50
70
Latin America and the Caribbean: price and quantity of imports
1931-2009 (Annual growth rates)
-50
-30
-10
10
1931
1934
1937
1940
1943
1946
1949
1952
1955
1958
1961
1964
1967
1970
1973
1976
1979
1982
1985
1988
1991
1994
1997
2000
2003
2006
2009
quantity price
External-Debt Crisis
Source: ECLAC, based on official sources. 2009 projections from ECLAC International Trade and Integration Division
9

But recovery has already started…� For 2010 ECLAC predicts an average GDP growth of 4.3%
� Regional exports for the second half of 2009 fell by 15% in value respect to the same period of 2008, but it grew 4.7% in December over November of 2009.
� For 2010 ECLAC predicts trade growth between 5 and 6% in terms of volumeterms of volume
� Terms of Trade for the region would improve 3,8% in 2010, stimulated principally by hydrocarbons and metals in South America and Mexico.
� Though current account balance might worsen in 2010 –thanks to faster increases in imports –, recovery in financial inflows, especially FDI, would compensate for the deficit.
10

60,000
70,000
80,000
90,000
Ba lance Exports Imports
LAC exports and imports, which fell drastically as a result of the
crisis, begin to recover to a pre-crisis level
LATIN AMERICA AND THE CARIBBEAN: EVOLUTION OF TRADE IN GOODS
(in million of dollars)January 2006-December 2009
-10,000
0
10,000
20,000
30,000
40,000
50,000
60,000
Jan
/06
Fe
b/0
6M
ar/
06
Ap
r/0
6M
ay
/06
Jun
/06
Jul/
06
Au
g/0
6S
ep
/06
Oc
t/0
6N
ov
/06
De
c/0
6Ja
n/0
7F
eb
/07
Ma
r/0
7A
pr/
07
Ma
y/0
7Ju
n/0
7Ju
l/0
7A
ug
/07
Se
p/0
7O
ct/
07
No
v/0
7D
ec
/07
Jan
/08
Fe
b/0
8M
ar/
08
Ap
r/0
8M
ay
/08
Jun
/08
Jul/
08
Au
g/0
8S
ep
/08
Oc
t/0
8N
ov
/08
De
c/0
8Ja
n/0
9F
eb
/09
Ma
r/0
9A
pr/
09
Ma
y/0
9Ju
n/0
9Ju
l/0
9A
ug
/09
Se
p/0
9O
ct/
09
No
v/0
9D
ec
/09
Source: ECLAC, based on official sources.

20,000
30,000
40,000
50,000
60,000
Balance Exports Imports
Recovery has been quicker for South America, benefitting
from a strong demand of commodities by China
40,000
50,000
60,000
Balance Exports Imports
SOUTH AMERICA : EVOLUTION OF TRADE IN GOODS (in million of dollars)
January 2006-December 2009
MEXICO AND CENTRAL AMERICA: EVOLUTION OF TRADE IN GOODS
(in million of dollars)January 2006-December 2009
-10,000
0
10,000
Jan
/06
Fe
b/0
6M
ar/
06
Ap
r/0
6M
ay
/06
Jun
/06
Jul/
06
Au
g/0
6S
ep
/06
Oc
t/0
6N
ov
/06
De
c/0
6Ja
n/0
7F
eb
/07
Ma
r/0
7A
pr/
07
Ma
y/0
7Ju
n/0
7Ju
l/0
7A
ug
/07
Se
p/0
7O
ct/
07
No
v/0
7D
ec
/07
Jan
/08
Fe
b/0
8M
ar/
08
Ap
r/0
8M
ay
/08
Jun
/08
Jul/
08
Au
g/0
8S
ep
/08
Oc
t/0
8N
ov
/08
De
c/0
8Ja
n/0
9F
eb
/09
Ma
r/0
9A
pr/
09
Ma
y/0
9Ju
n/0
9Ju
l/0
9A
ug
/09
Se
p/0
9O
ct/
09
No
v/0
9D
ec
/09
-10,000
0
10,000
20,000
30,000
40,000
Jan
/06
Fe
b/0
6M
ar/
06
Ap
r/0
6M
ay
/06
Jun
/06
Jul/
06
Au
g/0
6S
ep
/06
Oc
t/0
6N
ov
/06
De
c/0
6Ja
n/0
7F
eb
/07
Ma
r/0
7A
pr/
07
Ma
y/0
7Ju
n/0
7Ju
l/0
7A
ug
/07
Se
p/0
7O
ct/
07
No
v/0
7D
ec
/07
Jan
/08
Fe
b/0
8M
ar/
08
Ap
r/0
8M
ay
/08
Jun
/08
Jul/
08
Au
g/0
8S
ep
/08
Oc
t/0
8N
ov
/08
De
c/0
8Ja
n/0
9F
eb
/09
Ma
r/0
9A
pr/
09
Ma
y/0
9Ju
n/0
9Ju
l/0
9A
ug
/09
Se
p/0
9O
ct/
09
No
v/0
9D
ec
/09
Source: ECLAC, based on official sources.

LAC is lagging behind in international competitiveness…
8486
8892
98103104105
115118
120124
GuatemalaJamaica
ArgentinaTrinidad & Tobago
Dom. Rep.Suriname
EcuadorVenezuela, B.R.
GuyanaBolivia, P.S.
NicaraguaParaguay
Selected countries: Ranking in the WEF Global Competitiveness Index, 2008-09
46
1518
2224
2847
585960
647475
79828384
0 20 40 60 80 100 120 140
SwedenFinlandNorway
AustraliaIreland
N. ZealandChile
BarbadosPanama
Costa RicaMexico
BrazilColombiaUruguay
El SalvadorHonduras
PeruGuatemala
Better
13Source: WEF Global Competitiveness Report 2008-2009.

…and also in technological readiness
788182
8789
9596
100106
117122
125128
El SalvadorTrinidad y Tobago
GuatemalaArgentina
PerúHonduras
Venezuela, R.B.Guyana
EcuadorSurinamParaguay
NicaraguaBolivia, E.P.
Selected countries: Ranking in the WEF Network Readiness Index, 2008-09
26
814
2223
3639
5356
5964656667
7578
0 20 40 60 80 100 120 140
SwedenFinlandNorway
AustraliaN. Zealand
IrelandBarbados
ChileJamaicaC. Rica
BrazilColombiaUruguayPanamáMéxico
Rep. DominicanaEl Salvador
Better
14Source: WEF Global Competitiveness Report 2008-2009.

And there is a long way to go in trade facilitation
Chile &
Mexico
OECD
Korea
Singapore
Chile & Panama
Mexico
OECD
Korea
Singapore
Time to export and import
(days)
Cost to export and import
(US Dollars per container)
0 10 20 30 40
Andean countries
MERCOSUR
Central America
Caribbean
Chile & Panama
Time to import Time to export
0 500 1000 1500 2000 2500
Andean countries
MERCOSUR
Central America
Caribbean
Chile & Panama
Cost to import Cost to export
15
Source: ECLAC based on World Bank, Doing Business 2010.
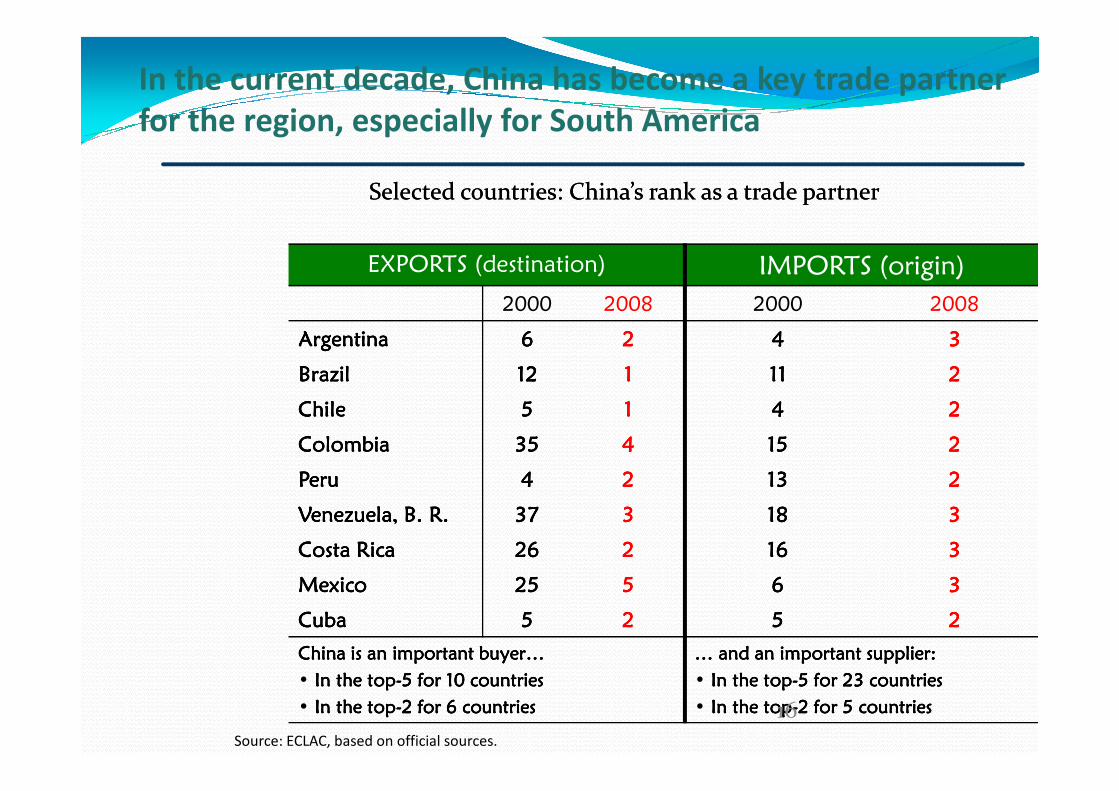
EXPORTS (destination) IMPORTS (origin)
2000 2008 2000 2008
ArgentinaArgentinaArgentinaArgentina 6666 2222 4444 3333
BrazilBrazilBrazilBrazil 12121212 1111 11111111 2222
In the current decade, China has become a key trade partner
for the region, especially for South America
Selected countries: China’s rank as a trade partnerSelected countries: China’s rank as a trade partner
ChileChileChileChile 5555 1111 4444 2222
ColombiaColombiaColombiaColombia 35353535 4444 15151515 2222
PeruPeruPeruPeru 4444 2222 13131313 2222
Venezuela, B. R.Venezuela, B. R.Venezuela, B. R.Venezuela, B. R. 37373737 3333 18181818 3333
Costa RicaCosta RicaCosta RicaCosta Rica 26262626 2222 16161616 3333
MexicoMexicoMexicoMexico 25252525 5555 6666 3333
CubaCubaCubaCuba 5555 2222 5555 2222
China is an important buyer… China is an important buyer… China is an important buyer… China is an important buyer…
• In the topIn the topIn the topIn the top----5 for 10 countries5 for 10 countries5 for 10 countries5 for 10 countries
• In the topIn the topIn the topIn the top----2 for 6 countries2 for 6 countries2 for 6 countries2 for 6 countries
… and an important supplier:… and an important supplier:… and an important supplier:… and an important supplier:
• In the topIn the topIn the topIn the top----5 for 23 countries5 for 23 countries5 for 23 countries5 for 23 countries
• In the topIn the topIn the topIn the top----2 for 5 countries2 for 5 countries2 for 5 countries2 for 5 countries
Source: ECLAC, based on official sources.
16

LAC, as an increasing trade partnership of China
Trade growth rates, key regional partners, 1995-2009 (Average
annual rates) Trade Partners
Regions 1990-1995 1995-2000 2000-2005 2005-2009 (1)
Latin America and the Caribbean 32.2 17.8 26.8 26.1
Asia Pacific (2) 26.5 9.3 20.3 11.6
United States 36.7 16.1 25.6 10.2
European Union 26.3 15.0 28.8 14.9
Rest of the World 8.6 7.1 26.6 14.3
World 19.1 10.9 25.0 13.4
Exports
17
Source: Economic Commission for Latin America and the Caribbean (ECLAC), on the basis of the United Nations
statistical database on merchandise trade (COMTRADE) and DOTs (IMF)
Notes: (1) corresponds to DOTs data for January to November and moving average estimates for December. (2)
Includes ASEAN, Australia, Republic of Korea, Japan and New Zealand.
World 19.1 10.9 25.0 13.4
Latin America and the Caribbean 14.5 12.7 37.6 22.8
Asia Pacific (2) 32.4 12.2 23.9 7.1
United States 19.7 6.8 16.8 10.2
European Union 18.2 7.6 18.8 14.4
Rest of the World 11.2 13.4 26.8 14.5
World 19.9 11.3 24.0 11.7
Imports
17

Share of Asia-Pacific (17)a and China in the total exports of Latin American countries,
2001-2006 (% of the total exports of each country)
2000 2009
18
Source: Economic Commission for Latin America and the Caribbean (ECLAC), on the basis of information from the
United Nations Commodity Trade Database (COMTRADE).a Asia Pacific (17) includes Australia, Brunei Darussalam, Cambodia, Hong Kong (Special Administrative Region of
China), India, Indonesia, Japan, Lao PDR, Malaysia, Myanmar, New Zealand, Philippines, Republic of Korea,
Singapore, Taiwan Province of China, Thailand, and Viet Nam.
18

Latin America and the Caribbean (16 countries):
share of the main destinations in total exports,
2000-2020(In percentages)
19
Source: Economic Commission for Latin America and the Caribbean (ECLAC), based on data from the
COMTRADE database and national sources.
Notes: the 16 countries are: Argentina, Bolivia (Plurinational State), Brazil, Chile, Colombia, Costa Rica,
Ecuador, El Salvador, Guatemala, Honduras, Mexico, Panama, Paraguay, Peru, Uruguay, Venezuela
(Bolivarian Republic of). Estimates and projections based on GDP growth rates for the years 2000-2009
in the United States, European Union, China, Latin America and the Caribbean, Asia Pacific, and Rest of
World. It is expected a growth rate of trade which converges to the economies' long-term growth rate.
19

Latin America and the Caribbean (16 countries):
share of the main sources of total imports,
2000-2020(In percentages)
20
Source: Economic Commission for Latin America and the Caribbean (ECLAC), based on data from the
COMTRADE database and national sources.
Notes: the 16 countries are: Argentina, Bolivia (Plurinational State), Brazil, Chile, Colombia, Costa Rica,
Ecuador, El Salvador, Guatemala, Honduras, Mexico, Panama, Paraguay, Peru, Uruguay, Venezuela
(Bolivarian Republic of). Estimates and projections based on GDP growth rates for the years 2000-2009
in the United States, European Union, China, Latin America and the Caribbean, Asia Pacific, and Rest of
World. It is expected a growth rate of trade which converges to the economies' long-term growth rate.
20

Latin America and the Caribbean: Three leading Latin America and the Caribbean: Three leading export products for Selected Countries, by Country export products for Selected Countries, by Country
or Region of Destination, 2004or Region of Destination, 2004--20062006(Percentages)
Asia-Pacific European Union China United States World
Argentina 57.8% 44.9% 83.4% 24.6% 21.9%
Brazil 34.4% 22.1% 55.7% 13.9% 12.2%
Chile 71.7% 65.4% 85.8% 47.5% 55.3%
Costa Rica 89.8% 56.8% 94.2% 36.2% 30.0%Costa Rica 89.8% 56.8% 94.2% 36.2% 30.0%
Guatemala 86.7% 74.7% 97.5% 45.2% 23.8%
Mexico 20.3% 46.3% 47.6% 23.8% 24.8%
Peru 61.9% 41.5% 70.6% 51.3% 40.0%
Source: ECLAC, on the basis of information from the United Nations Commodity Trade Database (COMTRADE).
21

Higher quality in the exports oriented to US markets
…more tech intensity in LAC EXPORTS
US EU AP
Primary products
26% 46% 59%
NRBM 12% 29% 24%
LTM 11% 5% 3%LTM 11% 5% 3%
MTM 30% 15% 9%
HTM 19% 4% 5%
22
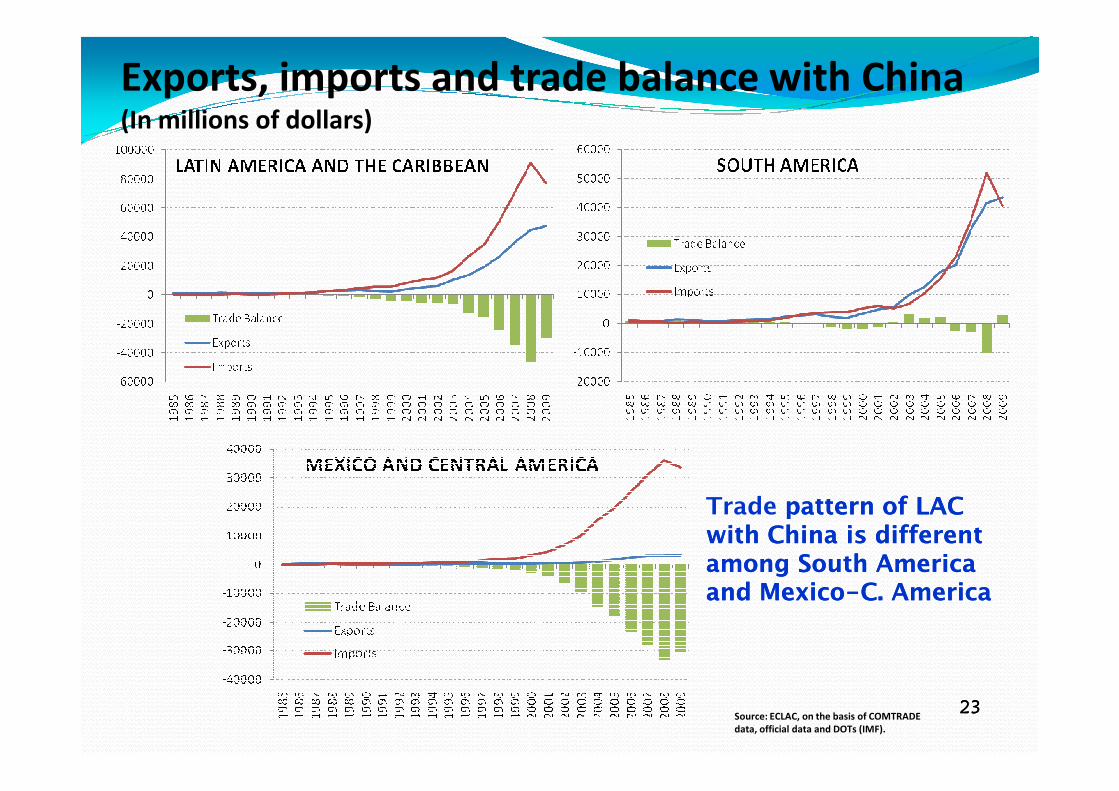
Exports, imports and trade balance with China(In millions of dollars)
23Source: ECLAC, on the basis of COMTRADE
data, official data and DOTs (IMF).
Trade patternpattern of LAC of LAC withwith China China isis differentdifferentamongamong South South AmericaAmericaand and MexicoMexico--C. C. AmericaAmerica
23

Official visits of Head of States are growingOfficial visits of Head of States are growingOfficial visits of Head of States are growingOfficial visits of Head of States are growing
24

Summary of the trade relationship with China
� Asymetry between levels of trade and investment
� Asymetry between South America and Mexico-C America
� Few products explain the majority of exports
� Mainly natural resources¨; low technology content
� Trade flows almost exclusively inter-industry
� Asymetry between the organized Chinese agenda for LAC and the LAC reaction, without regional coordination
� China displacing EU as second trade partner of LAC by 2015.� China displacing EU as second trade partner of LAC by 2015.
� Backward trend in export diversification
� Risks of “Dutch disease”
� Risk to reinforce the inter-industry specialization with China
� Complacency with the cycle of commodities, delaying choices of industrial and innovation policies
� Loosing opportunities to advance on internationalization of enterprises, fostering linkages between services, manufactures and natural resources
25

Regional scenarios on trade
� In 2012, 9 LA countries will have FTA with US� Colombia &Panama pending
� 11 or 16 with EU (depending on Mercosur)
� 15 trade agreements will link 5 LA countries with 11 � 15 trade agreements will link 5 LA countries with 11 Asian economies
� Plus a lot of regional agreements within LAC � Demand of convergence
26

FTAs with US in the AmericasFTAs with US in the AmericasFTAs with US in the AmericasFTAs with US in the Americas
CanadáCanadáCanadáCanadá
27
ChileChileChileChile
PerúPerúPerúPerú
ColombiaColombiaColombiaColombiaCostaCostaCostaCosta RicaRicaRicaRica
NicaraguaNicaraguaNicaraguaNicaraguaEl SalvadorEl SalvadorEl SalvadorEl Salvador
HondurasHondurasHondurasHonduras República República República República DominicanaDominicanaDominicanaDominicanaGuatemalaGuatemalaGuatemalaGuatemala
MéxicoMéxicoMéxicoMéxico
EcuadorEcuadorEcuadorEcuador
PanamáPanamáPanamáPanamá
OSVALDO ROSALES27
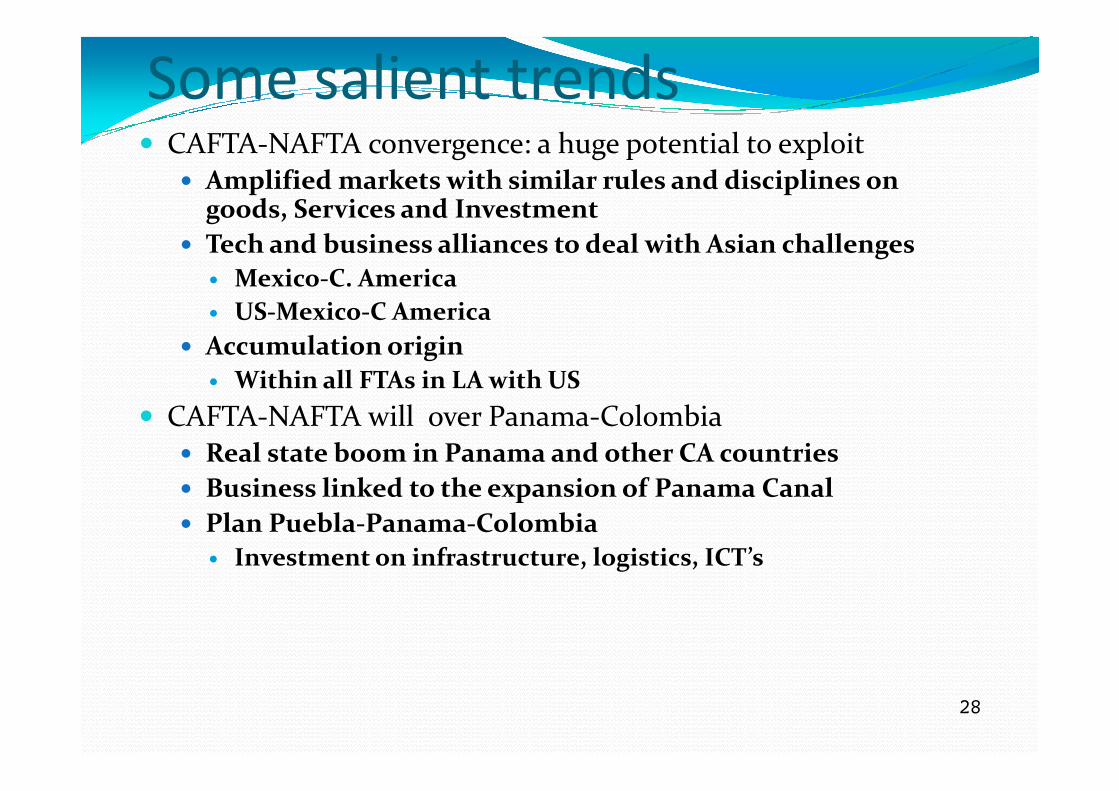
Some salient trends � CAFTA-NAFTA convergence: a huge potential to exploit
� Amplified markets with similar rules and disciplines on goods, Services and Investment
� Tech and business alliances to deal with Asian challenges
� Mexico-C. America
� US-Mexico-C America
� Accumulation origin
� Within all FTAs in LA with US
� CAFTA-NAFTA will over Panama-Colombia� Real state boom in Panama and other CA countries
� Business linked to the expansion of Panama Canal
� Plan Puebla-Panama-Colombia
� Investment on infrastructure, logistics, ICT’s
28
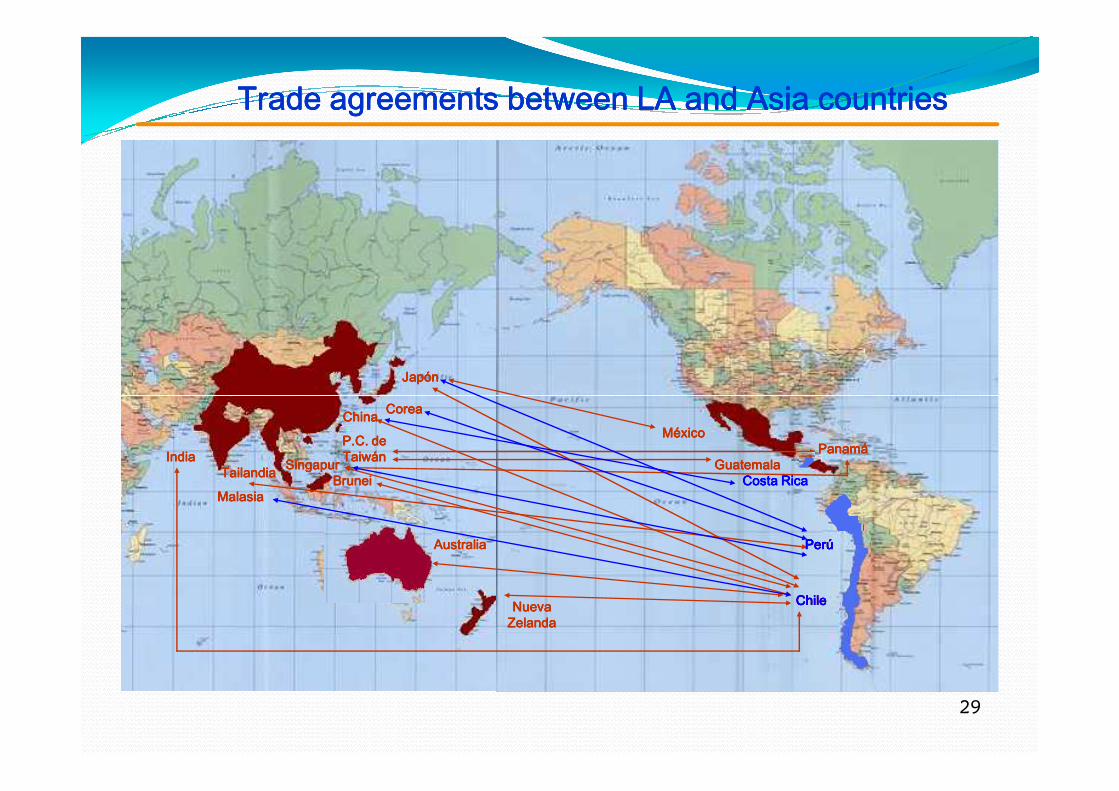
JapónJapónJapónJapón
Trade agreements between LA and Asia countriesTrade agreements between LA and Asia countriesTrade agreements between LA and Asia countriesTrade agreements between LA and Asia countries
TailandiaTailandiaTailandiaTailandia
P.C. de P.C. de P.C. de P.C. de TaiwánTaiwánTaiwánTaiwán
CoreaCoreaCoreaCoreaChinaChinaChinaChina
BruneiBruneiBruneiBruneiSingapurSingapurSingapurSingapur
Nueva Nueva Nueva Nueva ZelandaZelandaZelandaZelanda
IndiaIndiaIndiaIndia
MalasiaMalasiaMalasiaMalasia
ChileChileChileChile
PerúPerúPerúPerú
PanamáPanamáPanamáPanamáMéxicoMéxicoMéxicoMéxico
GuatemalaGuatemalaGuatemalaGuatemala
AustraliaAustraliaAustraliaAustralia
Costa RicaCosta RicaCosta RicaCosta Rica
PerúPerúPerúPerú
ChileChileChileChile
29

Other Initiatives on Asia Pacific
� Latin-American Pacific Arch is a good initiative
� 11 countries: Colombia, C. Rica, Chile, Ecuador, El Salvador, Guatemala, Honduras, Mexico, Nicaragua, Panama and Peru
� Except Ecuador, 10 countries with FTA with US
� The idea: to strengthen the linkage with Asia Pacific, reinforcing the owns linkages within the region
� 4 working groups� 4 working groups
� Convergence on trade agreements
� Trade Facilitation, Infrastructure and Logistics
� Promotion and Protection of Investments
� Cooperation on Competitiveness
30
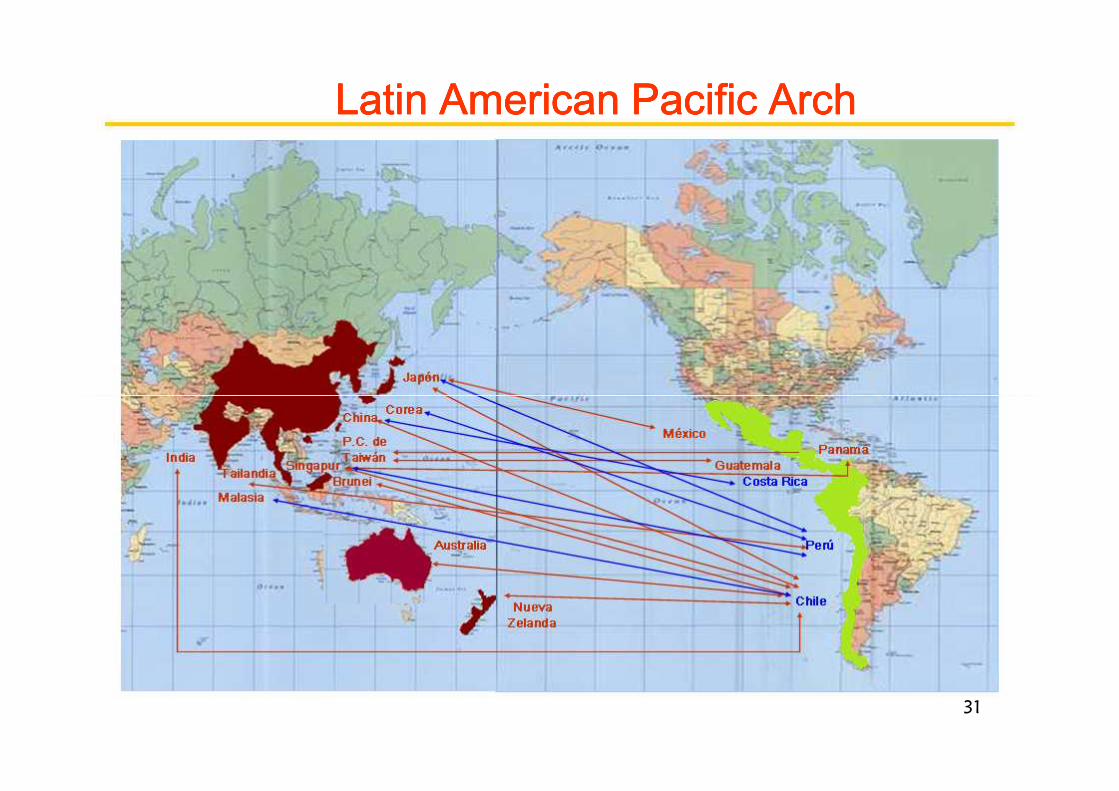
Latin American Pacific ArchLatin American Pacific ArchLatin American Pacific ArchLatin American Pacific Arch
31

The US Dilemma: How to deal with
the Chinese connection?
� Moving forward on Doha Round
� Moving pending FTAs in the Congress
� Deepening its economic and trade commitment to Deepening its economic and trade commitment to Latin America
� Put in practice the cooperative relationship with LAC “seeking an equal partnership”
� Advancing on the TPP
32

The TPP: an opportunity to reassert
the leadership of US on world
trading system� US requires flexibility and political will to move Doha
agenda
� World trading system needs leadership to deal with the new issues: trade & climate change; labor, the new issues: trade & climate change; labor, environment; security; private rules and standards
� APEC 2011 (Hawai) and the TPP are excellent opportunities to take up again the initiative
33
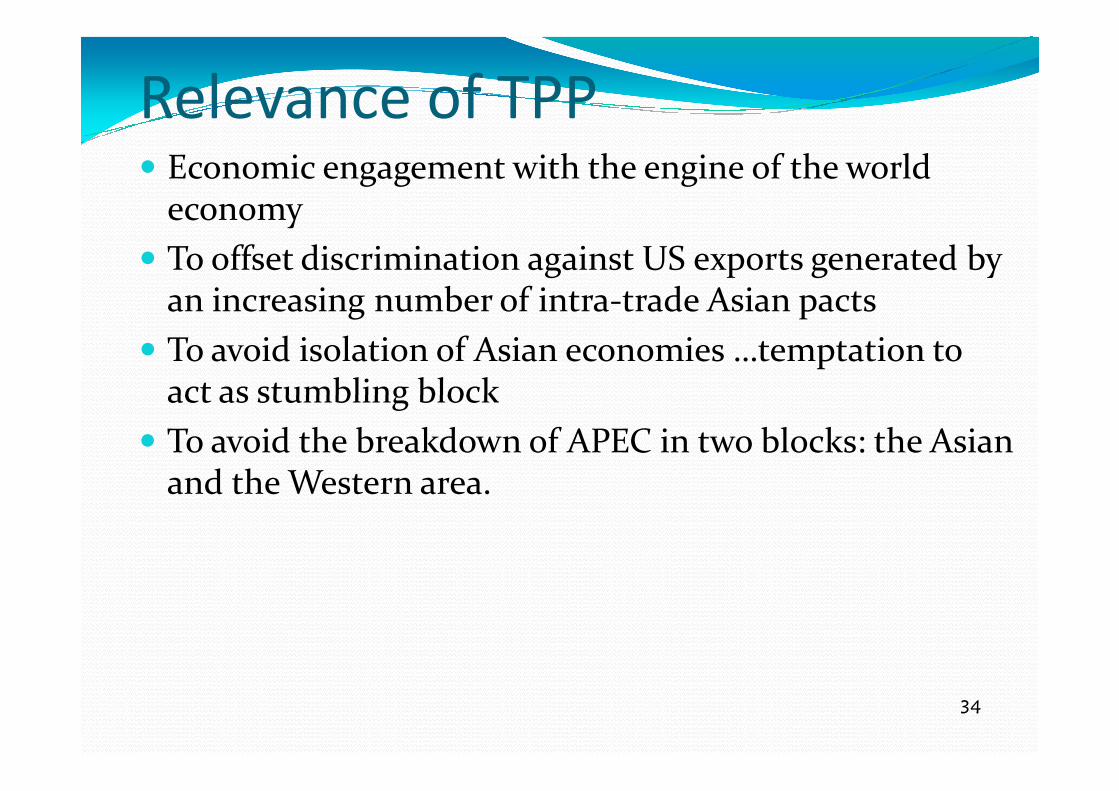
Relevance of TPP� Economic engagement with the engine of the world
economy
� To offset discrimination against US exports generated by an increasing number of intra-trade Asian pacts
� To avoid isolation of Asian economies …temptation to act as stumbling blockact as stumbling block
� To avoid the breakdown of APEC in two blocks: the Asian and the Western area.
34

Challenges for US policy (on TPP
initiative)� To approve the TPA
� To approve pending FTAs (mainly Korea,)
� Significant concessions on agriculture and textile and clothing
� Flexibility on AD
� Less pressure on the new “platinum standard”
� To avoid the bad combination: platinum standard in the new � To avoid the bad combination: platinum standard in the new issues and the tin standard in the traditional issues (agriculture, AD, public procurements, services Mode 4)
35

The challenges for the partners� If US does its homework, then the partners may be available to engage
on the initiative
� The issues
� To start new negotiations on politically sensitive issues, already settled with the US after difficult negotiations (including several non-voluntary changes after the negotiations were formally closed)
� To combine trade arrangements of different scope and depth
� To articulate the TPP with an immense web of preference � To articulate the TPP with an immense web of preference agreements
� If US does not its homework, it will be very difficult to advance in the TPP
36

The Pending Trade Agenda
with LAC� To approve pending FTAs (Colombia, Panama)
� Lower the trade barriers it still maintains to key LAC exports: agriculture, textiles and clothing, ethanol
� Be more forthcoming on the reduction of its agricultural subsidies on Doha RoundDoha Round
� Become more involved in Trade Facilitation and Aid for Trade projects, committing resources, collaborating with its FTA partners: a new way of understanding the administration of the FTAS
� Setting up trade finance squemes to support exporting SME from its FTA partners in the region
� Promoting cumulation of origin across all its FTAs in the region
37

US choices: a) indifference
� Lost opportunities
� Reduced share on LAC and Asian trade
� Loosing leadership
Protectionism against China� Protectionism against China
� No hemispheric initiatives on trade
� China gaining presence on trade and investment
� New international alliances on trade and investment
38

US choices: b) active engagement
� Pushing free trade initiatives on Doha and APEC
� Leading the TPP initiative with pragmatism, flexibility and platinum standard for all the issues
� Promoting origin accumulation among the FTA’s with Canada and LA countries
� Promoting value chains of these countries on business oriented to Asia PacificPacific
� Business and tech alliances with LA partners
� Aid for strategic trade� Administration of FTA’s
� SME’s exports
� Quality certification
� Trazability
� Training work force……� Trade Facilitation
39

Cooperation and integration are necessary to better
address the post-crisis structural problems
� Moving toward an integrated regional market would:o foster productive integration and economies of scaleo enhance the region’s attractiveness internationally
� However, the current political environment in the region does not favor large trade liberalization region does not favor large trade liberalization initiativeso Due to large differences in orientation towards “free trade”o South American FTA project has been put in the backburner
� But differences over trade issues should not impede cooperation in a series of more urgent areas:o Need to look beyond trade
40
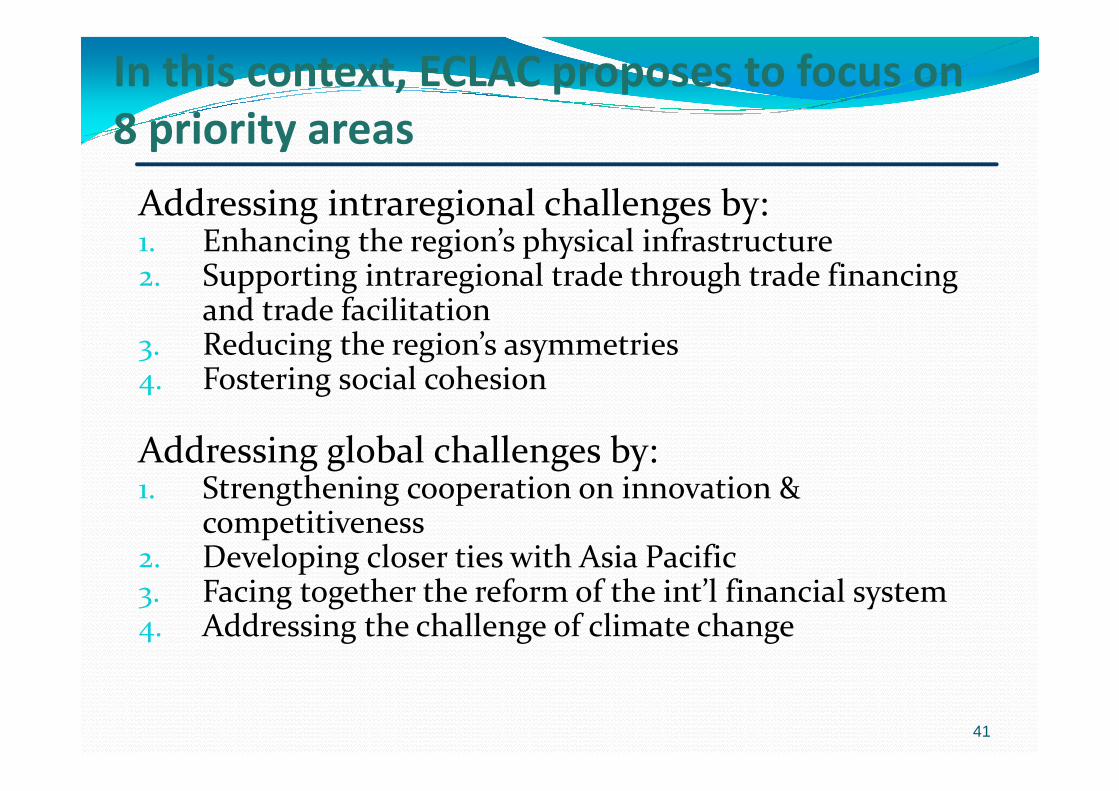
In this context, ECLAC proposes to focus on
8 priority areas
Addressing intraregional challenges by:1. Enhancing the region’s physical infrastructure2. Supporting intraregional trade through trade financing
and trade facilitation3. Reducing the region’s asymmetries4. Fostering social cohesion4. Fostering social cohesion
Addressing global challenges by:1. Strengthening cooperation on innovation &
competitiveness2. Developing closer ties with Asia Pacific3. Facing together the reform of the int’l financial system 4. Addressing the challenge of climate change
41

The new trade policy should address….
� New issueso Labor; environment; security; sanitary and phytosanitary traceability; food
safety; carbon traceability; climate change; certifications; best practices; corporate social responsibility
� Multiple objectiveso Competitiveness-innovation-sustainabilityo Internationalization of firmso Global value chainso Climate change
� Key institutional challenge is to achieve an integrated approach � Key institutional challenge is to achieve an integrated approach comprising the following policy areas:
o Trade o Productive development; Innovation and technological diffusiono FDI o Human resources (education and capacity building)o Environment
� Strengthen the role of the State in two main areas:o Address institutional coordination failureso Foster public-private partnerships for a leap in innovation and
competitiveness
42