osteocalcin and dm - 대한당뇨병학회 · 2014-06-27 · ferron m et al. pnas 2008; ... jbmm...
TRANSCRIPT
Osteocalcin and DM
정 호 연
강동 경희대 병원

osteoporosis
fractures Obesity, DM
leptin
?Endocrine feedback
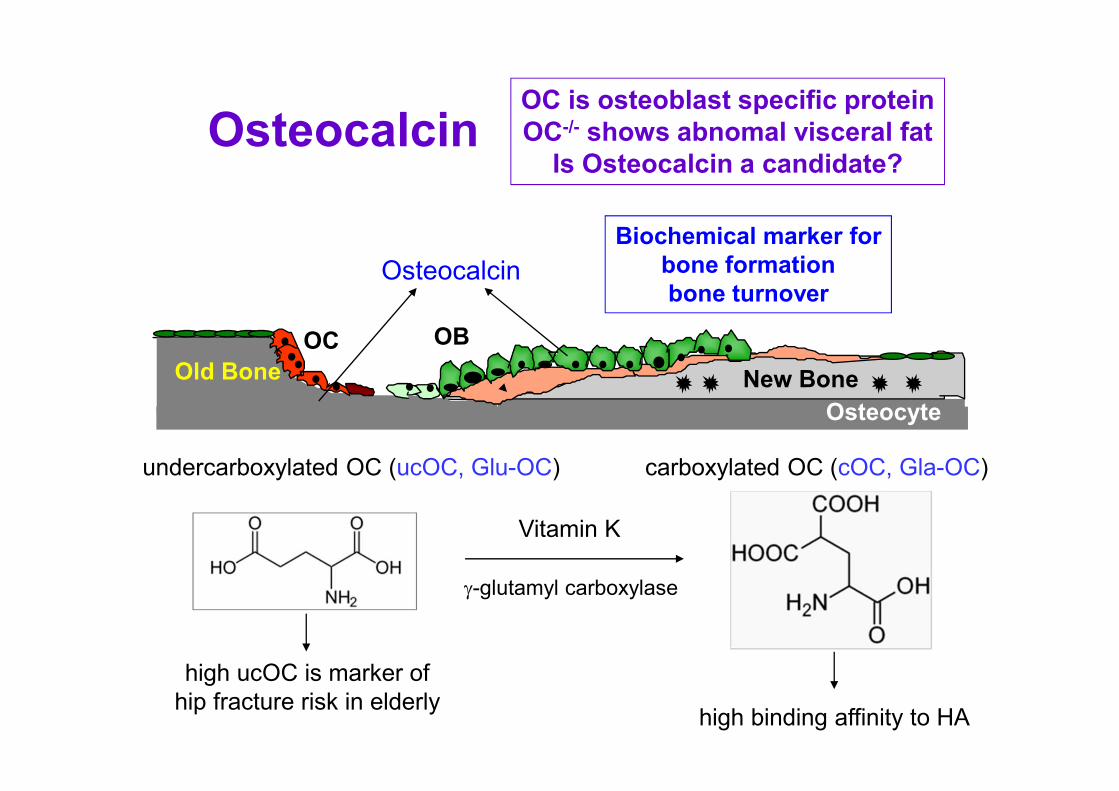
γ-glutamyl carboxylase
Vitamin K
undercarboxylated OC (ucOC, Glu-OC) carboxylated OC (cOC, Gla-OC)
OBOC
Old Bone New Bone
Osteocyte
Osteocalcin
high binding affinity to HA
Biochemical marker for
bone formation
bone turnover
Osteocalcin
high ucOC is marker of
hip fracture risk in elderly
OC is osteoblast specific protein
OC-/- shows abnomal visceral fat
Is Osteocalcin a candidate?
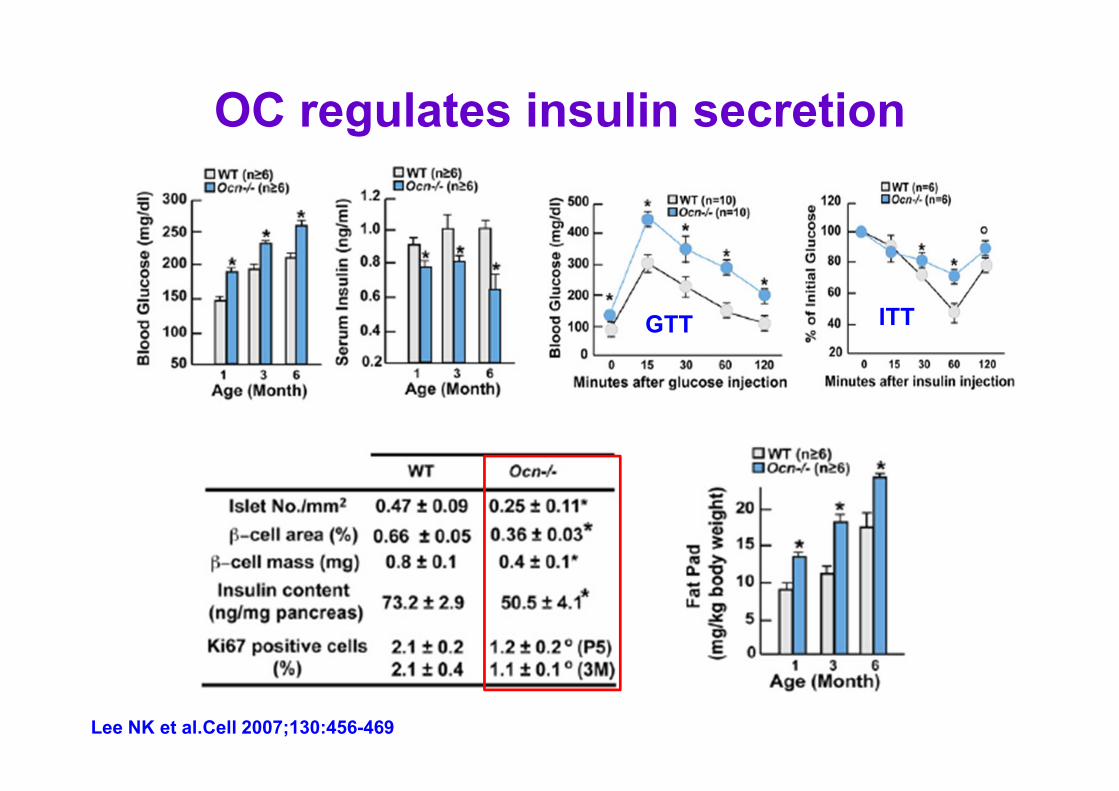
OC regulates insulin secretion
GTT ITT
Lee NK et al.Cell 2007;130:456-469
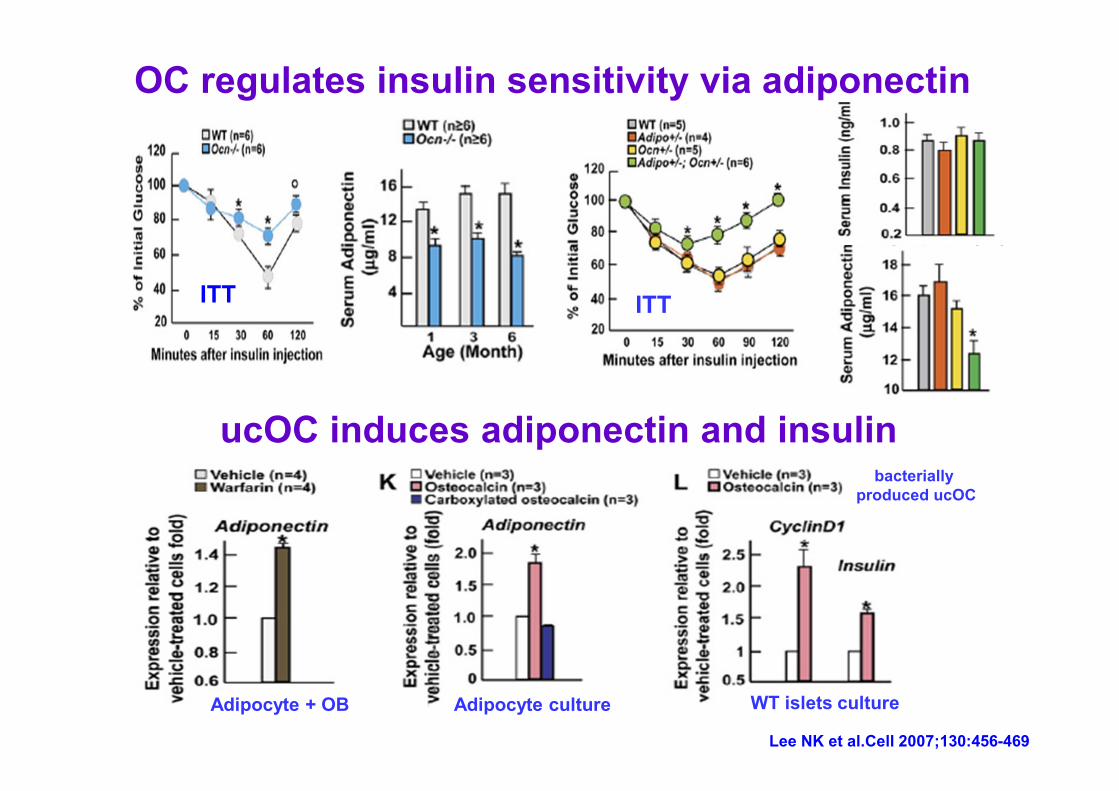
OC regulates insulin sensitivity via adiponectin
ITT
ucOC induces adiponectin and insulin
Adipocyte culture WT islets culture
bacterially
produced ucOC
Lee NK et al.Cell 2007;130:456-469
ITT
Adipocyte + OB

Does ucOC regulate energy
metabolism in WT mice?
Ferron M et al. PNAS 2008;105:5266-5270
mice implanted with osmotic pump delivering ucOC

ESP(OST-PTP) controls carboxylation of osteocalcin
Lee NK et al.Cell 2007;130:456-469
cOC

Lessons from animal studies
ESP= pseudogene in human
ucOC
OST-PTP
cOC Vitamin K
?
Insulin secretion
adiponectin
Insulin sensitivity
BonePancreas, fat tissue
cOC
ucOC
High binding
affinity

Same role of osteocalcin in human?
Hwang YC et al. Diabetes Metab Res Rev 2009;25:768-771
• 75g OGTT를 시행한 25-60세 남성 199명
• NGT (8, 4%), prediabetes (46, 23%), DM (145, 73%)
• ucOC (Glu-OC), cOC (Gla-OC) (Takara, Japan)
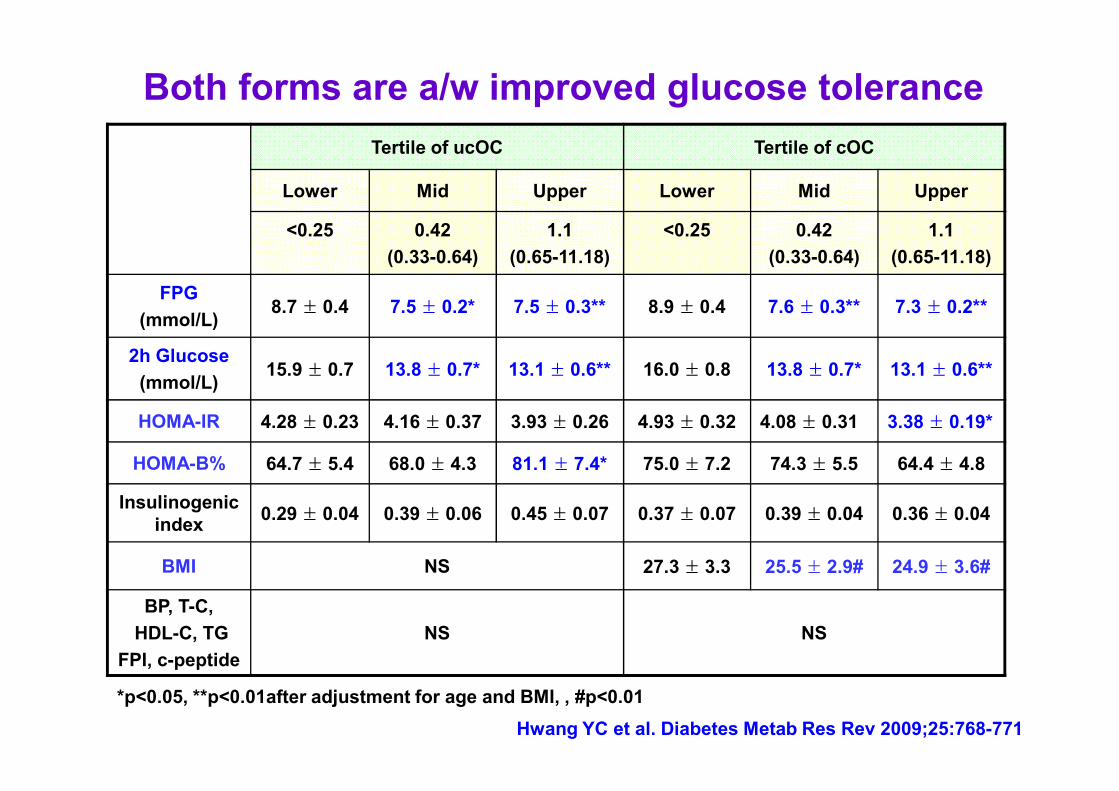
Both forms are a/w improved glucose tolerance
Tertile of ucOC Tertile of cOC
Lower Mid Upper Lower Mid Upper
<0.25 0.42
(0.33-0.64)
1.1
(0.65-11.18)
<0.25 0.42
(0.33-0.64)
1.1
(0.65-11.18)
FPG
(mmol/L)8.7 ± 0.4 7.5 ± 0.2* 7.5 ± 0.3** 8.9 ± 0.4 7.6 ± 0.3** 7.3 ± 0.2**
2h Glucose
(mmol/L)15.9 ± 0.7 13.8 ± 0.7* 13.1 ± 0.6** 16.0 ± 0.8 13.8 ± 0.7* 13.1 ± 0.6**
HOMA-IR 4.28 ± 0.23 4.16 ± 0.37 3.93 ± 0.26 4.93 ± 0.32 4.08 ± 0.31 3.38 ± 0.19*
HOMA-B% 64.7 ± 5.4 68.0 ± 4.3 81.1 ± 7.4* 75.0 ± 7.2 74.3 ± 5.5 64.4 ± 4.8
Insulinogenic
index0.29 ± 0.04 0.39 ± 0.06 0.45 ± 0.07 0.37 ± 0.07 0.39 ± 0.04 0.36 ± 0.04
BMI NS 27.3 ± 3.3 25.5 ± 2.9# 24.9 ± 3.6#
BP, T-C,
HDL-C, TG
FPI, c-peptide
NS NS
*p<0.05, **p<0.01after adjustment for age and BMI, , #p<0.01
Hwang YC et al. Diabetes Metab Res Rev 2009;25:768-771

• 75g OGTT 시행한 남자 223명, 여자 202명 (53 ± 12세)
– NGT (n=23, 5.4%),
– prediabetes (n=150, 35.3%),
– DM (n=252, 59.3%)
• total osteocalcin (Cis Bio international, France)
• adiponectin, leptin (R & D system, USA)
Role of total OC and adiponectin?
Hwang YC et al. Osteoporos Int. provisional accepted

Hwang YC et al. Osteoporos Int. provisional accepted
Lower
(n=141)
Mid
(n=143)
Upper
(n=141)p
Total OC 1.1-13 13.1-18.9 19.0-70.7 <0.001
Glucose (mg/dL) 155.0 ± 66.7 126.0 ± 30.6 118.9 ± 28.8 <0.001
Insulin (uIU/mL) 10.1 10.7 9.9 0.046
HbA1c(%) 7.7 ± 2.4 6.6 ± 1.3 6.4 ± 1.3 <0.001
HOMA-IR 3.44 3.47 2.82 0.002
HOMA-B% 58.6 74.2 75.5 <0.001
Insulinogenic
index0.18 0.29 0.32 <0.001
Adiponectin
(ug/mL)2.2 1.8 2.43 <0.001
Leptin (ug/L) 5.44 4.82 4.57 NS
Mean ± SD or median
total OC are a/w improved glucose tolerance

OR 95% CI P
Age 1.035 1.009-1.061 0.008
FPG 1.142 1.110-1.174 <0.001
Total
osteocalcin0.955 0.919-0.994 0.023
Age, gender, BMI, FPG, adiponectin, leptin and osteocalcin were included
as dependent variables
Multiple logistic regression analysis for diabetes
Osteocalcin is a/w improved glucose tolerance
independent of plasma adiponectin
Hwang YC et al. Osteoporos Int. provisional accepted
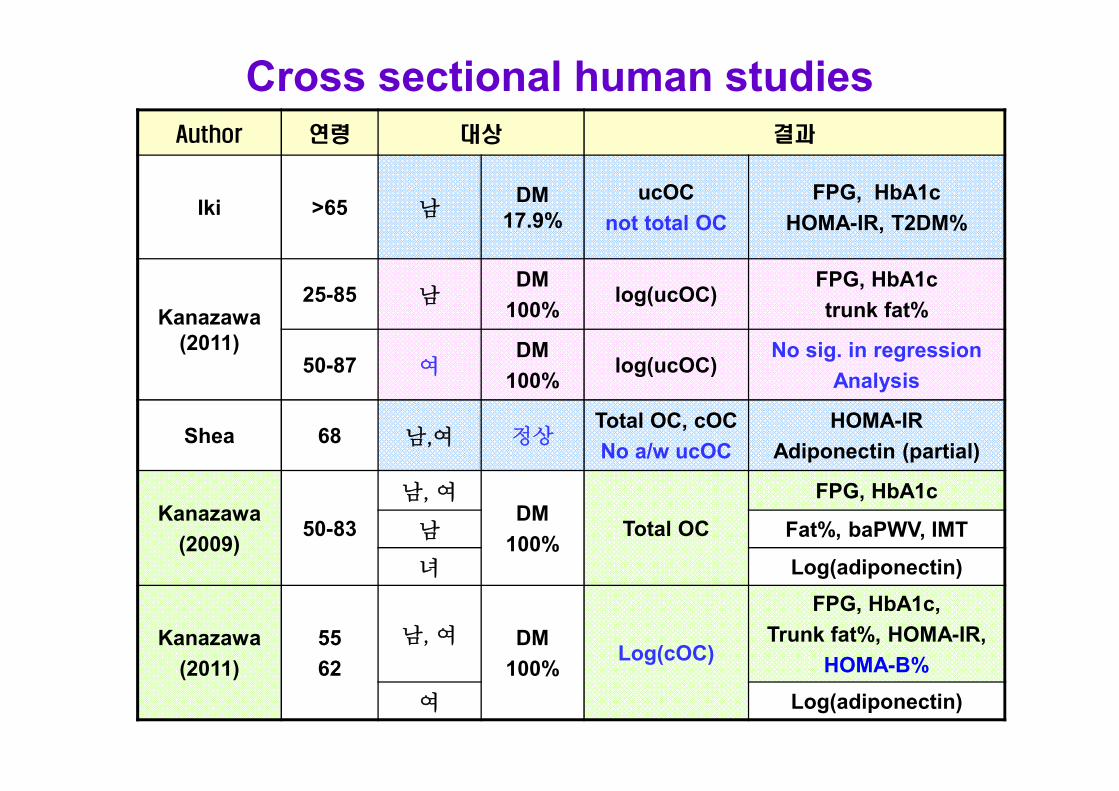
Cross sectional human studies
Author 연령 대상 결과
Iki >65 남DM
17.9%
ucOC
not total OC
FPG, HbA1c
HOMA-IR, T2DM%
Kanazawa
(2011)
25-85 남DM
100%log(ucOC)
FPG, HbA1c
trunk fat%
50-87 여DM
100%log(ucOC)
No sig. in regression
Analysis
Shea 68 남,여 정상Total OC, cOC
No a/w ucOC
HOMA-IR
Adiponectin (partial)
Kanazawa
(2009)50-83
남, 여DM
100%Total OC
FPG, HbA1c
남 Fat%, baPWV, IMT
녀 Log(adiponectin)
Kanazawa
(2011)
55
62
남, 여 DM
100%Log(cOC)
FPG, HbA1c,
Trunk fat%, HOMA-IR,
HOMA-B%
여 Log(adiponectin)

Does insulin influence osteocalcin
synthesis or activity?
ucOC
Insulin feedback mechanism ?
OB Total OC(cOC)
Insulin R

Ferron M et al. Cell 2010;142:296-308Clemens et al. JBMR 2011;26:677-680
Insulin signaling in osteoblasts and
glucose homeostasis model
foxO1 ↓

active
osteoclast
inactive
osteoclast
apoptotic
osteoclast
Antiresorptive therapy and ucOC
Inhibition of bone resorption
cOC ucOC
deleterious consequences
on glucose homeostasis ?
pH 4.5
ucOCcOCpH 4.5
Increasing pH
Antiresorptive therapy

Does antiresorptive therapy
increase blood glucose?
• Bisphosphonate 치료 골다공증 환자
– risedronate 35 mg, weekly
– 여성 92명, 평균 66.2세
– 정상 (60, 65.2%) prediabetes(24, 26.1%), DM(8, 8.7%)
• 치료 전, 4개월 후
– FPG, FPI, ucOC, cOC, CTX
– HOMA-IR, HOMA-B%
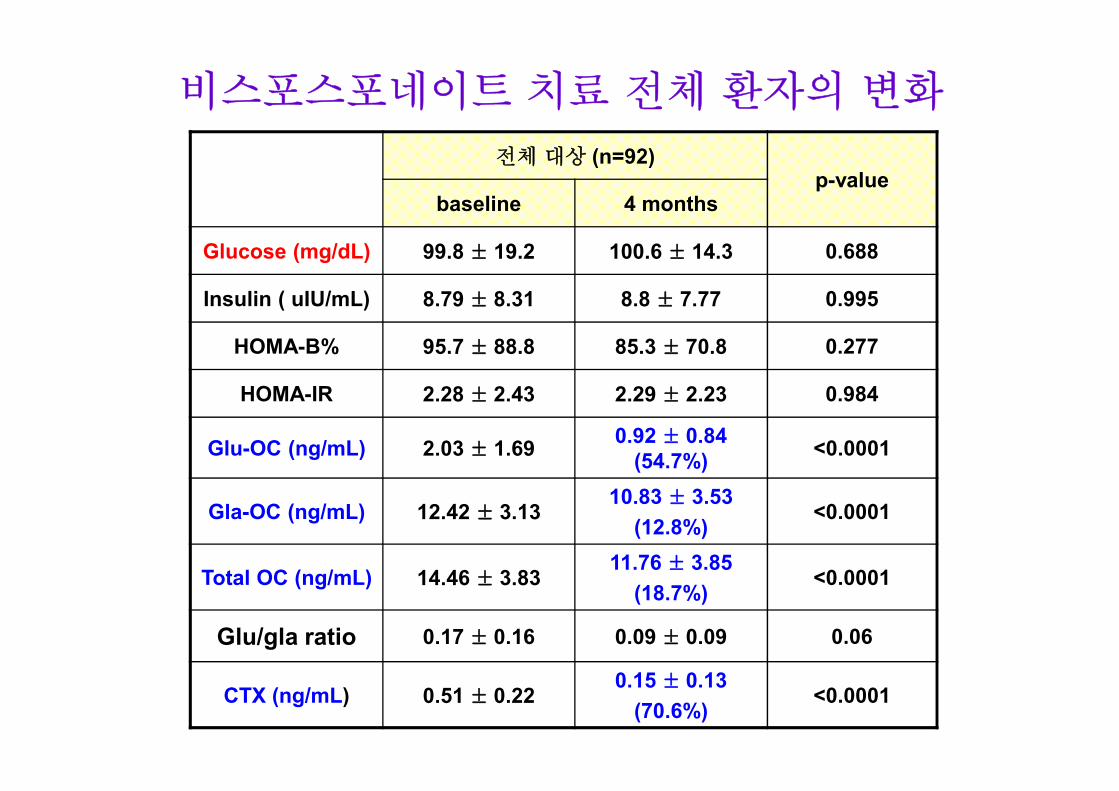
전체 대상 (n=92)p-value
baseline 4 months
Glucose (mg/dL) 99.8 ± 19.2 100.6 ± 14.3 0.688
Insulin ( uIU/mL) 8.79 ± 8.31 8.8 ± 7.77 0.995
HOMA-B% 95.7 ± 88.8 85.3 ± 70.8 0.277
HOMA-IR 2.28 ± 2.43 2.29 ± 2.23 0.984
Glu-OC (ng/mL) 2.03 ± 1.690.92 ± 0.84
(54.7%)<0.0001
Gla-OC (ng/mL) 12.42 ± 3.1310.83 ± 3.53
(12.8%)<0.0001
Total OC (ng/mL) 14.46 ± 3.8311.76 ± 3.85
(18.7%)<0.0001
Glu/gla ratio 0.17 ± 0.16 0.09 ± 0.09 0.06
CTX (ng/mL) 0.51 ± 0.220.15 ± 0.13
(70.6%)<0.0001
비스포스포네이트 치료 전체 환자의 변화
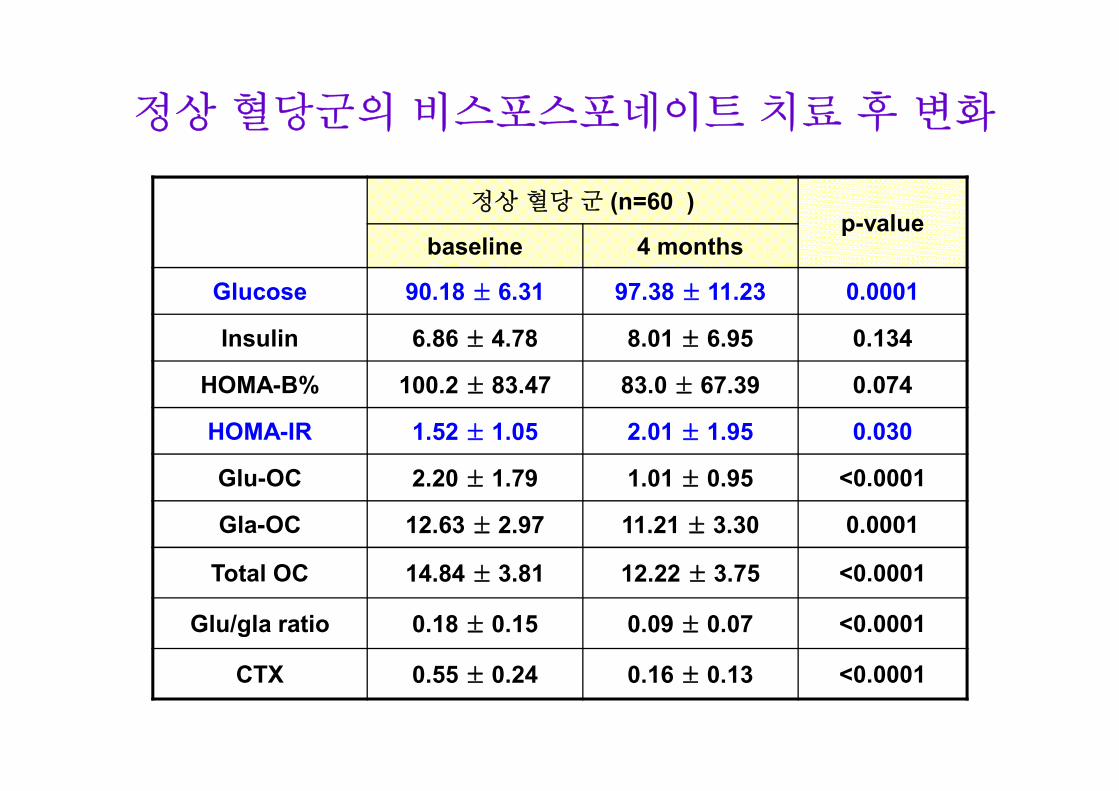
정상 혈당 군 (n=60 )p-value
baseline 4 months
Glucose 90.18 ± 6.31 97.38 ± 11.23 0.0001
Insulin 6.86 ± 4.78 8.01 ± 6.95 0.134
HOMA-B% 100.2 ± 83.47 83.0 ± 67.39 0.074
HOMA-IR 1.52 ± 1.05 2.01 ± 1.95 0.030
Glu-OC 2.20 ± 1.79 1.01 ± 0.95 <0.0001
Gla-OC 12.63 ± 2.97 11.21 ± 3.30 0.0001
Total OC 14.84 ± 3.81 12.22 ± 3.75 <0.0001
Glu/gla ratio 0.18 ± 0.15 0.09 ± 0.07 <0.0001
CTX 0.55 ± 0.24 0.16 ± 0.13 <0.0001
정상 혈당군의 비스포스포네이트 치료 후 변화

Prediabetes (n=24) + DM (n= 8)p-value
baseline 4 months
Glucose 117.9 ± 22.16 106.8 ± 17.30 0.012
Insulin 12.42 ± 11.76 10.28 ± 9.05 0.359
HOMA-B 87.39 ± 98.91 89.71 ± 77.79 0.912
HOMA-IR 3.71 ± 3.48 2.81 ± 2.63 0.184
Glu-OC 1.72 ± 1.44 0.76 ± 0.55 <0.0001
Gla-OC 12.02 ± 3.41 10.12 ± 3.89 0.0001
Total OC 13.75 ± 3.83 10.89 ± 3.94 <0.0001
Glu/gla ratio 0.15 ± 0.16 0.09 ± 0.11 0.0002
CTX 0.44 ± 0.18 0.14 ± 0.12 <0.0001
비정상 혈당군의 비스포스포네이트 치료 후 변화

prediabetes (n=24)p-value
baseline 4 months
Glucose 107.6 ± 6.56 104.5 ± 17.36 0.34
Insulin 11.70 ± 12.68 8.42 ± 8.07 0.22
HOMA-B 96.37 ± 111.81 75.35 ± 64.08 0.37
HOMA-IR 3.10 ± 3.27 2.26 ± 2.31 0.22
Glu osteocalcin 1.86 ± 1.58 0.85 ± 0.59 0.0006
Gla osteocalcin 11.98 ± 3.77 9.78 ± 4.12 0.0004
Total osteocalcn 13.85 ± 4.19 10.63 ± 4.19 <0.0001
Glu/gla ratio 0.17 ± 0.18 0.11 ± 0.13 0.002
CTX 0.46 ± 0.19 0.15 ± 0.12 <0.0001
Prediabetes 군의 비스포스포네이트 치료 전 후 변화

DM (n=8)p-value
baseline 4 months
Glucose 148.8 ± 24.17 113.6 ± 16.23 0.009
Insulin 14.56 ± 8.82 15.87 ± 10.05 0.79
HOMA-B 60.47 ± 33.79 132.78 ± 102.35 0.09
HOMA-IR 5.53 ± 3.64 4.46 ± 3.01 0.57
Glu osteocalcin 1.3 ± 0.89 0.52 ± 0.26 0.01
Gla osteocalcin 12.14 ± 2.2 11.17 ± 3.12 0.23
Total osteocalcn 13.44 ± 2.7 11.69 ± 3.18 0.059
Glu/gla ratio 0.10 ± 0.06 0.04 ± 0.02 0.02
CTX 0.38 ± 0.12 0.12 ± 0.12 0.005
당뇨병 환자군의 비스포스포네이트 치료 전 후 변화

Correlation between changes of osteocalcin
and glucose parameters after risedronate
treatment in normal glucose group
∆ Glu
osteocalcin
∆ Gla
osteocalcin
∆ Total
osteocalcin∆ Glu/gla ∆ CTX
rp-
valuer
p-
valuer
p-
valuer
p-
valuer
p-
value
∆
Glucose-0.04 0.72 -0.14 0.25 -0.12 0.35 0.06 0.62 0.13 0.32
∆
insulin0.14 0.27 0.23 0.07 0.24 0.06 0.30 0.01 -0.11 0.39
∆
HOMA-
B
0.13 0.28 0.14 0.25 0.23 0.07 0.24 0.058 -0.19 0.13
∆
HOMA-
IR
0.17 0.18 0.21 0.09 0.21 0.09 0.28 0.02 -0.07 0.57
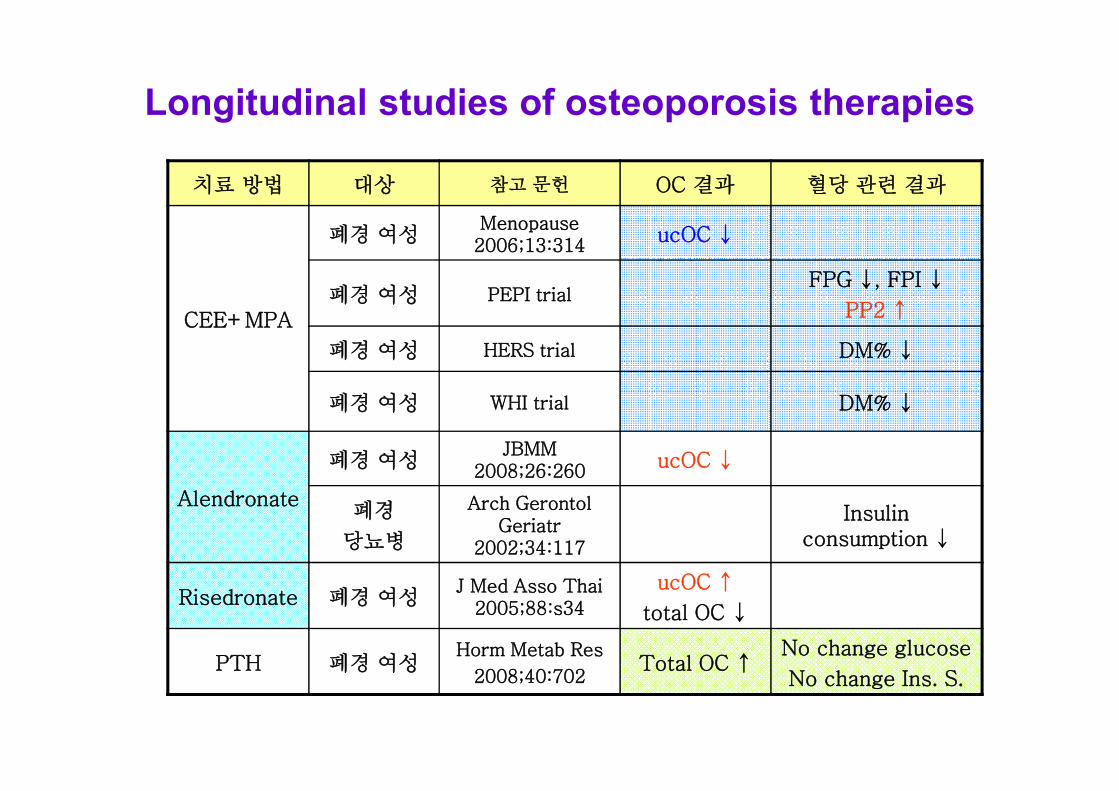
Longitudinal studies of osteoporosis therapies
치료 방법 대상 참고 문헌 OC 결과 혈당 관련 결과
CEE+MPA
폐경 여성Menopause
2006;13:314ucOC ↓
폐경 여성 PEPI trialFPG ↓, FPI ↓
PP2 ↑
폐경 여성 HERS trial DM% ↓
폐경 여성 WHI trial DM% ↓
Alendronate
폐경 여성JBMM
2008;26:260ucOC ↓
폐경
당뇨병
Arch GerontolGeriatr
2002;34:117
Insulin consumption ↓
Risedronate 폐경 여성J Med Asso Thai
2005;88:s34
ucOC ↑
total OC ↓
PTH 폐경 여성Horm Metab Res
2008;40:702Total OC ↑
No change glucose
No change Ins. S.

Other longitudinal studies
치료 방법 대상 Total OC ucOC 비고
혈당 개선당뇨병
(일본)
↑ BALP ↓
↑ ↑ (NS) ucOC/OC ↓
Vitamin K
남 ↓ HOMA-IR 개선
폐경 여성 ↓HOMA-IR
변화없음
Warfarin ↑ 혈당 변화 ?

Summary • In vitro, animal model
– ucOC has a positive effects on insulin secretion and sensitivity
– ucOC prevents obesity or improve glucose tolerance in WT mice
• Human studies (association)
– cross sectional (our data)
• ucOC: insulin secretion, cOC: insulin sensitivity
• Total OC is a/w improved glucose tolerance independent of
adiponectin
– cross sectional (other group)
• ucOC or total OC are a/w improved glucose tolerance
• partial correlation with adiponectin
– Longitudinal
• bisphophonate therapy increase glucose in normal group,
not in prediabetes and DM group
• few and inconsistent data do not provide sufficient evidence
• osteocalcin as a novel hormone
regulating glucose metabolism in animal
model
• however, further studies are needed to
determine whether, and how osteocalcin
affects glucose metabolism in human
Conclusion

Cell 2011;144:796-809
J Bone Miner Res 2011