ossification of the posterior longitudinal ligament: mr ...ossification of the posterior...
TRANSCRIPT

Ossification of the Posterior Longitudinal Ligament: MR Evaluation
Shoichiro Otake,u Michimasa Matsuo,2 Sadahiko Nishizawa, 1 Akira Sano, 1 and Yasumasa Kuroda 1
Purpose: To investigate the MR appearance of ossification of the posterior longitudinal ligament (OPLL) of the cervical spine. Materials and Methods: A retrospective review of MR images and
conventional tomograms in 147 patients. Results: In the sagittal plane, proton-density images identified the ossified lesions more clearly than did T1- and T2-weighted images. All axial sequences
identified the lesions much frequently. T1-weighted images often showed areas of increased intensity within the lesions of the continuous and mixed type, especially within the thick lesions. Fat images by Dixon technique demonstrated same areas of increased intensity, which strongly suggested fatty marrow formation . On conventional tomograms, configurations of radiolucent
areas within the lesions corresponded to areas of increased intensity on T 1-weighted images. Conclusion: Proton-density sagittal and axial images are important in establishing the diagnosis of
OPLL. The areas of increased intensity on T1-weighted images and radiolucent areas suggest
marrow formation.
Index terms: Spine, ligaments; Spine, magnetic resonance
AJNR 13:1059-1067, Jul/ Aug 1992
In the early magnetic resonance (MR) era, the ossified lesion of ossification of the posterior longitudinal ligament (OPLL) was believed to show no signal intensity on T1- and T2-weighted images because most of the ossified lesion consist of dense calcification (1-3). However, bone marrow formation is histopathologically identified within the ossified lesion (4). Several reports have recently described the increased signal intensity within the ossified lesions on T1-weighted images to represent this marrow formation (5-7).
The purpose of this study is to investigate MR appearance of the ossified lesions and to obtain the most useful pulse sequence and imaging plane for diagnosis of OPLL.
Patients and Methods
During the period of December 1987 to June 1990, all patients with the plain film diagnosis of cervical OPLL
Received August 6, 1991; accepted and revision requested September
17; accepted on January 28, 1992. 1 Department of Radiology and 2 MR Center, Tenri Hospital , 200
Mishima-cho, Tenri , Nara 632 Japan. 3 Address reprint requests to Shoichiro Otake, MD. Current address:
Department of Radiology, Nagoya City University Medical School, I
Kawasumi , Mizuho-cho, Mizuho-ku, Nagoya, Aichi 467 Japan.
AJNR 13:1059-1067, Jui/Aug 1992 0195-6 108/92/1304-1059 © American Society of Neuroradiology
underwent MR imaging. The series of 147 patients consisted of 1 04 men and 43 women, aged 22 to 85 years (mean, 58 years). A total of 87 patients underwent surgery: 7 4 had laminectomy, 10 had anterior spinal fusion , and three had the combined procedure.
MR imaging was performed with .a 1.5-T unit and a surface coil. The field of view was 30 em in the sagittal plane and 21.4 em in the axial plane. All data were collected in a two-dimensional Fourier transform mode. The image matrix consisted of 256 X 256 elements.
The sagittal images were obtained with T1-, protondensity, and T2-weighted spin-echo technique. Tl weighted images, 600/15/2 (TR/TE/excitations), were obtained with 4-mm section thickness, 1-mm intersection gap. Proton-density and T2-weighted images, 2500-3700/ 15-25, 70-90/1 , were obtained by electrocardiographic triggering, with 4-mm section thickness, 1-mm intersection gap. The velocity and acceleration gradient rephasing technique was used in section selection and read out directions for proton-density and T2-weighted imagings.
Axial T1-, proton-density, and T2-weighted spin-echo images were obtained with 5-mm section thickness, 1-mm intersection gap. The TR, TE, and number of excitations were the same as for the sagittal imaging. T2*-weighted axial images were obtained by fast low angle shot (FLASH) (8), 200/16/4 with flip angle 10°, and fast imaging with steady-state precession (FISP) (9), 400/18/2- 4 with flip angle 10-15°, both of which were obtained with 5-mm section thickness, 1-mm intersection gap.
In the seven patients with the ossified lesions showing large increased signal intensity on T1-weighted images, Dixon technique, 600/18/2, was performed to characterize
1059

1060
the fatty tissue (10) . Fat images were obtained by postprocessing photographic subtraction of out-of-phase images from in-phase ones.
Lateral conventional tomograms were obtained in all patients with 115 em of focus-film distance. Maximum thickness of the ossified lesion was measured in each patient.
Roentgenographically , the ossified lesions were classified into four types according to the official standard of the Investigation Committee on OPLL (4): 1) continuous (a long lesion extending over several vertebral bodies), 2) segmental (a few or several separate lesions behind the vertebral bodies) , 3) mixed (combination of the first two), and 4) a circumscribed lesion at the level of intervertebral disk (Fig. 1 ).
The ossified lesions seen on the axial MR images were classified into three types according to the shape represented by a pair of lines tangential to the bilateral margins of the lesion ( 11 ): 1) square with parallel lines, 2) mushroom with ventrally crossing lines, and 3) hill with dorsally crossing lines (Fig. 2).
Fig. 1. Classification of OPLL on lateral x-ray tomogram: A , continuous, a long lesion extending over several vertebral bodies; 8, segmental , a few or several lesions separately behind the vertebral bodies; C, mixed, combination of the first two; D, a circumscribed lesion at the level of intervertebral
disk.
Fig. 2. Classification of OPLL on axial MR image: A , square with parallel lines tangential to the bilateral margins of the ossified lesion; 8 , mushroom with ventral ly crossing lines; C, hill with dorsally crossing lines.
A
A
AJNR: 13, July/ August 1992
The MR images were interpreted in random order by three observers, with regard to the identification of the ossified lesion, increased signal intensity within the ossified lesion on Tl-weighted images, and intramedullary abnormal signal intensity. Correlation with conventional tomegrams was made after the agreement of the interpretation.
The x2 test was used to determine whether statistical significance existed between the frequency of visualization of increased signal intensity within the ossified lesions on T 1-weighted images and roentgenographical type of OPLL.
Results
Classification of Ossified Lesions
In the series of 14 7 patients, 31 lesions were continuous, 56 were mixed, 59 were segmental, and one was circumscribed, roentgenographically.
In the 134 patients in whom axial MR imaging
0 0 0
8 c D
8 c

AJNR: 13, July/ August 1992
was performed, 63 lesions were the square type, 45 were the mushroom type, and 18 were the hill type. Eight lesions could not be identified.
Identification of Ossified Lesions on Each Pulse Sequence and in Each Imaging Plane
In the sagittal plane, the ossified lesions were more frequently identified on proton-density im-
1061
ages than on T1 - and T2-weighted images, appearing as areas of decreased signal intensity. More than 50% of the lesions of 6- to 9-mm thickness and all lesions thicker than 10 mm were identified on proton-density sagittal images (Table 1), because proton-density images produced adequate contrast between the ossified lesions (decreased or no signal intensity) and the vertebral bodies and cerebrospinal fluid (CSF)
TABLE 1: Frequency of identification of ossified lesions in each thickness and on each pulse sequence
A
Thickness Sagittal
(mm) T1W PD T2W
2 1/ 12 5/ 11 1/ 11 3 0/ 20 5/ 17 3/17 4 0/ 10 4/8 2/8 5 3/13 5/ 12 1/ 12 6 6/ 13 8/ 11 4/ 11 7 7/20 13/16 6/ 16 8 6/15 12/ 14 9/14 9 5/15 13/ 15 7/ 15
10 3/6 6/6 6/6 11 7/9 9/9 8/9 12 6/8 7/ 7 6/7 13 3/4 3/3 3/3 14 1/2 2/2 2/2
Total 48/ 147 92/131 58/131 (%) (32.7) (70.2) (44.3)
Note.-PD, proton-densi ty; NP , not performed.
8
Fig. 3. A 64-year-old man with the mixed lesion of OPLL. A, Conventional tomogram demonstrates the lesion.
T1 W
0/ 1 1/ 4 2/ 2 NP 2/ 4 4/5 3/3 1/1 1/ 1 3/3 2/2 1/ 1 NP
20/27 (74.1)
c
Axial
PD T2W FLASH FISP
6/ 7 4/7 1/ 1 3/6 5/ 5 4/ 5 0/2 9/11 3/3 3/3 2/2 3/4 3/3 3/3 NP 8/8 3/3 3/3 4/ 4 4/ 4 7/ 7 7/ 7 3/3 14/ 14 4/4 4/4 3/3 11 / 11 3/ 3 3/3 NP 11 / 11 3/3 3/3 1/ 1 3/3 3/3 3/3 NP 5/ 5 4/ 4 4/ 4 1/ 1 4/ 4 NP NP 1/ 1 2/2 NP NP NP 2/2
44/45 41 / 45 16/ 18 79/85 (97.8) (91 .1) (88.9) (92.9)
D
B, T1-weighted sagittal image (600/15/2) provides poor tissue contrast between the ossified lesion and CSF. C, Proton-density image (3000/ 15/ 1) clearly demonstrates the ossified lesion as areas of decreased signal intensity. D, T2-weighted image (3000/ 90/ 1) provides poor tissue contrast between the ossified lesion and the vertebral bodies.
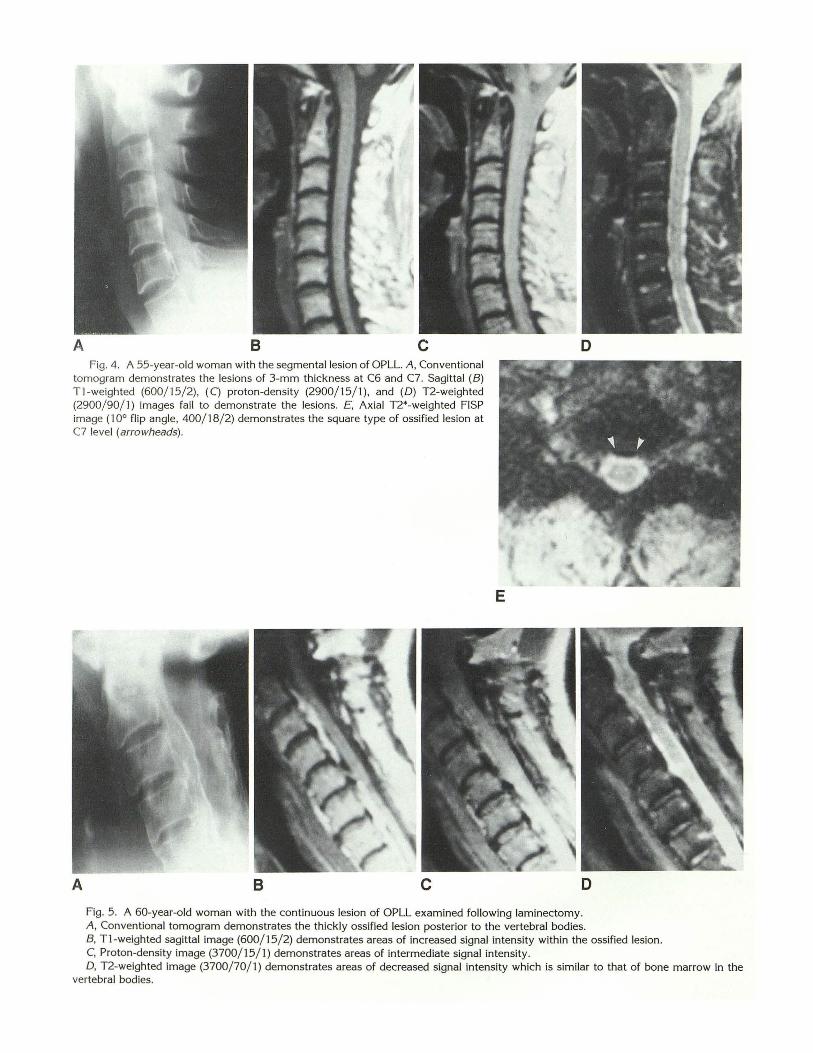
A 8 c Fig. 4. A 55-year-old woman with the segmental lesion of OPLL. A , Conventional
tomogram demonstrates the lesions of 3-mm thickness at C6 and C7. Sagittal (B) T"l -weighted (600/ 15/2), (C) proton-density (2900/ 15/ 1), and (D) T2-weighted (2900/ 90/ 1) images fail to demonstrate the lesions. E, Axial T2*-weighted FISP image ( 10° flip angle, 400/ 18/ 2) demonstrates the square type of ossified lesion at C7 level (arrowheads).
A 8 c
D
D
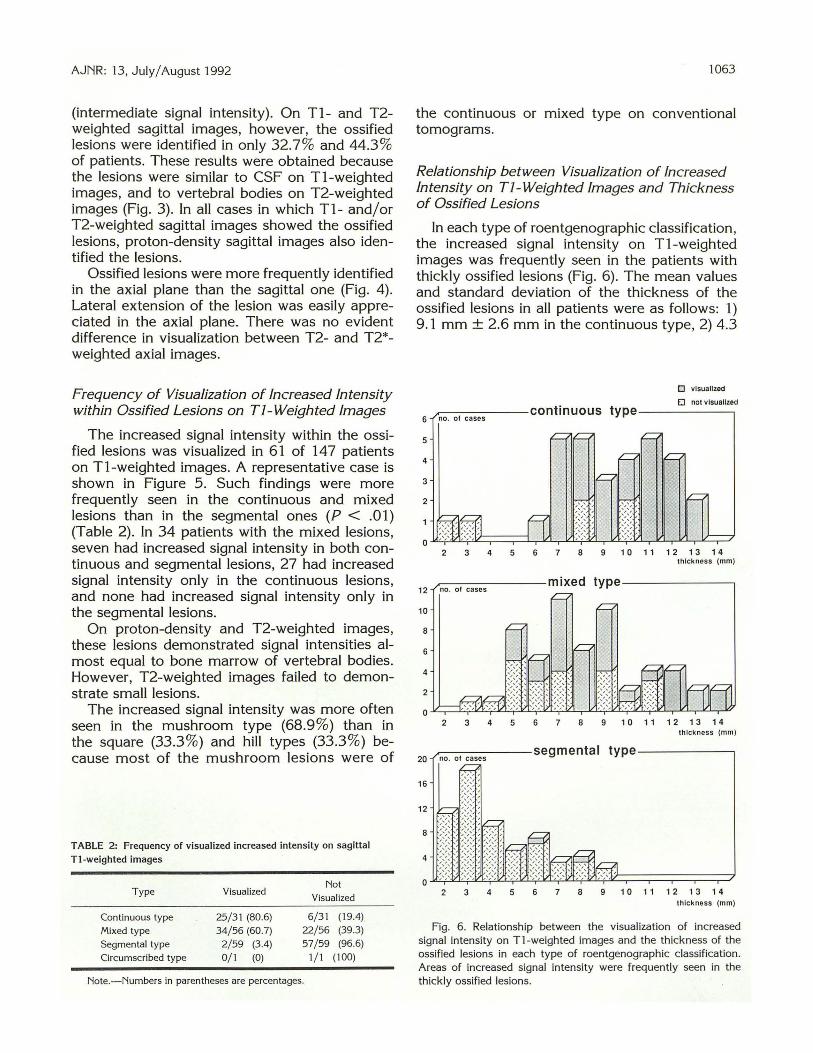
Fig. 5. A 60-year-old woman with the continuous lesion of OPLL examined following laminectomy. A, Conventional tomogram demonstrates the thickly ossified lesion posterior to the vertebral bodies. B, T1 -weighted sagittal image (600/15/2) demonstrates areas of increased signal intensity within the ossified lesion. C, Proton-density image (3700/ 15/ 1) demonstrates areas of intermediate signal intensity. 0, T2-weighted image (3700/ 70/ 1) demonstrates areas of decreased signal intensity which is similar to that of bone marrow in the
vertebral bodies.
AJNR: 13, July/ August 1992
(intermediate signal intensity). On T 1- and T2-weighted sagittal images, however, the ossified lesions were identified in only 32.7% and 44.3 % of patients. These results were obtained because the lesions were similar to CSF on T1-weighted images, and to vertebral bodies on T2-weighted images (Fig. 3). In all cases in which T1- and/or T2-weighted sagittal images showed the ossified lesions, proton-density sagittal images also identified the lesions.
Ossified lesions were more frequently identified in the axial plane than the sagittal one (Fig. 4). Lateral extension of the lesion was easily appreciated in the axial plane. There was no evident difference in visualization between T2- and T2*weighted axial images.
Frequency of VisualizaUon of Increased Intensity within Ossified Lesions on Tl- Weighted Images
The increased signal intensity within the ossified lesions was visualized in 61 of 14 7 patients on T1-weighted images. A representative case is shown in Figure 5. Such findings were more frequently seen in the continuous and mixed lesions than in the segmental ones (P < .01) (Table 2). In 34 patients with the mixed lesions, seven had increased signal intensity in both continuous and segmental lesions, 27 had increased signal intensity only in the continuous lesions, and none had increased signal intensity only in the segmental lesions.
On proton-density and T2-weighted images, these lesions demonstrated signal intensities almost equal to bone marrow of vertebral bodies. However, T2-weighted images failed to demonstrate small lesions.
The increased signal intensity was more often seen in the mushroom type (68.9 %) than in the square (33.3%) and hill types (33.3 %) because most of the mushroom lesions were of
TABLE 2: Frequency of visualized increased intensity on sagittal
Tl-weighted images
Type Visualized Not
Visualized
Continuous type 25/ 31 (80.6) 6/ 31 (19.4)
Mixed type 34/56 (60.7) 22/ 56 (39.3)
Segmental type 2/ 59 (3.4) 57/ 59 (96.6) Circumscribed type 0/ 1 (0) 1/ 1 (100)
Note.-Numbers in parentheses are percentages.
1063
the continuous or mixed type on conventional tomograms.
Relationship between Visualization of Increased Intensity on Tl-Weighted Images and Thickness of Ossified Lesions
In each type of roentgenographic classification, the increased signal intensity on T 1-weighted images was frequently seen in the patients with thickly ossified lesions (Fig. 6). The mean values and standard deviation of the thickness of the ossified lesions in all patients were as follows: 1) 9.1 mm ± 2.6 mm in the continuous type, 2) 4.3
0 visualized
D nol visualized ~---:-----continuous type---------,
6 no . of cases
2 3 4 5 6 7 8 9 10 11 12 13 14 thickness (mm)
12 ~---:------mixed type-------,
no . or cases
10
8
6
4
2
0 2 3 4 5 6 7 8 9 10 11 12 13 14
thickness (mm )
20 ~---=-----segmental type------,
16
12
8
2 3 4 5 6 7 8 9 10 11 1 2 13 14 thickness (mm)
Fig. 6. Relationship between the visualization of increased signal intensity on Tl-weighted images and the thickness of the ossified lesions in each type of roentgenographic classification. Areas of increased signal intensity were frequently seen in the thickly ossified lesions.
1064
mm ± 2.0 mm in the segmental type, and 3) 8.2 mm ± 2.6 mm in the mixed type. The corresponding values for areas of increased signal intensity on T1-weighted images were 9.6 mm ± 2.2 mm, 7.0 mm ± 1.0 mm, and 8.9 mm ± 2.6 mm, respectively .
Dixon Technique E valuation of Increased Intensity within Ossified Lesions
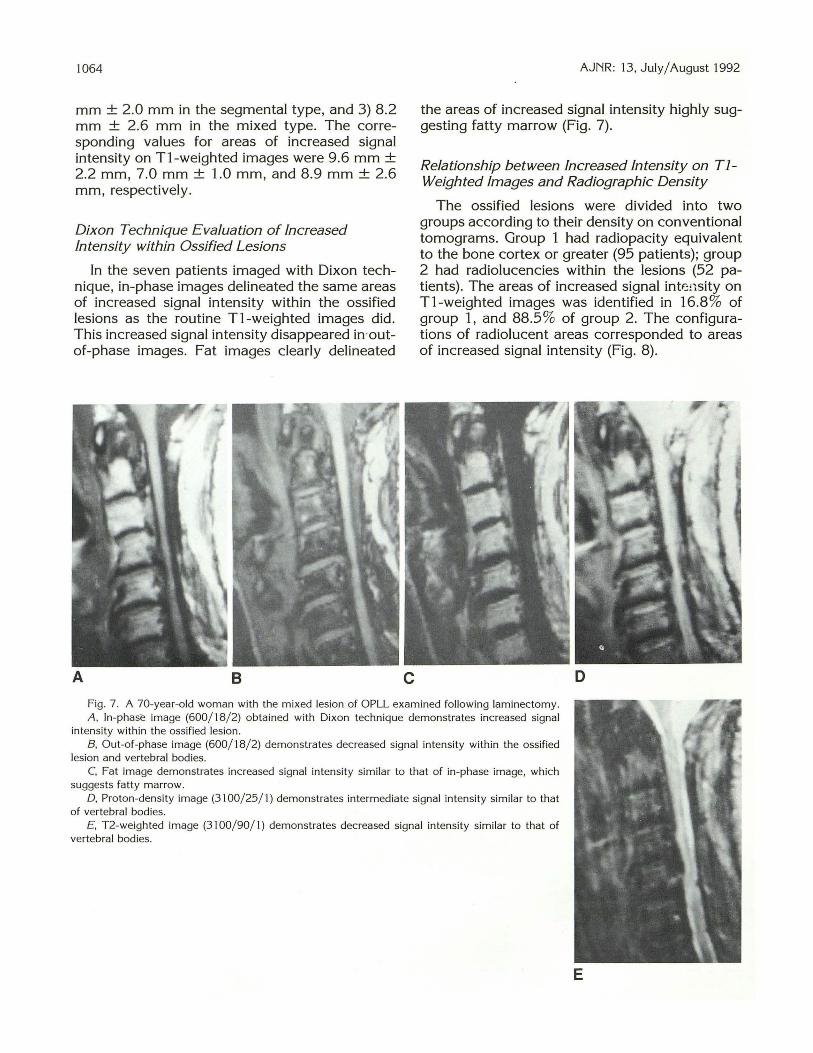
In the seven patients imaged with Dixon technique , in-phase images delineated the same areas of increased signal intensity within the ossified lesions as the routine T 1-weighted images did. This increased signal intensity disappeared in'outof-phase images. Fat images clearly delineated
A 8 c
AJNR: 13, July/ August 1992
the areas of increased signal intensity highly suggesting fatty marrow (Fig. 7).
Relationship between Increased Intensity on TJWeighted Images and Radiographic Density
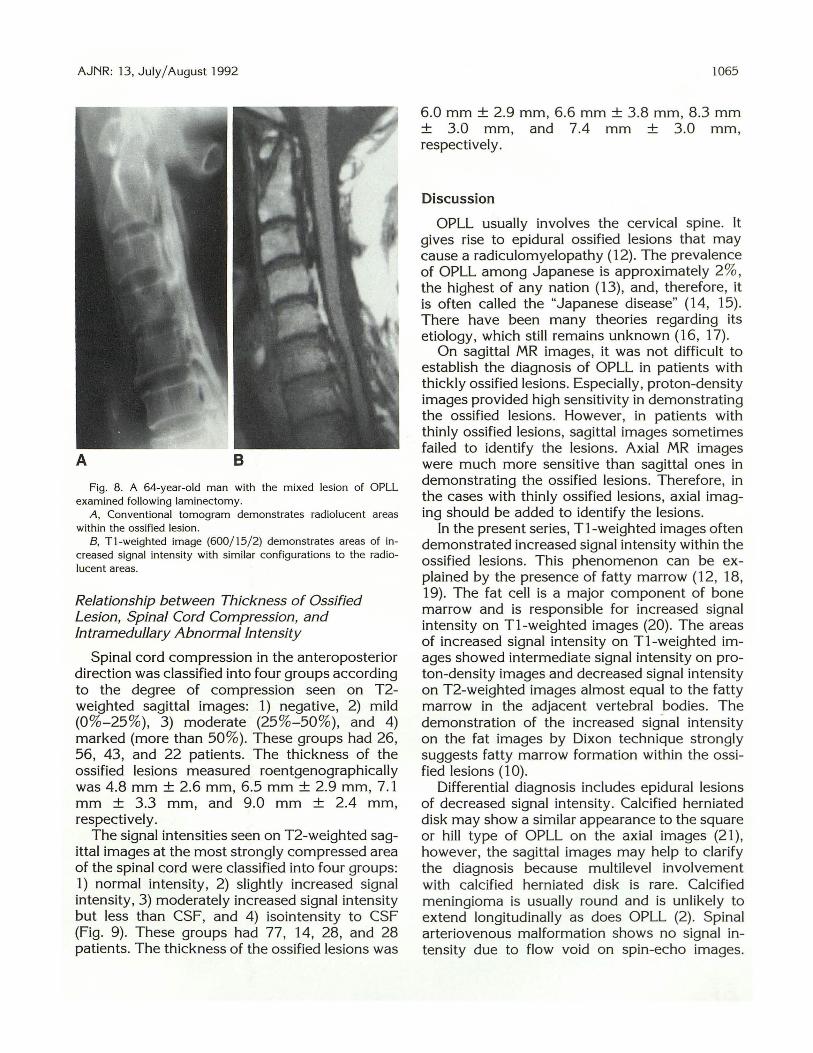
The ossified lesions were divided into two groups according to their density on conventional tomograms. Group 1 had radiopacity equivalent to the bone cortex or greater (95 patients); group 2 had radiolucencies within the lesions (52 patients). The areas of increased signal int~C:nsity on T1 -weighted images was identified in 16.8% of group 1, and 88.5 % of group 2. The configurations of radiolucent areas corresponded to areas of increased signal intensity (Fig. 8).
D
Fig. 7. A 70-year-old woman with the m ixed lesion of OPLL examined following lam inectom y . A , In-phase image (600/ 18/ 2) obtained with Dixon technique demonstrates increased signal
intensity within the ossified lesion. 8 , Out-of-phase image (600/ 18/ 2) demonstrates decreased signal intensity within the ossified
lesion and vertebral bodies. C, Fat image demonstrates increased signal intensity simi lar to that of in-phase image, which
suggests fatty marrow. 0 , Proton-density image (31 00/ 25/ 1) demonstrates intermediate signal intensity similar to that
of vertebral bodies. £ , T2-weighted image (3 100/ 90/ 1) demonstrates decreased signal intensity similar to that of
vertebral bod ies.
E
AJNR: 13, July/ August 1992
A B
Fig . 8. A 64-year-old man with the mixed lesion of OPLL examined following laminectomy.
A , Conventional tomogram demonstrates radiolucent areas within the ossified lesion.
B, Tl-weighted image (600/15/ 2) demonstrates areas of increased signal intensity with similar configurations to the radiolucent areas.
Relationship between Thickness of Ossified Lesion, Spinal Cord Compression, and Intramedullary Abnormal Intensity
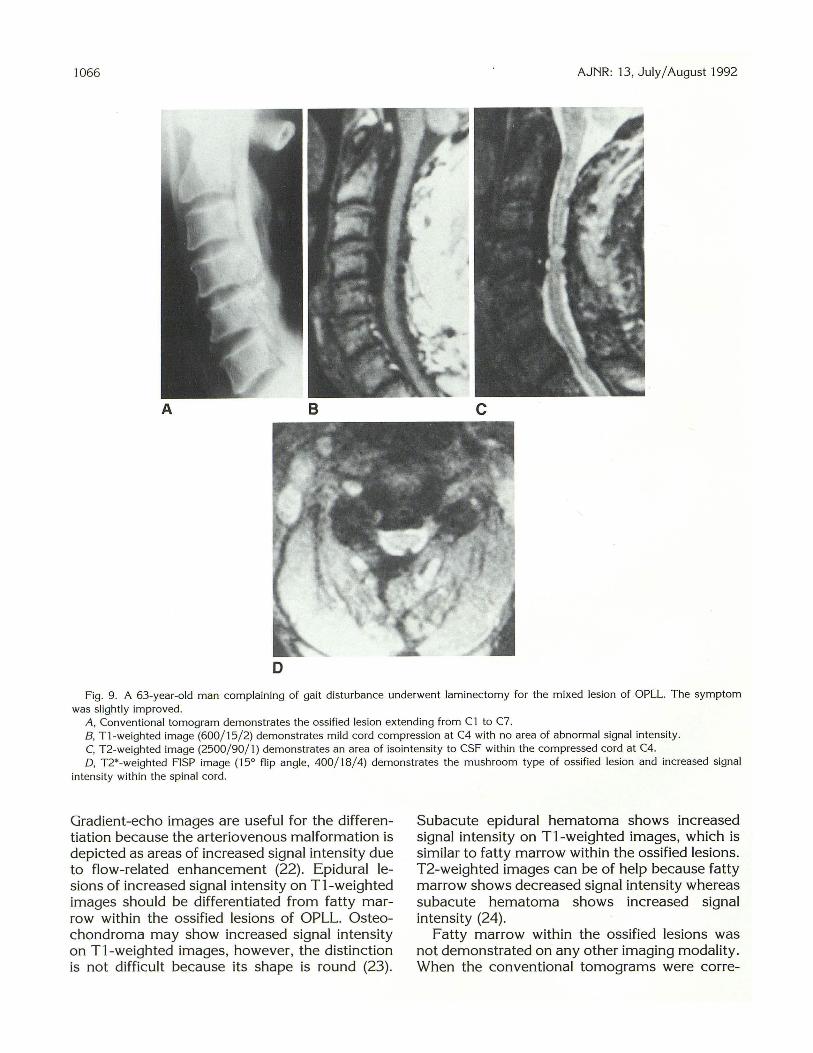
Spinal cord compression in the anteroposterior direction was classified into four groups according to the degree of compression seen on T2-weighted sagittal images: 1) negative, 2) mild (0%-25%), 3) moderate (25%-50%), and 4) marked (more than 50%). These groups had 26, 56, 43, and 22 patients. The thickness of the ossified lesions measured roentgenographically was 4.8 mm ± 2.6 mm, 6.5 mm ± 2.9 mm, 7.1 mm ± 3.3 mm, and 9.0 mm ± 2.4 mm, respectively.
The signal intensities seen on T2-weighted sagittal images at the most strongly compressed area of the spinal cord were classified into four groups: 1) normal intensity, 2) slightly increased signal intensity, 3) moderately increased signal intensity but less than CSF, and 4) isointensity to CSF (Fig. 9). These groups had 77, 14, 28, and 28 patients. The thickness of the ossified lesions was
1065
6.0 mm ± 2.9 mm, 6.6 mm ± 3.8 mm, 8.3 mm ± 3 .0 mm, and 7.4 mm ± 3.0 mm , respectively.
Discussion
OPLL usually involves the cervical spine. It gives rise to epidural ossified lesions that may cause a radiculomyelopathy (12). The prevalence of OPLL among Japanese is approximately 2%, the highest of any nation (13) , and , therefore, it is often called the "Japanese disease" (14, 15). There have been many theories regarding its etiology, which still remains unknown (16, 17).
On sagittal MR images, it was not difficult to establish the diagnosis of OPLL in patients with thickly ossified lesions. Especially, proton-density images provided high sensitivity in demonstrating the ossified lesions. However, in patients with thinly ossified lesions, sagittal images sometimes failed to identify the lesions. Axial MR images were much more sensitive than sagittal ones in demonstrating the ossified lesions. Therefore, in the cases with thinly ossified lesions, axial imaging should be added to identify the lesions.
In the present series, T1-weighted images often demonstrated increased signal intensity within the ossified lesions. This phenomenon can be explained by the presence of fatty marrow (12, 18, 19). The fat cell is a major component of bone marrow and is responsible for increased signal intensity on T1-weighted images (20). The areas of increased signal intensity on T1-weighted images showed intermediate signal intensity on proton-density images and decreased signal intensity on T2-weighted images almost equal to the fatty marrow in the adjacent vertebral bodies. The demonstration of the increased signal intensity on the fat images by Dixon technique strongly suggests fatty marrow formation within the ossified lesions ( 1 0).
Differential diagnosis includes epidural lesions of decreased signal intensity. Calcified herniated disk may show a similar appearance to the square or hill type of OPLL on the axial images (21), however, the sagittal images may help to clarify the diagnosis because multilevel involvement with calcified herniated disk is rare. Calcified meningioma is usually round and is unlikely to extend longitudinally as does OPLL (2). Spinal arteriovenous malformation shows no signal intensity due to flow void on spin-echo images.
1066 AJNR: 13, July/August 1992
A 8 c
D
Fig. 9. A 63-year-old man complaining of gait disturbance underwent laminectomy for the mixed lesion of OPLL. The symptom was slightly improved.
A , Conventional tomogram demonstrates the ossified lesion extending from Cl to C7. 8, Tl-weighted image (600/ 15/ 2) demonstrates mild cord compression at C4 with no area of abnormal signal intensity. C, T2-weighted image (2500/ 90/ 1) demonstrates an area of isointensity to CSF within the compressed cord at C4. D, T2*-weighted FISP image (15° flip angle, 400/ 18/ 4) demonstrates the mushroom type of ossified lesion and increased signal
intensity within the spinal cord .
Gradient-echo images are useful for the differentiation because the arteriovenous malformation is depicted as areas of increased signal intensity due to flow-related enhancement (22). Epidural lesions of increased signal intensity on Tl-weighted images should be differentiated from fatty marrow within the ossified lesions of OPLL. Osteochondroma may show increased signal intensity on Tl-weighted images, however, the distinction is not difficult because its shape is round (23) .
Subacute epidural hematoma shows increased signal intensity on Tl-weighted images, which is similar to fatty marrow within the ossified lesions. T2-weighted images can be of help because fatty marrow shows decreased signal intensity whereas subacute hematoma shows increased signal intensity (24).
Fatty marrow within the ossified lesions was not demonstrated on any other imaging modality. When the conventional tomograms were corre-
AJNR : 13, July/ August 1992
lated with MR images, radiolucent areas within the ossified lesions clearly corresponded to the areas of increased signal intensity on T1-weighted images. We believe that demonstration of the radiolucent area may predict fatty marrow formation within the ossified lesion with a high degree of probability.
Spinal cord compression and intramedullary abnormal signal intensity were frequently seen in the cases with ossified lesions that showed increased signal intensity on T1-weighted images because fatty marrow was frequently identified within the thickly ossified lesions. The abnormal signal intensity lesion in the compressed cord reflects myelomalacia (25) . MR imaging was useful in evaluating the associated cord lesion.
In summary, we recommend proton-density images in the sagittal plane and all sequences in the axial plane for the diagnosis of OPLL. Since plain films and CT are needed to establish the diagnosis of OPLL, MR alone should not be used. Areas suggestive of bone marrow spaces on MR were frequently identified in the continuous and mixed lesions, and in thickly ossified lesions. The epidural areas of increased signal intensity on T1-weighted images should not be confused with other pathologic conditions.
Acknowledgments
The authors thank Theodore E. Keats, MD, for revising the manuscript.
References
1. McAfee PC, Regan JJ , Bohlman HH. Cervica l cord compression from
ossification of the posterior longitudinal ligament in non-orientals. J Bone Joint Surg (Br) 1987;69:569-575
2. Luetkehans T J , Coughlin BF, Weinstein MA. Ossifica tion of the
posterior longitudinal ligament diagnosed by MR. AJNR 1987;8:
924-925
3. Glathe VS, Heindel W, Thun F. OPLL: ein seltenes Krankheitsbild.
Fortschr Geb Rontgenstr Nuklearmed Erganzungsbd 1988; 149: 440-441
4. T suyama N, Terayama K, Ohtani K , et al. The ossification of the
posterior longitudinal ligament of the spine (OPLL). J Jpn Orthop Assoc 1981 ;55:425-440
5. Otake S, Kin Y, Mizutani M, et al. MRI of OPLL. Jpn J C/in Radio/ 1988;33:989-993
1067
6. Widder DJ . MR imaging of ossification of the posterior longitudinal ligament. AJR 1989; 153:194-195
7. Yamashita Y, Takahashi M , Matsuno Y, et al. Spinal cord compression
due to ossification of ligaments: MR imaging. Radiology 1990; 175: 843-848
8. Haase A, Frahm J , Matthaei D, Haenicke W, Merboldt KD. FLASH
imaging: rapid NMR imaging using low flip-angle pulses. J Magn Reson 1986;67:258-266
9. Oppelt A , Graumann R, Barfuss H, Fischer H, Hartl W, Schajor W.
FISP: a new fast MRI sequence. Electromedica 1986;54 : 15- 18
10. Dixon WT. Simple proton spectroscopic imaging. Radiology 1984;
153:189- 194 11 . Hirabayashi K, Satomi K, Sasaki T. Ossification of the posterior
longitudinal ligament in the cervical spine. In: The Cervical Spine
Research Society, ed. The cervical spine. 2nd ed. Phi ladelphia: J . B.
Lippincott, 1989:678-692 12. Onji Y, Akiyama H, Shimomura Y, Ono K, Hukuda S, Mizuho S.
Posterior paravertebral ossification causing cervical myelopathy : a
report of eighteen cases. J Bone Joint Surg (A m) 1967;49:
1314-1328 13. Tsuyama N. Ossifica tion of the posterior longitudinal ligament of the
spine. C/in Orthop 1984;184:71-84 14. Breidahl P. Ossification of the posterior longitudinal ligament in the
cervica l spine: "the Japanese disease" occurring in patients of British
descent. Austra/as Radio/ 1969; 13:31 1-313 15. Dietemann JL, Dirheimer Y, Babin E, et al. Ossifica tion of the
posterior longitudinal ligament (Japanese disease): a radiologica l
study in 12 cases. J Neuroradio/ 1985; 12:2 12- 222
16. Resnick D, Guerra J Jr, Robinson CA, Vint VC. Association of diffuse
id iopathic skeletal hyperostosis (DISH) and calcification and ossifi
cation of the posterior longitudinal ligament. AJR 1978; 131 :
1049-1053 17. Terayama K. Genetic studies on ossification of the posterior longitu
dinal ligament of the spine. Spine 1989; 14:1 184-11 91
18. Palac ios E, Brackett CE, Leary DJ . Ossifica tion of the posterior
longitudinal ligament associated with a herniated intervertebral disk.
Radiology 1971 ; 100:3 13-314 19. Ono K, Ota H, Tada K, Hamada H, Takaoka K. Ossified posterior
longitudinal ligament: a cl inicopathologic study . Spine 1977;2:
126-138 20. Vogler JB Ill , Murphy WA. Bone marrow imaging. Radiology 1988;
168:679-693 21. Roosen N, Dietrich U, Nicola N, lrlich G, Gahlen D, Stork W. MR
imaging of ca lcified herniated thoracic disk. J Comput Assist Tomogr 1987;11 :733- 735
22. Minami S, Sagoh T , Nishimura K , et al. Spinal arteriovenous malfor
mation: MR imaging. Radiology 1988; 169: 109-11 5
23. Moriwaka F, Hazen H, Nakane K, Sasaki H, Tashiro K , Abe H.
Myelopa thy due to osteochondroma: MR and CT studies. J Comput Assist Tomogr 1990;1 4:128-130
24. Rothfus WE, Chedid MK, Deeb ZL, Abla AA, Maroon JC, Sherman
RL. MR imaging in the diagnosis of spontaneous spinal epidural
hematomas. J Comput Assist Tomogr 1987;11:851-854 25. Ramanauskas WL, Wilner HI, Metes JJ , Lazo A , Kelly JK. MR imaging
of compressive myelomalacia. J Comput Assist Tom ogr 1989;13:
399-404
Please see the Commentary by R.einsel and Andersson on page 1068 in this issue.