oroville dam safety comprehensive needs assessment …
TRANSCRIPT

Oroville Dam Safety Comprehensive Needs Assessment Summary
October 30, 2020 STATE OF CALIFORNIA THE NATURAL RESOURCES AGENCY DEPARTMENT OF WATER RESOURCES

This page left blank intentionally.

State of California California Natural Resources Agency
DEPARTMENT OF WATER RESOURCES Division of Engineering
Oroville Dam Safety Comprehensive Needs Assessment Summary
ENGINEERING CERTIFICATION
This report has been prepared under our direction as the professional engineers in direct responsible charge of the work, in accordance with the provisions of the Professional Engineers Act of the State of California.
Leslie F. Harder, Jr., PhD, PE, GE Deputy Project Manager
Stephen W. Verigin, PE, GE Deputy Project Manager

This page left blank intentionally.

Document Preparation Acknowledgements
i
This Document Prepared by:
Management Review
Ted Craddock, PE DWR Deputy Director, State Water Project
David Duval DWR Division of Operations & Maintenance, Chief
Jeanne Kuttel, PE DWR Division of Engineering, Chief
Sergio S. Escobar, PE DWR CNA Project Manager
John Leahigh, PE DWR Chief of Utility Operations
David Sarkisian, PE DWR Principal Engineer, WR
John Yarbrough, PE DWR Assistant Deputy Director, State Water Project
Mark Hafner, PE DWR Oroville Field Division, Chief
CNA Integration Team
Sergio Escobar, PE DWR CNA Project Manager
Leslie F. Harder, PhD, PE, GE HDR Engineering, Inc. Principal Professional Associate
Stephen W. Verigin, PE, GE GEI Consultants, Inc. Chief Geotechnical Engineer
David Ford, PhD, PE HDR Engineering, Inc. Vice President, Principal Hydrologic Engineer
Rhonda Robins, JD, CFM HDR Engineering, Inc. Senior Planner
Elizabeth Lewis GEI Consultants, Inc. Spillway Project Team Support
Technical Team Leads
Craig Hall, PE, GE Task 1 GEI Consultants, Inc. Principal Geotechnical Engineer
Dustin Jones, PE Task 2 DWR Supervising Engineer, Water Resources
Robert Filgas, PE Task 3 HDR Engineering, Inc. Chief Dam Engineer
Christopher Krivanec, PE, GE Task 4 HDR Engineering, Inc. Dam Lead for Northern California
Timothy Wehling, PE Task 5 DWR Chief, Dams and Canals Section
Shanna Adams, PE Task 6 HDR Engineering, Inc. Water/Wastewater Engineer

California Department of Water Resources Oroville Dam Safety Comprehensive Needs Assessment Summary
ii
This page left blank intentionally.

Table of Contents
iii
Contents Preface .......................................................................................................................... ix
Executive Summary ...................................................................................................... 1
Background ............................................................................................................................... 1
2017 Oroville Spillway Incident.................................................................................................. 1
CNA Purpose ............................................................................................................................ 2
Scope and Scale of the CNA ..................................................................................................... 2
Independent Review and Community Engagement .................................................................. 4
CNA Independent Review Board ........................................................................................... 4
CNA Ad Hoc Group ............................................................................................................... 4
CNA Risk Analysis Methodology ............................................................................................... 4
Primary Finding from Risk Analyses .......................................................................................... 6
Types of Potential Risk Reduction Measures and Alternative Plans Developed by the CNA Project ....................................................................................................................................... 7
Risks Considered in the Development of Measures and Plans ............................................. 7
Measures and Plans to Further Reduce Risk (Large-Scale, Long-Term) .............................. 8
CNA Early Implementation Project (Currently Underway) ....................................................... 11
Recommended CNA Interim Risk-Reduction Actions (Near-Term Projects) ........................... 11
Recommended CNA Interim Implementation Project .......................................................... 11
Additional CNA Recommended Interim Measures .............................................................. 12
Recommended Long-Term Path Forward for Future Consideration of Alternative Risk-Reduction Plans (Long-Term Risk-Management Process at Oroville) .................................... 13
Chapter 1. Introduction ............................................................................................... 15
Report Overview ...................................................................................................................... 15
Background Information on Oroville Dam and its Appurtenant Facilities ................................ 15
Roles of Federal and Dam Safety Regulatory Agencies ......................................................... 16
Role of the Federal Energy Regulatory Commission (FERC) in Regulating Oroville Dam .. 16
Role of Division of Safety of Dams (DSOD) in Regulating Oroville Dam ............................. 17
The 2017 Oroville Spillway Incident and Motivation for the Comprehensive Needs Assessment ............................................................................................................................. 17
Purpose and Commitment for the CNA Project ....................................................................... 19

California Department of Water Resources Oroville Dam Safety Comprehensive Needs Assessment Summary
iv
Organization of this Report ...................................................................................................... 21
Chapter 2. CNA Scope, Organization, and Design ................................................... 23
Organizing Principles of the CNA ............................................................................................ 23
The Level of Detail Used by the CNA ...................................................................................... 23
Why and How the CNA was Risk-Informed ............................................................................. 23
How the CNA was Conducted as a Semi-Quantitative Risk Assessment ............................... 24
How the CNA Defined Risk .................................................................................................. 24
How the CNA Used Semi-Quantitative Risk Analysis .......................................................... 24
CNA Organization ................................................................................................................... 24
CNA Scope .............................................................................................................................. 25
CNA Independent Review Board (IRB) ................................................................................... 26
CNA Ad Hoc Group ................................................................................................................. 27
Chapter 3. Adoption of Tolerable Risk Concepts in CNA ........................................ 29
Definition of Risk Assessment ................................................................................................. 29
Definition of Tolerable Risk...................................................................................................... 29
Development of the Concept of Tolerable Risk as Used in Dam Safety Risk Studies ........ 29
FERC Tolerable Risk Guidelines for Dams ......................................................................... 31
Definition of ALARP ................................................................................................................. 33
CNA Adoption of Extended Version of DWR Operations and Maintenance Asset Management Risk Matrix as Core Planning Tool .................................................................... 34
CNA Risk Matrix .................................................................................................................. 34
Consideration of Uncertainty in Risk Estimates ................................................................... 35
Chapter 4. Estimated Risks for Existing Conditions ................................................ 41
CNA Definition of Existing Conditions ..................................................................................... 41
Potential Failure Mode Development Process ........................................................................ 41
Estimation of Likelihood (Annual Probability) of a Potential Failure Mode .............................. 42
Estimation of Consequences for a Potential Failure Mode ...................................................... 44
Use of Multiple Failure States/Scenarios in CNA PFM Risk Estimates ................................... 46
CNA Existing Condition PFM Risk Estimates .......................................................................... 48
Primary Finding from CNA Existing Condition PFM Risk Estimates ....................................... 50
Assessments of Higher-Risk CNA Existing Condition PFMs ................................................... 50
Comparisons with the 2019 L2RA Risk Estimates .................................................................. 51

Table of Contents
v
Chapter 5. Development, Evaluation, Screening, and Selection of Measures and Alternative Plans .................................................................................................. 55
Introduction .............................................................................................................................. 55
Overview of Measure Development, Evaluation, Screening, and Selection Process .............. 55
Highlighted Risk Considerations.............................................................................................. 56
Risk-Reduction Measure Development ................................................................................... 58
Measure Evaluation Criteria ................................................................................................ 58
Ability to Achieve ALARP Risk Reduction and Lower Residual Risk ................................... 58
Ability to Support Design Considerations and Good Engineering Judgment ....................... 61
Ability to Enhance System Resilience ................................................................................. 61
Development, Evaluation, and Consolidation of Risk-Reduction Measures Used for Plan Formulation ............................................................................................................................. 62
Risk-Reduction Measures Incorporated in Alternative Plans .................................................. 63
Overview of Alternative Plan Formulation ............................................................................... 65
Identification of Themes for Alternative Plans ......................................................................... 66
Measures to Improve Resilience and Redundancy for Reservoir Drawdown and Water Delivery ................................................................................................................................... 66
Evaluation of CNA Alternative Plans ....................................................................................... 67
Inclusion of Cursory Cost in Description of Alternative Plans .................................................. 70
Chapter 6. Conclusions and Recommendations ...................................................... 73
Summary ................................................................................................................................. 73
Review of CNA Project Scope ................................................................................................. 73
Primary Finding from Risk Analyses ........................................................................................ 74
Highlighted Risks ..................................................................................................................... 74
Potential Risk-Reduction Measures and Plans ....................................................................... 75
Alternative Plans Recommended for Future Consideration .................................................... 76
Future Modifications to Reservoir Operations ......................................................................... 77
Recommended Early Implementation Projects (Currently Underway) .................................... 77
Recommended CNA Interim Reduction Actions (Near-Term Projects) ................................... 78
Recommended CNA Interim Implementation Project .......................................................... 78
Interim Implementation Project Measure: Raise Parish Camp Saddle Dam by 3 Feet ....... 78
Interim Implementation Project Measure: Installing Backup Power Equipment and Remote Starters for FCO Gates .......................................................................................... 80

California Department of Water Resources Oroville Dam Safety Comprehensive Needs Assessment Summary
vi
Interim Implementation Project Measure: Lining Palermo Canal ......................................... 81
Additional Recommended Interim Measures........................................................................... 84
Recommended Long-Term Path Forward for Future Consideration of Alternative Risk-Reduction Plans ...................................................................................................................... 85
Chapter 7. References and Resources ...................................................................... 86
Appendix A – Abbreviations and Glossary ............................................................... 90
A.1 Abbreviations ................................................................................................................ 90
A.2 Glossary ....................................................................................................................... 90
Appendix B – Independent Review Board Final Report ........................................... 98
Tables
Table 1. CNA Alternative Plans and Measures in Each Plan ............................................... 10
Table 2. Categorization for Risk Estimates Falling within the Different Risk Zones on the CNA Risk Matrix .................................................................................................... 35
Table 3. Draft Qualitative Failure Likelihood Descriptors (from FERC 2018) ....................... 43
Table 4. Consequence Descriptors for Extended Asset Management Risk Matrix (Adapted from DWR Asset Management Risk Management Program) ................................. 45
Table 5. Distribution of Most Critical CNA PFM Scenario Risk Estimates for Existing Conditions on the CNA Risk Matrix ........................................................................ 50
Table 6. CNA Alternative Plans and Scoring ........................................................................ 69

Table of Contents
vii
Figures Figure 1. Aerial View of Oroville Dam and Related Facilities After 2017-18 Repairs .............. 3
Figure 2. Facilities of Oroville Dam, Including Main Dam Embankment, Flood Control Outlet Spillway, and Roller-Compacted Concrete Apron below Emergency Spillway Crest (DWR 2019) .................................................................................................. 16
Figure 3. Aerial View of Reconstructed FCO Spillway Chute and Roller-Compacted Concrete Apron on Emergency Spillway (DWR 2019) ........................................... 18
Figure 4. Schematic Profile of New RCC Buttress and Apron Together with New Secant Pile Wall Located 750 Feet Downstream of Existing Crest Structure/Weir on Oroville Dam Emergency Spillway (DWR 2019) ................................................................. 18
Figure 5. January 12, 2018, DWR Letter to FERC Outlining the CNA Project ...................... 20
Figure 6. Aerial View of Oroville Dam and Location of Appurtenant Facilities ...................... 26
Figure 7. Average Annual Risks for Dams and other Selected Engineering Projects (from Whitman 1984, Baecher and Christian 2003) ............................................... 30
Figure 8. Illustration of Generalized and Project Specific Tolerability of Risk Framework (from Figure 3-1, Chapter 3, FERC Draft Guidelines on Risk Assessment, March 2016) ........................................................................................................... 31
Figure 9. Risk Matrix Displaying Tolerable Risk Guidance for Dams for Potential Life-loss (FERC 2016) .......................................................................................................... 32
Figure 10. Extended Version of DWR O&M Asset Management Risk Matrix Used in CNA Risk Evaluations ..................................................................................................... 37
Figure 11. CNA Risk Matrix with Potential Risk Estimates Provided by Different Risk Estimators .............................................................................................................. 38
Figure 12. CNA Risk Matrix with Uncertainty Indicated Around Best Estimate ....................... 39
Figure 13. Example Progression of an Internal Erosion Potential Failure Mode (from “Best Practices in Dam and Levee Safety Risk Analysis,” United States Bureau of Reclamation and Corps of Engineers, 2013) ......................................................... 42
Figure 14. Generic Example of Using Nodal Probabilities in an Event Tree to Estimate the Likelihood of a Dam Failure .................................................................................... 43
Figure 15. Example CNA Risk Estimates for Public Safety Consequences for Three Hypothetical PFM Scenarios—Scenario B is the Critical Scenario for this Example PFM ......................................................................................................... 47

California Department of Water Resources Oroville Dam Safety Comprehensive Needs Assessment Summary
viii
Figure 16. Risk Estimates for Critical CNA PFM Scenarios Plotted on CNA Risk Matrix ........ 49
Figure 17. L2RA Existing Condition PFM Risk Estimates for Life-loss Plotted on the CNA Risk Matrix .............................................................................................................. 53
Figure 18. Highlighted Risks Used for Measure Development Plotted on the CNA Risk Matrix—Controlling Public Safety and Financial Impact Risk Values Shown ......... 57
Figure 19. Illustration of How a Risk-Reduction Measure Can Reduce Risk by Reducing the Likelihood of Failure for a Hypothetical PFM .................................................... 59
Figure 20. Illustration of How a Risk-Reduction Measure Can Reduce Risk by Reducing the Consequences of Failure for a Hypothetical PFM .................................................. 60
Figure 21. Illustration of Measure Development Approach and Three Rounds of Screening.. 63
Figure 22. Conceptual Representation of Alternative Plan Formulation Process .................... 65
Figure 23. PFM Risk Reduction for Each Higher-Risk PFM with Plan 5 (Comprising 11 Measures) .............................................................................................................. 68
Figure 24. Weighted Scores for 10 Alternative CNA Risk-Reduction Plans ............................ 71
Figure 25. Recommended Interim Implementation Project Measure—Raise Parish Camp Saddle Dam by ~3 Feet (Measure T5-P2) ............................................................. 80
Figure 26. Recommended Interim Implementation Project Measure—Install Backup Power and Remote Starters for FCO Radial Gates (Measure T3-BH.2) ........................... 81
Figure 27. Recommended Interim Implementation Project Measure—Line Palermo Canal (Measure T4-U) ...................................................................................................... 82
Figure 28. PFM Risk Reduction with the Interim Implementation Project (Measures T5-P2 PCSD Raise, T3-BH.2 FCO Backup Power/Remote Starter, and T4-U Lining Palermo Canal) ...................................................................................................... 83

Preface
ix
Preface
Oroville Dam, located on the Feather River in Butte County, is a key facility of the California State Water Project (SWP). Completed in 1967, it is owned and operated by the California Department of Water Resources (DWR). In February 2017, both the gated main spillway and the ungated emergency spillway suffered significant erosion scour damage while releasing flood waters that had flowed into Lake Oroville. Concerns for the stability of the spillway crest structures resulted in the temporary evacuation of 188,000 residents downstream of the dam. Over the next few months, flood waters were successfully managed by making controlled reservoir releases down the damaged gated main spillway through May 2017 when the gates were closed for the year and DWR began repairs to the two spillways. By the fall of 2018, the entire 3,000-foot-long chute for the gated main spillway had been completely reconstructed, and major erosion-resistant armoring had been added to the emergency spillway. The repairs resulted in making these two spillways robust structures meeting modern engineering standards.
Following the 2017 Oroville Spillway Incident, DWR made commitments to federal and State dam safety regulators, the Federal Energy Regulatory Commission (FERC) and the California Division of Safety of Dams (DSOD), to assess all of the facilities within the Oroville Dam Complex in order to identify any further dam safety and operational needs. In addition, DWR committed to identifying potential measures to address those needs and reduce dam safety risks should such measures be needed. This assessment became known as the Oroville Dam Safety Comprehensive Needs Assessment (CNA).
The CNA was initiated in January 2018 and was completed in August 2020 by DWR and its consultants. An Independent Review Board (IRB) was convened to provide independent review and recommendations on the CNA procedures and results during the project. The IRB’s recommendations were then adopted and used by the project team as the assessments progressed. The CNA project team also met eight times with a group representing the local community. This group, known as the Ad Hoc Group, included Congressman LaMalfa, State Senator Nielsen, Assemblyman Gallagher, Butte County Supervisor Connelly, Butte County Sherriff Honea and other interested parties. The Ad Hoc Group was briefed on the procedures used in the CNA Project, interim results, and final results. The group provided community-resource-related perspectives to the CNA project team, and helped DWR communicate information about the CNA process and findings to the community-at-large.
The CNA was the most comprehensive risk analysis that DWR has undertaken for any of its facilities and is possibly the most comprehensive such risk analysis for any non-federal dam in California. To further develop and apply its Operations and Maintenance (O&M) Risk Management Framework (DWR 2019) to the CNA, DWR adapted relevant concepts of risk-informed decision making (RIDM) from several federal agencies, including FERC, the US Bureau of Reclamation (Reclamation), and the US Army Corps of Engineers (USACE). These federal agencies update RIDM guidance on a regular basis, as does DWR. The CNA project team used the best available guidance documentation to inform DWR’s CNA-specific definitions of terms, overall approach, and procedural steps throughout the life of the project.

California Department of Water Resources Oroville Dam Safety Comprehensive Needs Assessment Summary
x
The CNA’s results showed that there are no dam safety issues that exhibit a need for immediate risk-reduction actions. These results are based on the finding by the CNA project team of no unacceptable risks associated with identified potential vulnerabilities of the Oroville Dam facilities. A parallel risk study by independent experts found results in general agreement with those from the CNA. In addition, a separate independent panel of experts comprising the 2019 10th Part 12D Independent Consultant (independent detailed review required by FERC every five years) found the same basic conclusion for Oroville Dam and its appurtenant facilities, as documented in their July 2020 report:
“The project is suitable for continued safe and reliable operation. No emergency remedial measures are necessary for continued safe operation.”
Tenth Five Year Part 12D Safety Inspection Report and 2019 Director’s Safety Review Board Report, July 2020
The CNA results provide a snapshot in time of the condition of the dam facilities. Moving forward, DWR will use its monitoring and surveillance program to detect changes in condition, and its ongoing operations and maintenance program to address changes in condition as needed. One aspect of that operations and maintenance program is to take practicable preventative measures when those are identified.
Though no unacceptable risks were found, and therefore no immediate actions need to be taken, DWR concluded that there were potential vulnerabilities identified that require further consideration and examination to better estimate their actual risk. In addition, the CNA developed potential risk reduction measures for consideration to potentially reduce risks to even lower levels, and recommended implementation of these measures if they are found to be reasonably practicable. To be reasonably practicable, a risk reduction measure must be capable of being implemented and to be cost effective – that is, the cost of implementation must not be disproportionately large compared to the benefits obtained.
The CNA project team recommended the implementation of several of these potential risk-reduction measures, or improvements, to be completed over three phases (early, interim, and long-term). The first phase (early) is already underway and the second phase (interim) would be completed within approximately the next five years. Risk management and implementation of any additional major risk-reduction measures or plans at Oroville over the long-term will depend upon the risks that exist at Oroville relative to those at other SWP dams and facilities. Since there are no unacceptable risks at Oroville, there is not a need for any immediate risk reduction actions. DWR will need to make balanced risk-informed decisions regarding where the highest risks are with the SWP, and to then set priorities to reduce those risks across the entire SWP.
The CNA’s results, which are a snapshot in time of the dam facilities’ condition, showed no dam safety issues that exhibit a need for immediate risk-reduction actions.

Preface
xi
The results of the CNA evaluations were documented in several reports that together comprise several thousand pages. These documents were submitted to both FERC and DSOD. These documents contain Critical Energy Infrastructure Information and, by federal regulation, cannot be released to the public due to homeland security concerns. This report was prepared for distribution to the public to provide a complete summary of the CNA evaluations conducted, the results of the evaluations, and the findings and recommendations prepared by the CNA project team.


Executive Summary
1
Executive Summary
Background Oroville Dam is located in Butte County, California, on the Feather River in the foothills of the Sierra Nevada, about 6 miles east of the City of Oroville and 75 miles north of Sacramento. Oroville Dam is the highest dam in the United States and is the key facility of the State Water Project (SWP)—a system of reservoirs, aqueducts, tunnels, pipelines, power plants, and pumping plants. The California Department of Water Resources (DWR) owns and operates the SWP to store and distribute water to supplement the needs of urban and agricultural water users in Northern California, the San Francisco Bay area, the San Joaquin Valley, the Central Coast, and Southern California. It provides drinking water to over 27 million people in the State.
The dam and its related facilities (e.g., spillways, powerplant, outlets, and smaller saddle dams) were completed in 1967. In addition to providing water supply for the SWP, the Oroville Dam facilities are also operated for reducing flood risk to downstream communities on the Feather River, generating power, improving water quality in the Sacramento-San Joaquin Delta, providing local recreation, and providing fish and wildlife preservation and enhancement.
2017 Oroville Spillway Incident In February 2017, a section of the 3,000-foot-long chute slab for the gated main spillway of Oroville Dam broke loose while releasing flood waters that had flowed into Lake Oroville. This spillway, known as the flood control outlet (FCO) or main spillway, has been the principal facility used for managing flood flows over the previous 50-year life of the Oroville Dam Complex. Following this initial damage, a large erosion hole formed in the area where the concrete slab sections had been scoured away. This scour hole enlarged as additional reservoir water was released on the damaged FCO chute. Managing rising lake levels while minimizing further erosion of the FCO spillway resulted in flow over the dam’s emergency spillway weirs for the first time. The natural hillside downstream of the emergency spillway structures then began to suffer scour erosion, causing concern about whether the erosion would reach the crest monoliths.
As a precaution against the possibility that the scour erosion would induce damage to the spillway crest structures, approximately 188,000 people were evacuated from downstream communities. At the same time, DWR quickly increased the flow discharges on the damaged FCO spillway to lower the reservoir and stop the eroding flows on the emergency spillway, which were halted within a few hours of the evacuation order. Residents were able to begin returning to their homes a few days after the evacuation order was issued.
Throughout the spring of 2017, dam operators continued to make periodic releases over the damaged FCO chute to manage the water levels in the reservoir. The spillway gates were closed for the year in May 2017 and full-scale spillway repairs began. By the fall of 2018, DWR and its construction contractors had completely reconstructed the entire FCO spillway chute. It had also

California Department of Water Resources Oroville Dam Safety Comprehensive Needs Assessment Summary
2
completed work to bolster the stability of the emergency spillway crest structures, including construction of a subsurface secant pile wall and a roller-compacted concrete (RCC) surface, and a stabilizing buttress extending 750 feet downstream of the crest structures. The rebuilt FCO spillway chute and the armoring on the emergency spillway resulted in robust structures meeting modern engineering standards.
Following the 2017 Oroville Spillway Incident, DWR committed to further examine dam safety needs at the Oroville Dam Complex by conducting an Oroville Dam Safety Comprehensive Needs Assessment (CNA). This report provides a summary description of the activities and outcomes of the CNA.
CNA Purpose The CNA is a planning study tasked with completing the following:
• Identify and prioritize dam safety and operational needs at the Oroville Dam Complex.
• Identify measures to improve the safety and reliability of Oroville Dam and its related structures.
• Identify potential plans (combinations of measures) at the Oroville Dam Complex for DWR management to consider for future implementation and prioritization through normal practices and procedures.
The first goal of the CNA was to provide DWR decision makers with enough information to better understand the dam safety and operational needs at the Oroville Dam Complex, and how they compare to those at other critical facilities in the SWP. To ensure that information from the CNA could be compared to ongoing and future studies at Oroville Dam and to other facilities in the SWP, the CNA project team applied DWR’s risk-informed approach for dam safety planning studies. The second and third goals were to provide DWR decision makers with an array of potential risk-reduction measures and group them into theme-specific alternative plans for future consideration. These alternative plans differ in the number of measures incorporated and the level of anticipated risk reduction.
Because this is a planning study, enough information is provided to inform a choice of measures and/or plans, but not enough in most cases for actual implementation or construction. Additional engineering and design work will be needed before any particular plan is implemented. Major dam safety projects commonly take a decade or more to design and complete.
Scope and Scale of the CNA The CNA was organized into six technical focus areas, which were referred to as “tasks” in the CNA. Each of these tasks focused on a different aspect of the Oroville Dam facilities:

Executive Summary
3
Task 1 – Emergency Spillway. Task 2 – Operations. Task 3 – FCO Spillway Headworks and Chute. Task 4 – Low-Level Outlets (Hyatt Powerplant, River Valve Outlet System, and Palermo
Tunnel Outlet). Task 5 – Embankments (Oroville Dam, Bidwell Bar Canyon Saddle Dam, and Parish
Camp Saddle Dam). Task 6 – Monitoring/Instrumentation.
A multi-disciplinary team of civil engineers, geotechnical engineers, geologists, mechanical engineers, and electrical engineers were assigned to each task team. A separate project integration team composed of experienced and expert engineering and water resource professionals provided overall project guidance, methodological consistency, and quality review for the efforts of each task team. The project integration team also formulated and evaluated alternative plans, completed the CNA project reports, and provided overall project management.
The locations of the facilities at Oroville Dam are illustrated in Figure 1. The Bidwell Bar Canyon Saddle Dam (47 feet high) and Parish Camp Saddle Dam (27 feet high) help retain Lake Oroville and are located in separate arms of the reservoir away from the main Oroville Dam.
Figure 1. Aerial View of Oroville Dam and Related Facilities After 2017-18 Repairs

California Department of Water Resources Oroville Dam Safety Comprehensive Needs Assessment Summary
4
Independent Review and Community Engagement
CNA Independent Review Board DWR convened a five-person Independent Review Board (IRB) to provide an outside, independent quality review on the assumptions, scope, technical work, and findings of the CNA project team. The members of the IRB are considered to be national experts with diverse expertise, experience, and perspectives in the areas of dam safety evaluations, design modifications of large dams, complex multipurpose dam safety operations and projects, water supply system infrastructure, large government organizations, water policy, environmental science, and stakeholder engagement. DWR commonly convenes such boards to provide independent technical reviews of SWP dams as a matter of good practice in managing dam safety. The IRB met 10 times with the CNA project team over the course of the project and reviewed all key deliverables. The IRB issued 79 formal comments and recommendations during the course of the CNA project. The CNA project team addressed these comments to the satisfaction of the IRB. A copy of the IRB’s final report is attached to this document as Appendix B.
CNA Ad Hoc Group A CNA Ad Hoc Group was formed for the purpose of communicating issues that were important to the local community to the CNA project team, and to provide updates on the progress and results of the CNA project back to the local community. The CNA Ad Hoc Group was chaired by State Senator Jim Nielsen (R-Red Bluff), State Assemblyman James Gallagher (R-Yuba City), and John Yarbrough of DWR. It included elected officials US Representative Doug LaMalfa (R-Richvale), Butte County Sheriff Kory Honea, Butte County Supervisor Bill Connelly, along with several community leaders and interested parties including Michael Bessette, Sean Early, Matt Mentink, Rune Storesund, Ron Stork, and Genoa Widener. The group provided community-resource-related perspectives to the IRB and DWR; and helped DWR communicate information about the CNA process and findings to the community-at-large. The Ad Hoc Group reviewed a draft of this report prior to its publication.
CNA Risk Analysis Methodology To identify dam safety and operational needs associated with the facilities in the Oroville Dam Complex, the CNA project team employed the risk analysis approach. This approach consisted of each multi-disciplinary task team having workshops that used expert professional judgment to assess potential vulnerabilities of the facilities. Each task team examined potential mechanisms whereby a facility could fail, be damaged, or simply not perform as designed.
Definition of Risk
In engineering practice, risk is commonly defined as a product of the likelihood of an adverse event times the consequences of that event. It can be expressed with this equation:
Risk = Likelihood of Failure x Consequence

Executive Summary
5
These mechanisms are known as potential failure modes (PFMs). The CNA followed these basic steps to develop PFMs and analyze risk:
1. Brainstorm potential failure modes.
2. Develop final PFM list (consolidate identical and nearly identical PFMs; screen out those not useful).
3. Identify factors that make each PFM more likely to occur and factors that make each PFM less likely to occur.
For most non-federal dams, such as Oroville Dam, the process generally stops at this point and the PFM development is documented in a report together with a general categorization or prioritization of the PFMs. For dams owned by federal agencies such as the United States Army Corps of Engineers (USACE) or the United States Bureau of Reclamation (Reclamation), the process typically continues in order to estimate the risk associated with each PFM (i.e., probability of failure and consequences of failure). This latter approach was used in the CNA risk analyses with the additional steps below:
1. Estimate probability of PFM occurring (e.g., probability of a dam or spillway headworks failing and an uncontrolled release of reservoir).
2. Estimate likely consequences should the PFM occur (see categories of consequences listed below).
3. Map all PFMs onto a risk matrix (this enables comparison of likelihood and consequences of different PFMs). It also helps evaluate risk magnitudes with tolerable levels recommended by federal agencies and the dam industry, and to compare the risks at one facility or dam to another one. See Chapter 4 for more details on risk analysis, tolerability, and decision-making.
The CNA risk analysis approach is semi-quantitative, as opposed to qualitative or fully quantitative—it estimates probability of failure and consequences to only orders of magnitude (e.g., annual probability of failure 1/100,000 to 1/10,000; or potential life-loss of 1–10).
PFM Analysis and Risk Assessment
Potential Failure Mode Analysis is a process by which a group of experts evaluate a potential chain of events for a theoretical dam or facility failure and consider factors that make the failure either more likely or less likely. PFM analyses have been commonly performed over the last two decades by federal agencies (such as the U.S. Army Corps of Engineers and the U.S. Bureau of Reclamation) for the management of federally-owned dams. Dams under the jurisdiction of the Federal Energy Regulatory Commission, including Oroville Dam, have also been required to complete PFM analyses since 2002. Outside of federal agencies, however, the use of risk assessments to evaluate PFMs beyond simple qualitative judgments (actually estimating likelihoods and consequences for each PFM) have not generally been done.

California Department of Water Resources Oroville Dam Safety Comprehensive Needs Assessment Summary
6
Consistent with DWR’s O&M Risk Management Framework, the CNA risk analyses considered the following five consequence categories in evaluating potential risks:
• Public safety (life-loss and injuries).
• Regulatory compliance (potential for problems/negative rulings from dam safety and other regulatory agencies).
• Reliability to deliver SWP water.
• Reliability for other SWP purposes (power, flood risk reduction, fish and wildlife preservation and enhancement, and recreation).
• Financial impacts (both direct and indirect from downstream impacts).
In addition, the CNA PFM risk estimates considered multiple failure scenarios. In addition to examining the ultimate failure state, such as an uncontrolled release of water, each PFM was also evaluated for the risks associated with heavy damage (but no uncontrolled release) and also minor to no damage. Thus, each PFM had three to four failure state scenarios and five consequence categories. Therefore, each PFM in the CNA risk analyses represented at least 15 or more risk calculations.
In the end, 129 PFMs were fully developed, with over 400 PFM scenarios, resulting in over 2,000 individual risk estimates documented for different consequences.
Primary Finding from Risk Analyses After evaluating all 129 PFMs developed, the CNA project team found that none of the PFMs represented an unacceptable risk, although two PFMs were on the borderline. As a result, no dam safety issues were identified that exhibit a need for immediate risk-reduction actions. The vast majority of the PFM risk estimates were found to have tolerable, or even negligible risks. However, while no unacceptable risks were found, there were several
CNA Facts
The CNA represents the largest and most comprehensive risk analysis that DWR has undertaken for any of its facilities and is possibly the most comprehensive such risk analysis for any non-federal dam in California. The following are noteworthy facts:
• It was exhaustive. It started with 367 potential failure modes (PFMs) drawn from the project team, previous studies and other sources. After screening and consolidation of duplicative PFMs, 129 PFMs were fully developed.
• It considered multiple potential failure scenarios. The CNA risk analyses considered ultimate failures, heavy damage, and minor to no damage scenarios. Commonly three to four failure scenarios with different failure states were evaluated for each PFM.
• It considered multiple potential consequences. Five potential consequence categories were considered for each PFM scenario.
• Its results were validated. A separate, parallel, independent risk analysis mandated by Congress found results in general agreement with those completed by the CNA task teams.
In the end, over 2,000 individual risk estimates were completed for the facilities in the Oroville Dam Complex.

Executive Summary
7
PFMs/potential vulnerabilities that will require further consideration, including examining potential risk reduction measures to reduce risks to even lower levels, and to implement these measures if they are found to be reasonably practicable.
This finding is consistent with risk-informed decision making practices in use by federal agencies with large portfolios of dams and dam safety programs guided by risk-based approaches. The CNA risk estimates also showed general agreement with those recently completed for the Oroville Dam Complex by a separate independent team completing a similar semi-quantitative risk analysis. This separate risk analysis effort, known as a Level 2 Risk Analysis (L2RA), was mandated by the United States Congress following the 2017 Oroville Spillway Incident.
Types of Potential Risk Reduction Measures and Alternative Plans Developed by the CNA Project
Risks Considered in the Development of Measures and Plans While no unacceptable risks were identified, the CNA project team selected 31 of the 129 PFMs (potential vulnerabilities or dam safety needs) upon which to base development of risk-reduction measures and plans. These 31 PFMs represented higher-risk PFMs with opportunities for potential risk reduction.
The 31 PFMs fell into the following five categories:
• Possibility that erosion on the unlined emergency spillway channel could result in flooding of the Hyatt Powerplant, resulting in an extended outage of the plant and limitations in the abilities to deliver water or to draw down the reservoir during an emergency.
• Vulnerabilities of the Hyatt Powerplant and other outlets (RVOS and Palermo) with similar potential consequences to that described above.
• Possibility that structural vulnerabilities of the FCO headworks structure could lead to inability to operate the gates, actual failure of the gates, or potential failure of the headworks structure itself, leading to a potential uncontrolled release of the reservoir in some circumstances.
• Possibility that a rare, extreme storm (beyond a probable maximum flood) could result in water flowing over the crests of the Oroville Dam, Bidwell Bar Canyon Saddle Dam, and Parish Camp Saddle Dam resulting in a breach in one or more of the embankments and uncontrolled release of the reservoir [All three embankment dams can safely retain flood waters associated with a probable maximum flood (PMF), the largest flood loading generally required by dam safety regulatory agencies to be safely retained by a dam. For Oroville, the PMF is associated with an approximate

California Department of Water Resources Oroville Dam Safety Comprehensive Needs Assessment Summary
8
21,000-year return period. For the CNA assessments, even higher flood loadings were considered ranging up to average return periods of 40,000 and 100,000 years. It is for these higher, more extreme flood events, that flood waters could overtop the crests of the dams and lead to a failure of the dams].
• Possibility that internal erosion could occur within the upper portion of Oroville Dam, particularly at its contact point with the FCO spillway on the right-hand side.
A prominent consideration was the ability of the FCO and the Hyatt Powerplant to be able to reliably deliver water or to rapidly draw down the reservoir during an emergency.
Measures and Plans to Further Reduce Risk (Large-Scale, Long-Term) The CNA project team identified 22 potential risk-reduction measures that were later included in different combinations in alternative risk-reduction plans. These measures ranged from relatively small projects that would each cost less than $2 million, to major new facilities that could cost over $2 billion. These measures fell into the following groups:
• Major new facilities such as a new gated concrete spillway to replace the emergency spillway, or a new low-level (tunnel) outlet to provide additional reservoir drawdown capability and redundancy for water delivery.
• Structural improvements to the FCO headworks and Hyatt Powerplant to ensure long-term reliability to be able to release reservoir water for water supply or for flood risk reduction.
• Rock slope stabilization at the outlet portals to reduce the potential for landslides at these locations and to increase the likelihood that the outlets remain functional during extreme precipitation or seismic events.
• Modifications to the upper portion of the Oroville Dam, particularly at the right abutment, and limited raises (e.g., 3 feet) at all three embankments to reduce the risks of internal erosion or flood overtopping breaches at the dams.
• Armoring measures for the unlined portion of the emergency spillway channel to reduce the potential for scour erosion into the Diversion Pool (Feather River) and the threat of flooding of the Hyatt Powerplant.
These 22 measures were then included in a variety of combinations into 10 potential alternative risk-reduction plans. Each alternative plan was developed with a specific emphasis or theme, as recommended by the IRB. The number of measures in each plan ranged from six to 17, with cursory cost estimates ranging from $500 million to $3.7 billion for each plan. Table 1 provides a snapshot of the plans and the measures within each plan. At the outset of the CNA, the CNA project team planned to recommend a small number of alternative plans, i.e., three or four, for further consideration. However, after its review of the alternative plans, the IRB recommended

Executive Summary
9
that all 10 plans be carried forward. The CNA project team concurred with the IRB’s recommendation, and recommends that all 10 plans be considered by DWR in future risk-reduction efforts.
It should be noted that these 10 alternative plans represent a variety of options that DWR could consider along with cost to further reduce risks at the Oroville Dam Complex. The actual implementation of any potential risk-reduction plan at Oroville would depend upon the risks that exist at Oroville relative to those at other SWP dams and facilities. Since there are no unacceptable risks at Oroville, DWR will need to make balanced risk-informed decisions regarding where the highest risks are within the SWP, and to then set the priorities to reduce those risks across the entire SWP.

California Department of Water Resources Oroville Dam Safety Comprehensive Needs Assessment Summary
10
Table 1. CNA Alternative Plans and Measures in Each Plan

Executive Summary
11
CNA Early Implementation Project (Currently Underway) During the completion of the CNA, the CNA project team recommended the following Early Implementation Projects:
• Installation of 13 new piezometers (water level measurement devices) in Oroville Dam to improve seepage monitoring (status: eight piezometer installations currently completed; awaiting regulatory approval for remaining five piezometers).
• Installation of four new piezometers in the rock foundation of the FCO headworks structure to monitor water pressures acting on the structure (status: all four installations completed).
• Completion of a new state-of-the-art seismic stability analysis of Oroville Dam to update past evaluations on the potential performance of the dam during strong earthquake shaking (status: program and detailed scope are being developed).
These projects will provide additional information that will help dam managers better understand current performance and inform future decisions regarding the need for implementing potential risk-reduction measures or plans. These projects were identified early in the CNA project and the CNA project team recommended that work be initiated on them before the CNA project was completed. DWR management concurred and all three of these Early Implementation Projects are now underway with some portions already completed.
Recommended CNA Interim Risk-Reduction Actions (Near-Term Projects) While DWR is considering long-term risk-reduction measures for the entire SWP as part of its overall asset management approach, including potential risk-reduction plans at the Oroville Dam Complex, the CNA recommends several interim risk-reduction actions for the Oroville Dam Complex be completed in the near term (considered to be within approximately five years).
Recommended CNA Interim Implementation Project The CNA recommends that the following Interim Implementation Project, comprising three specific risk-reduction measures, be completed in the near term:
• Raise Parish Camp Saddle Dam by 3 feet to reduce the risk of flood waters overtopping and breaching the dame.
• Line Palermo Canal to reduce seepage into the rock slope above Hyatt Powerplant and switchyard and improve stability of the rock slope. This would help reduce the likelihood of a landslide occurring in this area that would impact the switchyard and Area Control Center (ACC) for the Hyatt Powerplant.

California Department of Water Resources Oroville Dam Safety Comprehensive Needs Assessment Summary
12
• Install new remote starter and power connections to the FCO radial gates to improve their reliability. This provides another redundant power supply to operate the radial gates during a flood event, and allows operators to raise the gates locally at the FCO headworks without relying upon either external power or control communication lines.
All three of the measures listed above for the Interim Implementation Project were risk-reduction measures identified by the CNA project team for inclusion in the alternative plans for future consideration (refer to Table 1). However, the IRB recommended that they be combined as a project and implemented in the near term since they represent relatively inexpensive, cost-effective risk-reduction measures, and the CNA project team concurred with this recommendation.
Additional CNA Recommended Interim Measures The CNA recommended the following additional interim measures be implemented in the near-term:
• Purchase and stockpile equipment and materials for flood-fighting at the dam embankments and other areas in the Oroville Field Division during extreme floods.
• Complete a study to examine the feasibility and risk reduction provided by adding small and limited crest parapet walls on the Oroville Dam at the left and right abutments. Due to the extra height (camber) that the Oroville Dam was originally constructed to (up to 5 extra feet), the majority of the dam is not overtopped even for a 100,000-year flood event. However, the extra height was not provided at the ends of the dam at its abutments. Therefore, short parapet walls a few hundred feet in length at each end of the dam would possibly be a cost-effective measure to reduce the risk associated with flood overtopping and breach of the dam during very extreme events. This was originally recommended by the IRB as a potential cost-effective risk-reduction measure and the CNA project team has endorsed this examination.
• Implement the higher priority mechanical and electrical component reliability improvements recently recommended following a seismic walkdown inspection of the Hyatt Powerplant as well as those recently suggested by the Oroville Field Division. These improvements would improve the reliability of the mechanical equipment within the powerplant. These should be implemented as part of DWR’s normal procedures for refurbishment and replacement.
• Complete further studies of the facilities in the Oroville Dam Complex. The CNA project team identified over 25 possible studies to be completed, including hydrologic, scour, landslide, mechanical reliability, and seismic stability investigations. These studies are targeted to better inform and estimate the highest risk PFMs identified during the CNA project. These proposed studies should be

Executive Summary
13
reviewed by DWR’s Dam Safety Services Office and prioritized for completion on the basis of the level of risk associated with the PFMs that the studies are meant to inform.
• Implement reservoir operation enhancements related to forecast-informed reservoir operations (FIRO). These enhancements will require DWR to continue its work with the USACE and Yuba Water Agency to develop coordinated, forecast-informed strategies to account for the absence of Marysville Reservoir and to better maximize flood risk reduction and water supply benefits with the facilities that are now available.
Recommended Long-Term Path Forward for Future Consideration of Alternative Risk-Reduction Plans (Long-Term Risk-Management Process at Oroville) The following is a recommended long-term path toward implementing future risk-reduction projects at the Oroville Dam Complex, and at other facilities of the SWP:
1. Continue and enhance the portfolio risk assessment of critical facilities in the SWP to gain a progressively more detailed understanding of the risks associated with the facilities of the Oroville Dam Complex relative to those at other SWP critical facilities. Such portfolio risk assessments will assist DWR in making balanced risk-informed decisions regarding where the highest risks are and set the priorities to reduce those risks, including those at the Oroville Dam Complex. The theme of this asset management approach includes focusing on reducing the risks that are the most urgent across all SWP facilities.
2. Integrate this information into future understanding of risks at the Oroville Dam Complex. Following the completion and outcomes of the recommendation above, a plan from, or similar to, one of the 10 alternative plans developed during the CNA project should be considered for implementation. Over the near term (next 5 years), additional engineering and geologic studies are being recommended for potential vulnerabilities with the highest potential risks. Implementation of any risk reduction plan will depend on whether any new dam safety deficiencies are identified at the Oroville Dam Complex, and if it is determined that any additional facility reliability enhancements are warranted at the Oroville Dam Complex. It may be that no further risk-reduction projects beyond the Interim Implementation Project and Additional Measures will be warranted for the near future, or even foreseeable future, particularly if there are major safety or operational needs elsewhere in the SWP. This is because the risks in this study for the Oroville facilities were not found to be unacceptable, and the only PFM with a marginal public safety risk—overtopping of Parish Camp Saddle Dam—will be addressed as part of the Interim Risk-Reduction Project.

California Department of Water Resources Oroville Dam Safety Comprehensive Needs Assessment Summary
14
3. If a project or plan is considered at Oroville Dam, conduct more detailed studies to confirm feasibility and risk before project start. It is recommended that feasibility studies with quantitative risk analyses be conducted before any risk-reduction plan be implemented in order to confirm, refine, and/or supplement the dam safety needs identified in the CNA study. However, the implementation of additional individual risk-reduction measures may not necessarily require either new feasibility studies or quantitative risk analyses. In such cases, additional studies are not recommended.
4. Further consider climate change in future projects. Climate change may influence the effectiveness of future risk-reduction measures, and therefore influence residual risks. Inclusion of resilience was one aspect of the CNA’s evaluation of risk management measures and plans; the characterization of resilience informed the selection of measures and plans that will be effective under climate change. Nevertheless, future feasibility studies of one or more preferred risk-reduction plans should consider further the effects of climate change on facility performance and residual risk, which may impact both the selection and the level of implementation of the preferred plan.

Chapter 1. Introduction
15
Chapter 1. Introduction
Report Overview This report describes the activities and outcomes of the California Department of Water Resources’ (DWR) Oroville Dam Safety Comprehensive Needs Assessment (CNA). The CNA was a water resources planning study tasked with identifying dam safety and operational enhancements, if needed, at the Oroville Dam Complex together with potential risk-reduction measures to address any identified needs. The measures were grouped in various combinations into different alternative plans for DWR management to consider for future implementation. The goal was to provide DWR decision makers with enough information to determine whether additional interest and investigation in one or more of the alternative plans developed by the CNA project team is warranted.
Background Information on Oroville Dam and its Appurtenant Facilities Oroville Dam, in Butte County, California, is located on the Feather River in the foothills of the Sierra Nevada, about 6 miles east of the city of Oroville and 75 miles north of Sacramento. It is the highest dam in the United States. Oroville Dam is a key component of the State Water Project (SWP), a water storage and delivery system of reservoirs, aqueducts, tunnels, pipelines, power plants, and pumping plants. DWR owns and operates the SWP to store and distribute water to supplement the needs of urban and agricultural water users in Northern California, the San Francisco Bay area, the San Joaquin Valley, and Southern California. The Oroville facilities are also operated for flood management, power generation, water quality improvement in the Sacramento-San Joaquin Delta, recreation, and fish and wildlife preservation and enhancement.
The facilities of the Oroville Dam, some of which are visible in Figure 2, were completed in 1967. The facilities have reduced flood risks to downstream communities for over 50 years during regularly occurring floods in the Feather River watershed while fulfilling water deliveries and meeting environmental requirements and other project purposes.

California Department of Water Resources Oroville Dam Safety Comprehensive Needs Assessment Summary
16
Figure 2. Facilities of Oroville Dam, Including Main Dam Embankment, Flood Control Outlet Spillway, and Roller-Compacted Concrete Apron below Emergency Spillway Crest (DWR 2019)
Roles of Federal and Dam Safety Regulatory Agencies
Role of the Federal Energy Regulatory Commission (FERC) in Regulating Oroville Dam The Federal Energy Regulatory Commission (FERC) is the federal agency responsible for overseeing a wide range of energy-related missions across the United States, one of which is hydropower generated at dams. FERC issues licenses to dam owners and requires dam owners to operate and maintain their dams to certain standards in order to keep their license. The process also includes periodic required inspections and assessments. All proposed modifications to a hydropower dam such as Oroville need to be reviewed and approved by FERC prior to implementation. FERC also requires an in-depth review and inspection of hydropower dams by an independent consultant every five years. The risk-informed methodologies and standards used by the CNA project team were informed by risk-informed decision-making (RIDM) guidelines published by FERC, and by other federal agencies such as the United States Army Corps of Engineers, and the United States Bureau of Reclamation.

Chapter 1. Introduction
17
Role of Division of Safety of Dams (DSOD) in Regulating Oroville Dam The Division of Safety of Dams (DSOD) is a State agency responsible for regulating dam safety for non-federal dams within the State of California to prevent failure, safeguard life, and protect property. The California Water Code entrusts State dam safety regulatory power to the DSOD. DSOD provides oversight to the design, construction, and maintenance of over 1,200 non-federal jurisdictional-sized dams in California. Dams such as Oroville are inspected at least annually, and all proposed modifications to the dams need to be reviewed and approved by DSOD prior to implementation.
The 2017 Oroville Spillway Incident and Motivation for the Comprehensive Needs Assessment In February 2017, a section of the flood control outlet (FCO) spillway chute slab broke loose, and a large erosion hole formed in the area where the concrete slab sections were missing. Managing rising lake levels while minimizing further erosion of the FCO spillway resulted in flow over the dam’s emergency spillway weir for the first time. The natural hillside downstream of the emergency spillway crest structures then began to suffer scour erosion, causing concern about whether the erosion would reach the crest monoliths. As a precaution against the possibility that the scour erosion would damage the crest monoliths, approximately 188,000 people were evacuated from downstream communities; residents were allowed to return to their homes within a few days.
Throughout the spring of 2017, dam operators continued to make periodic releases to manage the water levels in the reservoir. The spillway gates were closed for the year in May 2017 and full-scale spillway repairs began. By the fall of 2018, DWR and its construction contractors completed reconstruction of the FCO spillway chute and completed work to bolster the emergency spillway, including construction of a subsurface secant pile wall and a roller-compacted concrete (RCC) apron and buttress extending 750 feet downstream of the crest structure, as shown in Figure 3 and Figure 4.
Motivated in part by the 2017 Oroville Spillway Incident, the CNA was formally initiated in January 2018.

California Department of Water Resources Oroville Dam Safety Comprehensive Needs Assessment Summary
18
Figure 3. Aerial View of Reconstructed FCO Spillway Chute and Roller-Compacted Concrete Apron on Emergency Spillway (DWR 2019)
Figure 4. Schematic Profile of New RCC Buttress and Apron Together with New Secant Pile Wall Located 750 Feet Downstream of Existing Crest Structure/Weir on Oroville Dam Emergency Spillway (DWR 2019)

Chapter 1. Introduction
19
Purpose and Commitment for the CNA Project Following the 2017 Oroville Spillway Incident, DWR made a commitment to FERC and DSOD to further examine dam safety needs at the Oroville Dam Complex. This commitment was initially documented in June 27 and 28, 2017, letters to the two agencies. The CNA project was formally initiated in January 2018 to identify a set of alternative plans to support DWR’s goal of identifying risk reduction enhancements, if needed, for the reliability and safety of the Oroville Dam and appurtenant structures.
The outline and goals of the project were documented in a January 12, 2018, letter to FERC (see Figure 5). Key excerpts from this letter are provided below:
“By letter dated June 28, 2017, the Department of Water Resources (DWR) informed the Federal Energy Regulatory Commission (FERC) of its intent to initiate a Comprehensive Needs Assessment (project) to identify measures to bolster the safety and reliability of Oroville Dam and the appurtenant structures…
A list of prioritized dam safety and operational reliability needs will be produced through completion of the project. Those needs will then be evaluated by DWR management and scheduled as projects through normal practices and procedures.”
The CNA mission can thus be summarized as follows:
• Identify and prioritize dam safety and operational needs.
• Identify measures to improve the safety and reliability of Oroville Dam and its appurtenant structures.
• Identify potential plans (combinations of measures) for DWR management to consider for future implementation and prioritization through normal practices and procedures.

California Department of Water Resources Oroville Dam Safety Comprehensive Needs Assessment Summary
20
Figure 5. January 12, 2018, DWR Letter to FERC Outlining the CNA Project

Chapter 1. Introduction
21
Organization of this Report The details of the CNA project and results are summarized in a series of reports submitted to FERC and DSOD that contain sensitive Critical Energy Infrastructure Information (CEII) and therefore cannot be released to the public for homeland security reasons. This report provides a condensed, but complete, summary of the overall procedures, findings, and recommendations coming out of the CNA project that can be released to the public. It is organized as follows:
Executive Summary—an overall summary of the CNA project and its findings and recommendations.
Chapter 1: Introduction, purpose, and organization of this report.
Chapter 2: CNA scope and organization.
Chapter 3: Tolerable risk approach.
Chapter 4: Risks estimated for existing conditions.
Chapter 5: Development of potential risk-reduction measures and plans.
Chapter 6: Findings and recommendations.
Chapter 7: Reference list.
Appendix A: List of Abbreviations and Glossary.
Appendix B: Final Report of the Independent Review Board.

California Department of Water Resources Oroville Dam Safety Comprehensive Needs Assessment Summary
22
This page left blank intentionally.

Chapter 2. CNA Scope, Organization, and Design
23
Chapter 2. CNA Scope, Organization, and Design
Organizing Principles of the CNA The CNA was conducted according to the well-established steps of a risk-informed water resources planning study, which are:
1. Identify issues through risk assessment, as well as constraints, assumptions, and opportunities.
2. Identify measures to address those issues.
3. Combine measures to formulate alternative plans.
4. Evaluate alternative plans with agreed-upon metrics.
5. Compare and rank alternative plans.
6. Recommend a set of plans for further deliberation.
The Level of Detail Used by the CNA The CNA was designed to provide decision makers with a level of detail sufficient to determine whether a risk-mitigation project deserves further deliberation. It used a limited level of detail to ensure efficient use of resources in completing the early phase of the investigation. For this reason, the CNA used semi-quantitative descriptions of risk for the existing condition and preliminary descriptions of risk management measures.
Why and How the CNA was Risk-Informed A major consideration in the CNA processes was to provide a mechanism for DWR decision makers to better understand the risks at the Oroville Dam Complex and how they compare to those at other critical facilities in the SWP. For this reason, the CNA project was completed as a risk-informed planning study using semi-quantitative risk evaluations.
A risk-informed planning study (in contrast to a risk-based study) assesses risk management as one factor along with other considerations. It provides a mechanism to consider the dam safety and operational needs across multiple dams and facilities within a portfolio of several such structures. It also provides a way to prioritize needs across the portfolio of structures.
As stated above, information developed about risk was one factor in the identification and assessment of measures and plans in the CNA project. In addition, the measures and plans identified by the CNA were assessed for their abilities to support resilience and to support a set of design considerations defined at the beginning of the project. These design considerations were as follows:
Note on terminology:
Measures are the building blocks of alternative plans. An alternative plan is a set of one or more management measures functioning together to address one or more needs. Alternative plans are formulated by mixing and matching measures into different combinations.

California Department of Water Resources Oroville Dam Safety Comprehensive Needs Assessment Summary
24
• Support structural integrity for all load cases.
• Support use of conventional and proven designs.
• Support constructability.
• Manage construction risk.
• Support mechanical and electrical systems reliability.
• Support operations and maintenance serviceability.
How the CNA was Conducted as a Semi-Quantitative Risk Assessment
How the CNA Defined Risk In engineering practice, risk is commonly defined as a product of the likelihood of an adverse event and the consequences of that event. It can be expressed with this equation:
Risk = Likelihood of Failure x Consequence
The CNA considered several potential failure states, including a civil, mechanical, or electrical malfunction or abnormal operation (outside the design assumptions and parameters) that adversely affects a dam’s ability to perform as intended—something greater than a “minor” or broadly acceptable consequence as defined by the CNA risk matrix. The CNA risk matrix was developed to document and evaluate risk estimates. It is described in Chapter 3 of this report.
How the CNA Used Semi-Quantitative Risk Analysis Risk assessments can be qualitative, semi-quantitative, or quantitative, depending on the allowable uncertainty of the estimates made for likelihood and consequence. The CNA was a semi-quantitative study: task teams estimated failure likelihood as order-of-magnitude likelihood ranges (for example, annual probabilities of 1/10,000 to 1/1,000). The magnitudes of potential consequences were also estimated as semi-quantitative order-of-magnitude ranges (for example, $1M to $10M). The combination of the likelihood and consequences provides the risk estimate for the potential failure mode analyzed. These estimates were plotted on the CNA risk matrix in order to make comparisons across multiple potential failure modes and to determine where the risks are relative to a defined tolerable risk line.
CNA Organization The CNA was organized into six technical focus areas, which were referred to as “tasks” in the CNA. Each of these tasks focused on a different aspect of Oroville Dam facilities:

Chapter 2. CNA Scope, Organization, and Design
25
• Task 1 – Emergency Spillway.
• Task 2 – Operations.
• Task 3 – FCO Headworks and Spillway Chute.
• Task 4 – Low-Level Outlets.
• Task 5 – Embankments.
• Task 6 – Monitoring/Instrumentation.
These six tasks were selected because together they represent the facilities and operations of Oroville Dam Complex in a comprehensive manner. A multi-disciplined team of civil engineers, mechanical engineers, geotechnical engineers, and geologists were assigned to each team. A project integration team, which included people with expertise in dam safety and water resources planning projects, was also added to the CNA project. The project integration team helped facilitate coordination and communication among the task teams, supported the task teams’ development of potential failure modes (PFMs) and risk-reduction measures, formulated and evaluated alternative risk-reduction plans, completed project documentation, and provided overall project management.
CNA Scope The CNA considered the following facilities in the Oroville Dam Complex:
• Emergency spillway.
• Flood control outlet (FCO) spillway, also called the main spillway or the service spillway, including the headworks structure and chute.
• Hyatt Powerplant.
• River Valve Outlet System (RVOS).
• Palermo Tunnel Outlet.
• Oroville Dam embankment.
• Bidwell Bar Canyon Saddle Dam embankment.
• Parish Camp Saddle Dam embankment.
The locations of the facilities at Oroville Dam are illustrated in Figure 6. The Bidwell Bar Canyon Saddle Dam and Parish Camp Saddle Dam, which are relatively small embankments 47

California Department of Water Resources Oroville Dam Safety Comprehensive Needs Assessment Summary
26
and 27 feet in height, respectively, are located on other arms of the reservoir away from the Oroville Dam.
Figure 6. Aerial View of Oroville Dam and Location of Appurtenant Facilities
CNA Independent Review Board (IRB) DWR convened an Independent Review Board (IRB) to conduct independent technical reviews of all aspects of the CNA project work and key deliverables, and to document its review of DWR’s CNA-related work products. The members of the IRB were national experts with diverse technical expertise, experience, and perspectives. Their expertise covered disciplines in geotechnical engineering, hydraulics, structures, operations, and environmental resources. Collectively, they have experience in dam safety evaluations, design modification of large dams, complex multipurpose dam safety operations and projects, water supply system infrastructure, large government organizations, water policy, environmental science, stakeholder engagement, and risk management.

Chapter 2. CNA Scope, Organization, and Design
27
The members of the CNA IRB were as follows:
• Bruce C. Muller, Jr. (Chair), Independent Consultant; retired from US Bureau of Reclamation in 2018 as the Director of Security Safety and Law Enforcement.
• Elizabeth Andrews, PE, Vice President and Principal Engineer, Environmental Science Associates.
• Lelio Mejia, PhD, PE, GE, Senior Principal, Geosyntec Consultants, Inc.
• Paul G. Schweiger, PE, CFM, Vice President, Dams and Hydraulics Section Manager, Gannett Fleming, Inc.
• Daniel L. Wade, PE, GE, Directory of San Francisco Public Utility Commission’s Water Capital Programs (Mr. Wade left the employment of SFPUC, and resigned from the IRB in December 2019).
The IRB met 10 times with the CNA project team over the course of the project. After each meeting, the IRB issued a report containing their comments and recommendations on the information and work products provided. Comments and recommendations made by the IRB were tracked in a comment log where the CNA project team also documented responses to the comments, including how and where they would be addressed in the task- and project-level final reports. The IRB issued 79 formal comments and recommendations during the course of the CNA project. The CNA project team addressed these comments to the satisfaction of the IRB. The final report of the IRB is attached to this document as Appendix B.
CNA Ad Hoc Group A CNA Ad Hoc Group was formed for the purpose of communicating issues that were important to the local community to the CNA project team, and to provide updates on the progress and results of the CNA project back to the local community. The CNA Ad Hoc Group was chaired by State Senator Jim Nielsen (R-Red Bluff), State Assemblyman James Gallagher (R-Yuba City), and John Yarbrough of DWR. It included elected officials United States Representative Doug LaMalfa (R-Richvale), Butte County Sheriff Kory Honea, Butte County Supervisor Bill Connelly, along with several additional community leaders and selected interested parties. The group provided community-resource-related perspectives to the IRB and DWR; and helped DWR communicate information about the CNA process and findings to the community-at-large.
The CNA project team met with the Ad Hoc Group eight times. (Note that the last two meetings were held by Microsoft Teams meetings/conference calls due to the need to work remotely following the onset of the COVID-19 pandemic in early 2020.)
The Ad Hoc Group meetings were recorded for the public and were available for viewing on the DWR Website and www.youtube.com. The Ad Hoc Group reviewed a draft of this report prior to its publication.

California Department of Water Resources Oroville Dam Safety Comprehensive Needs Assessment Summary
28
This page left blank intentionally.

Chapter 3. Adoption of Tolerable Risk Concepts in CNA
29
Chapter 3. Adoption of Tolerable Risk Concepts in CNA
Definition of Risk Assessment Risk assessment is the process of making a decision on whether existing risks are tolerable and present risk measures are adequate, and if not, whether alternative risk-reduction measures are justified or will be implemented (ICOLD 2005). The CNA project team found the concept of tolerable risk helpful in communicating relative risk and adopted the general concepts for this planning study. The specific risk procedures in the CNA project extended beyond processes used previously by other projects.
Definition of Tolerable Risk
Development of the Concept of Tolerable Risk as Used in Dam Safety Risk Studies In general, risks cannot be reduced to zero, therefore individuals, communities, and organizations are expected to tolerate some level of risk as part of daily life. Tolerable risk concepts are used in risk assessments to guide the process of evaluating and prioritizing a range of risk estimates for a particular facility or a portfolio of facilities. As summarized in FERC (2016) and developed by Munger, et al. (2009) and Bowles (2007), tolerable risks are:
• Risks that society is willing to live with so as to secure certain benefits.
• Risks that society does not regard as negligible or something it might ignore, but rather as something that needs to be kept under review and reduced further if and as practicable.
• Risks that society is confident are being properly managed by the owner.
The concept of tolerable risk was developed, in part, through an examination of historical rates of failure for different types of structures. Plotted in Figure 7 are the historical failure rates for different facilities or equipment, with loss of life and dollars lost plotted on the horizontal axis and annual likelihood or probability plotted on the vertical axis. These are failure rates that society has appeared to accept as tolerable over time. As shown in this figure, the rate of failure for dams is generally less than 1 in 10,000 per dam year of operation and appears to decrease further with higher consequences such as life-loss or financial impacts (from Whitman 1984 and Baecher and Christian 2003). These are not negligible risks but risks that society has chosen to tolerate.
For many dam safety evaluations, risks are commonly characterized as unacceptable, tolerable, or negligible. Unacceptable risks are higher than tolerable risks (e.g., risks above the sloping lines in Figure 7) and cannot be justified except in extraordinary circumstances. Tolerable risks are those that people and society are prepared to accept and which lie on or about the sloping lines in Figure 7. Broadly acceptable risks are risks that are regarded as negligible with no effort to review, control, or reduce. These concepts are also shown schematically in Figure 7.

California Department of Water Resources Oroville Dam Safety Comprehensive Needs Assessment Summary
30
Figure 7. Average Annual Risks for Dams and other Selected Engineering Projects (from Whitman 1984, Baecher and Christian 2003)

Chapter 3. Adoption of Tolerable Risk Concepts in CNA
31
Figure 8. Illustration of Generalized and Project Specific Tolerability of Risk Framework (from Figure 3-1, Chapter 3, FERC Draft Guidelines on Risk Assessment, March 2016)
Figure note: ALARP stands for “as low as reasonably practicable”
As described below, the CNA project team adapted the concept of tolerable risk and combined it with DWR’s risk assessment tools and processes to fit the needs of the CNA.
FERC Tolerable Risk Guidelines for Dams FERC published draft tolerable risk guidelines for dams in Chapters 2 and 3 of its 2016 draft document, Risk-Informed Decision Making Guidelines. The CNA project team notes that the technical definition of tolerable risk as presented in these FERC guidelines is largely for potential life-loss consequences. Tolerable risk concepts informed the CNA project team’s approach to displaying and communicating relative risk, and were adapted for use with CNA’s DWR-specific risk approach tools and procedures. While the DWR-specific risk procedures used expanded versions of the procedures commonly used by other agencies, they were also intended to be generally consistent with FERC guidelines. For this reason, FERC’s risk matrix and tolerable risk guidelines are summarized below.
Figure 9 depicts different areas of risk tolerability on a risk matrix.

California Department of Water Resources Oroville Dam Safety Comprehensive Needs Assessment Summary
32
Figure 9. Risk Matrix Displaying Tolerable Risk Guidance for Dams for Potential Life-loss (FERC 2016)

Chapter 3. Adoption of Tolerable Risk Concepts in CNA
33
These areas, or zones, of risk tolerability are based on the tolerable risk reference line (upper diagonal dashed line), which is based in part on historical failure rates that have been accepted over time (refer to Figure 7). The different tolerable risk zones are defined using the FERC 2016 draft guidelines. They incorporate the concept of ALARP—striving to achieve risk that is “as low as reasonably practicable,” which is defined in the next section. The tolerable risk zones are as follows:
Zone A – above the tolerable risk reference line. Risks are unacceptable except in extraordinary circumstances. Risk should be reduced to below the tolerable risk reference line regardless of cost considerations and then further until ALARP is satisfied, except in extraordinary circumstances.
Zone B – intermediate zone below tolerable risk reference line, but above lower diagonal dashed line. Risks in this zone are intolerable unless ALARP conditions are satisfied.
Zone C – lower right zone. Risks falling in this zone have high potential for life-loss (>1,000), but relatively low likelihood (<1 in 1,000,000 annual probability). Risks falling in this area require special considerations and evaluations of the project benefits and risks on a case-by-case basis.
Zone D – lower left zone below lower dashed line. Risks falling in this zone are generally tolerable; however, ALARP considerations should still be employed.
Definition of ALARP ALARP stands for a principle that states that risks are only tolerable if risks are “as low as reasonably practicable.” The technical definition of ALARP describes the case in which further risk reduction is impracticable and/or the next increment of risk reduction is not cost effective compared to the risk reduction/benefits gained. As stated in FERC (2016):
“The general ALARP concept is that risk reduction beyond a certain level may not be justified if further risk reduction is impracticable or if the cost is grossly disproportionate to the benefits obtained by the risk reduction.”
In determining whether risks are ALARP, the following factors should be considered (FERC 2016):
• The cost-effectiveness of the risk-reduction measures.
• The level of risk in relation to the tolerable risk guidelines.
• The disproportion between the sacrifice (money, time, trouble, and effort) in implementing the risk-reduction measures and the subsequent risk reduction achieved.

California Department of Water Resources Oroville Dam Safety Comprehensive Needs Assessment Summary
34
• Any relevant, recognized good practice.
• Societal concerns as revealed by consultation with the community and other stakeholders.
In other words, risks are only tolerable if all practicable measures have been applied. Such practicable measures could include modestly priced structural measures or non-structural measures. The use of ALARP to further reduce tolerable risk levels to a lower residual risk is graphically shown in Figure 8.
It is important to note that the P in ALARP stands for “practicable” rather than “practical” or “possible.” A risk-reduction measure is practicable only so long as the incremental benefit achieved in risk reduction is worth the incremental cost. Assessing practicability is a matter of judgment that seeks to answer questions such as “When are risks low enough?” and “What actions are reasonable?” (FERC 2016). Questions like these played a role in the development, evaluation, screening, and refinement of CNA risk-reduction measures.
The CNA project team found the ideas inherent in the concepts of tolerable risk and ALARP helpful in displaying and communicating the relative risks identified by the CNA task teams, as well as the changes in risk attributable to risk reduction measures and plans. Therefore, the CNA project team adapted the concepts of tolerable risk and ALARP, and adapted tools and processes developed as part of DWR’s Risk Assessment Framework, to accommodate the specific needs of the CNA, as described in the next section.
CNA Adoption of Extended Version of DWR Operations and Maintenance Asset Management Risk Matrix as Core Planning Tool
CNA Risk Matrix To accomplish its mission, the CNA needed to complete numerous semi-quantitative risk evaluations for the existing without-project condition as well as for the with-project (with risk-reduction measures and plans implemented) conditions. DWR uses a risk matrix as part of its Operations and Maintenance (O&M) asset management planning process. The CNA project team, with concurrence by the IRB, adopted an extended version of the asset management risk matrix as the core planning tool to evaluate and document the risk evaluations.
The asset management risk matrix had been developed previously by DWR to consider and prioritize risks and risk-reduction measures on the SWP. The matrix is semi-quantitative in that it includes orders-of-magnitude rows for probability and columns for consequence level. The extended version of this matrix that was used for the CNA project is shown in Figure 10.
An important function of the risk matrix is that it provides a means to compare the risks estimated for the Oroville Dam Complex to those at other DWR SWP facilities. This, in turn, helps DWR management prioritize future risk-reduction measures for the entire SWP. Another

Chapter 3. Adoption of Tolerable Risk Concepts in CNA
35
advantage is that it is a semi-quantitative risk analysis matrix, which made it appropriate for use in the CNA planning study.
The CNA project team superimposed the tolerable risk reference line and other risk reference lines from draft FERC tolerable risk guidance (refer to Figure 9) onto the extended asset management risk matrix in Figure 10. These lines are shown in the lower right of the matrix where there is a potential for life-loss. As may be seen, the risk zones of the extended asset management risk matrix align well with the draft FERC tolerable risk lines.
Combining the concepts of the various risk zones from the original asset management risk matrix with similar concepts from 2016 draft FERC guidance (refer to Figure 9) results in the categorization for risk estimates falling within the different risk zones on the extended asset management risk matrix used by the CNA project shown in Table 2.
Table 2. Categorization for Risk Estimates Falling within the Different Risk Zones on the CNA Risk Matrix
Upper Red Risks plotted in these zones likely require risk treatment, should have interim actions as necessary, and may require further analyses. The lower diagonal row of the lower red boxes is consistent with the draft FERC tolerable risk reference line for life-loss (see upper dashed line in Figure 9) with risks above this line considered to be unacceptable, except in extraordinary circumstances. Lower Red
Amber
Risks plotted in this zone should be reduced to ALARP. Risk treatments to reduce risk should be assessed. If risk cannot be reduced, ensure effective monitoring or contingency measures are in place. This zone is consistent with the FERC intermediate zone between the diagonal dashed lines which is an area where risks are intolerable unless ALARP conditions are satisfied.
Gray Risks plotted in this zone have potentially high life-loss (>1,000), but low likelihood of occurrence. According to FERC guidelines, risks plotting in this area require special consideration on a case-by-case basis.
Upper Green Risks plotted in these zones are generally acceptable but should be monitored as appropriate. This zone is consistent with the zone below the lower diagonal dashed line delineated by FERC where risks are generally tolerable, but that ALARP considerations should be employed.
Lower Green
Consideration of Uncertainty in Risk Estimates In estimating the likelihood (annual probability) and potential consequences (e.g., life-loss) for different PFMs or vulnerabilities, the CNA task teams placed their estimates to the nearest order of magnitude for both parameters, consistent with semi-quantitative risk estimates. This amounts

California Department of Water Resources Oroville Dam Safety Comprehensive Needs Assessment Summary
36
to selecting one of the rectangular “boxes” in Figure 10 in which to place the estimate. However, the uncertainty of such estimates needs to be recognized. Different risk evaluators or estimators may estimate a range of different risk estimates for the same PFM that may end up in multiple “boxes”—see Figure 11.
In developing the risk estimates, CNA task teams were charged to place their best estimate in a particular “box” in the CNA risk matrix. However, they also documented the ranges of uncertainties in the risk estimates. In most cases, the estimated uncertainties were about one order of magnitude above and below both the likelihood and the consequence level estimates. This means that when reviewing the risk estimates, it is important to recognize that the dots shown within the rectangles represent the best estimates of risk, but also that the actual risk has the potential for being commonly one rectangle above or below the best estimate, or to the left or right of the best estimate—see Figure 12. This should be considered in evaluating the results of these semi-quantitative estimates.
The above risk categorizations and definitions were adopted throughout the CNA planning study.

Chapter 3. Adoption of Tolerable Risk Concepts in CNA
37
Figure 10. Extended Version of DWR O&M Asset Management Risk Matrix Used in CNA Risk Evaluations

California Department of Water Resources Oroville Dam Safety Comprehensive Needs Assessment Summary
38
Figure 11. CNA Risk Matrix with Potential Risk Estimates Provided by Different Risk Estimators

Chapter 3. Adoption of Tolerable Risk Concepts in CNA
39
Figure 12. CNA Risk Matrix with Uncertainty Indicated Around Best Estimate

California Department of Water Resources Oroville Dam Safety Comprehensive Needs Assessment Summary
40
This page left blank intentionally.

Chapter 4. Estimated Risks for Existing Conditions
41
Chapter 4. Estimated Risks for Existing Conditions
CNA Definition of Existing Conditions The CNA used risk assessment of the existing condition to help identify dam safety and operational needs within the Oroville Dam Complex. “Existing” in the CNA context means the conditions as they are now (2020), including those facilities or components that were completed by the end of 2019. The existing condition is a theoretical construct of existing and assumed conditions, including physical, operational, environmental, social, financial, and institutional factors. The existing condition includes features that may have been in the process of being modified in 2018-2019, but only if those modifications were completed by the end of 2019. For the CNA, the existing condition was defined prior to identifying measures and formulating plans.
The existing condition was the baseline for describing the without-measure or without-plan condition. It established a benchmark at a single point in time against which risk for proposed measures and alternative plans was compared, and changes in risk attributable to the alternative plans were then determined. No future without-plan conditions were used in the risk analysis.
Potential Failure Mode Development Process A potential failure mode (PFM) analysis for a dam is a process through which a team of dam safety professionals assesses the relative risks of a particular dam. The team identifies a full spectrum of events that could lead to events or conditions such as the dam not operating correctly, damage to components of the dam, and/or an uncontrolled release of water. The team identifies the sequence of events (potential failure mode), and then determines the likelihood of those events occurring (probability) and the potential impacts associated with those events (consequences). The PFM development process was organized around these questions:
1. What sequence of events would lead to a given component of the dam failing to perform as intended?
2. What is the likelihood of that sequence of events occurring?
3. What would the consequences be if that sequence of events occurred?
CNA task teams began PFM development by looking at each facility under normal reservoir loading, and also during extreme hydrologic and seismic events. A potential series of adverse events was then postulated, including the initiation, progression, and continuation to a failure state (e.g., uncontrolled release of reservoir water). PFMs that were considered by the CNA included internal erosion of the embankments, hydrologic overtopping of the embankments, scour erosion, structural sliding stability, fault offsets of structures, and mechanical and electrical failures of gates and valve systems. An example of the sequence of initiation, progression, and continuation to failure is shown in Figure 13.

California Department of Water Resources Oroville Dam Safety Comprehensive Needs Assessment Summary
42
Figure 13. Example Progression of an Internal Erosion Potential Failure Mode (from “Best Practices in Dam and Levee Safety Risk Analysis,” United States Bureau of Reclamation and Corps of Engineers, 2013)
Estimation of Likelihood (Annual Probability) of a Potential Failure Mode The CNA used two basic approaches for estimating the likelihood (annual probability) for a PFM. For CNA PFMs for which there existed a significant body of knowledge, the task teams were able to use a nodal probability approach for each step in the sequence. The first node was typically the initiating event. So, if the initiating event was a seismic event with an average return period of 30,000 years, the probability was 1/30,000, or 3.3 x 10⁻⁵ at the first node. The probabilities of each successive step, or node, in the sequence were then multiplied together to obtain a final likelihood, or total conditional annual probability. This nodal probability process is illustrated in Figure 14, in this example yielding an annual probability of 1 x 10⁻⁶, or 1/1,000,000.
Even in those instances in which a task team was able to compute a best estimate for an annual conditional probability using an event tree, the risk value resulting from the computation was represented only to the nearest order of magnitude on the risk matrix, consistent with the semi-quantitative nature of the CNA risk analyses.
It was also acceptable to make a qualitative estimate using qualitative descriptors associated with different annual likelihoods. This guidance is shown in Table 3 and was used by CNA task teams to estimate the likelihoods of several PFMs.

Chapter 4. Estimated Risks for Existing Conditions
43
Figure 14. Generic Example of Using Nodal Probabilities in an Event Tree to Estimate the Likelihood of a Dam Failure
Table 3. Draft Qualitative Failure Likelihood Descriptors (from FERC 2018)
Failure Likelihood Descriptors
Annual Failure Likelihood Evidence
Certain More frequent (greater) than 1/10
Direct evidence or substantial indirect evidence suggests it certain to nearly certain that failure is eminent or extremely likely in the next few years.
Extreme 1/10 to 1/100 Direct evidence or substantial indirect evidence suggests that failure has initiated or is very likely to occur during the life of the structure.
Very High 1/100 to 1/1,000 Direct evidence or substantial indirect evidence suggests that failure has initiated or is likely to occur.
High 1/1,000 to 1/10,000 The fundamental condition or defect is known to exist; indirect evidence suggests it is plausible; and key evidence is weighted more heavily toward “more likely” than “less likely.”
Moderate 1/10,000 to 1/100,000
The fundamental condition or defect is known to exist; indirect evidence suggests it is plausible; and key evidence is weighted more heavily toward “less likely” than “more likely.”
Low 1/100,000 to 1/1,000,000
The possibility cannot be ruled out, the fundamental condition or defect is postulated. Evidence indicates it is very unlikely.
Very Low 1/1,000,000 to 1/10,000,000
The possibility cannot be ruled out, but no compelling evidence suggests it has occurred or that a condition or flaw exists that could lead to initiation.
Remote More remote (less) than 1/10,000,000
Several events must occur concurrently or in series to cause failure. Most, if not all, of the events are very unlikely.
Initiating Load
Yes
No
Yes
No
Yes
No
Initiation
Progression
Yes
Yes
Continuation
Intervention
No
No
Failure
0.01
0.99
0.1
0.9
0.1
0.9
0.9
0.9
0.1
0.1
P = 1x10⁻⁶

California Department of Water Resources Oroville Dam Safety Comprehensive Needs Assessment Summary
44
Estimation of Consequences for a Potential Failure Mode The task teams estimated potential consequences for each PFM in five consequence categories as follows:
• Public safety (human lives and injuries).
• Regulatory compliance.
• Reliability and flexibility of water delivery through SWP facilities.
• Reliability and flexibility of fulfilling other SWP purposes (flood control, fish and wildlife preservation and enhancement, etc.).
• Financial impact to the State of California, both direct and indirect.
These consequence categories were adapted from the DWR O&M asset management risk management framework and differ from most semi-quantitative risk analyses that consider mainly potential life-loss. The financial impacts category also considered potential downstream impacts resulting from the flooding of communities or the loss or reduction in water deliveries. The descriptors for the different consequence levels are shown in Table 4.
In the CNA, incremental consequences were estimated. Incremental consequences described how much worse the consequences would be over and above the consequences if the dam (or other facility) performed as designed. The consequence that had the highest level, up to Level 11 (Column 11) in the CNA risk matrix, was the dominant consequence for each PFM scenario. Public safety and financial impacts consequences could go as high as Level 11. This corresponds to a potential life-loss of >10,000, or a financial impact of >$1 trillion. The other three potential consequences (regulatory compliance, SWP water delivery reliability, or other SWP purposes reliability) could only go to Level 5 (Column 5 in the CNA risk matrix). This was a result of the structure and criteria previously established in the original DWR O&M asset management risk matrix. Therefore, public safety and financial impacts ended up being the controlling consequences. It should be noted that FERC and most other agencies do not have guidance for tolerable risk except for potential life-loss.
Incremental Damages
In the CNA, incremental consequences were estimated. Incremental consequences described how much worse the consequences would be over and above the consequences if the dam (or other facility) performed as designed.

Chapter 4. Estimated Risks for Existing Conditions
45
Table 4. Consequence Descriptors for Extended Asset Management Risk Matrix (Adapted from DWR Asset Management Risk Management Program)
Descriptor Insignificant Minor Moderate High Major Extreme Catastro-phic n/a n/a n/a n/a
Consequence score 1 2 3 4 5 6 7 8 9 10 11
Category: Quantitative or Qualitative Ranges
Public safety No injury Near miss, minor injuries
Minor injuries Single injury
Multiple injuries, permanent disability
0 - 1 fatalities
1 - 10 fatalities
10 -100 fatalities
100 - 1,000
fatalities
1,000 – 10,000
fatalities
>10,000 fatalities
Regulatory compliance No violation
Minor restrictions or increased oversight
Violations or fines
Violations, fines, restricted use, prosecution
Sanctions, lose rights to operate facility
Flexibility and reliability: water delivery
No impact
Unable to meet delivery schedule in Field Division
Unable to meet delivery schedules in multiple Field Divisions
Inability to fully meet SWP water deliveries Cascading effects result in damage to other facilities
Inability to meet life and safety flows Cascading effect results in uncontrolled release of water
Flexibility and reliability: other SWP purposes
No impact
Minor impact to recreation and/or fish & wildlife
Minor impact to power generation Major impact to recreation and/or fish & wildlife
Minor impact to flood control Major impact to recreation and fish & wildlife
Major impact to flood control
Financial consequences < $100K $100K -
$1M $1M - $10M $10M - $100M
$100M - $1B $1B - $10B $10B -
$100B $100B - $250B
$250B - $500B
$500B - $1T > $1T

California Department of Water Resources Oroville Dam Safety Comprehensive Needs Assessment Summary
46
Use of Multiple Failure States/Scenarios in CNA PFM Risk Estimates Each PFM was evaluated for an ultimate failure state, often involving a breach of a facility and uncontrolled release of reservoir water. However, in addition to estimating the likelihood and consequences for the ultimate failure state (i.e., uncontrolled release of reservoir water), the CNA task teams also estimated risks for two or three additional failure states or scenarios for each PFM developed. These other failure scenarios were typically heavy damage, light damage, or no damage. While the consequences were generally smaller for these lesser scenarios or failure states, their likelihoods were often greater which meant that they could be more critical from a risk perspective. The CNA project team is not aware of any other comparable risk analyses by other agencies to consider to this extent potential failure states other than uncontrolled release of reservoir water.
In most of the PFMs developed by the CNA task teams, the scenario associated with the ultimate failure state with the highest consequences was the most critical scenario, but not always. In several cases, the highest failure state or loading case did not necessarily lead to the highest risk value. The reasons for this include the following:
• The lower loadings associated with lower failure states are generally more frequent, thus increasing the likelihood of failure.
• For the same initiating event, the likelihood of heavy incremental damage without uncontrolled reservoir release is higher than ultimate failure with uncontrolled reservoir release.
• Incremental consequences may be higher for intermediate failure states.
This potential is depicted in Figure 15. In this figure, Scenario A is the most extreme loading condition and failure state scenario; Scenario B is the intermediate loading condition/failure state scenario; and Scenario C is the minor failure state/loading condition scenario. Although the consequences for Scenario B are less than those for Scenario A, Scenario B shows the highest public safety risk value because it plots higher on the risk matrix (amber zone) than Scenario A (upper green) due to its higher likelihood. Therefore, Scenario B is the most critical scenario for this PFM. Scenario C, for light damage, has an even lower risk plotting in the lower green zone.
By the end of the CNA PFM risk analyses, 129 PFMs had been fully developed to consider risks for normal reservoir loading and during extreme flood and seismic events. Each PFM considered three to four failure states and five potential consequences resulting in over 2,000 specific risk evaluations.

Chapter 4. Estimated Risks for Existing Conditions
47
Figure 15. Example CNA Risk Estimates for Public Safety Consequences for Three Hypothetical PFM Scenarios—Scenario B is the Critical Scenario for this Example PFM

California Department of Water Resources Oroville Dam Safety Comprehensive Needs Assessment Summary
48
CNA Existing Condition PFM Risk Estimates The CNA task teams: considered a wide range of PFMs that had been brainstormed over time, consolidated duplicative PFMs, eliminated PFMs that were unrealistic, and ended up fully considering and developing 129 PFMs. The risks determined were associated with the most critical PFM scenario and consequence category. Since each developed PFM typically had three to four scenarios and five consequence categories considered, the most critical scenario represented the worst case out of about 15–20 risk estimates performed for each PFM. The most critical PFM scenarios and consequences for the 129 PFMs considered and developed by the CNA task teams are shown on the CNA risk matrix in Figure 16 and Table 5.
The critical scenarios were dominated by public safety and financial impacts consequences. For 105 PFMs, public safety was the dominating or controlling consequence for the critical scenario; 11 of these estimated that public safety and financial impacts had an equal consequence level. These PFMs are shown as circular symbols in Figure 16. For 24 PFMs, financial impacts were the dominating or controlling consequences for the critical scenario. These PFMs are shown as diamond symbols in Figure 16.
It should be noted that the CNA risk matrix also includes a row for risk values reflecting annual occurrence probabilities less frequent than 1/100 million (<10-8). This is considered to be a negligible likelihood. Out of the 129 PFMs considered and developed by the CNA task teams, 54 were found to have a negligible likelihood (see Figure 16 and Table 5).

Chapter 4. Estimated Risks for Existing Conditions
49
Figure 16. Risk Estimates for Critical CNA PFM Scenarios Plotted on CNA Risk Matrix
Note: the number inside each circle and diamond represents the identification number for that PFM. For example, the number 17 in the orange circle represents PFM number T4-17.

California Department of Water Resources Oroville Dam Safety Comprehensive Needs Assessment Summary
50
Table 5. Distribution of Most Critical CNA PFM Scenario Risk Estimates for Existing Conditions on the CNA Risk Matrix
Color/zone on the CNA risk matrix
Emergency spillway PFMs
FCO PFMs
Outlet PFMs
Embankment dam PFMs
Total PFMs
Upper red 0 0 0 0 0 Lower red 1 0 0 1 2
Amber 7 8 0 11 26 Gray 0 9 0 26 35
Upper green 0 9 9 9 27 Lower green 0 11 24 14 39
Total 8 37 33 51 129 Above PFMs plotting below the matrix: “Negligible Risk”
– Annual Probability of Failure < 10-8
7 16 2 29 54
Primary Finding from CNA Existing Condition PFM Risk Estimates After evaluating all 129 PFMs developed, the CNA project team found than none of the PFMs represented an unacceptable risk, although two PFMs were on the borderline. As a result, no dam safety issues were identified that exhibit a need for immediate risk-reduction actions. The vast majority of the PFM risk estimates were found to have tolerable, or even negligible risks.
Assessments of Higher-Risk CNA Existing Condition PFMs While no unacceptable risks were found by the CNA project team, several risk estimates developed for different PFMs were high enough to warrant further consideration, including examining potential risk-reduction measures to reduce risks to even lower levels, and to implement these measures if they are found to be reasonably practicable. This is because when a risk estimate plots between the two diagonal dashed lines (comparable to the amber-colored zone), the risk is not considered tolerable unless it can be shown that risk-reduction measures have been considered consistent with ALARP—making the risks as low as reasonably practicable.
The two highest-risk PFMs were located in the lower red zone straddling the tolerable risk reference line (upper diagonal dashed line on the matrix). This is the border between tolerable (with ALARP) and unacceptable risks. Of these two PFMs, one was associated with the potential for a hydrologic overtopping failure on Parish Camp Saddle Dam (blue circle with number 38) during a very extreme flood (a flood beyond the probable maximum flood, which is comparable to an annual likelihood of 1/20,000). In this extreme flood case, the PFM risk estimate is for hydrologic loading scenarios that have average annual likelihoods of 1/40,000 and 1/100,000—these are more extreme than any standard required by any state or federal dam safety organization in the United States. The other PFM straddling the tolerable risk reference line was

Abbreviations and Glossary
51
associated with the potential for major erosion on the unlined channel below the secant pile wall on the emergency spillway (purple diamond with number 4). The risk for this latter PFM was not controlled by potential life-loss, but rather associated with financial impacts resulting from the flooding of the Hyatt Powerplant induced by partial blockage and elevation of the diversion pool. These financial impacts include direct impacts associated with the repair of the Hyatt facilities as well as downstream impacts associated with the potential reduction in water supply due to limited reservoir release capacities. All of the potential risk-reduction plans described in Chapter 5 contain measures to address these two PFMs. Further, an interim risk-reduction project is being recommended for implementation in the near term that would include a measure to mitigate the one highest-risk PFM associated with life-loss—the one associated with overtopping of Parish Camp Saddle Dam.
Other risk estimates plotting between the two diagonal lines (amber colored zone), or in the gray area requiring special consideration, include:
• Vulnerabilities of the Hyatt Powerplant and other outlets (RVOS and Palermo).
• Structural vulnerabilities of the FCO headworks structure and potential inabilities to operate the FCO gates.
• Dam overtopping (Oroville Dam and Bidwell Bar Canyon Saddle Dam) for extreme hydrologic events beyond the probable maximum flood.
• Erosion resistance of the upper portion of Oroville Dam, particularly at its contact with the FCO on the right abutment.
A prominent issue among several PFMs was the reliability of the FCO and the Hyatt Powerplant to be able to reliably deliver water or to rapidly draw down the reservoir during an emergency.
Potential risk-reduction measures and alternative plans for future consideration are described in Chapter 5.
Comparisons with the 2019 L2RA Risk Estimates The CNA risk analyses for the existing condition benefited from a parallel risk analysis being conducted at the same time. This other risk analysis was known as the Level 2 Risk Analysis (L2RA) and was an independent risk analysis mandated by the United States Congress to be carried out consistent with FERC guidelines. The L2RA evaluations were made by independent subject matter experts contracted by DWR. Like the CNA risk evaluations, the L2RA was a semi-quantitative risk analysis. However, unlike the broader scope of the CNA risk evaluations, the L2RA evaluations were principally focused on ultimate failure scenarios and also generally focused on potential life-loss consequences. The number of PFMs developed by the L2RA team (165) was different than the number developed by the CNA task teams (129) for the following reasons:

California Department of Water Resources Oroville Dam Safety Comprehensive Needs Assessment Summary
52
• The CNA reviewed some of the initial risk estimates developed by the L2RA team and concurred that they had such negligible risks that they did not need to be developed.
• Some of the L2RA PFMs initially developed separately for normal and hydrologic loading were combined into a single PFM representing the full range of reservoir loading. The CNA task teams kept separate the PFMs for these two loading conditions.
• Several of the L2RA PFMs did not actually represent full PFMs developed, but rather nodal probabilities for potential failures of specific mechanical and electrical component equipment. Some of these potential failures were combined in CNA PFMs.
Nevertheless, the results of the L2RA risk evaluations were very useful to the CNA task teams and provided an unprecedented quality control check on the CNA risk evaluations. The results of the L2RA risk estimates are summarized in Figure 17. There was general agreement between the risks estimated by the CNA task teams and those estimated by the L2RA teams, and the L2RA results also showed relatively low risk for the facilities in the Oroville Dam Complex. In fact, the L2RA risk estimates had a higher percentage of the PFMs being estimated to have a negligible risk, 98 out of 165 (see Figure 17).
There were 96 PFMs where likelihood estimates could be compared from the two sets of teams, with 79 of these likelihood estimates found to be within one order of magnitude of each other (82 percent), and 41 of these found to be the same order of magnitude (43 percent). Overall, there was a tendency for some L2RA likelihood estimates to be a bit higher than those estimated by the CNA project team, but this trend was found to be less than one half of one order of magnitude, well within the one-order-of-magnitude level of accuracy generally assumed for semi-quantitative risk analyses (see Chapter 3 and Figure 12).

Abbreviations and Glossary
53
Figure 17. L2RA Existing Condition PFM Risk Estimates for Life-loss Plotted on the CNA Risk Matrix
Note: the number inside each square represents the identification number for that L2RA PFM. For example, the number 33 in the blue square represents L2RA PFM number ORO-33.

California Department of Water Resources Oroville Dam Safety Comprehensive Needs Assessment Summary
54
This page left blank intentionally

Chapter 5. Development, Evaluation, Screening, and Selection of Measures and Alternative Plans
55
Chapter 5. Development, Evaluation, Screening, and Selection of Measures and Alternative Plans
Introduction The CNA PFM risk evaluations for existing conditions did not identify any unacceptable risks (PFMs above the tolerable risk reference line), although two were borderline as they straddled the line. The vast majority of the PFM risk estimates were found to have tolerable, or even negligible risks. However, while no unacceptable risks were found, there were several potential PFMs/vulnerabilities that require further consideration, including examining potential risk reduction measures to reduce risks to even lower levels, and to implement these measures if they are found to be reasonably practicable. As discussed in Chapter 3, the concept of ALARP requires dam owners to examine if reasonably practicable measures could reduce risks to lower levels, particularly those risks located in the amber zone on the matrix between the two diagonal risk reference lines. Risk estimates lying in this area are considered intolerable without examining and implementing reasonably practicable measures if they are available. In addition, the IRB also recommended that the CNA project team consider uncertainty in the risk estimates.
To meet the above risk considerations, the CNA task teams reviewed the CNA PFMs with the higher-risk estimates to determine if there were potential opportunities to reduce the risks. The CNA task teams also examined the higher-risk PFMs developed by the L2RA parallel risk-assessment effort. For higher risk PFMs from both studies, risk-reduction measures were then considered, and those that had potential merit were recommended for possible inclusion in alternative risk-reduction plans.
Overview of Measure Development, Evaluation, Screening, and Selection Process To develop, evaluate, and screen potential risk-reduction measures, CNA task teams completed the following activities:
1. Identified the PFMs with the highest relative risks. 2. Of those, identified the PFMs with practicable risk-reduction opportunities. 3. For those PFMs, identified one or more potential measures by which risk might be
reduced. 4. Through an iterative process of evaluation, screening, and refinement, identified a
final list of measures recommended for consideration in the formulation of alternative plans.
Note: Task 2 focused on enhancements to reservoir operations and Task 6 focused on monitoring/instrumentation. The results of these efforts are summarized in Chapter 6 of this report.

California Department of Water Resources Oroville Dam Safety Comprehensive Needs Assessment Summary
56
Highlighted Risk Considerations The PFMs that had critical scenarios within the upper green, amber, gray, or lower red areas of the risk matrix and that had an estimated annual scenario probability more frequent than 1/100,000,000 (1x10⁻⁸) were further assessed for potential risk-reduction measures. After iterative evaluation and screening, 31 PFMs were identified as demonstrating highlighted risks that had opportunities for further risk reduction. Figure 18 shows where the existing condition risk values for these 31 PFMs plotted on the risk matrix.
The selected, highlighted-risk PFMs were associated with the following potential vulnerabilities and failure mechanisms:
• Erosion on the unlined emergency spillway channel resulting in flooding of the Hyatt Powerplant.
• Vulnerabilities of the Hyatt Powerplant and other outlets (RVOS and Palermo).
• Structural vulnerabilities of the FCO headworks structure and potential impaired operation of the FCO gates.
• Dam overtopping (Oroville Dam, Bidwell Bar Canyon Saddle Dam, and Parish Camp Saddle Dam) for extreme hydrologic events beyond the probable maximum flood.
• Internal erosion resistance of the upper portion of Oroville Dam, particularly at its contact with the FCO on the right abutment.

Chapter 5. Development, Evaluation, Screening, and Selection of Measures and Alternative Plans
57
Figure 18. Highlighted Risks Used for Measure Development Plotted on the CNA Risk Matrix—Controlling Public Safety and Financial Impact Risk Values Shown

California Department of Water Resources Oroville Dam Safety Comprehensive Needs Assessment Summary
58
Risk-Reduction Measure Development
Measure Evaluation Criteria Potential risk-reduction measures were developed and screened using three criteria:
• Ability to achieve ALARP, that is, reasonably practicable risk reduction and lower residual risk.
• Ability to support design considerations and good engineering judgment.
• Ability to enhance system resilience.
Ability to Achieve ALARP Risk Reduction and Lower Residual Risk Residual risk is the amount of existing, future, or historical risk that remains or might remain after a plan or project has been implemented (Yoe and Orth, 1996). CNA task teams assessed the ability of each measure to reduce risk and achieve residual risk consistent with ALARP principles in the five consequence categories identified at the beginning of the CNA:
• Public safety.
• Regulatory compliance.
• Reliability and flexibility of meeting SWP water delivery obligations.
• Reliability and flexibility in meeting other SWP purposes.
• Financial consequence to the State of California.
The reduction in the risk values attributable to a measure for a given PFM scenario can be shown with a change in the location of the PFM risk values on the CNA risk matrix. Risk reduction could be in the form of reduced likelihoods after a measure was in place, in which case the location of the PFM “dot” on the matrix would shift downward vertically to a lower likelihood. An example of this would be to provide a structural upgrade to the concrete piers within the FCO headworks, as illustrated in Figure 19.
Alternatively, the risk reduction could be a reduction in the consequences, in which case the PFM “dot” would shift laterally to the left on the matrix to a lower consequence level. For example, the addition of upstream bulkhead gates on the FCO intake bays would not lessen the likelihood of structural distress in the FCO piers following an earthquake, but by being able to use the bulkhead gates to shut off uncontrolled flows through the FCO bays the consequences would be reduced, as illustrated in Figure 20.

Chapter 5. Development, Evaluation, Screening, and Selection of Measures and Alternative Plans
59
Figure 19. Illustration of How a Risk-Reduction Measure Can Reduce Risk by Reducing the Likelihood of Failure for a Hypothetical PFM

California Department of Water Resources Oroville Dam Safety Comprehensive Needs Assessment Summary
60
Figure 20. Illustration of How a Risk-Reduction Measure Can Reduce Risk by Reducing the Consequences of Failure for a Hypothetical PFM

Chapter 5. Development, Evaluation, Screening, and Selection of Measures and Alternative Plans
61
Ability to Support Design Considerations and Good Engineering Judgment At the outset of the CNA, the project team identified a set of design considerations to help evaluate risk-reduction measures. These design considerations were outlined in Chapter 2 and involved the use of sound engineering judgment and best practices in dam engineering to encourage the use of conventional and proven designs, support constructability, manage construction risk, and support mechanical and electrical systems reliability.
These design considerations were used in screening risk-reduction measures qualitatively to identify measures with fatal flaws, e.g., “Is the measure constructible? Will it be maintainable? An answer of “no” to questions such as these eliminated a measure or plan from further consideration.
Ability to Enhance System Resilience Risk-reduction measures were also evaluated for their potential contribution to the resilience of the Oroville Dam system. The CNA adopted the definition of resilience used by USACE in its Engineering and Construction Bulletin (ECB) 2018-2. That ECB defines a resilient system as one that incorporates these four PARA (Prepare, Absorb, Recover, and Adapt) principles (definitions from the ECB are provided below):
• Prepare. The Prepare principle should be used to consider measures that reduce risks or costs under loading conditions beyond those required by technical standards (USACE, IBC, IEBC, ASCE, ASME, etc.).
• Absorb. The Absorb principle should be used to identify cost-effective measures to limit damage to, or loss of function of, a project component or system due to both acute and chronic loading conditions, including conditions beyond those used for the design. This principle can be also be used as an opportunity to consider adding system robustness, redundancy, and increased reliability.
• Recover. The Recover principle should be used to identify cost-effective measures that allow for rapid repair or function restoration of a project component or system.
• Adapt. The Adapt principle should be used to identify cost-effective modifications to a project component or system that will maintain or improve future performance based on lessons learned from a specific loading condition or loadings associated with changed conditions.

California Department of Water Resources Oroville Dam Safety Comprehensive Needs Assessment Summary
62
Development, Evaluation, and Consolidation of Risk-Reduction Measures Used for Plan Formulation The sequence of risk-reduction measure development, evaluation, and consolidation was performed in the following three main steps:
1. Following the identification of PFMs selected for measure development for potential risk reduction, each task team carried out a series of brainstorming sessions. These sessions identified initial conceptual measures for consideration. Altogether, the four task teams (1, 3, 4, and 5) identified 299 initial conceptual measures. These initial conceptual measures were evaluated using the criteria described above and consolidated down to 112 candidate measures. As part of this process, initial conceptual measures related to proposed studies or new instrumentation and monitoring were eliminated since studies and instrumentation generally do not, by themselves, reduce risk. The proposed studies and instrumentation projects were, however, referred to Task 6 for further consideration and evaluation. In addition, other physical measures deemed to be unrealistic or having fatal flaws were removed at this stage. Each task team documented this review and consolidation of measures.
2. In the second stage of screening, the 112 candidate measures were further evaluated and consolidated down to 46 consolidated candidate measures. Candidate measures were eliminated if one or more similar measures had higher benefits or better met the criteria, or if the measure had major construction risks. Each task team documented this screening phase and the reasons for not carrying forward the eliminated measures.
3. In the third and last stage of screening, the 46 consolidated candidate measures were consolidated down to 33 measures recommended for consideration in plan formulation. Measures which survived this final screening were considered to be potentially appropriate approaches for addressing risk reduction and project objective considerations criteria. Again, each task team documented this final screening phase and the reasons for not carrying forward the measures that were not selected.
The measure development approach and three rounds of screenings are illustrated in Figure 21.

Chapter 5. Development, Evaluation, Screening, and Selection of Measures and Alternative Plans
63
Figure 21. Illustration of Measure Development Approach and Three Rounds of Screening
Risk-Reduction Measures Incorporated in Alternative Plans As described above, the CNA task teams brain-stormed numerous potential risk-reduction measures and completed a process to evaluate, screen, and consolidate them down to a list of 33 measures recommended for consideration in developing alternative risk-reduction plans. The CNA project team eventually used 22 of these recommended measures in formulating alternative plans. The types of measures ranged from relatively small projects that would cost less than $2 million to major new facilities that could cost over $2 billion. These 22 measures were as follows:
• Minimally improved pilot channel (emergency spillway).
• New full-length RCC chute (emergency spillway).
• New FCO gated reinforced concrete spillway chute (emergency spillway).
• Protecting Hyatt Powerplant discharge portal with new bulkhead gates.
• Secant pile wall buttress (emergency spillway).
• Partial extension of RCC apron and minimally improved pilot channel (emergency spillway).
• Upstream bulkhead gates (FCO headworks).

California Department of Water Resources Oroville Dam Safety Comprehensive Needs Assessment Summary
64
• Structural upgrades/retrofit to FCO headworks.
• Backup power, local starter, etc. (FCO radial gates).
• Debris control structures/devices (upstream of FCO headworks).
• Rock bolts in Hyatt Powerplant.
• Landslide stabilization above Palermo Canal intake.
• Barrier around Area Control Center (ACC)/switchyard and landslide stabilization (Hyatt Powerplant).
• Lining of the Palermo Canal (landslide stabilization).
• New upper low-level outlet at Elevation 775 feet (new tunnel outlet).
• New lower low-level outlet at Elevation 435 feet (new tunnel outlet).
• New lower low-level outlet at Elevation 340 feet (new tunnel outlet).
• Modification of portion of Oroville Dam that wraps around Monolith 31.
• Modification of the upper 40 feet of Oroville Dam.
• Raising of Oroville Dam by 3 feet.
• Raising of Bidwell Bar Canyon Saddle Dam by 3 feet.
• Raising of Parish Camp Saddle Dam by 3 feet.
The other 11 potential risk-reduction measures out of the 33 that had been recommended for consideration were not ultimately incorporated into alternative plans for the following reasons:
• Two of the potential risk-reduction measures were concluded to likely not achieve their intended risk reduction (widening the diversion pool to accept eroded sediment or the use of an unlined, stepped rock chute on the emergency spillway).
• Four of the originally proposed structural measures for improving the structural capacity of the FCO headworks were consolidated into one general measure because not enough was known about potential vulnerabilities to discriminate between these four measures.

Chapter 5. Development, Evaluation, Screening, and Selection of Measures and Alternative Plans
65
• Four of the measures were eliminated because the likelihood estimates for related PFMs were reduced, making any new risk-reduction measures not necessary (measures to modify Bidwell Bar Canyon Saddle Dam or grout Oroville Dam core block joints).
• Two of the measures were eliminated because other measures were more effective at reducing the risks that these two were targeting (adding a downstream filter zone on the Oroville Dam at the right abutment contact and having a new low level outlet with an intake elevation set at Elevation 610 feet).
The sum of the above measure eliminations and consolidation resulted in a net reduction of 11 measures.
Overview of Alternative Plan Formulation The project integration team developed an initial set of themes around which to organize and focus the formulation of alternative plans. This approach had been a recommendation by the IRB. Draft alternative plans were then developed by selecting measures to match the theme or focus of each plan. A conceptual representation of the alternative plan formulation process is shown in Figure 22.
Figure 22. Conceptual Representation of Alternative Plan Formulation Process

California Department of Water Resources Oroville Dam Safety Comprehensive Needs Assessment Summary
66
Identification of Themes for Alternative Plans Three workshops were held by the CNA project team to formulate, develop, consolidate, and modify the alternate plans. At the end of this process, the following 10 alternative plans had been developed, each oriented around a specific theme:
Plan 1: Maximize risk reduction and resilience (with an emphasis on redundancy).
Plan 2: Extend reliable life of facility.
Plan 3: Minimize dam safety risks, alternate A (with gated concrete emergency spillway).
Plan 4: Minimize dam safety risks, alternate B (with continuous RCC emergency spillway).
Plan 5: Balance risk reduction with resilience and implementability.
Plan 6: Enhance operational capabilities.
Plan 7: Meet deterministic dam safety guidelines (with acceptable damage).
Plan 8: Tolerable risk “plus” – Plan 9, below, enhanced with the addition of two more measures selected on the basis of good engineering judgment as a potential improved alternative to Plan 9.
Plan 9: Achieve tolerable risk (i.e., address only the very highest risks shown in the risk matrix).
Plan 10: Focus on flood management.
Each of the alternative plans were composed of between six and 17 risk-reduction measures.
Measures to Improve Resilience and Redundancy for Reservoir Drawdown and Water Delivery Reliability of the existing outlet works—FCO, Hyatt Powerplant, and RVOS—is critical to dam safety with respect to reservoir drawdown capability. The existing outlet works are also critical in providing the means to deliver water from the reservoir. A major focus of most of the alternative plans was to improve the reliability of these facilities, and to consider adding additional facilities to provide redundant capabilities. To this end, the plans incorporated the following measures:
• All 10 alternative plans incorporated the following measures to improve the reliability of the FCO headworks and gate structures:
o Measure T3-A: Upstream bulkhead gates on FCO.

Chapter 5. Development, Evaluation, Screening, and Selection of Measures and Alternative Plans
67
o Measure T3-CO: Structural upgrades/retrofits to FCO headworks structure, as found necessary through ongoing analysis.
o Measure T3-BH.2: FCO radial gate backup power and local starter connections.
• All 10 alternative plans incorporated measures to reduce the likelihood of the Hyatt Powerplant flooding during large flood events:
o Nine of the alternative plans included Measure T1-P: Hyatt Powerplant discharge portal bulkhead gates.
o In addition, eight of the alternative plans included measures to armor the unlined emergency spillway channel to reduce the potential for deposition into the diversion pool and result in elevation of the pool into the Hyatt Powerplant. Five of these plans included a new gated spillway in the existing emergency spillway footprint, which would add redundancy to the release capability for operations and emergency reservoir drawdown, and also eliminate the potential for erosion on an unlined spillway channel.
• Seven of the alternative plans incorporated a new low-level outlet measure (Measures T4-E and T4-G).
• Six of the alternative plans included a debris control device in front of the FCO (Measure T3-W) to reduce the likelihood of debris damage to the FCO gates.
• Five of the alternative plans included lining of the Palermo Canal above the Hyatt Powerplant ACC and switchyard to reduce the chance of a landslide impacting the operation of the Hyatt Powerplant.
Evaluation of CNA Alternative Plans The same three criteria that had been used to screen potential risk-reduction measures (risk reduction, support for design considerations, and contribution to resilience) were used to evaluate alternative plans. For the evaluation of risk reduction and residual risk, the risk reduction for each of the 31 higher-risk PFMs was evaluated for the measures comprising each plan. For example, Figure 22 shows the estimated risk reduction associated with the 11 measures in Plan 5: Balanced Risk for each of the 31 higher-risk PFMs.
Each of the 10 alternative plans was given a qualitative score for each of the three criteria (up to a score of 5 for each), and a total weighted score was then calculated (maximum score possible being 100). Table 5 presents a summary of the 10 alternative plans showing the specific individual measures incorporated into each plan and listing the individual scores for each of the three criteria, together with the total weighted score (out of 100) for each plan.

California Department of Water Resources Oroville Dam Safety Comprehensive Needs Assessment Summary
68
Figure 23. PFM Risk Reduction for Each Higher-Risk PFM with Plan 5 (Comprising 11 Measures)

Chapter 5. Development, Evaluation, Screening, and Selection of Measures and Alternative Plans
69
Table 6. CNA Alternative Plans and Scoring

California Department of Water Resources Oroville Dam Safety Comprehensive Needs Assessment Summary
70
Inclusion of Cursory Cost in Description of Alternative Plans The potential costs of each alternative plan were not used directly in evaluating the plans. However, the CNA task teams did develop cursory cost estimates for the various measures populating the alternative plans. The total estimated cursory cost of each plan ranged from $500 million to $3.7 billion.
Figure 24 shows each of the plans represented as a bar in a bar chart. Each bar depicts a sum of the total weighted scores for the three scoring criteria: risk-management benefit, contribution to system resilience, and the extent to which it represents good engineering/best practices. The X-axis of this bar chart is in the form of increasing cost; the Y-axis shows the weighted scores.
The relative cost of a given plan is a useful index for the relative magnitude of effort and resources that would be needed to complete that plan. The 10 plans fell naturally into three groups representing three levels of effort, moving left to right in Figure 24:
• Plans 9 and 8 have the lowest number of measures and lowest cursory cost estimates. These two plans incorporate neither a new low-level outlet nor a new concrete emergency spillway.
• Plans 5, 7, 4, and 10 have intermediate numbers of measures and costs. These plans incorporate either a new low-level outlet (Plans 5, 7, and 4), or a new gated concrete emergency spillway (Plan 10), but not both.
• Plans 6, 3, 2, and 1 have the most measures and highest costs. These plans incorporate both a new low-level outlet and a new gated concrete emergency spillway.
It can be observed that the total scores for the alternative plans are very similar for Plans 1 through 7 and 10. This is because of compensating effects of the scoring criteria. For example, the plans with the most measures (e.g., Plans 1, 2, and 3) show the most risk reduction and lowest residual risks together with the most improved resilience, but they may represent an excessive effort with respect to traditional dam safety engineering requirements and best practices. On the other hand, more intermediate plans such as Plan 5 (Balanced Risk) achieve most of the risk reduction and improved resilience that the plans with many more measures do without the higher costs and potential excessive effort.
The original CNA project plan called for the evaluation of the alternative plans and to recommend a subset for future consideration. However, at the recommendation of the IRB, all 10 alternative plans are being carried forward for future consideration by DWR management.

Chapter 5. Development, Evaluation, Screening, and Selection of Measures and Alternative Plans
71
Figure 24. Weighted Scores for 10 Alternative CNA Risk-Reduction Plans

California Department of Water Resources Oroville Dam Safety Comprehensive Needs Assessment Summary
72
This page left blank intentionally.

Chapter 6. Conclusions and Recommendations
73
Chapter 6. Conclusions and Recommendations
Summary This chapter summarizes the scope, primary finding, conclusions, and recommendations of the CNA project. It includes the following information:
• Review of CNA project scope.
• Primary finding from risk analyses.
• Highlighted risks.
• Potential risk-reduction measures developed.
• Alternative risk-reduction plans recommended for future consideration.
• Future modifications to reservoir operations.
• Recommendations:
o Early Implementation Projects.
o Interim Implementation Project.
o Additional Interim Risk-Reduction Measures.
o Recommended Long-Term Path Forward for Future Consideration of Alternative Risk-Reduction Plans.
Review of CNA Project Scope The CNA project was performed to identify potential dam safety and operational needs, and what enhancements, if any, are needed for dam safety or facility reliability. The CNA was the most comprehensive risk analysis that DWR has undertaken for any of its facilities and is possibly the most comprehensive such risk analysis for any non-federal dam in California. It is also one of the first such risk analyses to consider failure states other than uncontrolled release of reservoir water, and one of the first to fully consider multiple consequences other than life-loss or financial impacts. The CNA project considered hundreds of PFMs and fully developed 129 of them, with those not developed generally representing duplicate variations of other PFMs. For each PFM, risk estimates were made for three to four failure states, or scenarios, as well as five consequence categories. This led to over 400 PFM scenarios and over 2,000 risk estimates being completed. The most critical risk was identified for each of the 129 PFMs based on approximately 15–20 risk calculations.

California Department of Water Resources Oroville Dam Safety Comprehensive Needs Assessment Summary
74
To understand and display the relative levels of risk among the PFMs, the CNA used a risk matrix and set of criteria that was an extension of DWR’s O&M asset management matrix. The extended matrix is consistent with the FERC guidelines for completing semi-quantitative risk evaluations (see FERC 2016, 2018).
Primary Finding from Risk Analyses After evaluating all 129 PFMs developed, the CNA project team found than none of the PFMs represented an unacceptable risk, although two PFMs were on the borderline. As a result, no dam safety issues were identified that exhibit a need for immediate risk-reduction actions. The vast majority of the PFM risk estimates were found to have tolerable, or even negligible, risks. However, while no unacceptable risks were found, there were several potential PFMs/ vulnerabilities that required further consideration, including examining potential risk-reduction measures to reduce risks to even lower levels, and to implement these measures if they are found to be reasonably practicable.
This finding, and the use of these risk tolerance guidelines, are generally consistent with risk-informed decision making practices in use by federal agencies with large portfolios of dams and dam safety programs guided by risk-based approaches. The CNA risk estimates were also in general agreement with those recently completed for the Oroville Dam Complex by a separate independent team completing what FERC calls a Level 2 [semi-quantitative] Risk Analysis (L2RA). Approximately 40 percent of the 129 PFMs developed by the CNA project team and approximately 60 percent of the 165 PFMs developed by the L2RA team were found to have a negligible likelihood. Approximately 82 percent of the likelihood estimates for PFMs that were developed by both of the two teams were within one order of magnitude of each other – considered to be the accuracy of the semi-quantitative risk analysis methods being used.
Highlighted Risks As stated above, two PFMs were identified that straddled the tolerable risk reference line within the lower red zone of the CNA risk matrix and were on the border of being unacceptable. One of these two PFMs was associated with the potential for a hydrologic overtopping failure of Parish Camp Saddle Dam during an extreme flood (beyond a probable maximum flood). The other higher-risk PFM was associated with the potential for major erosion on the unlined channel below the secant pile wall on the emergency spillway during future moderate to large flood events. The risk for this latter PFM was not dominated by potential life-loss, but rather associated with financial impacts resulting from the flooding of the Hyatt Powerplant induced by partial blockage and elevation of the diversion pool. These financial impacts include direct impacts associated with the repair of the Hyatt facilities and indirect financial impacts downstream of the dam associated with the disruption of water deliveries. Flooding of the powerplant would be expected to result in an extended outage of at least five years for this powerplant, which serves as the primary water delivery system of reservoir water to the SWP. An extended outage of the powerplant would result in significant impacts to SWP water deliveries.

Chapter 6. Conclusions and Recommendations
75
All of the alternative risk-reduction plans include measures to reduce the risks associated with these two highest risk PFMs. Further, an interim risk-reduction project is being recommended for implementation in the near term that would include mitigating the one highest risk PFM associated with life-loss—the one associated with overtopping of Parish Camp Saddle Dam.
Additional highlighted risks that fell within the tolerable risk areas between the tolerable risk reference lines (amber and gray zones on matrix) that warranted further examination included the following:
• Vulnerabilities of the Hyatt Powerplant and other outlets (RVOS and Palermo).
• Structural vulnerabilities of the FCO headworks structure and potential inabilities to operate the FCO gates.
• Dam overtopping (Oroville Dam and Bidwell Bar Canyon Saddle Dam) for extreme hydrologic events beyond the probable maximum flood.
• Internal erosion resistance of the upper portion of Oroville Dam, particularly at its contact with the FCO on the right abutment.
A prominent issue was the ability of the FCO and the Hyatt Powerplant to reliably deliver water or to rapidly draw down the reservoir during an emergency. For this reason, a major focus of the potential risk-reduction measures and the alternative plans was to improve the reliability of these facilities, and to consider adding additional facilities to provide redundant capabilities.
In the end, the CNA project team selected 31 of the 129 PFMs (potential vulnerabilities) for further examination to identify what types of improvements or remedial measures could further reduce their risks, consistent with ALARP considerations. The highest risks estimated by the L2RA risk evaluation were also addressed using these risk reduction measures.
Potential Risk-Reduction Measures and Plans Potential risk-reduction measures and alternative plans were developed to address the highlighted risk PFMs and were evaluated using the following criteria:
• Ability to reduce risk/residual risk.
• Ability to support design considerations and reflect good engineering judgment and best practices.
• Contribution to Oroville Dam system resilience.
The CNA task teams initially brainstormed almost 300 potential measures to further reduce risk. The vast majority of these had fatal flaws or were not practicable. In the end, the CNA identified 22 potential risk-reduction measures that were included in different combinations in the

California Department of Water Resources Oroville Dam Safety Comprehensive Needs Assessment Summary
76
alternative risk-reduction plans. The types of measures ranged from relatively small projects that would cost less than $2 million to major new facilities that could cost over $2 billion. These included:
• Major new facilities such as a new gated concrete spillway to replace the emergency spillway, or a new low-level (tunnel) outlet to provide additional reservoir drawdown capability and redundancy for water delivery.
• Structural improvements to the FCO headworks and Hyatt Powerplant to ensure long-term reliability to be able to release reservoir water for water supply or for flood risk reduction.
• Rock slope stabilization at the outlet portals to reduce the potential for landslides at these locations and to increase the likelihood that the outlets remain functional during extreme precipitation or seismic events.
• Modifications to the upper portion of the Oroville Dam, particularly at the right abutment, and limited raises (e.g., 3 feet) at all three embankments to reduce the risks of internal erosion or flood overtopping breaches at the dams.
• Armoring measures for the unlined portion of the emergency spillway channel to reduce the potential for scour erosion into the Diversion Pool (Feather River) and the threat of flooding of the Hyatt Powerplant.
Alternative Plans Recommended for Future Consideration The CNA formulated and evaluated a large number of alternative risk-reduction plans, each composed of several potential risk-reduction measures. In the end, the CNA recommended 10 alternative plans for future consideration. Each alternative plan was developed with a specific focus or theme, as recommended by the IRB, and are as follows:
• Maximize risk reduction and resilience (with an emphasis on redundancy).
• Extend reliable life of facility.
• Minimize dam safety risks, alternative A.
• Minimize dam safety risks, alternative B.
• Balance risk reduction with resilience and implementability.
• Enhance operational capabilities.
• Meet deterministic dam safety guidelines (with acceptable damage).

Chapter 6. Conclusions and Recommendations
77
• Achieve tolerable risk reduction enhanced with additional “good engineering judgment” measures.
• Achieve tolerable risk (i.e., address only the very highest risks).
• Focus on flood management.
The number of measures in each plan ranged from six to 17 (refer to Table 6) with very cursory cost estimates ranging from $500 million to $3.7 billion for each plan. All 10 of these alternative plans are being recommended to DWR management for future consideration in managing the risks at facilities within the Oroville Dam Complex.
Future Modifications to Reservoir Operations Hydrologic studies suggest that climate change could increase runoff volumes in the Feather River for extreme hydrologic events, such as flows with an annual chance exceedance of 1 percent (100-year flood event) or 0.5 percent (200-year flood event). The potential for increased runoff volume under climate change conditions highlights the need for enhanced reservoir operations that are resilient to potentially increased reservoir inflows in the future.
The Task 2 work demonstrated that forecast-informed reservoir operations (FIRO) at Lake Oroville is viable, with the potential to yield both flood risk reduction and water supply benefits. Implementing forecast-informed reservoir operations could help mitigate these potential increases in runoff and, therefore, is included in the recommended next steps for evaluating potential reservoir operations modifications.
Recommended Early Implementation Projects (Currently Underway) The CNA recommended the following Early Implementation Projects:
• Installation of 13 new piezometers in Oroville Dam to improve seepage monitoring (status: eight piezometer installations currently completed; awaiting regulatory approval for remaining five piezometers).
• Installation of four new piezometers in the rock foundation of the FCO headworks structure to monitor water pressures acting on the structure (status: installations completed).
• Completion of a new state-of-the art seismic stability analysis of Oroville Dam to update past evaluations on the potential performance of the dam during strong earthquake shaking (status: program and detailed scope are being developed).
These early projects were recommended by the CNA project team for immediate implementation partway through the project as they were considered to have major benefits in understanding the

California Department of Water Resources Oroville Dam Safety Comprehensive Needs Assessment Summary
78
future performance of the facilities and to be cost effective. They were approved by DWR and are currently underway with most of the piezometers already installed.
Recommended CNA Interim Reduction Actions (Near-Term Projects)
Recommended CNA Interim Implementation Project The CNA recommended the following Interim Implementation Project to be completed in the near term, comprising three separate measures:
• Raise Parish Camp Saddle Dam by 3 feet to reduce the risk of flood waters overtopping and breaching the dame.
• Line Palermo Canal to reduce seepage into the rock slope above Hyatt Powerplant and switchyard and improve stability of the rock slope. This would help reduce the likelihood of a landslide occurring in this area that would impact the switchyard and Area Control Center (ACC) for the Hyatt Powerplant.
• Install new remote starter and power connections to the FCO radial gates to improve their reliability. This provides another redundant power supply to operate the radial gates during a flood event, and allows operators to raise the gates locally at the FCO headworks without relying upon either external power or control communication lines.
All three of the items listed above were measures identified by the CNA project team for inclusion in the alternative plans for future consideration. However, the IRB recommended that they be implemented in the near term since they represented relatively inexpensive, cost-effective measures to reduce risk that did not require additional studies, and the CNA project team concurred with this recommendation. The three measures recommended for this Interim Implementation Project are described in the following subsections.
Interim Implementation Project Measure: Raise Parish Camp Saddle Dam by 3 Feet The PFM that describes the overtopping of Parish Camp Saddle Dam (PFM T5-38) was the critical PFM scenario with the highest public safety risk value among all 129 PFMs developed by the CNA task teams. This PFM had a risk value that straddled the Tolerable Risk Reference Line within the lower red area of the CNA risk matrix (refer to Figure 16). Part of the reason for this higher risk is that Parish Camp Saddle Dam lies relatively far away from other Oroville Field Division facilities and would be more difficult to monitor or to respond with any intervention during an extreme flood event. In addition, reservoir hydraulics indicate that the reservoir could be up to 1 foot higher at this upstream location. However, this saddle dam is not overtopped by the probable maximum flood, the highest flood required to be safely passed by any state or federal dam safety organization. Nevertheless, it was appropriate, consistent with ALARP principles, for the CNA to develop a measure to address this PFM. In addition, it is a cost-

Chapter 6. Conclusions and Recommendations
79
effective measure that would help address uncertainties in the hydrologic loadings and potential future effects of climate change. The saddle dam is about 260 feet long.
Raising Parish Camp Saddle Dam by approximately 3 feet would be a relatively simple risk-reduction measure and would probably cost less than $2 million. It also affords the opportunity to add new downstream filter and armoring layers to further reduce risks to this embankment. A schematic drawing for this Interim Implementation Project is shown in Figure 25.
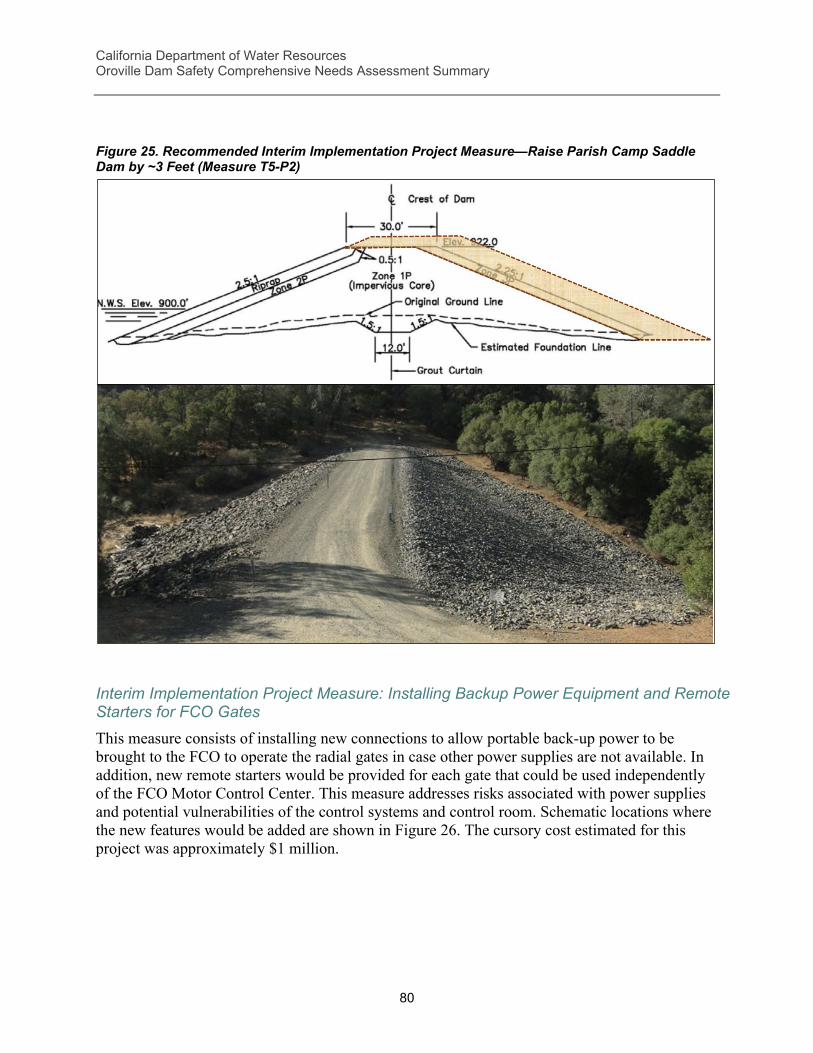
California Department of Water Resources Oroville Dam Safety Comprehensive Needs Assessment Summary
80
Figure 25. Recommended Interim Implementation Project Measure—Raise Parish Camp Saddle Dam by ~3 Feet (Measure T5-P2)
Interim Implementation Project Measure: Installing Backup Power Equipment and Remote Starters for FCO Gates This measure consists of installing new connections to allow portable back-up power to be brought to the FCO to operate the radial gates in case other power supplies are not available. In addition, new remote starters would be provided for each gate that could be used independently of the FCO Motor Control Center. This measure addresses risks associated with power supplies and potential vulnerabilities of the control systems and control room. Schematic locations where the new features would be added are shown in Figure 26. The cursory cost estimated for this project was approximately $1 million.

Chapter 6. Conclusions and Recommendations
81
Figure 26. Recommended Interim Implementation Project Measure—Install Backup Power and Remote Starters for FCO Radial Gates (Measure T3-BH.2)
Interim Implementation Project Measure: Lining Palermo Canal This measure consists of installing an impervious liner on approximately 735 feet of the Palermo Canal, which lies on the slope above the Area Control Center and switchyard. The existing canal consists of an excavation into weathered rock provided with a shotcrete lining. The shotcrete lining is believed to be cracked and to leak water into the rock slope. This leakage is therefore a source of saturation and weakening of the slope, thus potentially reducing the stability of the rock slopes above these critical facilities. Installation of a new geomembrane lining would significantly reduce the leakage and risks of slope instability. The proposed project consists of removing the existing shotcrete lining, placing concrete leveling panels to provide a smooth surface, adding a rugged geomembrane such as Teranap (asphaltic paving membrane), and covering the geomembrane with a thin layer of shotcrete for protection. This type of repair has been used by DWR to eliminate leakage in the canals of the SWP for over 20 years. A schematic drawing and photographs from past repairs are presented in Figure 27. The cursory cost estimated for this project was approximately $1 million.
Risk reduction and residual risks associated with the three PFMs that would be addressed by implementation of the three measures in the Interim Implementation Project are shown in Figure 28.

California Department of Water Resources Oroville Dam Safety Comprehensive Needs Assessment Summary
82
Figure 27. Recommended Interim Implementation Project Measure—Line Palermo Canal (Measure T4-U)
Palermo Canal Lining of California Aqueduct Canal in Southern California in 1999

Chapter 6. Conclusions and Recommendations
83
Figure 28. PFM Risk Reduction with the Interim Implementation Project (Measures T5-P2 PCSD Raise, T3-BH.2 FCO Backup Power/Remote Starter, and T4-U Lining Palermo Canal)

California Department of Water Resources Oroville Dam Safety Comprehensive Needs Assessment Summary
84
Additional Recommended Interim Measures The CNA recommended that the following additional interim measures also be implemented in the near term:
• Purchase and stockpile flood-fighting equipment and materials for flood-fighting at the dam embankments and other areas in the Oroville Field Division during extreme floods. This would provide potential flood risk reduction by intervention.
• Complete a study to examine the feasibility and risk reduction for adding small and limited crest parapet walls on the Oroville Dam at the left and right abutments. This was originally recommended by the IRB as a potential cost-effective risk reduction measure and the CNA project team has endorsed this examination. These walls would likely be only 2–3 feet high and could be only about 200–400 feet in length at the abutment ends of the dam.
• Implement the higher priority mechanical and electrical component reliability improvements recently recommended following a seismic walkdown inspection and those recently suggested by the Oroville Field Division. These should be implemented as part of DWR’s normal procedures for refurbishment and replacement.
• Implement reservoir operation enhancements related to FIRO. These will require DWR to continue its work with USACE and Yuba Water Agency to develop coordinated, forecast-informed strategies to account for the absence of Marysville Reservoir and to better maximize flood risk reduction and water supply benefits with the facilities that are now available. New operations plans would be evaluated for their abilities to accommodate the impacts of climate change.
• Enhance monitoring instrumentation at locations throughout the Oroville Dam Complex.
• Complete further studies of the facilities in the Oroville Dam Complex. The CNA project team identified over 25 possible studies to be completed, including hydrologic, scour, landslide, mechanical reliability, and seismic stability investigations. These studies are targeted to better inform and estimate the highest risk PFMs identified during the CNA project. These proposed studies should be reviewed by DWR’s Dam Safety Services Office and prioritized for completion on the basis of the level of risk associated with the PFMs that the studies are meant to inform.

Chapter 6. Conclusions and Recommendations
85
Recommended Long-Term Path Forward for Future Consideration of Alternative Risk-Reduction Plans The following is a recommended long-term path forward towards implementing future risk-reduction projects at the Oroville Dam Complex, and at other facilities of the SWP.
1. A portfolio risk assessment of other critical facilities in the SWP is needed for DWR to better understand the risks associated with the facilities of the Oroville Dam Complex relative to those at other SWP critical facilities. Such portfolio risk assessments will assist DWR in making truly balanced risk-informed decisions regarding where the highest risks are and the priorities to reduce those risks, including those at the Oroville Dam Complex.
2. Following the completion and outcomes of the recommendation above, a plan from, or similar to, one of the 10 alternative plans developed during the CNA project should be considered for implementation. Over the near term (next 5 years), additional engineering and geologic studies are being recommended for potential vulnerabilities with the highest potential risks. Implementation of such a plan will depend on whether any new dam safety deficiencies are identified, and if it is determined that any additional facility reliability enhancements are warranted at the Oroville Dam Complex. It may be that no further risk-reduction projects beyond the Interim Implementation Project and Other Interim Measures will be warranted for the near future, or even foreseeable future, particularly if there are major safety or operational needs elsewhere in the SWP. This is because the risks in this study for the Oroville facilities were not found to be unacceptable, and the only PFM with a marginal unacceptable public safety risk, overtopping of Parish Camp Saddle Dam, would be addressed as part of the Interim Implementation Project.
3. It is recommended that feasibility studies and quantitative risk analyses be conducted before any such plan is implemented in order to assure that the dam safety needs are truly present, and that the proposed plan would actually reduce the risk as needed. However, the implementation of additional individual risk-reduction measures may not necessarily require either new feasibility studies or quantitative risk analyses.
4. Climate change may influence the effectiveness of future risk-reduction measures, and therefore influence residual risks. Inclusion of resilience was one aspect of the CNA’s evaluation of risk management measures and plans; the characterization of resilience informed the selection of measures and plans that will be effective under climate change. Nevertheless, future feasibility studies of one or more preferred risk-reduction plans should consider further the effects of climate change on facility performance and residual risk, which may impact both the selection and the level of implementation of the preferred plan.

California Department of Water Resources Oroville Dam Safety Comprehensive Needs Assessment Summary
86
Chapter 7. References and Resources American Meteorological Society (AMS). 2012. Website: “Glossary of meteorology,”
http://glossary.ametsoc.org/wiki/ Probable_maximum_flood.
Baecher, G. B. and Christian, J. T. 2003. Reliability and Statistics in Geotechnical Engineering, John Wiley and Sons.
Bowles, David S., Loren R. Anderson, Terry F. Glover, and Sanjay S. Chauhan. 1999. “Understanding and Managing the Risks of Aging Dams: Principles and Case Studies.” Nineteenth USCOLD Annual Meeting and Lecture, Atlanta, GA, May 16-21.
California Department of Water Resources (DWR). 2017. Assessment of the Vegetation Area on the Face of the Oroville Dam, Technical Report prepared for Oroville Spillway Recovery Program, Sacramento, CA, August 30.
California Department of Water Resources (DWR). 2019. Operations and Maintenance Risk Management Framework, O&M Asset Management Program, prepared by Black & Veatch and Brown & Caldwell. Sacramento, CA. January 9.
California Department of Water Resources (DWR). 2020a. Oroville Dam Safety Comprehensive Needs Assessment Final Report—CEII Version, Sacramento, CA, August.
California Department of Water Resources (DWR). 2020b. Oroville Dam Complex Level 2 Risk Analysis, prepared by HDR Engineering, Inc., Folsom, CA
Federal Emergency Management Agency (FEMA), Interagency Committee on Dam Safety. 2004a. Federal Guidelines for Dam Safety: Glossary of Terms, United States Department of Homeland Security, Washington, D.C., April.
Federal Emergency Management Agency (FEMA), Interagency Committee on Dam Safety. 2004b. Federal Guidelines for Dam Safety: Selecting and Accommodating Inflow Design Floods for Dams, United States Department of Homeland Security, Washington, D.C., October 1998, reprinted 2004.
Federal Emergency Management Agency (FEMA). 2015. Federal Guidelines for Dam Safety Risk Management, FEMA P-1025, Washington, D.C., January.
Federal Energy Regulatory Commission (FERC). 2016. Risk Informed Decision Making Guidelines, Draft, ver. 4.1, Washington, DC, March.
Federal Energy Regulatory Commission (FERC). 2017. Website: “Extension of potential failure modes analyses to significant and low downstream hazard potential dams,” https://www.ferc.gov/industries/hydropower/safety/initiatives/extension-pfm.asp.

Chapter 7 – References and Resources
87
Federal Energy Regulatory Commission (FERC). 2018. Periodic (Level 2) Risk Analysis Procedures, Risk-Informed Decision Making for Dam Safety, Draft, ver. 1.1, Washington, DC.
Hashimoto, T., J. R. Stedinger, D. P. Loucks. 1982. “Reliability, resiliency, and vulnerability criteria for water resource system performance evaluation.” Water Resource. Res. 18, 14-20.
HDR Engineering, Inc. 2019. Oroville Dam Consequences, L2RA Workshop Presentation, prepared for DWR. March.
HDR Engineering. 2020. “Level 2 Risk Analysis Results, Oroville Dam Complex – CEII,” prepared for the California Department of Water Resources, May.
Hydrologic Engineering Center (HEC). 2015. Key USACE Flood Risk Management Terms, United States Army Corps of Engineers, Davis, CA, February.
International Committee on Large Dams (ICOLD). 2005. Risk Assessment in Dam Safety Management. A Reconnaissance of Benefits, Methods and Current Applications. International Commission on Large Dams, Committee on Dam Safety. Bulletin 130. Paris.
Maxwell, Sally, and Ingrid Franssen. 2012. Risk Management Framework for Water Planning and Management, Government of South Australia, Department of Environment, Water, and Natural Resources, December.
Munger, Dale F., et al. 2009. Interim Tolerable Risk Guidelines for US Army Corps of Engineers Dams. Downloaded from https://www.researchgate.net/publication/267953850_Interim_Tolerable_Risk_ Guidelines_for_US_Army_Corps_of_Engineers_Dams/link/54d8b3c10cf25013d03eb822/download.
Project Management Institute. 2013. A Guide to the Project Management Body of Knowledge (PMBOK® guide), Fifth edition, Newton Square, PA.
Stanford University. Undated. National Performance of Dams Program (NPDP). Website: “Dam Dictionary,” available at http://npdp.stanford.edu/dam_dictionary.
United States Army Corps of Engineers. 1970. Oroville Dam and Reservoir, Feather River, California: Report on Reservoir Regulation for Flood Control, Sacramento, CA, August.
United States Army Corps of Engineers. 2000. ER 1105-2-100, Planning Guidance Notebook, Washington, DC, April 22.

California Department of Water Resources Oroville Dam Safety Comprehensive Needs Assessment Summary
88
United States Army Corps of Engineers. 2018. Implementation of Resilience Principles in the Engineering & Construction Community of Practice, Engineering and Construction Bulletin (ECB) 2018-2, Washington, DC, January 25.
United States Bureau of Reclamation. 2003. “Guidelines for Achieving Public Protection in Dam Safety Decision Making,” quoted in a PowerPoint presentation called “Key Terms,” accessed on January 28, 2020, from https://www.ferc.gov/industries/hydropower/safety/guidelines/ ridm/workshops/level-2/key-terms.pdf.
United States Bureau of Reclamation. 2011. Interim Dam Safety Public Protection Guidelines. A Risk Framework to Support Dam Safety Decision-Making, Dam Safety Office, Denver, CO, August.
United States Bureau of Reclamation and United States Army Corps of Engineers. 2019. Best Practices in Dam and Levee Safety Risk Analysis, Version 4.1, Denver, CO, and Washington, D.C., July.
United States Code of Federal Regulations, Title 18, Part 12, Subpart D
United States Water Resources Council. 2013. Economic and Environmental Principles and Guidelines for Water and Related Land Resources Implementation Studies (P&G), Washington, D.C.
United States Congress. 2018. Conference Report to Accompany H.R. 5895; Energy and Water Development and Related Agencies for the Fiscal Year ending September 30, 2019, 115th Congress, 2nd Session, Report 115-929; Energy and Water, Legislative Branch, and Military Construction and Veterans Affairs Legislations Act, 2019, Washington, DC.
Whitman, Robert V. 1984. ”Evaluating Calculated Risk in Geotechnical Engineering,” Journal of the Geotechnical Engineering, American Society of Civil Engineers, Vol. 110, No. 2, February.
Yoe, Charles E., and Kenneth D. Orth. 1996. IWR Report 96-R-21, Planning Manual, US Army Corps of Engineers, Institute for Water Resources, Alexandria, VA.
Yoe, Charles E. 2017. Planning Manual Part II: Risk-Informed Planning. United States Army Corps of Engineers, Institute for Water Resources, Alexandria, VA.

Chapter 7 – References and Resources
89
This page left blank intentionally.

California Department of Water Resources Oroville Dam Safety Comprehensive Needs Assessment Summary
90
Appendix A – Abbreviations and Glossary
A.1 Abbreviations
Abbreviation Full Name ACC Area Control Center ALARP As low as reasonably practicable BBCSD Bidwell Bar Canyon Saddle Dam CEII Critical Energy Infrastructure Information CNA Oroville Dam Safety Comprehensive Needs Assessment DSOD California Division of Safety of Dams DWR California Department of Water Resources ECB Engineering and Construction Bulletin (USACE) FCO Flood control outlet FERC Federal Energy Regulatory Commission FIRO Forecast-informed reservoir operations IRB Independent Review Board L2RA Level 2 Risk Analysis (completed with 2019 FERC PFMA for Oroville) O&M Operations and Maintenance PARA Prepare, Absorb, Recover, Adapt PCSD Parish Camp Saddle Dam PFM Potential failure mode PFMA Potential failure mode analysis RCC Roller-compacted concrete Reclamation United States Bureau of Reclamation RVOS River valve outlet system SWP State Water Project USACE United States Army Corps of Engineers
A.2 Glossary
Term Definition Abutment That part of the valley side against which the dam is constructed. An artificial
abutment is sometimes constructed, as a concrete gravity section, to take the thrust of an arch dam where there is no suitable natural abutment. The left and right abutments of dams are defined with the observer viewing the dam looking in the downstream direction, unless otherwise indicated (FEMA 2004a).
Acceptability [of a plan] The workability and viability of an alternative plan with respect to acceptance by state and local entities and the public and compatibility with existing laws, regulations, and public policies (United States Water Resources Council 2013, Sec. 1.6.2(c)(4) ).
Acceptable risk A risk is acceptable when its likelihood of occurrence is so small, its consequences are so slight, or its benefits (perceived or real) are so great that individuals or groups in society regard them as insignificant and adequately controlled (Yoe). [Contrast “acceptable risk” with “tolerable risk”]

Appendix A – Abbreviations and Glossary
91
Term Definition Adverse consequences Negative impacts that may result from the failure of a dam. The primary
concerns are loss of human life, economic loss (including property damage), lifeline disruption, and environmental impact (FEMA 2004a).
ALARP As low as reasonably practicable. The concept that risk reduction beyond a certain level may not be justified if further risk reduction is impracticable or the cost is grossly disproportionate to the risk reduction (FERC 2016, Ch. 3).
Alternative plan A set of one or more management measures functioning together to address one or more planning needs. Alternative plans should be significantly differentiated from one another (Yoe and Orth 1996).
Annual chance exceedance
The flood that has the [stated percent] chance of being exceeded in any given year, such as the 1 percent annual chance exceedance flood (HEC 2015).
Appurtenant structure Ancillary features of a dam such as outlets, spillways, powerplants, tunnels, etc. (FEMA 2004a).
Apron A section of concrete or riprap constructed upstream or downstream of a control structure to prevent undercutting of the structure (Stanford University [Undated] NPDP)
Asset management In the context of the CNA, a program in which the California Department of Water Resources Division of Operations and Maintenance uses a risk-informed approach to inform decisions about managing facilities of the State Water Project.
Bulkhead A one-piece fabricated steel unit which is lowered into guides and seals against a frame to close a water passage in a dam, conduit, spillway, etc. An object used to isolate a portion of a waterway for examination, maintenance or repair. A wall or partition erected to resist ground or water pressure (Stanford University [Undated] NPDP).
Channel A general term for any natural or artificial facility for conveying water (FEMA 2004a).
[Oroville Dam Safety] Comprehensive Needs Assessment (CNA)
A project by the California Department of Water Resources (DWR) in which DWR is identifying major dam safety needs and potential improvements to enhance the safety and reliability of the facility. The CNA project formally began in early 2018 and was completed in May 2020. The deliverable of the CNA was a portfolio of preferred alternative plans that meet the project’s needs.
Consequence
The outcome of an event affecting needs; may be expressed quantitatively or qualitatively (Maxwell and Franssen 2012). Potential loss of life or property damage downstream of a dam caused by floodwaters released at the dam or by waters released by partial or complete failure of the dam (FEMA 2004a). See also Adverse consequences.
Constraint
In the context of the CNA, this term includes four types of requirements and restrictions: Positive non-violable constraints (“shall”). Negative non-violable constraints (“shall not”). Positive violable constraints (“should”) Negative non-violable constraints (“should not”) Constraints may also include items that can be thought of as “considerations,” i.e., limitations or standards that further inform CNA activities, but are not themselves dispositive criteria.

California Department of Water Resources Oroville Dam Safety Comprehensive Needs Assessment Summary
92
Term Definition Criterion
A test, means of judging, a standard of judging; any established law, rule, principle, or fact by which a correct judgment may be formed (Yoe and Orth 1996).
Dam An artificial barrier that has the ability to impound water, wastewater, or any liquid-borne material, for the purpose of storage or control of water (FEMA 2004a).
Dam failure
Catastrophic type of failure characterized by the sudden, rapid, and uncontrolled release of impounded water or the likelihood of such an uncontrolled release. It is recognized that there are lesser degrees of failure and that any malfunction or abnormality outside the design assumptions and parameters that adversely affect a dam’s primary function of impounding water is properly considered a failure. These lesser degrees of failure can progressively lead to or heighten the risk of catastrophic failure. They are, however, normally amenable to corrective action (FEMA 2004a).
Dam safety The art and science of ensuring the integrity and viability of dams such that they do not present unacceptable risks to the public, property, and the environment. It requires the collective application of engineering principles and experience, and a philosophy of risk management that recognizes that a dam is a structure whose safe function is not explicitly determined by its original design and construction. It also includes all actions taken to identify or predict deficiencies and consequences related to failure, and to document, publicize, and reduce, eliminate, or remediate to the extent reasonably possible, any unacceptable risks (FEMA 2004a).
Diversion pool The pool at the bottom of the Oroville FCO main spillway that collects outflows from the spillway, the Hyatt Powerplant, the river valve outlet system, and the emergency spillway that serves as a tailwater pool for the Hyatt Powerplant and provides headwater for the Thermalito Diversion Dam Powerplant.
Drawdown The difference between a water level and a low water level in a reservoir within a particular time. Used as a verb (to draw down), it is the lowering of the water surface elevation (FEMA 2004a).
Efficiency The extent to which an alternative plan is the most cost-effective means of alleviating the specified problems and realizing the specified opportunities, consistent with protecting the nation’s environment (United States Water Resources Council 2013, Sec. 1.6.2(c)(3)).
Emergency spillway Auxiliary spillway. A secondary spillway designed to be operated infrequently, possibly in anticipation of some degree of structural damage or erosion to the main spillway occurring during operation (FEMA 2004a).
Erosion The wearing-away of a surface (bank, streambed, embankment, or other surface) by floods, waves, wind, or any other natural process (FEMA 2004a).
Evaluation The quantification and judgment of the significant effects or contributions of an individual alternative plan. Evaluation is a two-part process: assessment (quantification) and appraisal (judgment) (Yoe and Orth 1996).
Event An occurrence or change of a particular set of circumstances (Maxwell and Franssen 2012). In the context of dam safety, an event could be a hydrologic event, a seismic event, an operational event, or some other event that could lead to failure of the dam to perform as expected.
f-N diagram A chart composed of individual f-N pairs, where each pair typically represents one potential failure mode, or in the case of total risk, the summation of all potential failure modes. On the f-N diagram, f represents the annualized failure likelihood over all loading ranges. N represents the

Appendix A – Abbreviations and Glossary
93
Term Definition estimated life-loss or number of fatalities associated with an individual failure mode, or the weighted equivalent number of fatalities associated with the summation of failure modes (Reclamation 2011).
Failure The failure of a component to meet its intended function. Failure mode A potential failure mode is a physically plausible process for dam failure
resulting from an existing inadequacy or defect related to a natural foundation condition, the dam or appurtenant structure design, the construction, the materials incorporated, the operations and maintenance, or aging process, which can lead to an uncontrolled release of the reservoir (FEMA 2004a).
Flood A temporary rise in water surface elevation resulting in inundation of areas not normally covered by water. Hypothetical floods may be expressed in terms of average likelihood of exceedance per year such as one-percent-chance flood, or expressed as a fraction of the probable maximum flood or other reference flood (FEMA 2004a).
Flood control outlet (FCO)
Oroville Dam’s gated, main spillway.
Flood storage The retention of water or delay of runoff either by planned operation, as in a reservoir, or by temporary filling of overflow areas, as in the progression of a flood wave through a natural stream channel (FEMA 2004a).
Floodplain An area adjoining a body of water or natural stream that may be covered by floodwater. Also, the downstream area that would be inundated or otherwise affected by the failure of a dam or by large flood flows. The area of the floodplain is generally delineated by a frequency (or size) of flood (FEMA 2004a).
Forecast Informed Reservoir Operations (FIRO)
A reservoir-operations strategy that better informs decisions to retain or release water by integrating additional flexibility in operation policies and rules with enhanced monitoring and improved weather & water forecasts.
Formulation The process of building plans that meet planning needs and avoid planning constraints (Yoe and Orth 1996).
Gate A movable barrier for the control of water (FEMA 2004a). Goal A broad purpose (Yoe and Orth 1996). Headworks The steel and concrete structure at the head of the Oroville main spillway
that contains the eight radial gates controlling the outlet bays. Incremental consequences
Under the same conditions, the difference in impacts that would occur due to failure or misoperation of the dam over those that would have occurred without failure or misoperation of the dam and appurtenant structures (FEMA 2004).
Instrumentation An arrangement of devices installed into or near dams that provide for measurements that can be used to evaluate the structural behavior and performance of the structure (FEMA 2004a).
Intake Placed at the beginning of an outlet-works waterway (power conduit, water supply conduit), the intake establishes the ultimate drawdown level of the reservoir by the position and size of its opening(s) to the outlet works. The intake may be vertical or inclined towers, drop inlets, or submerged, box-shaped structures. Intake elevations are determined by the head needed for discharge capacity, storage reservation to allow for siltation, the required amount and rate of withdrawal, and the desired extreme drawdown level (FEMA 2004b).
Level of risk The value of the risk estimate (FERC 2016, Ch. 2).
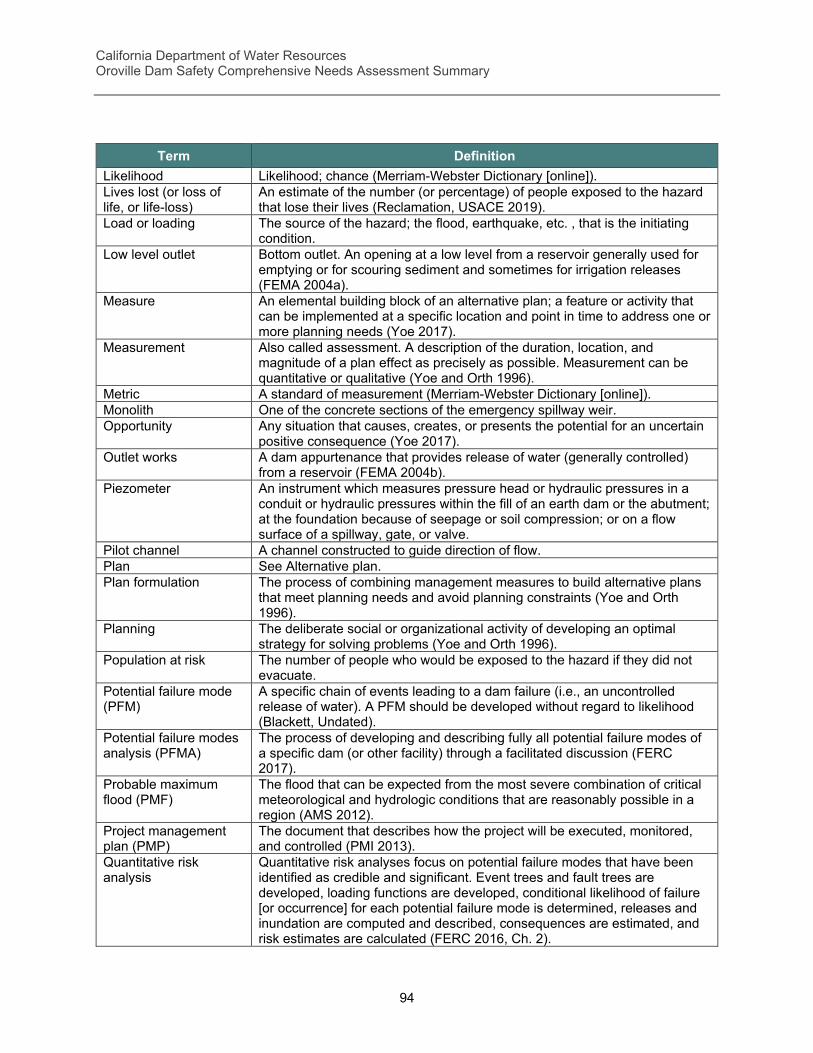
California Department of Water Resources Oroville Dam Safety Comprehensive Needs Assessment Summary
94
Term Definition Likelihood Likelihood; chance (Merriam-Webster Dictionary [online]). Lives lost (or loss of life, or life-loss)
An estimate of the number (or percentage) of people exposed to the hazard that lose their lives (Reclamation, USACE 2019).
Load or loading The source of the hazard; the flood, earthquake, etc. , that is the initiating condition.
Low level outlet Bottom outlet. An opening at a low level from a reservoir generally used for emptying or for scouring sediment and sometimes for irrigation releases (FEMA 2004a).
Measure An elemental building block of an alternative plan; a feature or activity that can be implemented at a specific location and point in time to address one or more planning needs (Yoe 2017).
Measurement Also called assessment. A description of the duration, location, and magnitude of a plan effect as precisely as possible. Measurement can be quantitative or qualitative (Yoe and Orth 1996).
Metric A standard of measurement (Merriam-Webster Dictionary [online]). Monolith One of the concrete sections of the emergency spillway weir. Opportunity Any situation that causes, creates, or presents the potential for an uncertain
positive consequence (Yoe 2017). Outlet works A dam appurtenance that provides release of water (generally controlled)
from a reservoir (FEMA 2004b). Piezometer An instrument which measures pressure head or hydraulic pressures in a
conduit or hydraulic pressures within the fill of an earth dam or the abutment; at the foundation because of seepage or soil compression; or on a flow surface of a spillway, gate, or valve.
Pilot channel A channel constructed to guide direction of flow. Plan See Alternative plan. Plan formulation The process of combining management measures to build alternative plans
that meet planning needs and avoid planning constraints (Yoe and Orth 1996).
Planning The deliberate social or organizational activity of developing an optimal strategy for solving problems (Yoe and Orth 1996).
Population at risk The number of people who would be exposed to the hazard if they did not evacuate.
Potential failure mode (PFM)
A specific chain of events leading to a dam failure (i.e., an uncontrolled release of water). A PFM should be developed without regard to likelihood (Blackett, Undated).
Potential failure modes analysis (PFMA)
The process of developing and describing fully all potential failure modes of a specific dam (or other facility) through a facilitated discussion (FERC 2017).
Probable maximum flood (PMF)
The flood that can be expected from the most severe combination of critical meteorological and hydrologic conditions that are reasonably possible in a region (AMS 2012).
Project management plan (PMP)
The document that describes how the project will be executed, monitored, and controlled (PMI 2013).
Quantitative risk analysis
Quantitative risk analyses focus on potential failure modes that have been identified as credible and significant. Event trees and fault trees are developed, loading functions are developed, conditional likelihood of failure [or occurrence] for each potential failure mode is determined, releases and inundation are computed and described, consequences are estimated, and risk estimates are calculated (FERC 2016, Ch. 2).

Appendix A – Abbreviations and Glossary
95
Term Definition Radial gate A pivoted crest gate, the face of which is usually a circular arc, with the
center of curvature at the pivot about which the gate swings (tainter gate). Reconnaissance study A study that provides decision makers with enough information to determine
whether additional interest and investigation in one or more of the alternative plans developed by the CNA project team is warranted.
Redundancy Duplication of critical components of a system with the intention of increasing reliability of the system, usually in the case of a backup or fail-safe (USACE 2014).
Reliability (1) The likelihood that the system under consideration is in a non-failure state (Hashimoto, T. , et al. , 1982). (2) The likelihood of successful performance. Mathematically, reliability = 1 – P of unsatisfactory operation (USACE 2014).
Residual risk The amount of existing, future, or historical risk that remains or might remain after a plan has been implemented (Yoe and Orth 1996).
Resiliency The ability to avoid, minimize, withstand, and recover from the effects of adversity, whether natural or manmade, under all circumstances of use (USACE 2014).
Risk A measure of the likelihood and consequence of uncertain future events. It is often reduced to the simple equation: Risk = Consequence x Likelihood (Yoe 2017)
Risk analysis The use of available information to estimate the risk to individuals or populations, property, or the environment from hazards. Risk analyses generally contain the following steps: scope definition, hazard identification, and risk estimation. The risk analysis process involves the scientific characterization of what is known and what is uncertain about the present and future performance of the dam system under examination (FERC 2016, Ch. 1).
Risk assessment The process of considering the results from a quantitative or qualitative estimated risk analysis of an existing dam or project, along with other factors related to a safety decision. These factors can include the dam safety case, social/economic impacts, environmental impacts, constructability, and potential to do harm. The risk assessment is conducted to determine a recommended course of action (which may involve considering a range of options) for mitigating or accepting the risks related to a specific dam or project or with regard to a specific dam safety issue or operational concern on that project (FERC 2016, Ch. 3, citing FEMA 2015).
Risk attitude Whether a decision maker is risk neutral, risk averse, or risk seeking (Goda and Hong 2006).
Risk communication The open, two-way exchange of information and opinion among risk analysts, their stakeholders, and various publics about risks (Yoe 2017).
Risk identification A qualitative process of listing potential failure modes as sequences of events or combinations of conditions which are considered necessary for dam failure to occur (Bowles, et al. 1999).
Risk-informed The explicit recognition of uncertainty and the use of risk performance metrics in an analytic-deliberative process; decision-making under uncertainty (Yoe 2017).
Risk management In the USACE framework, the application of policies, preferences, and values to the outcomes of risk assessment (Yoe 2017).

California Department of Water Resources Oroville Dam Safety Comprehensive Needs Assessment Summary
96
Term Definition Risk register A project management tool for documenting and managing the risks of a
project (Yoe 2017). As used in this definition, “project” has the meaning defined in the PMI PMBOK: “A temporary endeavor undertaken to create a unique product, service, or result. The temporary nature of projects indicates that a project has a definite beginning and end. ”
Risk source An element which alone or in combination has the intrinsic potential to give rise to the risk (Maxwell and Franssen 2012).
Robustness The ability of the component to continue to operate correctly across a wide range of operational conditions, with minimal damage, alteration, or loss of functionality, and to fail gracefully outside of that range (USACE 2014).
Saddle dam A subsidiary dam of any type constructed across a saddle or low point on the perimeter of a reservoir.
Scoping Identifying the problems and opportunities, and describing the planning study’s context, i.e., without-plan condition, needs and constraints, decision criteria, and sources of uncertainty (Yoe 2017).
Screening A discriminating thought process during which things are examined methodically and separated into groups of “drop” and “consider further. ” It is a form of decision-making based on well-defined and agreed-upon criteria (Yoe and Orth 1996).
Secant pile wall A retaining wall constructed from intersecting reinforced concrete piles. Selection The decision on whether to include or exclude a given plan from further
consideration. In the USACE’ water resources planning framework, it means selecting the best plan from among the alternative plans (Yoe and Orth 1996).
Semi-quantitative risk analysis (SQRA)
A description of risk based on estimates of likelihood categories and consequence categories for each potential failure mode. In SQRA, life risk is typically portrayed on a risk matrix chart (FERC 2016, Ch. 2).
Spillway A structure over or through which flow is discharged from a reservoir. If the rate of flow can be controlled by mechanical means, such as gates, it is considered a controlled spillway. If the geometry of the spillway is the only control, it is considered an uncontrolled spillway (FEMA 2004b).
Spillway chute A steeply sloping spillway channel that conveys discharges at super-critical velocities (FEMA 2004a).
Spillway crest The lowest level at which water can flow over or through the spillway (FEMA 2004a).
Spillway design capacity
The maximum spillway outflow which a dam can safely pass with the reservoir at maximum level (FEMA 2004b).
Stakeholder An individual or organization with an interest in a project. Reclamation (2014) provides one approach to stakeholder identification and categorization: Primary stakeholder: any person or organization ultimately affected, either positively or negatively, by project actions. Secondary stakeholder: any person or organization indirectly affected by project actions. Influencer: any person or organization with significant influence over the conduct of a project proponent’s actions. (An influencer can also be a primary or secondary stakeholder. )
State Water Project (SWP)
A water storage and delivery system of reservoirs, aqueducts, power plants, and pumping plants extending more than 700 miles. Planned, constructed, and operated by the California Department of Water Resources (DWR), the

Appendix A – Abbreviations and Glossary
97
Term Definition SWP is the nation’s largest state-built, multi-purpose, user-financed water project. The primary purpose of the SWP is water supply (DWR State Water Project website).
Switchyard The substation that delivers power generated at the power plant to the electrical grid.
Task In the context of the CNA project, a Task is one of the six technical Tasks that comprise the CNA. They focus on these areas: (1) spillway alternatives; (2) reservoir operations; (3) Flood Control Outlet reliability; (4) possible contributions from a low-level outlet; (5) embankment stability; and (6) instrumentation. For clarity and consistency, when the word “Task” refers to one of these six focus areas, it is capitalized (“Task”).
Toe The point of intersection between the upstream or downstream face of the dam and natural ground, for example, the upstream or downstream toe of a dam.
Tolerable risk An unacceptable risk whose severity has been reduced to a point where it is tolerated (Yoe 2017).
Trunnion The structure that is attached to the radial gate with trunnion arms. It acts as the pivot point when the radial gate rotates.
Watershed The area drained by a river or river system or portion thereof. The watershed for a dam is the drainage area upstream of the dam (FEMA 2004a).
Weir An overflow structure built across an open channel to raise the upstream water level and/or to measure the flow of water.
With-plan condition The condition that is expected to prevail in the planning area in the future if a particular plan is implemented.
Without-plan condition The condition expected to prevail in the planning area in the future if no plan is implemented to solve the problem. Every alternative plan is compared to the same future without-plan condition (Yoe and Orth 1996).

California Department of Water Resources Oroville Dam Safety Comprehensive Needs Assessment Summary
98
Appendix B – Independent Review Board Final Report Please see following three pages.

Appendix B – Independent Review Board Final Report
99

California Department of Water Resources Oroville Dam Safety Comprehensive Needs Assessment Summary
100

Appendix B – Independent Review Board Final Report
101