ornl-4396
DESCRIPTION
http://www.energyfromthorium.com/pdf/ORNL-4396.pdfTRANSCRIPT


E ! ‘b
I . .. , ‘.TI
i i y
I
Contract No. W-74059ng-26
MOLTENSALT REACTOR PROGRAM
SEMIANNUAL PROGRESS REPORT
For Period Ending February 28,1969
M. W. Rosenthal, Program Director
R. B. Briggs, Associate Director P. R. Kasten, Associate Director
- L E G A L NOTICE.-l
AUGUST 1969
OAK RIDGE NATIONAL LABORATORY Oak Ridge, Tennessee
operated by UNION CARBIDE CORPORATION
for the U. S. ATOMIC ENERGY COMMISSION
ORNL-4396 UC-80 - Reactor Technology

This report is one of a series of periodic reports in which we describe the progress of the program. Other reports issued in this series are listed below. ORNL3708 is especially useful because it gives a thorough re- view of the design and construction and supporting development work for the MSRE.
0-2474 ORNL2626 ORNL-2684 ORNL-2723 ORNL2799 ORNL-2890 ORNL-2973 ORNL-3014 ORNL-3 122 ORNL-3215 OWL-3282 ORNL-3369 ORNL-3419 ORNL-3529 ORNL-3626 OWL-3708 ORNL-38 12 ORNL-3872 ORNL-3936 ORNL-4037 ORNL-4119 ORNL-4 19 1 ORNL-4254 ORNL-4344
Period Ending January 3 1,1958 Period Ending October 3 1, 1958 Period Ending January 3 1,1959 Period Ending April30,1959 Period Ending July 31,1959 Period Ending October 3 1,1959 Periods Ending January 3 1 and April 30,1960 Period Ending July 3 1,1960 Period Ending February 28,1961 Period Ending August 3 1,196 1 Period Ending February 28,1962 Period Ending August 3 1,1962 Period Ending January 3 1,1963 Period Ending July 3 1,1963 Period Ending January 3 1,1964 Period Ending July 3 1,1964 Period Ending February 28, 1965 Period Ending August 3 1, 1965 Period Ending February 28,1966 Period Ending August 3 1,1966 Period Ending February 28,1967 Period Ending August 3 1,1967 Period Ending February 29,1968 Period Ending August 3 1,1968
?
"r-
z
brr I

.
P .
T
. U
'W I
Contents
INTRODUCTION . . . . . . . . . . . . . . . . . . . . . . . . . . . . . . . . . . . . . . . . . . . . . . . . . . . . . . . . . . . . . xi
SUMMARY . . . . . . . . . . . . . . . . . . . . . . . . . . . . . . . . . . . . . . . . . . . . . . . . . . . . . . . . . . . . . . . . . . xiii
PART 1 . MOLTENSALT REACTOR EXPERIMENT
1 . MSREOPERATIONS . . . . . . . . . . . . . . . . . . . . . . . . . . . . . . . . . . . . . . . . . . . . . . . . . . . . . . . . 1 1.1 Chronological Account of Operations and Maintenance . . . . . . . . . . . . . . . . . . . . . . . . . . . . . 1
1.2 ' '' U Zero-Power Tests . . . . . . . . . . . . . . . . . . . . . . . . . . . . . . . . . . . . . . . . . . . . . . . . . . 5 1.2.1 CriticalExperiment . . . . . . . . . . . . . . . . . . . . . . . . . . . . . . . . . . . . . . . . . . . . . . . 5 1.2.2 Control Rod Calibration . . . . . . . . . . . . . . . . . . . . . . . . . . . . . . . . . . . . . . . . . . . . 7 1.2.3 Temperature Coefficient of Reactivity . . . . . . . . . . . . . . . . . . . . . . . . . . . . . . . . . . 8 1.2.4 Concentration Coefficient of Reactivity . . . . . . . . . . . . . . . . . . . . . . . . . . . . . . . . . 9
1.3 Operations Analysis . . . . . . . . . . . . . . . . . . . . . . . . . . . . . . . . . . . . . . . . . . . . . . . . . . . . . 9 1.3.1 SystemDynamics . . . . . . . . . . . . . . . . . . . . . . . . . . . . . . . . . . . . . . . . . . . . . . . . 9 1.3.2 Gas in the Fuel Salt . . . . . . . . . . . . . . . . . . . . . . . . . . . . . . . . . . . . . . . . . . . . . . . 11 1.3.3 Neutron and Pressure Noise Measurements . . . . . . . . . . . . . . . . . . . . . . . . . . . . . . . . 16 1.3.4 Perturbations in Nuclear Power . . . . . . . . . . . . . . . . . . . . . . . . . . . . . . . . . . . . . . . 16 1.3.5 Salt Transfer to Overflow Tank . . . . . . . . . . . . . . . . . . . . . . . . . . . . . . . . . . . . . . . 21 1.3.6 Thermal-Convection Heat-Removal Test . . . . . . . . . . . . . . . . . . . . . . . . . . . . . . . . . 22 1.3.7 Radiation Heating . . . . . . . . . . . . . . . . . . . . . . . . . . . . . . . . . . . . . . . . . . . . . . . . 23 1.3.8 Thermal Cycle History . . . . . . . . . . . . . . . . . . . . . . . . . . . . . . . . . . . . . . . . . . . . . 23
1.4.1 ' ' U Loading Equipment .......................................... 24
1.4.3 Control Rods and Drives ........................................... 26 1.4.4 OffGasSystem . . . . . . . . . . . . . . . . . . . . . . . . . . . . . . . . . . . . . . . . . . . . . . . . . 27 1.4.5 Component Cooling System ......................................... 28 1.4.6 Containment and Ventilation ........................................ 28 1.4.7 Electrical System ................................................
1.4 Equipment . . . . . . . . . . . . . . . . . . . . . . . . . . . . . . . . . . . . . . . . . . . . . . . . . . . . . . . . . . 24
1.4.2 Saltsamplers ................................................... 25
28 1.4.8 Heaters ....................................................... 29 1.4.9 Other ........................................................ 29
2.COMPONENTDEVELOPMENT ................................................. 30
2.2 Pumps ............................................................. 31
2.1 Freeze-Flange Thermalcycle Test ........................................... 30
2.2.1 Mark2FuelPump ................................................ 31 2.2.2 Oil Pump Endurance Test . . . . . . . . . . . . . . . . . . . . . . . . . . . . . . . . . . . . . . . . . . . 32
3 ..
iii
iv
3 . INSTRUMENTATIONANDCONTRO LS ........................................... 33 3.1 MSRE Operating Experience ............................................... 33
3.2 Controls System Design .................................................. 33
3.3 MSRE Computer System ................................................. 33
4 . MSREREACTORANALYSIS .................................................. 35
4.1 Long-Term Isotopic Changes and Reactivity Effects During Operation with ” ’ U . . . . . . . . . . . . 35
4.2 Analysis of Zero-Power RodCalibration Experiments .............................. 37
4.2.2 Reactivity Effect of Excess Uranium ................................... 40 4.2.1 Rod-Drop Experiments ............................................ 38
4.2.3 Summary of RodCalibration Information ................................ 41
W
2
4.3 Calculations of Reactivity Variations from Power-Time Records ....................... 43
4.4 Theoretical Analysis of Dynamics with ” ’ U Fuel ................................ 45
I 1 PART 2 . MSBR DESIGN AND DEVELOPMENT
5 . DESIGN ................................................................. 49 5.1 General .............................................................. 49
5.2 Plantbyout ......................................................... 49 5.3 Reactor ............................................................. 52
i 5.4 Primary Heat Exchangers ................................................. 57
I 5.5 Steam Generator and Superheater ........................................... 57 1 5.6 SteamReheater ....................................................... 59
~
I 5.7 Removal of Reactor Afterheat .............................................. 59
5.7.1 Introduction ................................................... 59 5.7.2 Sources of Afterheat .............................................. 59 5.7.3 Heat-Removal Systems ............................................. 60
5.8 Distribution of Noble-Metal Fission Products and Their Decay Heat ..................... 62 5.9 Reactor Temperatures. Flows. and Heat Transfer ................................. 64
5.9.1 Reactorcore ................................................... 64 5.9.2 Flow and Temperature in Radial Reflector ............................... 67 5.9.3 Flow and Temperature in Axial Reflectors ................................ 69
5.10 Estimated Costs of 1000 Mw (electrical) MSBR Power Station ........................ 70
5.11 MSBEDesign ......................................................... 71 5.11.1 Introduction ................................................... 71 5.1 1.2 Description of Reactor Plant ......................................... 74
5.9.4 Vessel Temperatures .............................................. 70
I 6 . REACTORPHYSICS ........................................................ 76 6.1 Physics Analysis of MSBR ................................................ 76
6.1.1 Optimization of the MSBR .......................................... 76 6.1.2 The One-Fluid MSBR Reference Design . . . . . . . . . . . . . : . . . . . . . . . . . . . . . . . . . 77 6.1.3 Nuclear Design Studies ............................................. 77
~ .. %
c
* ...
w

l
i
‘ B i
c c
’W
V
6.1.4 Optimum Thorium Concentration in MSBR ............................... 80 6.1.5 Improvements in Computational Tools .................................. 82 6.1.6 Gamma and Neutron Heating in MSBR .................................. 83
6.2 Physics Analysis of MSBE . . . . . . . . . . . . . . . . . . . . . . . . . . . . . . . . . . . . . . . . . . . . . . . . . 84 6.2.1 MSBE Design Studies . . . . . . . . . . . . . . . . . . . . . . . . . . . . . . . . . . . . . . . . . . . . . . 84
6.3 MSBR Experimental Physics . . . . . . . . . . . . . . . . . . . . . . . . . . . . . . . . . . . . . . . . . . . . . . . 87 Initial Results of the Experiment to Measure a(235U) in the MSRE . . . . . . . . . . . . . . . 6.3.1 87
7 . SYSTEMSANDCOMPONENTSDEVELOPMENT . . . . . . . . . . . . . . . . . . . . . . . . . . . . . . . . . . . . . 90 7.1 OffGasSystem . . . . . . . . . . . . . . . . . . . . . . . . . . . . . . . . . . . . . . . . . . . . . . . . . . . . . . . 90
7.1.1 Volume Holdup Tank . . . . . . . . . . . . . . . . . . . . . . . . . . . . . . . . . . . . . . . . . . . . . 90 7.2 NobleGas Migration in the MSBR ........................................... 92
Contribution of the Noble Gases to Afterheat in the Graphite . . . . . . . . . . . . . . . . . . . Distribution of Decay Heat in the MSBR Off-Gas System ......................
7.2.1 7.2.2
92 94
7.3 Bubble Generator . . . . . . . . . . . . . . . . . . . . . . . . . . . . . . . . . . . . . . . . . . . . . . . . . . . . . . 95
7.4 Bubble Separator . . . . . . . . . . . . . . . . . . . . . . . . . . . . . . . . . . . . . . . . . . . . . . . . . . . . . . 96
7.5 MoltenSalt Steam Generator Test Stand ....................................... 98
7.6 Sodium Fluoroborate Circulating Test Loop . . . . . . . . . . . . . . . . . . . . . . . . . . . . . . . . . . . . 98 7.6.1 Pumping Characteristics of Sodium Fluoroborate Salt ........................ 100 7.6.2 Control of Salt Composition . . . . . . . . . . . . . . . . . . . . . . . . . . . . . . . . . . . . . . . . . 100 7.6.3 Corrosion Product Deposition . . . . . . . . . . . . . . . . . . . . . . . . . . . . . . . . . . . . . . . . 102 7.6.4 Gas System Studies . . . . . . . . . . . . . . . . . . . . . . . . . . . . . . . . . . . . . . . . . . . . . . . 102
7.7.1 MSBR PrimarySalt Pump ........................................... 106 7.7.2 Pump Program for the MoltenSalt Breeder Experiment ....................... 108 7.7.3 MSBE Salt Pump Test Stand ......................................... 109
7.7 MSBRPumps . . . . . . . . . . . . . . . . . . . . . . . . . . . . . . . . . . . . . . . . . . . . . . . . . . . . . . . . . 106
7.7.4 ALPHAPump . . . . . . . . . . . . . . . . . . . . . . . . . . . . . . . . . . . . . . . . . . . . . . . . . . 109
7.8 Remotewelding . . . . . . . . . . . . . . . . . . . . . . . . . . . . . . . . . . . . . . . . . . . . . . . . . . . . . . . 109
113 c)
8 . MSBR INSTRUMENTATION AND CONTROLS ...................................... 8.1 Control System Analysis ................................................. 113 8.2 Calculations of Neutron Decay After Shutdown .................................. 115
8.2.1
8.2.2
Calculation of the Effect of the Beryllium Photoneutron Reaction on Neutron Density After Shutdown ............................
Calculation of Neutron Density Following Loss of Primary Flow . . . . . . . . . . . . . . . . 115 115
8.3 Dynamic Analysis of MSBR Steam Generator .................................... 116
8.4 High-Temperature Resistance Thermometer Evaluation ............................. 116
9 . HEAT TRANSFER AND THERMOPHYSICAL PROPERTIES ............................. 119 9.1 HeatTransfer ......................................................... 119
9.2 Thermophysical Properties ................................................ 122 9.2.1 Thermal Conductivity ............................................. 122
9.3 Mass Transfer to Circulating Bubbles ......................................... 124

vi 1
PART 3 . CHEMISTRY
10 . CHEMISTRY OF THE MSRE .................................................... 129 10.1 A Material Balance for the MSRE Fuel Salt ..................................... 129 10.2 MSRE Fuel Circuit Corrosion Chemistry ....................................... 130 10.3 Adjustment of U3+/CU Concentration of the MSRE Fuel Salt ......................... 133 10.4 Examination of Simulated MSRE Fuel Mixture for Foam-Producing Properties . . . . . . . . . . . . . 135 10.5 Foaming Behavior in Molten Salts ........................................... 137
I
11 . FISSION PRODUCT BEHAVIOR . . . . . . . . . . . . . . . . . . . . . . . . . . . . . . . . . . . . . . . . . . . . . . . . 138 1 1.1 Fission Product Behavior in the MSRE ........................................ 138
11.1.1 Examination of Graphite Surveillance Specimens ........................... 138 11.1.2 Distribution of Fission Products in the MSRE ............................. 138 11.1.3 Fission Product Inventory During ' "U Operation .......................... 138 1 1.1.4 Response of 9 5 Nb Activity to Fuel Redox Chemistry ........................ 139
1 1.1.6 Examination of Material Recovered from MSRE Off-Gas Line . . . . . . . . . . . . . . . . . . 143 1 1.1.5 MSRE Off-Gas Analyzer-Sampler ...................................... 140
11.2 Fission Product Volatilization Tests .......................................... 145 11.2.1 Chemical Probe Tests .............................................. 145 1 1.2.2 Electric Charge of the Radioactive Aerosols . . . . . . . . . . . . . . . . . . . . . . . . . . . . . . . 148
I 1 1.2.3 Electron Microscope Tests . . . . . . . . . . . . . . . . . . . . . . . . . . . . . . . . . . . . . . . . . . 148 11.2.4 Aerosol Deposition from a Helium Stream ................................ 148 11.2.5 Closed-Tube Diffusion Tests ......................................... 150 11.2.6 Volatilization of MSRE Salt in the Absence of Radioactivity .................... 150 11.2.7 Summary and Interpretation of HotCell Test Results ........................ 151 11.2.8 Attempt to Sample Foam in Pump Bowl ................................. 151
11.3 Laboratory Tests on Aerosol Formation Over Molten Salts and Transfer of Niobium from Salt to Bismuth . . . . . . . . . . . . . . . . . . . . . . . . . . . . . . . . . . . . . . . . . . . . . 153
11.4 The Chemistry of the Noble Fission Product Fluorides .............................. 157 1 1.4.1 Molybdenum Fluoride Synthesis, Characterization, and Stability . . . . . . . . . . . . . . . . . 157
1
~ 11.4.2 Mass Spectrometric Studies of Fluorides ................................. 159
I 12 . PHYSICAL CHEMISTRY OF MOLTEN SALTS ...................................... 163 163 12.1 CeFJ Solubility in Molten Mixtures of LiF. BeF2. and ThF4 ..........................
12.2 Correlation of CeF3 Solubility with Solvent Composition ............................ 164 12.3 Zone Melting of Fluoride Salts ............................................. 166
12.3.1 Phase Behavior .................................................. 167 12.3.2 Zone Melting ................................................... 168 12.3.3 Cyclic Slow Cooling .............................................. 168 12.3.4 Cerium ....................................................... 168
12.4 Behavior ofCeF3 in the Fractional Crystallization Of ThF4 from LiF-BeFp-ThF4 Melts ........ 168 12.5 Properties of the Alkali Fluoroborates ........................................ 169
12.5.1 Phase Relations in Fluoroborate Systems ................................. 169 12.5.2 The System Na-KFBF3 ............................................ 170 12.5.3 The System KF-KBF4 ............................................. 170 12.5.4 The System NaBF4-KBF4 .......................................... 171 12.5.5 The System NaF-NaBF4 ............................................ 171
W a E
... w
8
."
...
vii
j ; i
'c) 'r!
' W
12.6 Limits of Miscibility in Molten Salt Systems: KBF4.LiF. Liz BeF4 .KI. and Li2 BeF4 -KBF4 ........................................... 171
12.6.1 The System KBF4-LiF . . . . . . . . . . . . . . . . . . . . . . . . . . . . . . . . . . . . . . . . . . . . . 171 12.6.2 The System Liz BeF4 -KI ............................................. 172 12.6.3 The System Li2BeF4XBF4 . . . . . . . . . . . . . . . . . . . . . . . . . . . . . . . . . . . . . . . . . 172
12.7 Solubility of Thorium Metal in Molten Lithium Fluoride-Thorium Fluoride Mixtures . . . . . . . . . 172
12.8 The Crystal Structure of KBF4 . . . . . . . . . . . . . . . . . . . . . . . . . . . . . . . . . . . . . . . . . . . . . 173
12.9 Densities of Molten Salts . . / . . . . . . . . . . . . . . . . . . . . . . . . . . . . . . . . . . . . . . . . . . . . . . 174
12.10 Spectroscopy of Fluoride Media . . . . . . . . . . . . . . . . . . . . . . . . . . . . . . . . . . . . . . . . . . . . 175 12.10.1 The Diamond-Windowed Cell . . . . . . . . . . . . . . . . . . . . . . . . . . . . . . . . . . . . . . . . 175 12.1 0.2 Salt Purification for Fluoride Spectroscopy ............................... 175
12.1 1 The Distribution of v' Between Molten LiF-BeF2 -ThF4-UF4 and a (U-Th)O2 Solid Solution . . . . . . . . . . . . . . . . . . . . . . . . . . . . . . . . . . . . . . . . . . . . . . . . 176
12.12 An Ni-NiO-Be0 Electrode as a Reference Electrode in Molten Fluorides . . . . . . . . . . . . . . . . . 178
12.13 Emf Measurements with Concentration Cells with Transference in Molten Mixtures of LiF and BeF2 . . . . . . . . . . . . . . . . . . . . . . . . . . . . . . . . . . . . . . . . . . . . . . . . 180
12.14 Electrical Conductance of Molten KNO3 . . . . . . . . . . . . . . . . . . . . . . . . . . . . . . . . . . . . . . . 182
12.1 5 Electrical Conductance of Molten Beryllium Fluoride . . . . . . . . . . . . . . . . . . . . . . . . . . . . . . 184
13 . CHEMISTRY OF MOLTENSALT REACTOR FUEL REPROCESSING TECHNOLOGY . . . . . . . . . . . 187
13.1 Simultaneous Extraction of Zirconium and Uranium and of Zirconium and Protactinium . . . . . . . 187
13.2 Protactinium Studies in the HighAlpha MoltenSalt Laboratory ....................... 188
13.3 Further Studies of the Reductive Extraction of Protactinium from Single-Fluid MSBR Fuel Salt by Thorium in Molten Bismuth ................................. 189
13.4 Reductive Extraction of Rare Earths from Molten Mixtures of LiF, BeF2. and ThF4 into Bismuth .................................................... 191
13.5 Metal Phases Other than Bismuth for Rare-Earth Extraction .......................... 192
13.6 Separation of Cerium from Thorium in Bismuth by Cold Zone Deposition of Thorium Bismuthide ................................................... 193
Extraction of Thorium by Electrolytic Reduction into Flowing Liquid Lead from Molten Mixtures of LiF. BeF2. ThF4. and Rare-Earth Fluorides ....................... 195
13.7
14 . DEVELOPMENT AND EVALUATION OF ANALYTICAL METHODS FOR MOLTENSALT REACTORS .............................................. 197
14.1 Determination of Oxide in MSRE Fuel ........................................ 197
14.2 Determination of the Oxidation State of Constituents of MSRE Fuel .................... 197 14.2.1 Determination of Total Reducing Power of MSR Salts ........................ 197 14.2.2 Determination of U(I1I) in Radioactive MSRE Fuel by a Hydrogen
Reduction Method .............................................. 199 14.2.3 Voltammetric Determination of U(IV)/U(III) Ratios in MSW Fuel ................ 200
14.3 Emf, Voltammetric. and Spectrophotometric Measurements on the U(IV)/U(III) Couple in Molten LiF-BeF2 -ZrF4 .................................. 201
14.4 Emf Measurements in Molten Fluorides ........................................ 202
14.5 Development of a MoltenSalt Spectrophotometric Facility for HotCell Use . . . . . . . . . . . . . . . 202
..

I
viii
14.6 Absorption Spectra of 3d Transition-Metal Ions in Molten LiF-BeF2 .................... 204 14.7 Effect of Reductants on Metal-FluorideSalt Wetting Behavior ......................... 205 14.8 Determination of Contaminants in the Blanket Gas of NaBF4 Tests ..................... 205 14.9 Determination of Bismuth in MSRP Salts ...................................... 208
14.9.1 Polarography ................................................... 208 14.9.2 Spectrophotometry ............................................... 208 14.9.3 Emission Spectrography ............................................ 208 14.9.4 Polarographic Shipping ............................................ 208 14.9.5 Isotopic Exchange ................................................ 208
PART 4 . MOLTEN-SALT IRRADIATION EXPERIMENTS
15 . MOLTENSALT CONVECTION LOOP IN ORR ...................................... 210 Studies of Surface Wetting of Graphite by Molten Salt .............................. 210 15.1
PART 5 . MATERIALS DEVELOPMENT
16 . MSRE SURVEILLANCE PROGRAM ............................................. 211 Examination of Particles Removed from Pump Bowl with Magnets ...................... 211 16.1.1 Observations on Particles from Magnet FP-15-53 ............................ 212 16.1.2 Observations on Particles from Magnet FP-16-2 ............................ 213
16.1
17 . GRAPHITESTUDI ES ........................................................ 214 17.1 Fundamental Studies of Radiation Damage Mechanisms in Graphite ..................... 214 17.2 Graphitization Chemistry and Binder System Development ........................... 215 17.3 Hot Pressing of Graphite Pellets Using Various Binders .............................. 216 17.4 Procurement and Physical Property Measurements on New Grades of Graphite . . . . . . . . . . . . . . 217 17.5 Physical Properties of Graphites ............................................. 219 17.6 X-Raystudies ........................................................ 219 17.7 Electron Microscopy of Graphite ............................................ 221 17.8 Gas Impregnation of Graphite with Carbon ..................................... 221 17.9 Graphite Irradiation in HFIR .............................................. 224 17.10 Calculation of Lifetime and Induced Stresses in MSBR Cores ......................... 229
18 . HASTELLOYN ............................................................ 232 18.1 Influence of Titanium and Carbon on the Mechanical Properties of Nickel-Base Alloys . . . . . . . . . 232 18.2 Aging of Modified Hastelloy N ............................................. 233 18.3' Influence of Irradiation Temperature on the Creep-Rupture Properties of Hastelloy N . . . . . . . . . 235
18.4 Electron Microscopy Studies ............................................... 240 18.5 Measurement of Residual Stresses in Hastelloy N Welds ............................. 242 18.6 Corrosion Studies . . . . . . . . . . . . . . . . . . . . . . . . . . . . . . . . . . . . . . . . . . . . . . . . . . . . . . 243
18.6.1 FuelSalts ..................................................... 243 18.6.2 Fertile-Fissile Salts ............................................... 243
.. w
r
.
P
Y .
i
ix
I
c
r:
c
5
18.6.3 BlanketSalts . . . . . . . . . . . . . . . . . . . . . . . . . . . . . . . . . . . . . . . . . . . . . . . . . . . 245 18.6.4 Coolant Salts . . . . . . . . . . . . . . . . . . . . . . . . . . . . . . . . . . . . . . . . . . . . . . . . . . . . 246 18.6.5 Comparison of the Kinetic Behavior of Nickel- and Iron-Based
Alloys in Molten Fluoride Salts . . . . . . . . . . . . . . . . . . . . . . . . . . . . . . . . . . . . . . 248 18.7 Forced Convection Loop . . . . . . . . . . . . . . . . . . . . . . . . . . . . . . . . . . . . . . . . . . . . . . . . . 253
18.8 Oxidation of Hastelloy N ........................ : ........................ 254
19 . SUPPORT FOR CHEMICAL PROCESSING ......................................... 261
19.1 Graphite-Hastelloy N Transition Joint Development ............................... 261
19.2 Development of Corrosion-Resistant Brazing Alloys for Molybdenum .................... 261
19.3 Examination of Mo-TZM Capsule . . . . . . . . . . . . . . . . . . . . . . . . . . . . . . . . . . . . . . . . . . . . 262
19.4 Bismuth Corrosion Studies ....................... - ......................... 264
20 . SUPPORT FOR COMPONENTS DEVELOPMENT PROGRAM ............................ 267
20.1 Remote Welding Development . . . . . . . . . . . . . . . . . . . . . . . . . . . . . . . . . . . . . . . . . . . . . . 267
20.2 Thermal Cycling Tests on Coated Bearing Specimens ............................... 267
PART 6 . MOLTENSALT PROCESSING AND PREPARATION
21 . FLOWSHEETANALYSIS . . . . . . . . . . . . . . . . . . . . . . . . . . . . . . . . . . . . . . . . . . . . . . . . . . . . . 270
270 21.1 Proposed Reductive Extraction Processing Flowsheet for a Single-Fluid MSBR . . . . . . . . . . . . . . 21.2 Protactinium Removal from a Single-Fluid MSBR ................................. 272
Removal of Rare Earths from a Single-Fluid MSBR . . . . . . . . . . . . . . . . . . . . . . . . . . . . . . . . 21.4 Material Balance Calculations . . . . . . . . . . . . . . . . . . . . . . . . . . . . . . . . . . . . . . . . . . . . . . 275
21.4.1 MSBR Nuclear Data Compilation . . . . . . . . . . . . . . . . . . . . . . . . . . . . . . . . . . . . . . 275 21.4.2 MSBR Material Balance Calculations . . . . . . . . . . . . . . . . . . . . . . . . . . . . . . . . . . . . 275 21.4.3 MSBR Processing Plant Design Calculations . . . . . . . . . . . . . . . . . . . . . . . . . . . . . . . 277
21.3 273
22 . MEASUREMENT OF DISTRIBUTION COEFFICIENTS IN MOLTENSALT-METALSYSTEMS . . . . . . . . . . . . . . . . . . . . . . . . . . . . . . . . . . . . . . . . . . . . . 279
22.1 Extraction of Uranium. Zirconium. Protactinium. and Plutonium from Single-Fluid MSBR Fuels . . . . . . . . . . . . . . . . . . . . . . . . . . . . . . . . . . . . . . . . . . . . . . . . 279
22.2 Solubility of Protactinium in Bismuth .......................................... 282
Extraction of Thorium and Rare Earths from Single-Fluid MSBR Fuels . . . . . . . . . . . . . . . . . . . 22.4 Metal Transfer Process Studies . . . . . . . . . . . . . . . . . . . . . . . . . . . . . . . . . . . . . . . . . . . . . . 285
Effect of Other Components on the Solubility of Thorium in Bismuth . . . . . . . . . . . . . . . . . . .
22.3 284
22.5 287
c
23 . ENGINEERING DEVELOPMENT OF PROCESS OPERATIONS ........................... 288
23.1 Electrolytic Cell Development . . . . . . . . . . . . . . . . . . . . . . . . . . . . . . . . . . . . . . . . . . . . . . 288 23.1.1 Quartz Static Cell Experiments ....................................... 288 23.1.2 All-Metal Static Cell Experiment . . . . . . . . . . . . . . . . . . . . . . . . . . . . . . . . . . . . . . 291
23.2 Reductive Extraction Engineering Studies ...................................... 291
23.3 Simulated MoltenSalt-Liquid-Bismuth Contactor Studies ............................ 293
23.4 Design of a Continuous Electrolytic Cell Testing System ............................ 296
23.5 Experimental Facilities for Reductive Extraction Development Work ..................... 297 0
I

X
24. DISTILLATION OF MSRE FUEL CARRIER SALT .................................... 298
ORGANIZATIONCHART ....................................................... 301 . C
L

I
d t
W
The objective of the MoltenSalt Reactor Program is the development of nuclear reactors which use fluid fuels that are solutions of fmile and fertile materials in suitable carrier salts. The program is an outgrowth of the effort begun over 19 years ago in the Aircraft Nuclear Propulsion program to make a molten-salt reactor power plant for aircraft. A molten-salt reactor - the Aircraft Reactor Experiment - was operated at ORNL in 1954 as part of the ANP program.
Our major goal now is to achieve a thermal breeder reactor that will produce power at low cost while simul- taneously conserving and extending the nation's fuel resources. Fuel for this type of reactor would be 233UF4 dissolved in a salt that is a mixture of LiF and BeF2, but it could be started up with 235U or plu- tonium. The fertile material would be ThF4 dissolved in the same salt or in a separate blanket salt of similar composition. The technology being developed for the breeder is also applicable to high-performance converter reactors.
A major program activity is the operation of the MoltenSalt Reactor Experiment. This reactor was built to test the types of fuels and materials that would be used in thermal breeder and converter reactors and to provide experience with the operation and maintenance of a molten-salt reactor. The MSRE operates at 1200OF and at atmospheric pressure and produces about 8.0 Mw of heat. The initial fuel contained 0.9 mole % UF4, 5 mole % ZrF4, 29 mole % BeF2, and 65 mole % 'LiF, a mixture which has a melting point of 840'F. The uranium was about 33% U.
The fuel circulates through a reactor vessel and an external pump and heat exchange system. All this equip ment is constructed of Hastelloy N, a nickel-molybde- num-iron-chromium alloy with exceptional resistance to corrosion by molten fluorides and with high strength at high temperature. The reactor core contains an assem- bly of graphite moderator bars that are in direct con- tact with the fuel. The fuel salt does not wet the graphite and therefore does not enter the pores. Heat produced in the reactor is transferred to a coolant salt
Introduction
xi
in the primary heat exchanger, and the coolant salt is pumped through a radiator to dissipate the heat to the atmosphere.
Design of the MSRE started in the summer of 1960, and fabrication of equipment began early in 1962. Pre- nuclear testing was begun in August of 1964, and, fol- lowing some modifications, the reactor was taken criti- cal on June 1,1965.Zero-power experiments were com- pleted early in July. After additional modifications, maintenance, and sealing of the containment, operation at a power of 1 Mw began in January 1966.
At the 1-Mw power level, trouble was experienced with plugging of small ports in control valves in the off- gas system by heavy liquid and varnish-like organic materials. These materials are believed to be produced by radiation polymerization of a very small amount of oil that vaporizes after leaking through a gasketed seal into the tank of the fuel circulating pump. This diffi- culty was overcome by installing a specially designed fdter in the off-gas line.
Full power was reached in May 1966, and the plant was operated at full power for about six weeks. Then one of the radiator cooling blowers (which were left over from the ANP program) broke up from mechanical stress. While new blowers were being procured, an array of graphite and metal surveillance specimens was taken from the core and examined.
Power operation was resumed in October 1966 with one blower; then in November the second blower was installed, and full power was again attained. After a shutdown to remove salt that had accidentally gotten into an off-gas line, the MSRE was operated in Decem- ber and January at full power for 30 days without in- terruption. The next power run was begun later in January and was continued foi' 102 days, until termi- nated to remove a second set of graphite and metal specimens. An additional operating period of 46 days during the summer was interrupted for maintenance work on the sampler-enricher when the cable drive mechanism jammed.

xii
In September 1967, a run was begun which continued for six months, until terminated on schedule in March 1968. Power operation during this run had to be in- terrupted once when the reactor was taken to zero power to repair an electrical short in the sampler- enricher.
Completion of this six-month run brought to a close the first phase of MSRE operation, in which the objec- tive was to demonstrate on a small scale the attractive features and technical feasibility of these systems for civilian power reactors. We believe this objective has been achieved and that the MSRE has shown that molten-fluoride reactors can be operated at tempera- tures above 1200'F without corrosive attack on either the metal or graphite parts of the system, that the fuel is completely stable, that reactor equipment can operate satisfactorily at these conditions, that xenon can be removed rapidly from molten salts, and that, when necessary, the radioactive equipment can be repaired or replaced.
The second phase of MSRE operation began in August 1968, when a small facility in the MSRE building was used to remove the original uranium charge from the fuel salt by treatment with gaseous F2. In six days of fluorination, 219 kg of uranium was removed from the molten salt and loaded onto absorbers fded with sodium fluoride pellets. The decontamination and re- covery of the uranium were very good.
While the fuel was being processed, a charge of j3 U that had been made in the Savannah River reactors was converted to UF4-LiF enriching salt in ORNL's Tho- rium-Uranium Recycle Facility. The enriching salt was added to the original carrier salt, and in October 1969 the MSRE became the world's fmt reactor to operate on 233U. The nuclear characteristics with the 'j3U were close to the predictions, and, as expected, the re- actor was quite stable. One surprise was a considerable increase in the amount of gas entrained in the salt, which made the reactor power very noisy. A slight re-
.
duction in the pump speed eliminated the gas. We are 6.; investigating why the gas behavior was different after the fuel was processed.
A large part of the MoltenSalt Reactor Program is now being devoted to future molten-salt reactors. Con- ceptual design studies are being made of breeder reac- tors, and an increasing amount of work on materials, on the chemistry of fuel and coolant salts, and on proc- essing methods is included in the research and develop- ment program.
Until recently, most of our work on breeder reactors was aimed specifically at two-fluid systems in which graphite tubes would be used to separate uranium- bearing fuel salts from thorium-bearing fertile salts. We think attractive reactors of this type can be de- veloped, but several years of experience with a proto- type reactor would be required to prove that graphite can serve as piping while exposed to high fast-neutron irradiations. As a consequence, a one-fluid breeder was a long-sought goal.
About a year ago two developments established the feasibility of a one-fluid breeder. The first was demon- stration of the chemical steps in a process which uses liquid bismuth to extract protactinium and uranium selectively from a salt that also contains thorium. The second was the recognition that a fertile blanket can be obtained with a salt that contains uranium and thorium by reducing the graphite-to-fuel ratio in the outer part of the core. Our studies show that a onefluid two- region breeder can be built that has fuel utilization characteristics approaching those of our two-fluid de- signs and probably better economics. Since the graphite serves only as moderator, the one-fluid reactor is more nearly a scaleup of the MSRE.
These features caused us to change the emphasis of our breeder program from the two-fluid to the one-fluid breeder. Most of our design and the development effort are now directed to the one-fluid system.
. I
t
.
?
L,

i
I I
Summary
PART 1. MOLTEN-SALT REACTOR EXPERIMENT 2. Component Development The MSRE-type freeze flange undergoing thermal
cycle testing was inspected after 321 cycles. The crack observed first after 268 cycles had extended only slightly. Cycling was resumed.
The mark 2 fuel pump, which features a deeper bowl, began test operation with molten salt and accumulated a total of 4000 hr. The only difficulty was periodic plugging of the off-gas line with what' appeared to be frozen salt mist.
P
1. MSRE Operations
This report period covered the loading of 233U, zero-power experiments with the new fissile material, and the resumption of full-power operation.
Criticality was attained by melting UF4 -LiF eutectic salt containing 33.3 kg of uranium (91% 233U) into the carrier salt from which the original uranium had been stripped. The critical loading was only 1% less than predicted. Reactivity coefficients and control rod worth were also in acceptable agreement with predictions. Dynamics tests showed that the system was stable at all power levels, and the experimental transfer functions fitted the theoretical curves.
Shortly after the beginning of fuel-salt circulation, beryllium metal was exposed to the salt to increase the reducing power. At that time the amount of blanket gas entrained in the circulating fuel increased from less than 0.1 vol % to about 0.6 vol % and remained there. Various experiments were done in efforts to elucidate the effect of the beryllium. The entrained gas was practically eliminated from the fuel loop by operating the pump at slightly reduced speed.
During the approach to power, small perturbations were observed in the nuclear power and some other system variables. These were tentatively ascribed to gradual accumulation and sudden release of gas from somewhere in the core. The perturbations ceased when the circulating void fraction was reduced.
The fuel off-gas line partially plugged near the pump bowl during the zero-power experiments, and an accu- mulation of frozen salt mist was removed before the beginning of power operation.
Component performance was generally good, but a loose gear in the fuel-sampler drive mechanism caused a three-week shutdown in December, delaying the start of power operation. At the end of the period, fuel had been in the core continuously for 47 days, during which time the integrated power amounted to 747 equivalent full-power hours.
3. Instrumentation and Controls Daily tests of rod-scram relays turned up no more
failures. (Three of fifteen failed in the previous six months.) Two fission chamber failures occurred after nine months and one year of service respectively. The improvement over the three-month average life was attributed to improved sealing against water intrusion. Neutron chambers were installed in the drain tank cell for the "'U loading and were afterwards removed. Only minor modifications were made in the instru- mentation and controls.
A moderate number of minor failures occurred in the on-line digital computer. Numerous software changes were made in support of reactor operations and experiments. The conversational-mode calculational language FOCAL was adapted to the BR-340, making possible engineering calculations in the background time interspersed with the routine monitoring and computing operations of the computer.
4. MSRE Reactor Analysis
Nuclide changes and reactivity effects during ex- tended power operation with 13'U were computed using updated cross-section data. The computed distri- bution of fissions was 94% in ' U, 4% in ' 9Pu, and 2% in ' U at the beginning, with the 9Pu fissions slowly decreasing and the ' ' U fissions increasing with integrated power. The reactivity effect of long-term changes in nuclides (exclusive of uranium burnup) was computed to be -1.1 X lo-' 6k/k per megawatt-hour.
xiii

Analysis of rod-drop experiments gave a total worth of one control rod, near the minimum critical uranium loading, of 2.58 f 0.05% 6k/k. The uranium concentra- tie; coefficient of reactivity was inferred to be about 5% smaller than had been predicted. New rod- calibration curves for use in the on-line reactivity balance calculations were derived from the experiments.
A method for the calculation of time variations in reactivity corresponding to specified variations in the fission rate was developed and used to analyze some observed “blips” in the MSRE power level.
Theoretical analysis of the dynamic stability of the MSRE with 233U fuel was extended to obtain the power dependence of all the eigenvalues of the system mathematical mode. The dependence exhibited the expected tendency of the system to become more sluggish in returning to its original state at lower power levels.
PART 2. MSBR DESIGN AND DEVELOPMENT
5. Design
Design study of a 1000 Mw (electrical) MSBR power station was continued. The plant layout remains essen- tially the same except that the reactor cell diameter was increased to 66 ft to accommodate a larger reactor vessef. The cell wall construction was modified to provide double containment of the radioactive systems.
The size of zone I of the reactor core was increased to 14 ft diam X 13 ft high, and other dimensions were adjusted to reduce the damage neutron flux to assure a 4-year life for the core graphite and a 30-year life for the reflector graphite. The latter will then not require provisions for routine replacement.
The undermoderated region surrounding the most active portion of the core was redesigned to use 2-in. by 10-in. by 14-ft-long slabs of graphite rather than graphite spheres. This region contains 37% by volume of salt as in the previous concepts.
The reflector graphite was redesigned to make use of larger pieces and to assure a well-defined passage for flow of fuel salt to cool the reactor vessel wall. The fuel salt will flow radially inward from the wall annulus to cool the reflector graphite.
Axial reflectors were added at the top and bottom to improve the nuclear performance and to reduce the damage flux on the Hastelloy N vessel heads. The lifting rods used to remove the entire core assembly for graphite replacement are now removable to eliminate the poisoning effect during normal operation.
The top of the primary heat exchanger was modified to use L-shaped tubes and a vertical tube sheet. The
xiv
upper portion of the tubing contains a sine-wave bend to reduce the stresses due to thermal expansion. The heat exchanger design assumes use of tubing with a knurled groove to enhance the heat transfer on both inside and outside.
The removal of reactor afterheat has been analyzed in more detail. The normal method is to continue circu- lation of both the primary and secondary salts and to transfer the heat to the steam system. The fuel salt can be drained to a tank provided with cooling thimbles, and the residua1 heat due to deposited fission products in the core can be removed by circulating nitrogen with the fuel-salt pumps.
More detailed studies were completed on the tempera- ture distributions within the reactor. I t was found that the maximum core graphite temperature would be 130?F, occurring about 1 ft above midheight in the reactor. The maximum temperature in the radial re- flector graphite was found to be 1363°F. Vessel wall temperatures were also analyzed and found to be within acceptable limits.
The MSBR station cost estimates were revised to more nearly reflect 1969 costs. At a construction cost of about $160.00 per kilowatt and a production cost of 4 mills/kwhr, the MSBR compares favorably with our estimates of costs for water reactors.
Some conceptual design studies were begun for a molten-salt breeder experiment. The objectives pro- posed for the experiment can be accomplished with a reactor with a power in the range of 100 to 200 Mw (thermal).
6. Reactor Physics
Recent optimization studies of moltensalt breeder reactor configurations have been based on a figure of merit which places greater weight on fuel specific power than does the annual fuel yield. In addition, a limitation on the maximum fast-neutron flux in the graphite may now also be imposed as a constraint on the optimiza- tion.
Since the previous progress report, we have found that the core of the 1000 Mw (electrical) single-fluid MSBR can be enlarged so as to extend the useful life of the graphite from two to four years with only a slight penalty in breeding performance. Additional modifi- cations have been made to provide proper cooling of the reflector and to limit the fast-neutron flux in the reflector to a level that should not require replacement of the reflector during the life of the reactor. Finally, further detailing of the reactor design has resulted in other upward revisions in the estimated salt inventory. In all, the salt volume in our present MSBR configu-
bi
1
i
F
I
dr

I c
r
c
* 1
xv
ration is about 2% greater than reported previously. In the aggregate, these changes result in a reactor having a breeding ratio of 1.065, fissile material inventory of 1470 kg (including protactinium), annual fuel yield 3.34%, and a useful core life of four years at 0.8 plant factor.
A new analysis of the effect of thorium concentration on MSBR performance was carried out in terms of the new figure of merit and with careful adjustment of neutron cross sections to fit each case being considered. We find that 12 mole % of thorium in the salt is very nearly optimum in terms of breeding performance.
Improved digital computer codes for preparation of the neutron cross sections required in multigroup flux calculations and for carrying out multigroup two- dimensional neutron diffusion calculations have been put into use in the MSR program during the last several months. They have greatly facilitated the explicit two-dimensional calculations which are necessary to check the 2-D synthesis calculations used in the ROD optimization code and which are also employed in analysis of tentative configurations for a molten-salt breeder experiment.
Neutron transport codes have been adapted to calcu- late also the transport of gamma rays whose sources depend in part on the computed neutron fluxes. This computational tool allows one to calculate gamma heating in complex, multizoned reactor configurations without recourse to approximate buildup factor methods whose use is questionable in such configura- tions. The codes were used to obtain heating distri- butions in the MSBR.
Further analysis of possible configurations for a molten-salt breeder experiment shows that both the target maximum damage flux of 5 x 1 0 ' ~ neutrons cm-' sec-' (>SO kev) and an initial breeding ratio (with 233U fuel) greater than unity can be achieved with a reactor power less than 200 Mw (thermal). If one accepts a breeding ratio only slightly less than unity, the target damage flux can be achieved with a reactor power of 100 Mw (thermal).
The experiment to measure the spectrum-averaged values of a (the capture-to-fission cross-section ratio) for both "'U and 233U in the MSRE is progressing well, and has reached the point where comparisons between measured and calculated values can be made for the ' ' U samples. Tentatively, the agreement seem excellent, the measured value of E2 5 being about 3.5% lower than the calculated value based on the ENDF/B cross-section library. Though the experimental errors have not been fully assessed, this difference is about the same as the expected accuracy of the measurements. This level of accuracy in the measurement of a
contributes about 0.7% uncertainty in r ) for z35U, but would correspond to about 0.4% uncertainty in r ) for 2 3 3 ~
7. Systems and Components Development
Studies on the off-gas system were continued, and a
is presented. This tank provides about 1 hr holdup for all gases leaving the reactor and employs a circulating coolant which receives the solid fission products from an impaction separator and absorbs the energy from these and the decay of the noble gases. The system must reject a maximum of 18 Mw of decay heat.
Xe distribution calculations were extended to include the other noble-gas fission products, of which there are over 30 kryptons and xenons. The fluxes of these isotopes to the circulating gas bubbles, to the graphite, out of the reactor, and to the noble-gas removal system were calculated for conditions of the graphite coating and the noble-gas stripping system which yielded a I3'Xe poison fraction of 1.27 and 0.56%. The flux of the fission product gas to the graphite for the latter case was used to calculate the afterheat in the graphite after about two years of continuous operation at full power. Heat is released at the rate of 1 Mw 10 min after shutdown and has decayed to less than 0.15 Mw 10 hr later. An estimate was made of the distribution of about 21 Mw of decay heat in the off-gas system, including about 9 Mw of heat from the decay of noble metals.
Studies were started on a bubble generator that resembles an inverted venturi and consists of a teardiop inside a straight section of pipe. It was found that the primary mechanism for generating small bubbles is the use of the energy in the turbulent field in the diffuser. Coalescence of the small bubbles was found to increase as the void fraction in a water stream increased much above 0.1%; however, it was indicated that higher fluid velocities would inhibit coalescence, and this will be checked. A third set of vanes for the vortex type of in-line bubble separator was made as a scaled-up version of an earlier model used on another experiment and for which there was satisfactory performance. This model appears to confirm the earlier experience, but testing was just begun at the end of the period.
A request for directive for a molten-salt steam generator test stand was sent to the AEC for approval and authorization of expenditures. The test stand will have a capacity of 3 Mw and will consist of a molten-salt pump loop with a gas-fired heat source and a water-steam loop capable of operating at subcritical and supercritical pressures. The test stand will be used
preliminary design concept for the volume holdup tank ~
The '

xvi
to gain fundamental engineering data and to investigate ideas for generating steam with molten salt.
The sodium fluoroborate test. loop .was operated almost continuously from August 19, 1968, to November 4, 1968. During this period work was completed on pump cavitation tests, studies were continued on methods of controlling salt composition and on restrictions in the off-gas line, and initial tests were made with a cold finger to investigate cold-zone deposition of corrosion products. During November and December a test section was installed in the off-gas line at the pump bowl outlet to provide pressure and temperature profile data and to permit installation of various traps and filters. The loop was restarted on December 19, 1968, and circulation has continued without interruption through February 1969. Cumu- lative circulating time is 4600 hr, of which 3600 hr have been with the clean batch of salt. In general, the test work has produced no evidence of any problem which would preclude the use of NaBF4-NaF eutectic as a reactor coolant.
Results of the cavitation tests with the clean charge of salt appear consistent with the notion that cavitation inception for the PK-P pump operating with sodium fluoroborate can be correlated on the basis of net positive suction head and vapor pressure.
It was concluded that control of the fluoroborate salt composition at the eutectic point will be easy, provided a suitable method can be established for monitoring the salt composition. Four monitoring methods have been under consideration. Of these, the one with the most promise uses the partial pressure of BF3 over the salt, as indicated by the thermal conductivity of the off-gas stream, to calculate the salt composition.
The cause of gas-system restrictions was traced to accumulations of salt mist at the pump bowl off-gas nozzle and in the control valve. The test data indicate that the trouble can be eliminated by the use of a special hot trap at the pump bowl outlet and a highefficiency filter immediately downstream of the hot trap.
The conceptual layout of a primary-salt pump for the molten-salt breeder reactor has been further defined to consider the problems incurred by system thermal expansion, coupling the drive motor to the pump, pump containment requirements, and shaft seal oil leakage. The plan to obtain the participation of the United States pump industry in the MoltenSalt Breeder Experiment (MSBE) salt pump program is progressing. The specification for the MSBR primary-salt pump was revised in the light of project and pump manufacturer comments. An evaluation team was selected, and they
visited pump manufacturers to determine their interest and capabilitjes in the salt pump program. A request for proposal is being prepared for submittal to pump manufacturers. A request for directive based on pre- liminary design and cost estimates was prepared for the MSBE salt pump test stand, and a draft of the system
was initiated for a small pump for laboratory applica- tions. It will be designed for molten salt and liquid metal at temperatures to 1400°F, flow capacities to 30 gpm, and head capability to 300 ft.
We completed the fabrication and started the testing of the automated cutting and welding equipment based on the design developed by the Air Force and the North American Rockwell Corporation. Initial tests of the equipment were performed with a welding programmer loaned to us by the Air Force, and these tests, performed without benefit of operating experience or equipment debugging, gave very encouraging results. This is the first of tests to establish the feasibility of remote welding for molten-salt reactors. A detailed “Proposal for the Development of a Remote Control System for Cutting and Welding Radioactive Pipe and Vessels” was submitted to the Director, Division of Reactor Development and Technology. The program covers a five-year, $3,000,000 development program to adapt the orbital equipment to fully remote operation in high radiation fields. The equipment, once de- veloped, would have application for maintenance of most operating reactors.
e - s
design description was also prepared for it. Design*work I
8. MSBR Instrumentation and Controh
r f
The preliminary investigation of an overall plant control system of the single-fluid 1000 Mw (electrical) MSBR was completed. This investigation included, in addition to the studies previously reported, simulations of the reactor heat transfer, nuclear kinetics, and a reactivity control system. The secondary-salt flow rate was altered at a rate proportional to the error in steam temperature, as suggested by previous studies, to achieve closer control of steam temperature.
Several transient cases were run with this model, including step and ramp changes in power demand and reactivity and step loss of one secondary-salt coolant loop. Normally anticipated ramp changes in load demand resulted in less than 10°F temperature change at the turbine throttle. Large load changes such as a 50% loss of load, however, resulted in throttle tempera-
requirements were less than 0.075% Sk/k for the above cases with rates of about 0.003%/sec Sk/k. The results
P
ture variations of about 1 50°F. Control reactivity #

xvii
also indicate that for large load changes it may be necessary to vary primary-salt flow as well as secondary-salt flow to reduce the temperature varia- tions on the reactor and heat exchanger.
The calculation of the decay of neutron density in the MSBR following shutdown was extended to investigate the effects of the loss of all primary-salt flow. The curves included indicate the integral of reactor power for the first 5 min after flow interruption for various rates and amounts of negative reactivity insertion. The effect of delaying control rod action is also shown.
The effect of the photoneutron reaction from beryl- lium on neutron density following shutdown was calculated and found to be negligible.
A dynamic analysis of a steam generator for the MSBR was performed at O N . A more extensive analysis is being carried on under subcontract with the University of Illinois at the university's hybrid compu- tation facility.
Investigation of the stability of resistance ther- mometers to gross shifts in calibration under conditions of prolonged operation at high temperature with occasional wide variations in temperature was con- tinued. The testing of two sets of thermometers seemed to indicate that cycling between room temperature and 1500°F, the maximum rated temperature, or extended operation at 1500'F would stabilize the thermometers.
9. Heat Transfer and Thermophysical Properties
Heat Transfer. - Studies were continued with a proposed MSBR fuel salt (LiF-BeF2-ThF4-UF4, 67.5-20-12-0.5 mole %) using the pressurized flow system and a small-diameter resistance-heated Hastelloy N test section. In the recent experiments care was taken to minimize errors due to nonuniform heat loss, faulty thermocouple installation, and erratic readout, although there remained a possibility that the flow may have been affected by a repair weld near one end of the test section. Whereas wall temperature patterns in the laminar flow regime were consistent with the expecta- tion of fully developed flow beyond a rather well- defined entrance region, the patterns in the high transition and turbulent flow regimes continued to reveal irregularities indicative of a laminar-turbulent transition extending to the outlet of the test section. Variation in the heat flux by a factor of 10 produced no significant change in the relative amplitude of the irregularities in wall temperature. Comparison of ex- perimentally determined Nusselt moduli near the exit of the test section with those predicted by the accepted correlations indicated a dependence on Reynolds modulus which was greater than would be expected for
fully developed turbulent flow. A system identical geometrically (except for the weld repair) to that used in the MSBR fuel salt experiments was operated with the salt Hitec (KN03 -NaN02 -NaN03, 4449-7 mole %). Not only were the wall temperature patterns indicative of developed turbulent flow, but the Nusselt moduli agreed well with accepted correlations. The next phase in the experimental program will involve heat transfer measurements with the MSBR fuel salt in the same apparatus used for the experiments with Hitec.
Thermophysical Properties. - Preliminary thermal conductivity measurements in both the solid and liquid states have been made for a proposed MSBR fuel salt (LiFBeF2 -ThF4 -W4, 67.5-20-1 2-0.5 mole %), using the variable-gap apparatus. The conductivity of the solid decreased linearly from about 0.026 w cm-' ('C)-' at 290'C to about 0.014 w cm-' ('C)-' at the melting point, 480'C. The ratio of liquid to solid conductivity at the melting point was 0.84, in good agreement with data for other salt mixtures. Over the range of temperature from the melting point to 860°C, the thermal conductivity of the proposed MSBR fuel salt was found to lie between that of the MSRE fuel and coolant salts, displaying a maximum of 0.0138 w cm-' ('C)-' at about 650'C.
Despite the added difficulties in making conductivity measurements in the solid state and the associated sources of error, the measured thermal resistance displayed the same consistency as a function of gap width as observed for liquid samples and indeed yielded the same values for the fmed resistances associated, for example, with gas or surface corrosion films. Thus future experiments will include measurement of thermal conductivity in both solid and liquid states. Mass Transfer to Circulating Bubbles. - Design of the
facility for investigating mass transfer of oxygen (simu- lating ' Xe) from glycerol-water solutions (simulating molten salt) to helium has been completed, and construction is progressing. It has been decided to use the variable-area nozzle method under development by Kedl for bubble generation. Tests of a conical screen bubble separator are encouraging. A semiempirical dispersion criterion for bubbles in a turbulently flowing stream has been developed which relates bubble and' pipe sizes and liquid properties to the Reynolds modulus. Application of this criterion to the mass transfer experiment has delineated the range of Reynolds and Schmidt moduli for which fully dispersed bubble flow can be expected and has indicated that vertical orientation of the test section will probably be necessary to obtain meaningful data in the low Reynolds modulus range.

PART 3. CHEMISTRY
10. Chemistry of the MSRE
A material balance for fuel and flush salts was established from analytical chemical and physical property data for the entire period of MSRE operations with ” U fuel. The results, which were consistent with on-site estimates, were used as base-line data for U experiments. Generalized corrosion occurred rapidly at the beginning of 233U operations because of the presence of Fe2+ as a contaminant in the reconstituted fuel salt, but the corrosion was checked completely by adjustment of U*/ZU concentration during the early stages of these operations. Anomalous development of a larger void fraction than had been observed previously in the fuel salt was investigated by laboratory experi- ments intended to simulate partially the conditions in the MSRE fuel pump. Foam development, thought to be a signifkant factor, was not observed. In other experiments foam behavior in molten salts was studied in gIass apparatus with high-speed photography.
xviii
1 1. Fission Roduct Behavior
Additional results of postirradiation examination of the third surveillance specimen assembly confmed that local variation in graphite porosity significantly affects diffusion of activities through salt-graphite interfaces.
Programs were developed for calculation of fssion product inventories during ” U operation of the MSRE. Discovery that the Nb oxidation-reduction equilibrium provides a sensitive measure of the redox potential of the fuel salt identified its potential use as a corrosion indicator in molten-salt reactors.
Operation of the MSRE off-gas sampler-analyzer showed the presence of 1 to 3 glday of hydrocarbons in the stream. Mass spectrometric analysis of samples taken during power operations with 235U and ‘j3U showed appropriate response of xenon and krypton isotopic ratios to the fuel used.
Transport properties of fission products which “vola- tilize” from the surface of radioactive salt mixtures were studied in both hot-cell tests and via tracer experi- ments using chemical traps and probes. The aerosol particles produced were found to have average diam- eters of 4 to 20 A.
The chemistry of the noble metal fission product fluorides was investigated in laboratory experiments. The fluorides and oxyfluorides of niobium, molybde- num, and ruthenium were prepared and characterized. Their stabilities were determined using mass spectro- metric methods.
12. Physical Chemistry of Molten Salts
The solubilities and heats of solution of CeF3 in LiFBeF2 -ThF4 and LiF-ThF4 mixtures were deter- mined at 600 and 80OoC. Solubility of CeF3 was correlated with solvent composition and found to depend on the sum of BeF2 and ThF4 concentrations.
Zone melting and cyclic slow-cooling experiments were conducted with LiF-BeF2-ThF4 mixtures (72-16-12 and 57-33-10 mole % with 0.3 and 0.025 mole % CeF3 added). Behavior was consistent with published and recent phase studies of the solubility of CeF3 in the LiF-BeF2 -ThF4 system. Cyclic slow cooling provided equal or better thorium separation than zone melting, although appreciable separations were not obtained for thorium or cerium in the LiFBeF2-ThF4 (72-16-12 mole 76) mixture.
Studies of the equilibrium phase behavior in the system NaF-KFBF3 were continued. Liquid-liquid immiscibility in the systems LiF-KBF4, Li2BeF4-KI, and Li2BeF4-KBF4 was observed in accord with pre- diction. Composition-temperature relationships of the conjugate monotectic liquids were established. The crystal structure of the low-temperature form of KBF4 was determined from three-dimensional x-ray diffrac- tion data.
The solubility of thorium metal in molten LiF-ThF4 (73-27 mole %) at 62OoC was established as 0.1 mole %. Densities of molten MSR fuel and coolants were measured at their typical operating temperatures with heretofore unprecedented accuracy. The establishment of a program for the investigation of visible-ultraviolet absorption spectroscopy in molten fluorides was com- pleted, including the development of the diamond- windowed spectrophotometric cell which is unreactive to fluorides and the production of fluoride solvents and solutes of the purity required for spectroscopy.
The distribution of UM between molten LiF-BeF2- ThF4-UF4 and a (U,Th)02 solid solution was investi- gated for possible application to moltensalt reactor fuel reprocessing. The exchange process was found to be rapid and reversible.
Efforts were continued to develop an Ni-NiOBeO electrode as a reference electrode in molten fluorides. The results obtained were reproducible but were not in agreement with cell potentials calculated from available
W . -
c
I
. c
thermochemical data. Transference numbers were meas- ured in molten mixtures of LiF and BeF2. It was found that tLi+ = 1.0 k 0.05 in the range 0.3 <xBeF2 < 0.5, and possibly over the entire concentration range. The mobility of the beryllium ions is zero within experi- mental error. The suitability of molten potassium nitrate for use as a molten-salt conductance standard in
f
*

, XiX
i , " I
r
1
I
I
0 I .
cell-constant determinations has been demonstrated. The specific conductance is well represented (u = 0.0008) by the equation
K = -0.7098 + 4.6203
x 10-~t(Oc) - 2.0221 x 1 0 - 9 ~ .
As part of a continuing investigation of electrical conductivities in the molten LiF-BeF2 system, pre- liminary results are reported for the temperature dependence of pure molten beryllium fluoride over the range 530-685°C.
13. Chemistry of MoltenSalt Reactor Fuel Reprocessing Technology
Development chemistry for molten-salt reactor fuel reprocessing technology has been devoted to the reduc- tive extraction concept whereby constituents of the fuel are selectively extracted into molten bismuth containing either lithium or thorium as the reducing agent. The chemical feasibility of 233Pa isolation has been demonstrated by a process which also requires the prior reduction of uranium from the salt mixture and its subsequent oxidation into the salt effluent of a
3Pa extraction column. Recent studies have ex- amined the effects of metal additives to bismuth, and varied process applications to achieve improved rare- earth separations.
14. Development and Evaluation of Adytical Methods for Molten-Salt Reactors
The oxide content of the " U fuel in the MSRE was found to be 61 ppm, essentially identical to that of the 235U fuel. The oxide apparatus is expected to require major repairs shortly but will probably last through the MSRE operations. Three approaches were studied as possible methods for the determination of U(II1) in the radioactive MSRE fuel. Of these the total reducing power and hydrogen transpiration methods were found to be impractical for the analysis of the 233U fuel at t h i s time. A voltammetric method in which the poten- tial of a noble electrode poised by the U(Iv)/U(III) couple is measured vs the position of the U(Iv)+U(III) voltammetric wave .offers the possibility of more immediate measurements. The technique requires the insertion of three platinum electrodes in the salt. An apparatus has been designed that will permit the insertion of electrodes in MSRE fuel that is remelted in the original sampling ladle. Tests with simulated fuel have demonstrated that U(Iv)/U(III) ratios can be
maintained for several hours and that the frozen salt could be exposed to the atmosphere for periods necessary for hot-cell transfers without significant loss
The accuracy of the measurements was established in separate experiments in which MSRE-type melts con- taining U(IV)/U(III) in ratios from 7 to 140 were measured voltammetrically and potentiometrically vs an Ni/NiF reference. The melts were simultaneously sam- pled for a spectrophotometric determination of U(II1) concentrations. Satisfactory agreement was obtained between the voltammetric and spectrophotometric determinations. Also, the potentiometric measurements were in agreement with values calculated from reported values of free energies. Potentiometric measurements vs the Ni/NiF reference electrode are also reported for Be(II)/Be, Zr(Iv)/Zr, and corrosion product couples in LiFBeFZ -ZrF4 and for the Fe(II)/Fe and Fe(III)/Fe(II) couples in LiF-NaF-KF. A pronounced cathodic shift of the Fe(III)/Fe(II) couple in LiF-NaF-KF indicates a strong complexing of Fe(II1) by free fluoride in the melts.
It appears that the facility for the spectrophotometry of radioactive molten fluoride salts can be completed as scheduled. Delivery of the optical system has been scheduled for August. Three of the major salt-handling components, the optics furnace, its top assembly, and the transport container, have been fabricated and subjected to preliminary testing and modification. The sample loading furnace is almost completed. A hot cell has been decontaminated, and the necessary incell services are being designed. The successful sampling of fluoride melts for the determination of U(II1) by a technique similar to the one to be used in the hot cell confirmed the validity of the method designed for radioactive samples. These experiments also demon- strated the use of the absorption of U(IV) to determine the path length of melts in windowless cells.
Absorption spectra in molten Li2BeF4 are sum- marized for a variety of 3d transition-metal ions. All of these spectra, which include a representative of each configuration except 3d5, are consistent with ions situated in high symmetry, either octahedral or dis- torted octahedral. Cobalt(I1) maintains high symmetry even in melts enriched in BeF2.
Obselvations of wetting and nonwetting behavior of LiFBeF2 melts in various container materials were accumulated and analyzed. Conditions found necessary for wetting to occur include an electrically conductive container together with an active metal in contact with a melt containing one or more soluble species of the active metal. Sparingly soluble oxides did not cause wetting.
of U(II1).
I .
I

I
xx
Liquid contaminants in the HeBF3 cover gas of the circulating NaBF4 loop have been tentatively identified as hydrolysis products of BF3. An apparatus has been assembled to study these materials and to develop techniques for their removal from off-gas systems.
A variety of analytical techniques are being tested for the determination of traces of bismuth in MSRP salts. Presently, the detection limit for the iodide spectro- photometric method is 10 ppm. Emission spectro- graphic, polarographic stripping, and isotope exchange methods are being investigated for determinations at the 1-ppm level or lower.
PART 4. MOLTENSALT IRRADIATION EXPERIMENTS
15. MoltenSalt Convection Loop m the ORR
Wetting shdies indicated that very stringent gas purification measures will have to be used in future small-scale experiments, such as the in-pile thermal convection autoclave, if wetting by the salt and concomitant confusion of the experimental results are to be avoided. Titanium or uranium metal hot trapping at the points of entry of gas streams into the loop are indicated as minimum requirements.
PART 5. MATERIALS DEVELOPMENT
16. MSRE Surveillance Program
Several magnetic particles were removed from the MSRE pump bowl with a permanent magnet. These particles were mixtures of iron and nickel with trace amounts of chromium and molybdenum and ranged from 20 to <1 p in size.
17. Graphite Studies
Several new graphites were obtained for evaluation. These materials have been characterized by the meas- urement of several physical properties and have been included in other phases of our program. The tech- niques were developed for making several physical property measurements on graphite, including thermal conductivity, electrical resistivity, anisotropy by x-ray diffraction, and structure studies by transmission elec- tron microscopy. Several graphites have been irradiated to a fluence of 2.5 X I d 2 neutrons/cm2 e 5 0 kev) at 715OC. Dimensional measurements indicate that (1) the maximum density and the associated fluence are in- versely proportional to the original density, (2) the
crystallite growth rates at maximum density are de- W pendent only on the preferred orientation, and (3) grades H337, H364, and AXF show an initial delay t
before densifying and offer improved dimensional . stability.
Our graphite sealing studies have concentrated on
graphite substrates. Some sealed AXF samples were irradiated to a maximum fluence of 1.3 X I d 2 neutrons/cm2 e 5 0 kev). Although the permeabilities increased, one sample had a helium permeability of at least 1.7 X lo-' cm2/sec. Other samples have been sealed and are being irradiated.
c
optimizing the processing parameters for various P
18. Hastelloy N
Titanium and carbon additions improved the mechan- ical properties of a base alloy of Ni-12% Mo-7% Cr. Samples of Ni-1% Mo-7% Cr-0.05% C containing various amounts of titanium were aged for various times at 650 and 76OoC. Mechanical property tests showed that changes took place, but these changes were not sufficient to account for the variations noted over this temperature range during irradiation. Electron micros- copy revealed that the good properties were associated with a fine MC-type precipitate and that the poorer properties were noted at higher temperatures, where a coarse M2C-type carbide was formed. The MC-type carbide can be stabilized with higher concentrations of Ti, Hf, Nb, Zr, and Y, and postirradiation creep tests show that good properties result.
Our corrosion studies continued to affirm the excel- lent compatibility of Hastelloy N with the lithium- beryllium-fluoride salts. A loop constructed of type 304L stainless steel has a higher, but acceptable, corrosion rate and has operated for over six years without difficulty. Our propbsed coolant salt, sodium fluoroborate, is somewhat more aggressive, but our thermal convection loops indicate that acceptable cor- rosion rates are attainable when the water content of the salt is low. We have operated a pumped loop of Hastelloy N containing sodium fluoroborate for about 1500 hr. The salt composition has shown some erratic changes in metallic impurities, but operation has pro- ceeded without difficulty.
19. Support for Chemical Processing
Molybdenum and graphite seem compatible with fuel salts and with bismuth and are potentially useful construction materials for a chemical processing plant for MSBRs. The primary remaining problem is fabri-
r.
c
F
I

, .
! -
! i - I . -
xxi
cation, since both materials are difficult to join. Techniques have been developed for brazing both materials, but these joining materials may not be compatible with bismuth. We are also examining the possibility of coating iron-base alloys with molybdenum to prevent temperature-gradient mass transfer of the iron by the bismuth.
20. Support for Components Development Program
We have procured some of the equipment necessary for making welds in Hastelloy N by processes that are potentially useful for remote applications. Useful ex- perience has also been gained through the use of some automatic welding equipment that utilizes the MIG welding process.
Several plasma-sprayed bearing surfaces on Hastelloy N have received cursory evaluation. The coatings did not spall during thermal cycling, but several small flaws did develop.
PART 6. MOLTENSALT PROCESSING AND PREPARATION
21. Flowsheet Analysis
The proposed process flowsheet for a 1000 Mw (electrical) single-fluid MSBR includes a system for ' 'Pa isolation based on reductive extraction using
molten bismuth. The salt is processed at a rate equivalent to 1 reactor volume in three days. Calcula- tions using revised equilibrium distribution data show the system to be theoretically practical. The flowsheet also includes a system for rare-earth removal which processes the contents of the reactor on a 30-day cycle. Calculations indicate that a cascade of perhaps 24 stages will be necessary to effect rare-earth removal with bis- muth flow rates as high as IS gpm. An important vari- able in this calculation was the fraction of thorium elec- trolyzed from the salt as it passed through the electrolytic cell unit. A computer code has been developed to perform steady-state material balance calculations which describe the nuclear, chemical, and physical processes occurring in the fuel of an MSBR.
22. Measurement of Dmtriiution Coefficients in MoltenSalt-Metal Systems
Distribution of uranium, protactinium, plutonium, thorium, rare earths, and other fission products be- tween molten fluoride salts and liquid bismuth solu-
tions is being studied in support of a reductive extraction process for single-fluid MSBR fuels. Equi- librium data were obtained with a variety of LiF-BeF2 - ThF4 salts at 6OOOC. These data show that uranium and zirconium will coextract but that they should be easily separated from protactinium. Plutonium can probably be separated from protactinium if the reductant con- centration in the metal phase is very low. Protactinium should be easily separated from the rare earths and thorium; the Pa-Th separation factors were 2000 to 4400 with the salt compositions used. The rareearth- thorium separation will be much more difficult; separa- tion factors were in the range of 1.0 to 3.5. A metal transfer process is being evaluated as an alternative to reductive extraction for the rare-earth-thorium sepa- ration.
The mutual solubilities of nickel and thorium in bismuth were determined at 600'C. The results can be expressed as a mole fraction solubility product Krp = 6 . 2 ~ IO-'.
23. Engineering Development of Process Operations
Electrolytic cells will be required for operation of reductive extraction systems in an MSBR fuel process- ing plant. The cells will be used to oxidize materials in bismuth streams effluent from extraction contactors as well as for reducing lithium and thorium into bismuth streams which are fed to the contactors. Experiments have been carried out in quartz cells (4 in. OD) which used bismuth pools as the electrodes and 66-34 mole % LiF-BeF2 as the electrolyte. Current densities up to 4.5 amp/cm2 were observed. The current was linearly dependent on applied voltage, which suggests that there is essentially no limiting current in the range covered by the experiments. Corrosive conditions will exist in the vicinity of anodic surfaces, and it is planned that such surfaces be protected by a frozen salt layer. A small all-metal static cell has been installed for study of this method of operation.
Equipment has been installed for semicontinuous engineering experiments on reductive extraction. The equipment allows purification and countercurrent con- tact of up to IS liters each of molten salt and bismuth containing thorium through a 0.82-in.-ID, 2-ft-long column packed with 'h-in. right circular cylinders. Preliminary testing and degassing of the equipment has begun, and charging of bismuth and molten salt (72-16-12 mole % LiFBeF2-ThF4) will have been completed soon.
The hydrodynamic properties of contactors are being studied in simulated systems using water and mercury.

xxii
Quantitative measurements have been made of flooding rates, pressure drop, and dispersed phase (Hg) holdup. Information was also obtained on flow patterns and drop sizes. Four packing materials and one baffled cartridge have been studied in a 1-in.-ID column. A mathematical model describing the hydrodynamic aspects of a dispersed-flow column was developed.
A system is being built to allow the steady-state testing of a variety of electrolytic cell designs. Provision is made for circulating up to 0.5 gpm of bismuth and 0.25 gpm of salt through the cell containment vessel, for sampling the inlet and outlet streams from the cell, and for visually observing operation of the cell.
24. Distillation of MSRE Fuel Carrier Salt
An experimental molten-salt still is being installed at the MSRE for demonstrating low-pressure, high- temperature distillation of 48 liters of irradiated MSRE fuel carrier salt. Minor equipment modifications sug- gested by nonradioactive tests were made. A condensate sampler similar to equipment used for addition of * ’ U to the fuel drain tanks was built.
The still was tested by transferring 16 liters of nonradioactive salt into the system and distilling about 2 liters of this salt.
U . c
L
b
.

ent, Part 1. Molten-Salt Reactor F i ~ .y - c - rc- - - - P. N. Haubenreich
Loading of ' ' ' U into the MSRE commenced a few days after the beginning of the six-month period reported here. Part 1 of this report describes the critical experiment, the zero-power determinations of nuclear characteristics, and, fmally, operation at full power of the world's first ' '' U-fueled reactor. Results \are reported which show the adequacy of the nuclear data and the procedures used to predict the characteristics of the system with '"U. An experiment to measure accurately the capture-to-fission ratio of '''u in a molten-salt reactor neutron spectrum was in progress at the end of the report period. Results of dynamics tests showed the expected response and proved the system to be quite stable and easy to control, despite the very low
delayed neutron fraction of '"U. Beginning early in the '"U operation, the amount of gas entrained in the pump and circulating with the fuel was higher than ever before. Fuel chemistry in the aftermath of processing and its possible relation to the gas entrainment are discussed in Part 3 of this report. One effect of the higher gas content (up to 0.7 ~ 0 1 % ) was sporadic small perturbations in salt level and nuclear power. Analysis of the perturbations, described in Part 1, shows that their effects are too small to affect the operation or the life of the reactor, and the cause is probably related to the specific situation in the MSRE which permits gas to cling in the core. Development work directly related to the MSRE is also described in Part 1.
MSRE Operations P; N. Haubenreich
1.1 CHRONOLOGICAL ACCOUNT OF OPERATIONS AND MAINTENANCE
J. L. Crowley T. L. Hudson J. K. Franzreb A. I. Krakoviak R. H. Guymon R. B. Lindauer P. H. Harley M. Richardson
B. H. Webster
At the end of August 1968, the fuel salt had just been fluorinated to remove the 337enriched ' ' U that had fueled the reactor since the nuclear startup in June 1965, and reduction of the corrosion product fluorides was under way? After treatment with hydrogen and finely divided zirconium, the salt was passed through a
'MSR Pmgmrn Semiam Rogr. Rept. Aug. 31, 1968, ORNL4344, pp. 1-11.
fdter and returned to the reactor drain tanks on September 8. Samples showed acceptably low concen- trations of corrosion products, thus clearing the way for use of the carrier salt for the operation with * '' U. The principal reactor-associated activities for this report period are shown graphically in Fig. 1.1.
The amount of uranium (91% ' ' ' U) which had to be added to attain criticality at the reference condition ( 1200°F, rods fully withdrawn, no circulation) was predicted to be 33.9 kg. Equipment had been attached to drain tank 2 to permit addition of batches of enriching salt containing up to 7 kg of uranium. Three batches totaling 21 kg of uranium were added before the salt was pushed up into the fuel loop to determine the neutron multiplication. This was repeated after the addition of one more 7-kg batch. The fmal addition through the drain tanks waD 5 kg of uranium, bringing the total added to 32.9 kg. When the core was fded
1

2
after this addition, extrapolation of the subcritical multiplication indicated that only 0.35 kg more uranium was required. A capsule of enriching salt containing 96 g of uranium was added through the sampler-enricher to check out its operation and to refine the extrapolation to the critical loading. Then the salt was drained and secured in drain tank 1.
As long as uranium was being loaded into the drain tank, the drain-tank cell could not be sealed. Therefore, before the - reactor was taken critical, the loading equipment was removed from FD-2, the cell was sealed, and the containment was leak-tested at 20 psig. The critical experiment was then resumed, with uranium being added, 96 g at a time, through the sampler- enricher directly into the circulating fuel .salt. On October 2 criticality was attained after the addition of 33.29 kg of uranium, slightly less than had been predicted orianally . Capsule additions continued for the next 38 days, by which time a total of 27 capsules had been added and one control rod had been almost
fully inserted. Initial criticality had been attained after 4 capsules. After 6 capsules the reactor was critical with the fuel circulating. On October 8, after the addition of the tenth capsule, the reactor power was raised to 100 kw to observe the dynamics. This was the first time that a " ' U-fueled reactor had ever operated at significant power, and the occasion was marked by a ceremony including AEC Chairman Glenn Seaborg and Commis- sioner Wilfred Johnson, among others. Chairman Seaborg, who headed the team that had discovered ' ' U, was at the controls when the power was raised.
At his side was R. W. Stoughton, of the ORNL Chemistry Division, who with Seaborg and J. W. Cofman first identified ' 33 U on February 2,1942.
After each of the capsule additions subsequent to initial criticality, the critical control rod position and the rod sensitivity were measured with and without the fuel circulating. Two sets of rod-drop tests were done to obtain total rod worth. After the last addition the critical rod position was determined at temperatures
ORNL-OWG 69-5463
Q' r, s
4969 F
Fig. 1.1. MSRE operations, September 1968-February 1969.

3
from 1175 to 1225'F, with and without the fuel circulating.
The fuel was circulated for two months during the course of the uranium additions and reactivity meas- urements. (There was a one-day interruption when the fuel drained following an instrument power failure.) Throughout this period there was abundant evidence of an unusual amount of gas entrainment in the circulating fuel - about 0.5-0.7 vol % compared with <0.1 vol % during the years of operation with 235U. This was manifested most clearly as a change in pump-bowl level after start or stop of fuel circulation, but also showed up in the effects of pressure and fuel circulation on reactivity. A dependence of the core bubble fraction on fuel temperature showed up as a difference in the temperature coefficients of reactivity measured with the fuel circulating and with it stationary and practi- cally free of gas.
Examination of records of pump-bowl level showed that the increased amount of gas in the fuel loop had started rather suddenly on September 15, after about 16 hr of fuel circulation. Comparison of pressures on the two bubblers in the pump bowl showed that the density of the fluid several inches below the surface decreased by about 20% at the same time. Subsequently the transfer of salt into the overflow tank was abnor- mally high. These changes occurred 2 hr after the start of a 12-hr exposure of a be6llium rod in the pump bowl. (The 21 kg of uranium. that had been added to this point was practically all in the p state, and the beryllium was intended to reduce some to U* so as to provide a reducing environment to forestall corrosion.) The correlation of the gas changes with the exposure of beryllium metal was confirmed on October 13, when another beryllium rod was immersed in the pump bowl for 10 hr. During this interval the pump-bowl level and the reactivity showed the circulating bubble fraction changing erratically between 0.3 and 0.6 ~01%. The gas fraction remained high after the beryllium was re- moved, and the rate of transfer to the overflow tank was as high as 29 lb/hr. (It had gotten down to about 4 lb/hr before this second beryllium addition.) Also, during the following day, pressure drops began to show a restriction in the fuel off-gas line near the pump bowl. In order to investigate these phenomena, reactor opera- tion was continued, at very low power (about 50 w), for almost three weeks after the last uranium addition.
The nickel cages in which the beryllium rods were suspended in the fuel salt had come out with deposits of magnetic material that proved to be mixtures of iron, chromium, and nickel. This was taken to mean that the corrosion product fluorides had not been completely
reduced in the chemical processing and that some had been reduced by the beryllium. Magnets lowered into the pump bowl brought out samples of the magnetic powder, suggesting that the reduced metals tended to float in the pump bowl. Because it appeared that the reduction achieved by the first two beryllium rods was mainly of iron and chromium, a third rod was exposed on November 15 to reduce some p to Us. Again there were effects on the gas in the pump bowl and in the loop. A week later an experimental assembly of alternate short sections of beryllium rod and permanent magnets was exposed in a nickel cage. Examinations through the samplerenricher periscope after 5 min, 1 hr, and 6 hr showed only small amounts of metal powder on the assembly.
A shutdown had been scheduled before the beginning of sustained power operation, and on November 28 the fuel and coolant salts were drained. The original purpose was to mix the fuel salt in the loop and in the drain tank, which by now had different uranium concentrations as a result of the capsule additions. But the pressure drop across restriction in the off-gas line at the fuel-pump bowl had gradually increased to about 4 psi, so the reactor cell was opened, and the line was rodded out with a flexible tool designed to retrieve some of the plugging material. The deposit appeared to be mostly frozen salt mist. The coolant was drained, because for some months there had been indications of partial obstructions in the off-gas line from this system, presumably from oil residues, and heaters and an oil trap had been designed to be installed near the coolant pump. Cleanout of the coolant off-gas line revealed deposits ranging from tarry near the pump to light oil farther away.
On December 12 fuel circulation started for run 16. The intended approach to full power was delayed, however, because the analog input system for the on-line computer, which was needed for the dynamics tests, was not operating properly. After five days of operation at 10 kw while the computer problems were being worked on, the fuel sampler drive became inoperative. In order to gain access to the drive unit, it was necessary to drain the fuel and remove the shield blocks over the reactor. t
A temporary containment enclosure and shielding were set up, and the drive was lifted part way out of the sampler shield so repairs could be made. These con- sisted in cutting into the drive box and welding a loose gear to its shaft and then patching the containment box.
Before the reactor was started up again, control rod drive No. 3 was inspected and worked on. Although the

drop time for this rod was st i l l acceptable, it had crept up gradually over the previous several months. Analysis of acceleration and examination of the drive and the rod itself showed only a general increase in stiffness or drag. A small weight added to the drive produced quite satisfactory performance.
Maintenance was completed and nuclear operation was resumed on January 12. The first day was spent at very low power, confirming the earlier temperature coefficient measurement. Then the power was raised to 1 Mw, where it was held for dynamics tests, observation of nuclear heating, and fuel sampling. On January 17 the power was stepped up to 5 Mw.
With the beginning of 5-Mw operation, a new phenomenon was noted. This was the occurrence of small perturbations, at a frequency of 10 to 20 per hour, that affected the nuclear power, the fuel-pump level and pressure, and temperatures in the reactor outlet. The perturbations, or “blips,” were too small to be of immediate consequence, but intensive efforts were started to determine the mechanism (see Sect.
Analysis of the behavior of the several signals during typical blips indicated that the reactivity perturbations (about 0.01 to 0.02% 6k/k) were most probably caused by a temporary reduction in the amount of gas held up in the reactor core. Furthermore, examination of recorded data showed that a peculiar behavior of the salt level in the annulus of the reactor access nozzle which accompanied the reactivity perturbation had begun on September 15, when the gas fraction in the circulating salt had increased. Operation at 1, 3, and 5 Mw with sensitive instrumentation showed that the frequency with which the disturbances occurred and the amount of reactivity associated with them were independent of power. Further evidence that the blips were related to gas in the core came when a beryllium rod was exposed to the salt on January 24. For several hours while the beryllium was in, the gas fraction in the loop was ahout half what it had been and there were no blips. The gas and the blips came back after the beryllium was removed.
After the conclusion that the blips were not evidence of some potentially damaging situation, the reactor was taken to f d power of 8 Mw on January 28. Tests at this level showed, as they had at lower powers, that the dynamic response of the reactor system was quite close to predictions. The small delayed neutron fraction of 233U was more than offset by the longer neutron lifetime and larger negative temperature coefficient of reactivity with the more dilute fuel, making the system more strongly damped and giving a larger stability margin than in the
1 -3.k).
U operation.
4
bi After a total of nine days at full power, the power was reduced to 5 Mw to permit operation at lower fuel temperature without getting the coolant radiator below 1000’F. Variation of fuel temperature, pressure, and salt level showed slight effects on gas in the loop. The effect of these variables on blips seemed to be over- shadowed by a gradual decline in frequency and size.
Gas in the fuel loop is a result of injection of bubbles into the salt in the pump bowl by the jets from the xenon stripper. I t appeared therefore that the amount of gas could be drastically reduced by slowing down the pump to cut the velocity of the jets and the flow of salt into the pump suction. While a variable-frequency power supply for the fuel pump was being set up and checked out, a thermal convection experiment was run on February 12. The fuel pump was turned off, the reactor was taken critical, and the heat load was gradually increased by raising the radiator doors. The reactor was operated at various powers up to 350 kw and thermal convection circulation rates up to about 30 gpm, for a total of 6 hr. The nuclear power followed the heat load without control rod adjustment, and there were no blips. (The blip frequency with forced circu- lation and entrained gas just before the experiment had been around five per hour.)
After the thermal convection experiment, normal high-power operation was resumed and continued until the variable-frequency pump power supply could be put into service. This was ready on February 27. Starting at half speed, the pump was brought up in steps to full speed while the reactor was held at 10 kw to observe the noise in the nuclear power. At half speed, the salt level, the reactivity, and the neutron noise showed practically no bubbles in the loop. A rather sharp threshold occurred between 90 and 95% of full flow, where all indications showed bubbles appearing in the fuel loop. The power supply was dropped back to 50 cps (83% of full flow), and the power was raised to 7 Mw. For the next five days, operation continued at these conditions. The neutron noise (the small, random fluctuations in power) was far less than had been observed in j3 U operation, and there were no blips. The pump speed was then returned to normal, the bubbles and noise came back, and blips began to occur again. A discussion of t h i s and other evidence on the blips is given in Sect. 1.3.4.
At the end of February the reactor had been operating continuously for 47 days. A restriction had built up again in the fuel off-gas line at the pump bowl, becoming detectable on January 17 and gradually increasing until February 27, when it blew out with an 8-psi At’ across it. Partial restrictions, believed to be organics, appeared in the coolant off-gas line and at the
t - c
c
.
di
.

i *
*
8 s
f
I
! -
entrance to the main charcoal bed and were relieved by reactivity. We originally planned to measure the loss of application of heat. Otherwise there was nothing delayed neutrons due to circulation of the precursors, threatening a shutdown. but the high circulating void fraction and the attendant
“noise” that it produced in the neutron flux prevented inTable 1.1. a direct evaluation. However, indirect confirmation of
the validity of the calculated value was obtained from rod-drop measurements. The results of the various measurements, which are described below, are sum- marized in Table 1.2.
Operating statistics at the end of February are given
1.2 ” ’ U ZERO-POWER TESTS J. R. Engel
The program of zero-power tests with ’ ’ ’ U was very similar to that followed during the initial experiments with the ’ ’’ U fuel. The purpose was to fnst establish the critical fuel loading under the simplest attainable conditions and then measure the control rod worth and the temperature and fuelconcentration coefficients of
1.2.1 Critical Experiment
B. E. Prince J. R. Engel
Analysis of the critical experiment with ’ ’ ’ U was of interest as a check on the data and the procedures used
Table 1.1. Some MSRE Operating Statistics
’”u Operation, Total August 1968-Febnmy 1969 Through February 1969
Critical time, hr 1821 13,336 Integrated power, Mwhr 5994 78,435
Salt circulation, hr Equivalent full-power hours 74 7 9753
Fuel loop 2238 17,280 coolant loop 4469 21,375
Table 1.2. MSRE Nuclear Characteristics with ’ ’U Value
Calculated Observed property
Base-line critical concentrationp 15.30 15.15 grams of uranium per literb
Control rod worth, % Sk/k One rod 2.75 258 Three rods 7.01 6.9
Temperature coefficient of reactivity, -8.8 X loJc -8.5 X (6 k/kM0F -1.4 X loSe
Concentration coefficient of reactivity, 0.389 0.369 (6 k h / @ C/O
Change in Seff due to fuel circulation -1.005 X lo-’
=At 1200’F With fuel stationary and all control rods withdrawn to their upper
%raniurn of the isotopic composition of the material added during the critical experiment (91% 2 3 3 ~ .
CAssumes np gas in the fuel and the operating uranium concentration. The predicted temperature coefficient at the initial critical concentration was -9.4 X lo*.
limits.
dwith very little gas. with about 0.5 vol % gas circulating.

6
to predict the critical loading. This comparison was complicated and rendered more uncertain because the fuel carrier salt had been used for the ’ 3 5 U operation and contained many of the products formed during the frrst 72,000 Mwhr of reactor operation. The processing to recover the 2 3 5 U removed the uranium and those fssion products that form volatile fluorides, but practically all the plutonium and the rareearth fission products remained in the salt. In addition a heel of fuel salt was unavoidably left in the drain tanks when the main charge was transferred to the fuel storage tank to be processed for uranium recovery. All of these factors contribute to the uncertainty in predicting the critical loading.
The original theoretical calculations to predict the ’ U critical loading were performed in the Summer of 1967: A major application of the results was the specification of the amount of ’ U feed material that had to be prepared3 for the actual experiment. Although we were aware of many of the factors listed above, the reactor was still operating with ’ ” U, so we could only estimate their effects on the critical loading. These calculations led to a predicted critical concen- tration of 15.82 g/liter (uranium of the isotopic composition of the feed material). While this result provided an adequate basis for specifying material requirements, it could not be regarded as a “best effort” at predicting the critical concentration for the conditions that actually prevailed at the time of the experiment.
Some of the factors that affected the critical uranium concentration were not fully evaluated until after the critical experiment had been completed. When these data became available, we attempted to evaluate the corrections to the original calculations that we knew were required to make the conditions for the compu- tational model conform to the actual conditions at the time of the experiment. The most important of the necessary changes and updating were as follows:
1. In the original calculations, we had assumed that the operation with 235U would be terminated at approximately 60,000 Mwhr exposure. At the time of shutdown from MSRE run 14, the actual ex- posure was 72,440 Mwhr.
‘MSR Progrrrrn Semiann. Ron. Rept. Aug. 31, 1967,
3J. M. Chandler and S . E. Bolt, Reparation of EnrichingSalt ’Li-233UF4 for Refueling the Molten Salt Reactor, ORNL- 4371 (March 1969).
oRNL4191, p. 54.
2. In connection with item 1, the residues of plu- tonium and samarium remaining in the fuel salt had to be reevaluated.
3. For the earlier calculations the concentrations of the most important neutron-poisoning impurities, ‘ ~i in the salt and ‘OB in the graphite, were assumed equal to the concentrations at the start of operation with 235U. Hence corrections had to be introduced for the burnout of these nuclides.
4. The calculations had been based on the assumption that no residue, or heel, of uranium would remain in the reactor system after the transfer and processing of the fuel salt. From isotopic dilution measure- ments made in the course of the uranium additions, we concluded that 1.935 kg of uranium (isotopic assay: 32.97% ’ U, 66.23% ’ 38 U) from the first loading had been left in the drain tanks. This became a pak of the fuel salt when the uranium-free salt was returned from the storage tank for the start of the ’ U operation.
5. A special addition of 0.89 kg of depleted uranium was made in order to obtain the isotopic abundances necessary for the planned experiment to measure the capture-to-absorption cross-section ratio in U. This addition had not been considered in the earlier calculations.
6. Certain changes had been made in the evaluated library of cross-section data for the fissile isotopes since the earlier calculations were performed.
The above modifications were introduced into the theoretical model, and the associated changes in the multiplication constant, as well as the changes in uranium required to compensate for the multiplication changes, were evaluated. The results are summarized in Table 1.3. It is apparent that the largest single correc- tion is that associated with the uranium heel, but all the corrections are significant. Application of these correc- tions to the originally predicted value led to a revised prediction of 15.30 dliter. (Note that this value is applicable to stagnant salt at 1200’F with all three control rods withdrawn to their upper limits.) The observed loading was 15.15 g/hter, a discrepancy of only 1% in concentration or 0.4% in kefP
In addition to the effects listed in Table 1.3, there are two other reactivity effects that were not explicitly included in either the original calculation or the revised prediction. One of these is the negative reactivity contribution of the low-cross-section fission products remaining from the first fuel loading. The magnitude of this reactivity effect depends on the extent to which various fission products left the salt during the ” U
hi
.
I

7
- * ' . 1 -
i §
c
*
Table 1.3. Changesin Theoretical Calculation of 233U Critical Loading
Correction Reactivity Effect Uranium Equivalenp (% ah) (% AUlU
Isoto ic changes at 72,440 Mwhr 2 3 g h b +0.095 -0.243 l OB +0.379 -0.973 149sm+ l S l s m C +0.061 -0.156 %i +0.217 -0.558
Uranium heel +0.554 -1.424 235u
23SU -0.147 +0.376 Depleted uranium addition -0.102 +0.262 Cross-section changes +0.212 -0.545 Net +im -3.261
=Uranium with isotopic composition of enriching salt (91% 23321). aAssumes no removal during chemical processing. Wet change is positive since effect of dilution by the drain tank salt heel was
not accounted for in original calculations.
operation and also on any separation which may have occurred during fluorination to remove the uranium. The effect could be as large as -0.5% 6k/k if all these fission products remained in the salt. Since it is impossible to estimate the degree of retention realis- tically with currently available information, we did not include any poisoning for this class of fission products.
The second reactivity effect is that associated with the distortion of the moderator graphite due to neutron irradiation. Results of a detailed analysis of this phenomenon in the MSRE indicate that the reactivity effect at the time of the 233U loading was probably between -0.04 and +0.07% 6k/k. The spread in probable values results from variations in the observed distortion of individual specimens of grade CGB graphite (the material in the MSRE core) as a function of neutron exposure. Although the variations are small compared with the total dimensional change which occurs at high exposures, they represent a substantial fraction of the change associated with the neutron exposures experienced in the MSRE. Since the reac- tivity effect of this distortion is very small, it was neglected in the evaluation of the critical experiment.
1.2.2 Control Rod Caliiration
J. R. Engel
After the achievement of criticality, more uranium was added to the fuel loop to build up the excess reactivity required for routine power operation of the reactor. Measurements were made after the addition of
each capsule of fuel to provide data on the reactivity worth of the control rods. We planned to add enough excess reactivity to the loop to permit calibration of one control rod over its entire range of travel. The scheduled loop drain at the end of the calibration (to homogenize the entire fuel charge) would then produce a fissile concentration with the desired reactivity worth - just sufficient for the proposed 'j3U burnup experiment. The unscheduled drain after the addition of the 18th enriching capsule produced some enhance- ment of the uranium concentration in the drain tank prior to the scheduled event. Consequently, the cali- bration was stopped before the control rod was fully inserted in order to limit the final concentration to the prescribed value.
The differential worth of one control rod was measured as a function of its position and the positions of the other two rods using the classic rod-bump- period technique. These measurements were made both with the fuel salt stagnant and with the normal circulation rate. In addition, two series of rod-drop experiments were performed during the uranium load- ing to obtain integral-worth values. Each series con- sisted in dropping the rods singly, in pairs, and as a group, also with the salt stagnant and circulating.
In contrast to the original measurements with the 'j5u fuel, the differential worth measurements pro- duced relatively scattered results. A potentially strong contributor to this scatter is the increasing uncertainty in the exact control rod position as a result of wear in the drive mechanism (a problem similar to that en-
8
countered in the dynamics tests). Since the rod travel required to establish a given stable reactor period was much smaller with 233U than with 235U, th is uncer- tainty has ' a greater effect on the results. Another potential source of scatter is minor variations in the core void fraction during individual period runs. In several cases abrupt changes in the "stable" period were observed, but the cause could not be identified. As a consequence of the general scatter in the period measurements, the rod-drop measurements were relied upon for most of the calibration data. A detailed discussion of the evaluation of the control rod calibra- tion is presented in Sect. 4 of this report. The fmal results are included in Table 1.2.
1.2.3 Temperature Coeffxient of Reactivity
C. H. Gabbard
A temperature coefficient of reactivity was measured three times with "'U fuel, each time by slowly changing the temperature of the entire system and observing the control rod position required for criti- cality at several points from 1175 to 1225°F. There was considerable variation among the values found in these experiments, and they were generally smaller than the theoretical value. These differences can be attributed to the presence of gas in the core, whose steady-state volume depends on temperature and circulation rate.
The first measurements were made in November, near the end of the initial low-power run. The fuel pump was operated to circulate the salt while the salt and graphite temperatures were being changed and leveled off. Then the pump was turned off to allow gas bubbles that were circulating with the salt to agglomerate and float up out of the core. Data on critical rod position and tempera- tures were logged on the computer and manually, both with the pump running and after it had been off for 15 min, at each of nine temperatures. Temperature coeffi- cients were computed by plotting rod effects vs temperature. The points with the pump off fell very close to a straight line with a slope of -7.75 X IO-' (Sk/k)/"F. The points with the fuel circulating were more scattered but gave a distinctly different slope: -6.9 X lo" (Gk/k)/"F. The difference was not unexpected, since we knew there was an appreciable amount of entrained cover gas circulating with the salt, and past experience had shown the circulating void fraction increasing with decreasing temperature? Thus
4MSR Pmgmm Semiann h g r . Rept. Feb. 29, 1%8, ORNL4254, p. 5.
the fluid density change due to the dependence of gas entrainment on temperature would tend to offset the salt density change with temperature, reducing the magnitude of the reactivity effect of slowly varying temperature. But even the value with the pump off was significantly less than that predicted on the basis of no gas in the salt. Therefore the series of measurements was repeated with great care in January, immediately after the start of run 17. The results with the pump off were practically the same as before, but with circulation the measured value was -7.4 X lo-' (Gk/k)/OF. The inference was that the variation of the void effect (bubble fraction) with temperature had changed.
After the variable-frequency power supply was put in service and the loop bubble fraction was observed to be very low at reduced fuel circulation rates, the tempera- turecoefficient measurement was repeated. With the pump running at reduced speed and practically no bubbles circulating with the salt, the data gave a value of -8.5 X (Sk/k)/"F. This higher value suggests that the effects of gas had not been completely eliminated in the earlier experiment by simply stopping the pump. That is, a varying amount of gas remained in the core long after the pump was turned off. Direct evidence of gas remaining in the core was an observed effect of pressure on reactivity after 12'4 hr of naturalconvection circulation and an observation made when the fuel pump was fitst started at reduced speed. Prior to the latter observation the fuel had been circulating at the normal rate with a void fraction of about 0.5 vol %. The pump was stopped for 1.5 hr while the power supply was changed. Although the salt level showed that most of the bubbles floated out of the loop while the pump was off, when it was restarted at half speed there was a level decrease, indicating further densification of the loop fluid.
The predicted value of isothermal temperature coefficient of reactivity was -8.8 X lo* (Gk/k)/"F at operating fuel concentration (-9.4 X io-' at critical concentration). The only directly comparable observed value is the one measured with no circulating gas, and it is only 3.4% smaller. This value, -8.5 X lo-' (Sk/k)/"F, is used in the reactivity balance to compute effects of overall temperature shifts when the reactor is being operated with a very low void fraction. When the pump is operated at full speed, with a void fraction around 0.5 vol %, the reactivity balance uses -7.4 X lo-' (Gk/k)/'F.
The individual contributions of the fuel and the graphite to the overall temperature coefficient were not measured experimentally, but separate values are needed in analyses of rapid transients. In view of the
U
2. .
z
S
1
LJ

9
W 1.
- t
:
L *
.
C
* t
W
close agreement between the overall coefficient ob- served with no gas and the predicted isothermal coefficient, the predicted graphite temperature coeffi- cient, 3.2 X 10" (Gk/k)/"F, is presumed to be accurate enough. For rapid changes in temperature, where the number of moles of gas circulating with the salt has no time to change, the calculated effect of the gas on the fuel temperature coefficient is very slight, about -0.05 X lo-' (Gk/k)/'F change for 0.5 vol % gas? Therefore the fuel coefficient for dynamic analyses is taken to be 4 8 . 5 - 3.2) X lo-' (Gk/k)/OF.
1.2.4 Concentration Coefficient of Reactivity
J. R. Engel
Data were collected on the variation of the critical control rod configuration with uranium concentration throughout the addition of excess uranium for the control rod calibration. These data were reduced, with the aid of the final rod calibration, to a concentration coefficient of reactivity for uranium of the isotopic composition of the enriching material (91% '' U). The value observed near the initial critical concentration was 0.369 (Sk/k)/(SC/C).
1.3 OPERATIONS ANALYSIS
Startup of the MSRE with ' U fuel did not require modification of the equipment and operating pro- cedures that had been used throughout the years of operation with ' U. Because of the different nuclear characteristics and critical loading of the new fissile material, however, the dynamic characteristics of the reactor system were expected to be different. Con- siderable effort was devoted, therefore, to testing and analyzing this aspect of the operation. There was also keen interest in the radiation heating and reactivity behavior, since the fission product yields and neutron fluxes were changed. In addition, there were the possible aftereffects of the salt processing to be watched for. I t turned out that there were in fact some changes, notably the behavior of gas in the fuel system. Analyses of these subjects are described in this section.
1.3.1 System Dynamics
R. C. Steffy
One of the most obvious differences between opera- tion with U and with ' s U is the smaller fraction of delayed neutrons with the "'U. In fact, when the fuel is circulating, the effective fraction is only 0.0019, about a third of what it had been with ' jSU and the
smallest of any reactor. But the transient response and the stability of the system are affected by many other parameters as well, and the lighter fuel loading with 233U produced a larger temperature coefficient of reactivity and a longer neutron lifetime. The combined effect of the changes was calculated, and the system was predicted to be stable and not difficult to control? During the very-low-power operation with 2 3 3 ~ ,
dynamics tests designed to determine the neutron level to reactivity transfer function were performed both with the fuel circulating and stationary. Then during the approach to full power, tests were performed at 1, 5 , and 8 Mw. The results of these tests showed that the dynamic behavior of the 233U-fueled MSRE was in good agreement with the theoretical predictions.
Tests were performed using pulse, step, pseu- dorandom binary, and pseudorandom ternary test patterns. However, the small signal strength inherent in the aperiodic signals (pulse and step) was masked by the high level of neutron noise induced by the circulating bubbles (see Sect. 1.3.3) and made results of these tests unusable. Analysis of the data from the pseudorandom ternary tests was not completed by the end of this report period, but the pseudorandom binary tests gave good results.
The initial testing technique which we employed to implement the pseudorandom test patterns was the fluxdemand technique, a method whereby the flux is forced to follow the test pattern, as opposed to the conventional method of forcing the control rod to follow the test pattern. Although this technique appeared to offer some advantages,' it did not work very well because of an equipment limitation. The natural fluctuations of the flux signal caused the servo to have to move the control rod continually in trying to force the flux to follow a particular test pattern. During this rapid movement the gear-driven indicators were not capable of reporting the exact position of the end of the chain-driven flexible hose on which the poison elements are strung. This loose coupling between indicated and actual control rod position introduced a significant amount of error in the calculation of the input reactivity. An example of results obtained from one of these tests is shown in Fig. 1.2. The scatter in the data is obviously excessive, although it falls around the theoretical predictions.
'P. N. Haubenreich et d, MSRE Design and Operations Report. Part HI. Nuclear Analysis, ORNL-TM-730, p. 189 (February 1964).
6hlSR h g r a m Semiann Progr. Rept. Aug. 31, 1968,
'Ibid. pp. 14-18. ORNL4344, pp. 46-52.

ORNL-OWG 69-5464
FREQUENCY Irodions,!sec)
Fig. 12. Frequency-Response Plots for the 233U-Fueled MSRE at 8 Mw - Cornpadson of Theoretical Rediction with Experimental Results Obtained Using Flux-Demand Technique. (a) Magnitude ratio, (b) phase angle.
To circumvent this error from the control rod indicators, it was necessary to revert to a form of the more conventional method of direct control rod manipulation. In order to get repeatable rod position- ing, which is necessary for a pseudorandom binary or ternary test, the flux signal going to the control rod servo system was disconnected, and a voltage propor- tional to the rod position was inserted. The normal demand part of the servo circuit was also disconnected and fed with a voltage equivalent in magnitude but opposite in sign to the steady-state rod signal. Super- imposed on the steady-state demand signal was a voltage which followed the desired test pattern. This improved the quality of the indicated control rod position for two reasons. First, the rod was typically moved about 0.3 in. and then was not disturbed again until the next pulse was due (pulse width varied between 3 and 5 sec, depending upon the particular test). This eliminated both the small jerks and the continuous rod movement. Second, for a pseudoran- dom binary test, a withdrawal was always followed by an equal-in-magnitude insert and vice versa. This tended to eliminate the accumulation of uncorrectable errors which occcur when the inserts and withdraws are random with respect to each other. When an insert always follows a withdraw and a withdraw always
follows an insert, the indicated rod position still may Li not be the same as the actual rod position, but the discrepancy is a constant, and the error thus induced in the fmal results may be corrected by applying a constant scale factor.
Results of tests performed at 8 Mw using this "rod-demand" technique are shown in Fig. 1.3. The experimentally determined magnitude ratio, l(6N/N0)/(6k/k& has been normalized to agree with the theoretical curves at 0.45 radianlsec. Scatter in the results is obviously much less than was present in the flux-demand tests.
The dip in the theoretical prediction of the magnitude ratio at -0.25 radianlsec is an effect of the loop circulation, which has a transit time of about 25 sec. The dip shows up in the experimental results, but it is not as pronounced as predicted. This implies that the theoretical model does not allow for enough mixing of the salt in the external loop. Work was started on improving the model so as,to give a better approxi- mation to the physical conditions. This should also improve the relation between the experimental and the theoretical phase angle at the higher frequencies.
90
60
- E30
E o
- w v)
a
- 30
-60 40-2 4 6 ' 400
FREQUENCY (rodionslrec)
.. t
I
Fig. 1.3. Frequency-Response Plots for the z33U-Fueled MSRE at 8 Mw - Comparison of Theoretical Prediction with Experimental Results Obtained Using Rod-Demand Technique. (a) Magnitude ratio (normalized to agree with theory at 0.45 radsec), (b) phase angle. i
f c
..

In summary, the results of the dynamic testing of the U-fueled MSRE showed that the dynamic response
of the reactor is very close to the theoretical pre- dictions. Equipment limitations required that the test results be normalized, but testing methods were being improved, with the goal of eliminating t h i s step.
1.3.2 Cas in the Fuel Salt
A. Houtzeel J. R. Engel One of the most prominent differences between the
operation in this report period and earlier operation is the change in the volume fraction of helium bubbles circulating with the fuel salt. Throughout nearly all of the operation up to September 1969, the circulating void fraction was much less than 0.1 vol % (ref. 8). Void fractions as high as -0.2 vol % were achieved, but only for short times during special tests to study the effects of voids on other reactor parameters. Beginning 16 hr after the start of fuel circulation during the U critical experiment, the void fraction has been 0.5 to 0.7 vol $6 whenever the fuel is circulating at the normal rate. The basic reason for the change has not yet been positively identified, although the characteristics and effects of the change have been examined in consider- able detail.
The existence of circulating voids is reflected in many of the reactor operating parameters, some of which provide a quantitative measure of the total voids in the fuel loop while others are only relative or qualitative indicators. The most direct indication of voids in the circulating loop is the inventory of salt in the pump bowl, as indicated by the bubbler level elements. If the reactor is critical, another indication is obtained from the reactivity effect of the voids in the core, provided the indication is not obscured by other reactivity changes. Cross correlation of the noise in the neutron- flux and pressure signals can also be translated into an absolute void fraction. However, the absolute calibra- tion required for this approach was not completed during t h i s report period, so only relative changes in void fraction can be reported at present. The salt level in the annulus of the reactor access nozzle, as indicated by the temperature distribution, is a qualitative indi- cator of circulating voids. This level decreases when circulating voids transport helium to the annulus and rises when bubble-free salt dissolves gas and carries it out? The xenon poisoning in the reactor also provides
'MSR h g r a m Semiann. Rogr. Rept. Aug. 31, 1968,
9M3R Program Semiann h g r , Rept. Feb. 29, 1968, ORNL4344, pp. 18-19.
ORNL-4254, pp. 7-9.
11
some information on circulating voids, but the interpre- tation is complicated by the reactivity effect of the voids themselves and by the nature of the dependence of xenon poisoning on voids. So far, in the 233U operation, we have used only the pump-bowl level elements for absolute evaluation of the circulating void fractions.
Description of Bubbler Level Elements. - The level indicators in the fuel pump measure the pressure differentials between a reference line and bubbler tubes submerged in the salt. There are two bubbler tubes, one extending 1.626 in. below the center line of the volute and the other 1.874 in. deeper. The gas flow is 0.15 literlmin STP through the reference line and 0.37 literlmin STP through each of the bubblers. The differential pressures are converted into equivatent depths of salt assuming a salt density of 140 lb/ft3. The range of the indicators is 10 in. of salt of this density, and readout is in percent (1% = 0.1 in.). In addition, the output of the differential pressure cell on the higher bubbler is biased by 1%; so if there were no deviation of the salt density from the assumed value, the two level indicators should read the same. Measured Void Fractions. - The best measure of
circulating void fraction is obtained by observing the changes in pump-bowl level when the fuel pump is first started after a loop fill, when the salt is free of bubbles. When fuel circulation was first started in run 15 (September 14), the level changes in the fuel-pump bowl were very similar to starts in earlier when there were almost no circulating voids; that is, the level dropped about 8% as soon as the pump was started and remained there. (This 8% level drop is due to the accumulation of salt in the central part of the pump housing and the spray ring.) The pump was stopped and restarted twice in the first 14 hr, with identical results. Then the beryllium rod was exposed in the pump bowl. All normal-speed pump starts thereafter were different. Each time after the start the level dropped 10 to 15% but then gradually rose. This gradual level rise (in general between 8 and 12% within 30 min) reflected a gradual buildup of gas in the salt loop. A level rise of 8 to 12% is equivalent to displacement of 0.35 to 0.50 ft3 of salt from the circulating loop by gas, corresponding to a circulating void fraction of 0.5 to 0.7 ~01%.
The operation of the fuel pump with a variable- frequency power supply near the end of the report period allowed us to make a preliminary evaluation of the circulating void fraction as a function of pump speed. (Salt flow rates, both in the main loop and through the pump bowl, are directly proportional to pump speed.) With the fuel pump operating at speeds below about loo0 rpm, all evidence indicated that the

12
circulating void fraction was practically zero. In fact, when the pump was fmt started at around 530 rpm (nominal 30-Hz power supply), the fuel-pump level decreased about 2% after the initial starting twsient. This indicated removal, from the loop, of voids that had not floated out during the 1.3-hr period while the pump was off to connect it to the variable-frequency gen- erator. Figure 1.4 shows the sharp dependence of circulating void fraction on the pump speed above lo00 rpm. The probable reason for the rather sharp threshold will be discussed later. (The points are actually calcu- lated relative to the condition at 530 rpm, where the void fraction was assumed to be zero.)
Prior to the pump-speed experiment, we had attempted to determine the variation of the circulating void fraction with other system parametem. With the fuel pump running at full speed and the reactor power at 5 Mw, we varied the fuel-system temperature and pressure and the pump-bowl salt level over ranges that had changed the void fraction by a factor of 7 during operation with the 235U fuel salt." Some changes were noted, but cross correlation of noise data from the neutron-flux and system-pressure signals indicated that the void fraction changed by no more than a factor of 2. The fact that the void fraction started around 0.5 to 0.7 vol %, compared with around 0.1 vol % in the earlier experiments, may account for the smaller frac- tional change.
Changes During Beryllium Additions. - Between the start of the 233U operation and the end of this reporting period, five beryllium additions were made to the fuel salt by exposing a beryllium rod in a nickel cage in the pump bowl. Each time there were observ- able effects on the circulating void fraction, but the behavior was not the same in each case.
As mentioned before, the fuel had been circulating normally with practically no bubbles for 14 hr when the first beryllium rod was lowered into the pump bowl. After about 2 hr the level in the pump started to rise, and frDm later observations it is evident that the rise was due to a buildup of gas bubbles in the loop, something we had never observed before. The increased void fraction persisted after the beryllium rod was removed. (Another effect was that the transfer rate of salt to the overflow tank increased drastically; see Sect. 1.3.5.)
The exposure of the second beryllium rod was made on October 13, four weeks after the first addition, with
'OD. N. Fry, R. C. Kryter, and J. C. Robinson, Measurement of Helium Void Fraction in the MSRE Fuel Salt Using Neutron-Noise Annlysis. ORNL-TM-2315 (Aug. 21,1968).
0.6
0.5
c 0.4
V
LL a a
5 0.3 f G
u $ o.2
n ., 0 200 400 600 800 4000 4200
FUEL PUMP SPEED (rprn)
Fig. 1.4. Effect of Fuel Pump Speed on Circulating Void Fraction.
W
the reactor critical at low power and on flux servo control. The mentioned effects of the first beryllium addition st i l l persisted to some degree. The insertion of this second rod caused some very erratic and un- expected level changes in the pump bowl (see Fig. 1 S), which started almost immediately after the beryllium was lowered into the pump bowl. The spontaneous level changes in the fuel-pump bowl were as large as 1 in. (or 10% on the level indicators), which represents about 0.42 ft3 of salt (0.6 vol % in the loop). Obviously this salt moved from the salt loop into the fuel-pump bowl and back. Once started, the time required for a level change was 20 to 30 min. At the same times that the level changed, the control rod was moved by the servo control to compensate for spontaneous changes in reactivity of the reactor. The level decreases occurred simultaneously with insertions of the control rod and, conversely, level increases with rod withdrawals. It was concluded that these level fluctuations reflected a varying gas-bubble fraction in the circulating salt, because all other system variables appeared to be constant.
For the third beryllium addition, on November 15, it was decided to operate the fuel pump at a lower-than- normal level to minimize the risk of plugging the off-gas line with foam if the level oscillations occurred again. In contrast to the second beryllium addition, this time it took approximately 2'4 hr after the capsule was inserted before anything happened. Then, very slowly, the level decreased about 7%. Simultaneously the
L
- dl
1

ORNL-DWG 69-4856
OCTOBER (3,1968 OCTOBER (4, (968
TIME 1730 1830 1930 2130 2230 2330 I oo30 01% 0230
c. w
Fig. 1.5. Indicated Salt Level in Fuel Pump During Beryllium Exposure on October 13, 1968. i

14
reactor servo control inserted the control rod 0.9 in. Before the spontaneous level decrease stabilized, the beryllium capsule was taken out temporarily because of concern over operation at this abnormally low level. The reactor system responded almost immediately to the withdrawal. Within 15 min the level came back to its original value, and the control rod was withdrawn to its old position. flhe time for these level changes was only 15 to 20 min, remarkably short since it takes about 9 min to process one loop volume through the pump bowl. This implies that the mechanism which governs the removal of introduction of gas bubbles operates with a very high efficiency.) After due consideration the beryllium capsule was inserted for the second time; both the reactivity and the pump level again responded as before. After about 1 hr the level was down 8%, and the control rod had been inserted 1.7 in. S ine the effects had not yet leveled out and the level in the fuel-pump bowl was uncomfortably low, it was decided to remove the beryllium capsule again and raise the pump level about 5% by transferring salt from the overflow tank into the pump bowl. Then, for the third time, the same beryllium capsule was lowered into the pump bowl; again the level and control rod came down. This time the system was allowed to level off; the control rod was inserted 2.0 in. by the servo control, and the salt level in the pump bowl stabitized after a drop of 8.5%. (At the same time the difference between the readings of the level indicators also decreased. The significance of this change is discussed later.) When the capsule was fmally taken out, the level came up 6%, and the control rod was withdrawn about 2.0 in.
The fourth beryllium addition was different in that there was less beryllium, and it was in the form of short cylinders between short high-temperature magnets. The effects of this addition were detectable but were very mild in comparison with earlier additions.
The fifth beryllium addition took place on January 24 with the reactor at 5 Mw. The power resulted h some “secondary” effects which actually strengthened the idea that the presence of bubbles in the system is strongly related to some of the unexpected events during and after the beryllium additions. As is described in Sect. 1.3.4, power blips were occurring during this time. These blips ceased once the beryllium capsule was lowered into the pump; the linear power trace became smooth. The blips came back after the beryllium was removed. All other effects, such as level and control rod position changes, were similar to those in previous beryllium additions.
Related PumpBowl Observations. - Aside from the direct evaluation of the circulating void fraction, we
used the indications of the fuel-pump bubblers to extract information about the void fraction and the apparent physical salt level in the pump bowl itself.
We observed that after the first beryllium addition the difference between the readings of the two bubbler level indicators became much larger whenever the salt was being circulated. When the pump was stopped, the readings of the two bubblers came together. Using the difference of submersion of the two bubblers and the difference of the readings of the two level indicators, it is possible to compute a value for the apparent density of the fluid in the zone between the lower points of the bubbler lines. Fluid densities were calculated this way under a variety of conditions with the fuel salt circulating at full flow and stagnant. Although the accuracy of this calculation is limited by uncertainty in the separation distance of the two bubblers, it showed quite clearly that densities for circulating salt were much lower than those for stagnant salt or for circulating salt prior to the first beryllium addition in run 15. It also showed that the apparent salt density between the bubblers was to some extent related to the measured salt level in the fuel pump; a higher calculated salt density (i.e., smaller difference in level readings) generally occurred when the indicated salt level was high. Figure 1.6 shows at least this general trend despite the scatter of the data.
One hypothesis to explain this phenomenon is the following. About 50 gpm of salt are ejected at a velocity of 60 fps from the spray ring onto the surface
ORNL-DWG 69-5467 7.5
7.0
8? 6.5
E
e 9
6.0 z > 5.5 -1 W
W -I z E 5.0 3
m 4.5
E 4.0 LL L 0
L
i2
3.5
3.0 50 55 6 0 6 5 70
INDICATED SALT LEVEL FROM LR-593 (%I
Fig. 1.6. Effect of Salt Level on Diffmnce in Bubbler RHdillgS.
c
? ..
Li

of the salt in the pump bowl. Because of their high velocity the jets easily carry &s under the surface of the salt. The bulk of this entrained gas penetrates to a certain depth in the salt and then rises to the surface. It is obvious that the salt to t h i s depth contains a high void fraction. If the zone containing this large void fraction does not extend down below the upper bubbler, then the two bubbler readings would not be affected much, because basically the level indicators measure a weight of salt. These voids would, of course, increase the real level of the salt in the pump bowl by an amount equivalent to the volume of the voids. If, however, the level of the salt is lowered sufficiently (by transfer to the overflow tank), it i; easy to imagine the high-void-fraction region extending below the lower points of one or both of the bubbler lines. In that case, the two level indicators would be differently affected, and the difference in readings would reflect the apparent salt density change in the area between the bubblers. This would explain the tendency for the difference in bubbler readings to increase (i.e., density to decrease) with decreasing level.
Near the end of this report period the pump-speed experiment did much to substantiate this picture. In this experiment the fuel-pump speed was varied over a range from half to full speed. The velocity of the spray ring jets and the flow through the pump bowl vary directly with the speed. The relation between pump speed and the apparent void fraction in the salt between the bubblers is shown in Fig. 1.7. This clearly shows that the void fraction increases as the flow rate through the pump bowl increases and that the void fraction in the pump bowl is at least an order of magnitude higher than that in the loop (cf. Fig. 1.4). Comparison of Figs. 1.4 and 1.7 also shows that a substantial void fraction exists in the zone of the pump bowl between the bubblers before the relatively sharp threshold speed is
ORNL-DWG 69-5468
15
reached at which bubbles are ingested into the loop. This suggests that the depth to which bubbles penetrate in the pump bowl increases with increasing jet velocity until some of the bubbles are fmdy drawn into the
Since the indicated bubble fractions in the pump are so high, it is evident that the actual level of the salt-bubble mixture can be substantially higher than the indicated level. This actual fluid level is significant in regard to the transfer of salt to the overflow tank and the possibility of plugging the pump off-gas line with salt. The relevant facts regarding the actual fluid level are as follows: 1. The salt density in the area between the bubbler
outlets is more or less known in relation to the weight of salt located above the bubblers from Fig. 1.6.
2. The indicated level of the salt is known when there is a drastic change in the transfer rate to the overflow tank, which presumably means that the real salt level is approximately even with the inlet of the overflow pipe (see Sect. 1.3.5).
3. From Fig. 1.6, we can determine, by extrapolation to zero difference, the level at which the fxst bubbles get below the outlet of the highest bubbler.
From this information it was possible to estimate - approximately the densit) of the fluid in relation to its depth and the relation between the real and indicated salt levels (see Fig. 1.8). We estimate that the “bubble
loop.
ORNL-DWG69-5469 + I
-Y - -t - - --- \ELEVATION OF
OVERFLOW PIPE
40 50 60 70 80 LEVEL INDICATED BY L R - 5 9 6 (%)
Fig. 1.8. Relation Between Real Level and Indicated Level in Fuel Pump B o d

"Consultant from Department of Nucleat Engineefhg, University of Tennessee, Knoxville.
"MSR Program Semiann Ron. Rept. Aug. 31, 1968, ORNL-4344, p. 18.
"D. N. Fry, R. C. Kryter, and J. C. Robinson, Meusurement of Helium Void Fraction in the MSRE Fuel Salt Using Neutron-Noise Analysis, ORNL-TM-2315 (Aug. 27,1968).
16
head" has a thickness of approximately 8.8 in. at fbll flow. However, this thickness is probably variable and depends, among other things, on fuel-pump speed and the level of the top of the salt relative to the spray ring and, possibly, on the elapsed time since the last beryllium addition. The first two factors affect the degree of agitation in the pump bowl, while the last appears to affect the stability of bubbles in the salt. It appears that the bubble head has its maximum thick- ness just after beryllium additions. Because of the sharp threshold for gas ingestion into the loop, a difference in the thickness of the bubble head of only about 1% in. could account for the differences in the observed circulating void fraction prior to and after September 1968.
1.3.3 Neutron and Pressure Noise Measurements
R. C. Kryter D. N. Fry J. C. Robinson' ' U-fueled
reactor,I2 analyses were made of the natural fluctua- tions in cover-gas pressure and neutron density of the 233U-fueled MSRE during normal operation at power. The objectives were (1) to determine if the frequency structure and absolute level of the neutron (NPSD) and pressure (PPSD) power spectral densities had been significantly altered by the refueling, (2) to substantiate the other indications that the loop circulating void fraction had greatly increased, and (3) to see if the NPSD in the vicinity of 1 Hz (identified before as a region sensitive to the void fraction) exhibited its previous strong dependence on certain reactor parame- ters' (notably fuel temperature).
The observed neutron and pressure noise character- istics of the refueled reactor (operating under normal conditions at power) were, relative to the 235U-fueled reactor, as follows:
1. The frequency composition of the neutron noise is only slightly different, but the level of the NPSD in the vicinity of 1 Hz is increased by a factor of -2000 to 6000. (Of this increase, only a factor of 2.2 can be accounted for by the increase in reactor gain associated with the decreased Be for ' U.)
As a follow-up on previous studies of the '
2.
3.
4.
5.
The frequency composition of the pressure noise is cj noticeably different, and the level near 1 Hz is increased by a factor of 10 to 40. (Because of the restriction in the off-gas line, the pressure drops and flow paths of the gas leaving the pump bowl were different for the two series of tests. The significance of th is difference has not yet been evaluated.) The average volumetric void fraction of fuel passing through the reactor core, derived from measure- ments and a model ' of the system that interrelates "SD, PED, and void fraction, is increased by a factor of -5.
The circulating void fraction, NPSD, and PPSD are all very nearly independent of changes in fuel temperature, cover-gas pressure, and fuel-pump bowl level, in marked contrast to the earlier experience.' The void fraction is independent of reactor power level but decreases by a factor of -13 when the circulating pump is stopped and the fuel is allowed to circulate by natural convection at about 4% of full power.
9
,. v
c
Detailed explanations of all the above observations have not been attained yet, but all facts indicate that marked changes occurred between the tests with 235U and those with 233U, either in the physical properties of the fuel salt or in the fluid-flow characteristics of the reactor. This tentative explanation may be further illuminated by the results of a series of tests under way at the end of the report period, the goal of which is the isolation of the main sources of primary-loop pressure fluctuations. In any event the studies indicated that it is feasible to use NPSD and P E D measurements for providing an on-line, continuous estimate of the circu- lating void fraction, and plans were made to automate the entire calculational procedure, either with an analog computer or the BR-340 digital computer.
1.3.4 Perturbations in Nuclear Power
P. N. Haubenreich R. H. Guymon J. L. Crowley
With the beginning of high-power operation in January, we observed a phenomenon not seen before: occasional small disturbances in the fuel-salt system that involved brief perturbations of the nuclear power. These came to be called "blips." Although the blips
r c
a
c
14J. C. Robinson and D. N. Fry, Determination of the Void Fmction in the M'SRE Using Small Induced Pressure P-ba- tiom, ORNL-TM-2318 (Feb. 6,1969).

17
were too small to have direct consequences (the nuclear power generally increased by about 10% for a few seconds), intensive efforts were made to arrive at their explanation. These efforts included reviews to see when they had begun, experiments on the effects of system conditions on blip size and frequency, and detailed analysis of observable behavior for clues to the mecha- nism. It became clear rather early that the blips were not related to the change in fssile material per se or to any chemical instability, but to the unusual amount of gas in the fuel system, discussed in earlier sections.
Characteristic Behavior During Blips. - Blips were first noted as small, fairly sharp spikes on the neutron level record, but it was soon discovered that disturb- ances occurred almost simultaneously in several other signals from the fuel system. Figure 1.9 is a chart from a multichannel recorder showing behavior of some significant parameters during three typical blips.
The disturbances in fuel-pump level and pressure, although quite small, are highly significant, for they are a clue to the mechanism. Examination of hundreds of blips at various chart speeds and signal amplifications showed that within the second that the neutron flux started up, both salt level and cover-gas pressure signals always started down. The dips, though small, were definitely outside the distribution of normal fluctua- tions. The direction of the level and pressure changes proved that they were not the result of the excess power, which would tend to make level and pressure go up. Since both decreased, it meant that some salt entered the fuel loop to replace gas that had been compressed somehow other than by the overpressure in the pump bowl.
The bottom trace in Fig. 1.9 is the temperature of a thermocouple in a well in the core specimen access plug at the top of the reactor vessel. Its significance will be discussed later.
ORNL-DWG 69-5373
Fig. 1.9. Recorder Chart Showing Nuclear Power, Fuel Pump Ressure, Indicated Fuel Pump Level, and Thermhuple at Bottom of Access Rug Duhg.Blips.

18
It was found that the characteristic disturbances in pump-bowl pressure and level and access plug tempera- ture occurred regardless of the power level, even occurring when the. reactor was subcritical. Conversely, power perturbations like those in the blips could be induced by briefly withdrawing a control rod (between 0.01 and 0.02% 6k/k for a few seconds) without causing the disturbances in level, pressure, or tempera- ture. Such an experiment is shown in Fig. 1.10. The conclusion was that the power blips are but one manifestation of an event which independently affects the other variables.
The nuclear power increase involved in the blips fell in a fairly well-defmed range; the largest blip raised the power less than 15%, with the most probable increase being around 10% or less. The duration of the blips, that is, the time that the power remained significantly above the average, ranged from 1 to 40 sec. Size distribu-
tions and frequency of Occurrence will be discussed in detail below.
Effect of System Conditions on Blips. - Blips were found to occur over the operating range of pressures, fuel-salt temperatures, and pump-bowl levels and at all power levels. What did matter was the amount of gas circulating with the fuel salt: blips were observed only when the circulating gas was on the order of 0.5 vol % or greater.
Large amounts of gas first appeared in the fuel salt on September 15 ,2 hr after a beryllium rod was immersed in the pump bowl and weeks before the reactor was critical on ” ’ U. A multipoint recorder chart showed that at the same time that the gas appeared, the access plug thermocouple first began to fluctuate in a fashion similar to that observed later during blips. There was no record of pump pressure or level perturbations, since the normal recorders are not sensitive enough to show
ORNL-WG 69-5372
T z a ?
.
Fig. 1.10. Recorder Chart Showing Nuclear Power, Fuel Pump Pmsure, Indicated Fuel Pump Level, and “hennocouple at Bottom of Access Plug During Deliberate Reactivity Perturbations by Control Rod.

19
40
40
such small dips. Search of neutron flux records during early nuclear operation disclosed some blips. Most of the time they could not be seen because the noise at low power and the action of the flux servo system masked them. Blips were tentatively identified on a chart of operation at 50 to 100 w on October 26. One blip of 300 kw occurred during the 30 min on manual rod control on November 27. None occurred during a similar period at 1 Mw the day before. Thus blips seemed to have started with the onset of gas entrain- ment, but by the time the power was raised, after some eight weeks of fuel circulation, they were not very frequent.
After the shutdown, when fuel circulation was resumed and the power was raised, blips were found to be occurring at a rate of 10 to 20 per hour.
Figure 1.1 1 shows strips cut from the nuclear power recorder chart for operation at similar conditions on various dates from January 23 to February 17. (The power scale is in percent of 15 Mw, so one division is 150 kw. The time scale is as indicated.) Although the frequency and size of blips varied from hour to hour, the traces shown are fairly typical for the day.
The first trace was recorded 11 days after the beginning of fuel circulation, when the frequency was around 10 to 20 per hour. The second was taken on January 27, three days after a beryllium addition. The
ORNL-DWG 69-5370R
JAN 2i JAN 29 FEE I 1 FEE 17 RR-8100 CHART (oercent of I5 Mu)
Fig. 1.1 1. Typical S,ections of Nuclear Power Recorder Chad Taken During January and February 1969. Conditions in each case: 5 Mw, 1210°F, 4-5 psig, 5 1 4 2 % fuel pump level, full flow.
frequency and the average duration of the blips were noticeably greater. Thereafter the blip frequency and average size gradually diminished, as suggested by the other charts; until near the end of February only one or two occurred per 8-hr shift.
Between February 7 and 1 1, the fuel temperature was varied from 1180 to 1225'F and the pressure from 3 to 9 psig, with little or no significant effect on the blips. The amount of gas in the loop also did not appear to be affected very much by these changes (see Sect. 1.3.3).
There appeared to have been some decrease in the circulating void fraction during the period when the blip frequency was gradually decreasing, but the voids by no means disappeared. Although the fraction could not be measured very accurately, it certainly remained fairly high (0.5 to 0.7 ~ 0 1 % ) during the entire period covered by Fig. 1.11. One exception was during the heat-removal test, when the fuel circulated by natural convection at powers up to 354 kw. The power trace on the recorder chart, like those in Fig. 1.11, was absolutely smooth, and no blip occurred in the 7 hr that the reactor was at power during this test. Another exception was a brief period while the beryllium rod was in the salt on January 24. The pump-bowl level showed that the bubble fraction decreased to perhaps 0.3 ~ 0 1 % . The blips, which had been occurring at about 10 per hour, practically stopped. (There were none for 2 hr 20 min.) As soon as the beryllium was removed the bubble fraction rose, and in the next hour there were 17 blips. When a much milder reducing agent, a chromium rod, was exposed to the salt on January 29, there was no clear effect on gas or blips.
The variable-frequency power supply for the fuel pump was set up especially to see what effect reduced circulation rate would have on the entrained gas and the blips. By the time it was ready the blips were not as frequent or as large as they had been, but the experiment was still very convincing. Figure 1.12 shows how reducing the pump speed smoothed out the nuclear power until the chart record appeared the same as it had in the operation with 3s U. Reference to Fig. 1.4 shows that the bubble fraction decreased from about 0.4% to 0.2% to less than 0.1% in the three 23 U cases. Operation at the lowest speed was continued for five days, during which time there was no blip. When the speed was returned to 1140 rpm, the trace became rough again and blips began to occur.
Sue-Frequency Distributions. - Cursory examination of the nuclear power traces when there are blips, as in Fig. 1.9 or 1.1 1, suggests that there are two kinds of events - the continuous small, random fluctuations and the larger occasional blips, which look like a different kind of event. This impression is confiimed by a
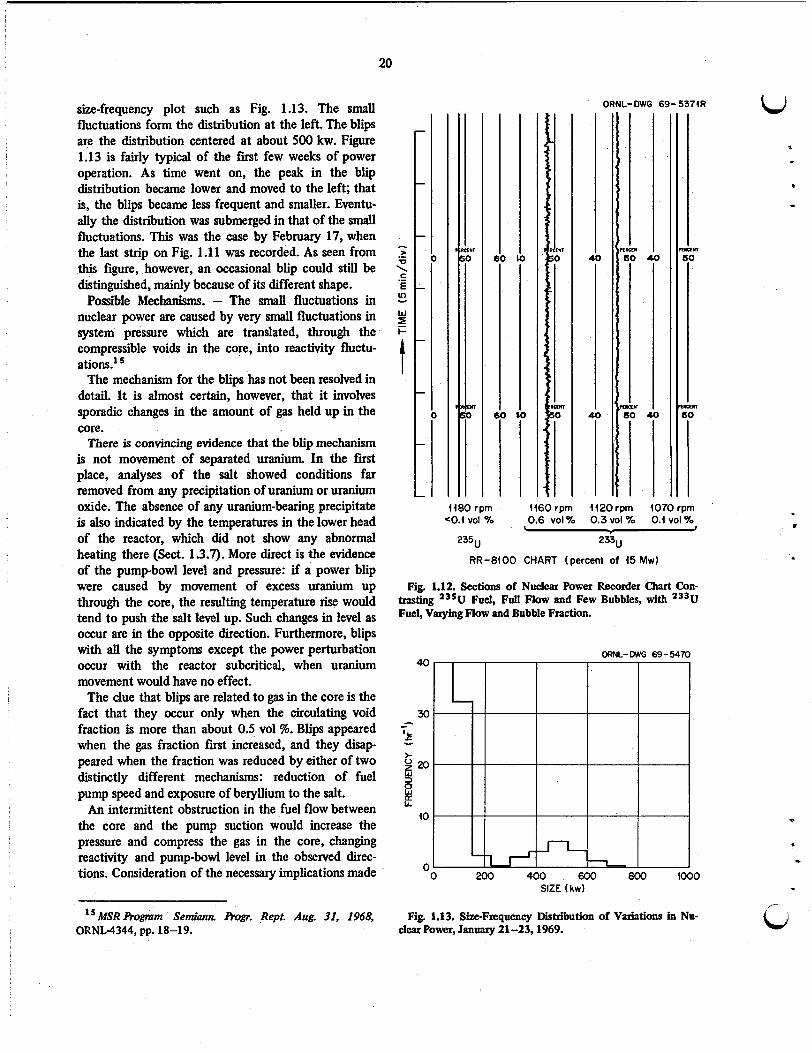
20
111 Em 0
ictm 0
size-frequency plot such as Fig. 1.13. The small fluctuations form the distribution at the left. The blips are the distribution centered at about 500 kw. Figure 1.13 is fairly typical of the first few weeks of power operation. As time went on, the peak in the blip distribution became lower and moved to the left; that is, the blips became less frequent and smaller. Eventu- ally the distribution was submerged in that of the small fluctuations. This was the case by February 17, when the last strip on Fig. 1.1 1 was recorded. As seen from this figure, however, an occasional blip could st i l l be distinguished, mainly because of its different shape.
Possible Mechanisms. - The small fluctuations in nuclear power are caused by very small fluctuations in system pressure which are translated, through the compressible voids in the core, into reactivity fluctu- ations.'
The mechanism for the blips has not been resolved in detail. It is almost certain, however, that it involves sporadic changes in the amount of gas held up in the core.
There is convincing evidence that the blip mechanism is not movement of separated uranium. In the first place, analyses of the salt showed conditions far removed from any precipitation of uranium or uranium oxide. The absence of any uranium-bming precipitate is also indicated by the temperatures in the lower head of the reactor, which did not show any abnormal heating there (Sect. 1.3.7). More direct is the evidence of the pump-bowl level and pressure: if a power blip were caused by movement of excess uranium up through the core, the resulting temperature rise would tend to push the salt level up. Such changes in level as occur are in the opposite direction. Furthermore, blips with all the symptoms except the power perturbation occur with the reactor subcritical, when uranium movement would have no effect.
The clue that blips are related to gas in the core is the fact that they occur only when the circulating void fraction is more than about 0.5 ~ 0 1 % . Blips appeared when the gas fraction first increased, and they disap peared when the fraction was reduced by either of two distinctly different mechanisms: reduction of fuel pump speed and exposure of beryllium to the salt.
An intermittent obstruction in the fuel flow between the core and the pump suction would increase the pressure and compress the gas in the core, changing reactivity and pump-bowl level in the observed direc- tions. Consideration of the necessary implications made
4480 rpm eo.4 vol 70
235u
W
,
4460 rpm 4420rpm 1070 rpm 0.6 VOI 70 0.3 VOl 70 0.4 VOlo/o
< 2
233u
RR-8400 CHART (percent of 45 Mw)
n
Fig. 1.12. Sections of Nuclear Power Recorder Chart Con- trasting 235U Fuel, Full Flow and Few Bubbles, with 233U Fuel, Varying Flow and Bubble Fraction.
ORNL- DWG 69 - 5470
SIZE (kw)
15MSRRognzm Semiann h g r . Rept. Aug. 31, 1968, ORNL-4344, pp. 18-19.
Fig. 1.13. Size-Frequency Distribution of Variations in Nu- d e ~ POW, J ~ l ~ a r y 21-23,1969. Li

i i
5
W
this hypothesis seem quite improbable, however. As shown in Sect. 4.3, reactivity increases of about 0.15% Sk/k in 1 to 2 sec were fairly typical. This corresponds to an increase in fuel density, averated over the core, of 0.034%. Starting with an average void fraction in the core of 0.6 vol % and an average pressure in the core of 35 psia, a pressure change in the core of 2.0 psi would be required to give the observed reactivity effect. It does not appear that an intermittent flow blockage could occur anywhere between the core and the pump suction, with the possible exception of the perforated metal screen below the outlet from the top of the reactor vessel. The normal pressure drop across this screen is only 0.5 psi, and to cause a pressure change of 2.0 psi in the core, half of the 195-in? conical screen would have to be covered and then uncovered. This is hardly credible.
What seems much more probable is that a blip is caused by a small quantity of gas which has collected at some point in the core suddenly breaking loose and being swept up and out of the reactor vessel. As little as 2.0 in? of gas from channels near the center of the core would be enough to produce a 0.015% 6k/k reactivity increase. There is evidence that some gas does cling in the core, at least under low-flow conditions. (The temperature coefficient measurements implied that all gas did not leave the core when the pump stopped, and a clear indication of a compressible volume in the core was obtained when a slight pressure change after 6 hr of natural convection circulation produced a detectable reactivity change.) The triggering mechanism for release of gas clinging in the core is presumably a very small perturbation in flow or pressure. A possible cause of such perturbations is the occasional release of a burst of gas from the reactor access nozzle which is suddenly compressed as it passes through the pump.
The reasons for suspecting that gas from the access -nozzle triggers the blips are: (1) When the cifculating bubble fraction is greater than about OS%, gas fills the plug annuli all the way down to the juncture with the flowing salt stream; (2) coincidentally with blips, changes are observed in a thermocouple at the bottom of the nozzle which indicate temporary increases in the salt level; and (3) the blip frequency increased while the temperature of the gas trapped in the annuli was being allowed to rise (pushing some gas ’out into the flowing stream) and temporarily decreased by a factor of 4 when cooling of the annuli was resumed. The thermo- couple indication lags the start of the blip, but this is due, at least in part, to heat transfer time constants.
Although there are hypotheses, no theory has been developed that satisfactorily explains all observed
21
aspects of the blips. In particular, there is as yet no explanation of why the higher reactivity (or lower void volume) persists for a variable length of time and then rather quickly returns to the original level.
1.3.5 Salt Transfer to Overflow Tank A. Houtzeel
Except for a relatively brief period early in the operation of the MSRE (prior to April 1966), salt has consistently transferred from the fuel loop to the overflow tank whenever the fuel pump is running.16 Although there were variations in the rate of transfer that could not be explained, the rates were generally less than 1.5 lb/hr. During the six-month run with ’ 3s U fuel (run 14) the transfer rate consistently averaged about 0.5 lb/hr. The operation with 233U has been marked by very wide variations in the transfer rate, with occasional values as high as 72 lb/hr.
The flush-salt operation in preparation for the 233U NILS and the first few hours of operation with 23 U fuel (prior to the first beryllium addition) showed transfer rates that were consistent with past experience. The observed rates were in the range of 0.1 to 0.4 lb/hr. After the first beryllium addition in run 15, these rates increased to 4 lb/hr and even much higher. The very high transfer rates occurred after the beryllium capsules had been removed from the pump bowl and gradually diminished to about 4 lb/hr during the next 100 to 150 hr of fuel-salt circulation after the beryllium addition. During the beryllium additions, when the salt level was low, the transfer rates were generally much lower, in the order of 1 to 2 lb/hr. The salt transfer rate jumped to 29 lb/hr just after the second beryllium addition and 72 Ib/hr after the third addition. Figure 1.14 shows the variation of the transfer rate with time after the third beryllium addition. Generally speaking, it was observed that the higher the indicated fuel-pump level, the higher the transfer rate. However, this was not a linear relation. As shown in Fig. 1.15, there was a drastic decrease in transfer rate once the salt level dropped below a certain threshold value. This change can be explained if the actual level of the salt-gas mixture (foam) in the pump bowl is significantly higher than the level indicated by the bubblers. Then, when the real level of salt with bubbles (say “bubble head”) extends beyond the inlet of the overflow pipe, high transfer rates would occur; conversely, if the real level in the
“MSR Program Semiann Rogr. Rept. Aug. 31, 1966, ORNL-4037, p. 24.

8 0
70
60 I b c 3% - W
K
6 40 IL v) z
B
a
5 30
a v)
2 0
10
0
22
ORNL-DWG 69-5474
1600 2 0 0 0 0 4 0 0 0 8 0 0 1200 1600 2 0 0 0 ' 0 4 0 0 0 8 0 0 1200 1600 2000 ' 0400 NOV 15 NOV 16 NOV 17 NOV 18
DATE AND TIME, 1968
Fig. 1.14. Salt Transfer Rates Following BeryUium Addition on November 15-16,1968.
ORNL-DUG 69-5472
52 54 56 5% €0 62 64 66 68 FUEL PUMP LEVEL - CR-593 (%)
Fig. 1.15. Variation of Salt Transfer Rate with Indicated Salt Level in Fuel Pump Bowl, October 1968.
pump bowl is lower than the overflow pipe (because less salt is in the pump bowl or the salt is less agitated), much lower transfer rates could be expected. All this is consistent with the conclusions that were drawn in Sect. 1.3.2 regarding the salt level.
1.3.6 Thed-Convection Heat-Removal Test C. H. Gabbard
A test was conducted to determine the characteristics of heat removal from the MSRE fuel system by natural-convection flow of the fuel salt. Forced circula- tion was maintained in the coolant system during the test. The experiment was run by increasing the heat- removal rate at the radiator in steps, with the reactor critical, and allowing the system to approach equilib- rium prior to the next radiator adjustment. The reactor was in manual control throughout the experiment, and no adjustments were made to the control rods; so the nuclear power was controlled entirely by the inherent feedback of the system. Figure 1.16 shows that the reactor power followed the radiator load smoothly and with little or no tendency to oscillate. For this experiment it had been decided that the temperature difference across the reactor vessel should not exceed about 75'F. With this limitation the maximum power attained, corrected for the afterheat from previous power operation and for changes in electric heater power, was 354 kw. The measured reactor vessel AT at this power level was 76'F, and the fuel flow rate was estimated to be 31 gpm.
*
* . .
U

23
ANT SALT INLET
0. DOOR=Oin.
o m 40 60 80 (00 120 140 160 is0 200 220 240 260 280 300 320 340 360 TIME (rnin)
Fig. 1.16. Nuclear Power and Salt Temperatures Daring Thermal~nvection Heat-Removal Test.
1.3.7 Radiation Heating C. H. Gabbard
Reactor Vessel. - The temperature differences be- tween the reactor inlet and the lower head and between the inlet and the core support flange during power operation with * U were examined for any indication of sedimentation buildup within the reactor vessel. The values observed previously' (revised to correspond to the reactor power level based on the latest value of coolant salt specific heat) are shown in Table 1.4 along with the data from run 17. The temperature differences were slightly greater with the ' ' U fuel, presumably as a result of the greater neuiron leakage, which results in more fssioning in the peripheral regions of the reactor vessel.
Fuel Pump Tank. - The temperatures on the upper surface of the fuel-pump tank were somewhat lower ,during run 17 than had been previously observed.
Decreases in these temperatures have been observed previously,' but no satisfactory explanation of these decreases has been found. When operation of the fuel pump was started on the variable-frequency supply, the pump-tank temperatures at low reactor power were found to increase with increasing pump speed. The temperatures also increased when the restriction in the 522 line at the pump tank cleared following the power increase to 7 Mw at a pump speed of 1000 rpm. However, the full-power temperatures at normal pump speed (1200 rpm) st i l l appear to be slightly less than were observed during run 14.
1.3.8 Thema1 Cycle History
C. H. Gabbard
The accumulated thermal cycle history of the various components sensitive to thermal cycle damage is shown in Table 1.5. Approximately 86% of the design thermal
17MSR Program Semiann Prop. Rept. Feb. 29. 1968, ORNL.4254, p. 9.
"MSR Program Semiann Progr. Rept. Aug. 31, 1967, ORNL-4191, p. 22.

cycle life of the fuel system freeze flanges had been used by the end of February. This compares with a value of 73% at the end of the previous semiannual report period. This relatively large increase is due to the five fa during the j3 U fuel loading.
1.4 EQUIPMENT
1.4.1 U Loading Equipment
B. H. Webster
Loading the " U into the MSRE was complicated by radiation, both from the enriching salt and the stripped
Table 1.4. Power-Dependent Temperature Differences Between Fuel Salt Entering,
and Points on, the Reactor Vessel
24
Table 1.5. MSRE Cumulative Thermal Cyde History Through February 1969
~ ~~
Temperature Difference ("FIMw) Date Core Support Flange Lower Head Run No.
6 4/66-5166 1.90 1.39 7 1/67-5167 1.93 1.35 12 6/67-8167 1.98 1.40 14 9/67-2168 2.03 1.28 17' 1169-2/69 2.29 1.54
'Fuel in this run w a s 233U. In other runs it was 23sU.
6.' carrier salt into which it was to be loaded. The quantity of enriching salt to be added (about 14,000 cm3) made it impractical to use the samplerenricher, which is limited to about 25 an3 per addition. Therefore equipment was designed to load salt into a drain tank containing the radioactive carrier salt. The equipment is shown in Fig. 1.17. Cans of salt containing up to 7 kg of uranium were brought from the TURF, where it had been prepared,' in a heavily shielded carrier, one at a time. Each can was lowered from the carrier into the standpipe as shown in Fig. 1.18. After the shield was sealed, the valve leading to the drain tank was opened, and the can, attached to a long rod, was lowered into the upper part of the half-full drain tank. After a few minutes in the 1200°F tank, the enriching salt began to melt; within an hour all had drained into the pool of carrier salt below. After a strain gage device supporting the rod indicated that the can was empty, it was drawn up into the standpipe and the isolation valve closed below it. The empty, but still radioactive, can was then cleaned of gross contamination by rotating it in front of the exhaust line. I t was weighed precisely before being stored in the turntable. Only then was another can
-
L
"MSR Pmgram Semiann Ron. Rept. Aug. 31, 1968, ORNL4344, pp. 311715.
Number of Cycles Thaw
Transfer Component Heat and Cool Fill and Drain Power On and Off Thaw and
Fuel system Coolant system Fuel pump Coolant pump Freeze flanges 100,101,102 Freeze flanges 200,201 Penetrations 200,201 Freeze valve 103 104 105 106 107 108 109 110 111 112 204
11 9 14 10 11 10 10
9 18 19 21 14 15 14 8 6 2 10
49 75 15 70 44 74 16 70 45 75 15 70 15 I 70
664 142
29 11 19 31 14 17 23 4 4 1 15
53 31 55 40 22 27 29 10 6 2 35
r
. .
cd 206 10 , 13 34

25
PURGE GAS SUPPLY7
ORNL-DWG 68-967
URF CARRIER
GRAPHITE SAMPLING
EFFICIENCY FILTER
EXHAUST BLOWER
ACCESS
-FDT
FLANGE
Fig. 1.17. Arrangement for Adding 233U Enriching Salt to Fuel Drain Tank.
brought in. (To eliminate any chance of accidental criticality, only one loaded can was in the equipment at any time.) Six cans of U-bearing salt were added in this way, with no release of activity and very low radiation doses to the operator. The efficiency was quite high: less than 0.2% of the salt failed to run out of the cans.
The salt-addition equipment was also used for sam- pling the salt immediately after processing. A long- handled tool was used to immerse a capsule in the salt, and then lift it up and place it in a transport container in the standpipe. No difficulties were encountered in this operation.
1.4.2 !Salt Samplers
M. Richardson R. H. Guymon
Fuel Sampler-Enricher. - During the 233U zero- power experiments (run 19, the fuel samplerenricher
was used to add 27 capsules of enriching salt, to take 28 samples of the fuel salt and fuel-pump cover gas, to expose four rods of beryllium for periods from 3l4 to 11'4 hr, and to dip six magnets into the salt to retrieve magnetic powder in or on the salt. These operations were carried out with no unusual difficulties or mechan- ical problems. Although sample capsules would not go all the way to the bottom of the cage in the pump bowl, presumably because of the capsules that had been abandoned there earlier:' regular 10-g sample ladles were immersed, and even the longest capsules retrieved salt when the pump level was high.
During the December startup of what was to be the approach to full power, a failure occurred in the samplerenricher mechanism whose repair entailed some two weeks delay. During an attempt to remove a
2oMSR Program Semiann Rogr. Rept. Aug. 31, 1968, ORNL-4344, pp. 26-29.
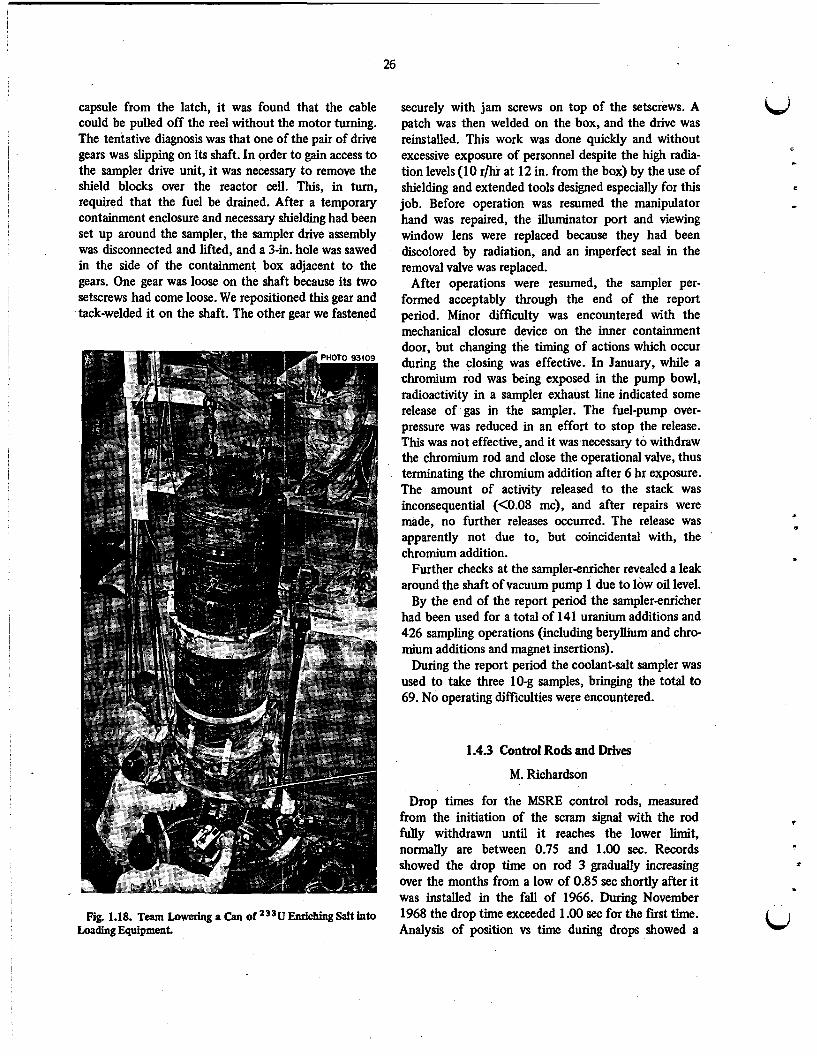
26
capsule from the latch, it was found that the cable could be pulled off the reel without the motor turning. The tentative diagnosis was that one of the pair of drive gears was slipping on its shaft. In order to gain access to the sampler drive unit, it was necessary to remove the shield blocks over the reactor cell. This, in turn, required that the fuel be drained. After a temporary containment enclosure and necessary shielding had been set up around the sampler, the sampler drive assembly was disconnected and lifted, and a 3-in. hole was sawed in the side of the containment box adjacent to the gears. One gear was loose on the shaft because its two setscrews had come loose. We repositioned this gear and tack-welded it on the shaft. The other gear we fastened
Fig. 1.18. Team Lowering a Can of 233U Enriching Salt into Loading Equipment.
securely with jam screws on top of the setscrews. A LJ patch was then welded on the box, and the drive was reinstalled. This work was done quickly and without excessive exposure of personnel despite the high radia- tion levels (10 r/hr at 12 in. from the box) by the use of shielding and extended tools designed especially for this job. Before operation was resumed the manipulator hand was repaired, the illuminator port and viewing window lens were replaced because they had been discolored by radiation, and an imperfect seal in the removal valve was replaced.
After operations were resumed, the sampler per- formed acceptably through the end of the report period. Minor difficulty was encountered with the mechanical closure device on the inner containment door, but changing the timing of actions which occur during the closing was effective. In January, while a chromium rod was being exposed in the pump bowl, radioactivity in a sampler exhaust line indicated some release of gas in the sampler. The fuel-pump over- pressure was reduced in an effort to stop the release. This was not effective, and it was necessary to withdraw the chromium rod and close the operational valve, thus terminating the chromium addition after 6 hr exposure. The amount of activity released to the stack was inconsequential (<0.08 mc), and after repairs were made, no further releases occurred. The release was apparently not due to, but coincidental with, the chromium addition.
Further checks at the samplerenricher revealed a leak around the shaft of vacuum pump 1 due to low oil level.
By the end of the report period the samplerenricher had been used for a total of 141 uranium additions and 426 sampling operations (including beryllium and chro- mium additions and magnet insertions).
During the report period the coolant-salt sampler was used to take three 10-g samples, bringing the total to 69. No operating difficulties were encountered.
- c
.
1.4.3 Control Rods and Drives M. Richardson
s
Drop times for the MSRE control rods, measured from the initiation of the scram signal with the rod f d y withdrawn until it reaches the lower limit, normally are between 0.75 and 1.00 sec. Records showed the drop time on rod 3 gradually increasing over the months from a low of 0.85 sec shortly after it was installed in the fall of 1966. During November 1968 the drop time exceeded 1.00 sec for the first time. Analysis of position vs time during drops showed a
e
t
. c4

fairly uniform drag or friction over the entire travel. While the reactor was down for the sampler repairs in December, the drive for rod 3 was removed and found to be in good condition except for slight galling on the air tube. The air tube was replaced, but there was no improvement in drop time. The drive from rod 2 was moved to rod 3, and similar slow drop times were observed (1.1 to 1.2 sec). The highly radioactive rod was then lifted from its thimble and inspected using an omniscope. There were only very minor scratches on the poison elements and nothing on the upper hose to indicate any binding in the thimble. I t was concluded that the increasing drop time was most likely due to gradually increasing internal friction in the flexible rod. Because of the design of the mechanism, the driving force during a free drop is less than half the weight of the parts that are accelerated. Therefore this force was increased by fitting a 1.5-lb sleeve around the cylinder of the shock absorber in the drive. The drop time then was 0.91 sec, and it decreased slightly after high- temperature operation resumed. At the end of the report period the drop times were averaging 0.84,0.76, and 0.87 sec for rods 1,2, and 3 respectively.
1.4.4 Off-Gas Systems
A. I. Krakoviak
The off-gas piping of both the coolant and fuel pumps experienced gradual plugging at the gas outlet pipes of both pumps and also farther downstream.
The restriction in the fuel system off-gas pipe at the pump bowl reported earliep 92 reappeared after approximately one month of operation with the new fuel. The restriction was blown clear once during pressuredrop measurements, but reappeared a week later and could not be dislodged by back blowing helium from the drain tank to the pump bowl. The pressure drop across the restriction had increased to 4 psi by the last week in November, when the fuel and coolant systems were drained to clean out the off-gas lines of both systems and also to mix the fuel before the start of full-power operation.
The flange at the fuel-pump bowl was removed, and a flexible cable assembly, connected to a filter and a vacuum pump, was used to ream out the off-gas line to the fuel pump and also to collect a sample of the restricting material(reported in Sect. 11.1).
“MSR Rogram Semiann. Rogr. Rept. Feb. 28, 1967,
22MSR Rogram Semiann Rogr. Rept. Feb. 28, 1968, ORNL-4119, pp. 27-29.
ORNL-4254, pp. 13-14.
27
The reactor was then refded; after about three weeks of operation, the restriction reappeared in mid-January and gradually increased to a AP of 5.5 psi. Because the rapid recurrence of the restriction at the pump-bowl exit threatened to become a serious nuisance, a com- pact 2-kw heater unit was designed for this section of line. Development tests on a mockup showed that it could be maneuvered into position through the pump support structure using long-handled tools through the maintenance shield. A unit was prepared in case it should be needed. In the last week in February, during a routine transfer of fuel from the overflow tank to the fuel pump, the restriction was blown clear, resulting in a complete transfer of fuel from the overflow tank to the pump bowl. The pressure drop in this section of line was then below the limit of detection (about 0.1 psi).
On two occasions (the latter part of January iind the latter part of February) a restriction developed in the fuel system off-gas line downstrea of the 4-in. holdup pipe and upstream of the line to the auxiliary charcoal bed. This restriction was blown clear by venting the fuel pump through the drain tanks and then pressurizing the downstream side of the restriction.
During the last week in January a buildup of some material (presumably hydrocarbons from the fuel-pump lubricating oil) at the entrance to all four main charcoal beds ’ resulted in an unacceptable flow restriction through the beds The water level in the pit was lowered, and about a foot of the inlet sections of all four beds was heated with electrical heaters installed previously for this purpose.23 Although two of the three heater elements installed on beds 1A and 1B and one element on bed 2B failed, all four charcoal beds were restored to their original flow capacity.
A restriction periodically developed in the vicinity of the safety block valves in the inlet to the off-gas sampler. (The block valves have 3/32 -in.diam ports, and the piping is 0.083-in.4D autoclave tubing.) This line tees off the main off-gas line upstream of the main charcoal beds. The restriction was successfully cleared each time by back blowing with helium. Thermal conductivity measurements upstream and downstream of a hot copper oxide bed showed that about 1 to 2 g of hydrocarbons per day were flowing with the off-gas past the sample point. (See Sect. 11.1.) This is not inconsistent with the indicated losses of oil in the fuel pump.
The coolant off-gas system also experienced gradual plugging at the pump bowl and in the porous metal
”MSR Rogram Semiann Ron. Rept. Feb. 28, 1967, ORNL-4119, pp. 30-31.

28
filter upstream of PCV-528?4 Replacement of the filter restored t h i s portion of the system to normal flow; the application of heat with a torch during the November shutdown cleared the restriction at the pump bowl. During the heatup a brown vapor (hydrocarbons) was driven out of the off-gas line, and a cleanout tool inserted toward the pump bowl came out covered with black, heavy grease. The restriction was not cleared, however, until the junction of the off-gas line and the pump bowl was gotten quite hot. There was practically no evolution of vapors from the line at this time, indicating that the restriction was, at least to some extent, salt. Also during the November shutdown, all the coolant off-gas valves were dismantled and cleaned. The valves and interconnecting lines were found to have a light layer of oil on the inner surface, and approxi- mately 10 to 20 cc of liquid oil was cleaned from low pockets in the interconnecting lines. A trap for con- densed oil vapors was installed in the line near the pump, and heaters were installed on the line at the exit from the pump bowl. Approximately six weeks after the resumption of operations, the coolant off-gas line at the pump bowl again showed evidence of a restriction, and the heater was energized. The pipe under the heater had been running at 900'F (due to heat conduction from the pump bowl), and the restriction cleared when the temperature increased to 1150'F.
1.4.5 Component Cooling System
P. H. Harley
Component cooling pumps 1 and 2 operated for 3478 and 474 hr, respectively, during the six-month report period. CCP-1 had indicated a slight loss of capacity but was operating satisfactorily at the end of the period.
In December, CCP-2 was shut down by low oil pressure resulting from oil loss through a leaking shaft seal and a sticking oil bypass valve. Both items were replaced. The internal surfaces of the relief valve were coated with a lacquer, which indicated overheating of the oil. An unsuccessful attempt was made to improve cooling of the oil by putting the water to the oil coolers in series instead of parallel. This increased the water flow to the oil cooler of the operating blower from 5 to about 7 gpm but did not have a significant effect on the oil temperature.
1.4.6 Containment and Ventilation
P. H. Harley
In September the annual containment testing was completed with a cell-pressure test at 20 psig. The cell outleakage was 57 scf/day (about 25% of permissible rate). The rest of the containment check was reported previously?
The indicated inleakage (at -2 psig) has been <20 scf/day since the cell was evacuated, with the exception of the first six days. During the initial six days the apparent inleakage started at 78 scflday and decreased to 22 scf/day. This is typical behavior that occurs as the vapor content of the cell atmosphere increases to an equilibrium value. After the cell comes to an equilib- rium vapor pressure, about y gal of condensate is removed daily through a condensate collection system. The source of these incell water vapors is believed to be .a leaking space cooler.
in September the west bank of the ventilation stack roughing filters was replaced because the pressure drop had built up. A standard DOP test of all three banks of absolute filters at that time showed efficiencies between 99.994 and 99.996%. The acceptable efficiency is 99.95%.
The drive belts on stack fan No. 1 failed on February 23, 1968, and ventilation was switched to SF No. 2. As an extra precautionary measure the reactor was taken from 8 Mw to 10 kw while maintenance personnel were called and stack fan No. 1 was repaired and returned to service.
The release of activity to the environment was very low during t h i s report period, being only 0.35 mc of beta-gamma and <0.25 mc of particulate matter. The largest single release was 0.08 mc of beta-gamma activity from a leak which developed at the he1 sampler.
1.4.7 Electrical System
T. L. Hudson
The automatic voltage control system for motor generator set No. 1 failed two times during t h i s report period. Both times the unit was operated on manual control until the vacuum tubes in the automatic controls could be replaced.
There were two automatic transfers of the 50-kva dc-ac inverter load to TVA supply. The first was caused
6)
P
. c
24MSR h p m Semiann bogr. Rept. Feb. 28, 1968, ORNL4254, p. 14. W "MSR Rogmm Semiann h g r . Rept. Aug. 31. 1968,
ORNL4344, p. 32.
. s
.)

by a failure of a thyrister in the inverter logic circuit. The other was caused by a momentary ground during maintenance on the computer.
When a transfer occurs, many alarms are received in the control room Some are caused by loss of operating equipment, and others are due to the momentary loss of control voltage to certain monitors. These have to be reset to stop the alarm and control action. After the first inverter failure, all operating equipment was restarted, but an emergency fuel drain occurred before the reactorcell air activity monitors were reset. The fuel salt was drained to both drain tanks (FD-1 and FD-2). No drain or other serious condition resulted from the second inverter failure.
The operation of the heaters continued with only minor difficulties during this report period. Heater HX-1, located on the south end of the heat exchanger, developed a partial ground in the latter part of October. In order to clear the ground detector lights on bus 5 , the heater was taken out of service. This was possible because tests had been performed after run 11 which determined that this heater was not essential for preheating the system from a cold condition?6 After run 14 this heater had been removed from the reactor cell and lead wire failures in the junction box re- paired? The heater functioned satisfactorily during subsequent heatup and until the partial ground de-
1.4.8 Heaters
T. L. Hudson
29
veloped. The cause of the ground was suspected to be a broken ceramic bead on the lead wire between a heater element and the junction box mounted on top of the unit.
About a 30% drop in current on one heater on the fuel line between the reactor and the fuel pump occurred late in September. After a resistance check indicated a side heater element had failed, the spare heater elements were placed in service.
1.4.9 Other
The fuel- and coolant-salt pumps continued to oper- ate with no sign of trouble. By the end of the report period the fuel pump had run for 23,748 hr and the coolant pump for 25,141 hr. Oil leakage past the lower shaft seal collects in an external tank. The average accumulation rate was 13.5 cclday for the fuel pump and 14.7 cc/&y for the coolant pump. Based on inventories, during the report period 1.5 f 1 liters of oil was lost from the oil system supplying the fuel pump' and 2.2 f 1 liters from the oil system supplying the coolant pump.
26MSR Rogmm Semiann h g r . Rept. Aug. 31, 1967, ORNL-4191, p. 31. 27MSR &warn Semiann Ron. Rept. Aug 31, 1968,
ORNL-4344, p. 31. "Note: 1.5 liters is equivalent to 6.5 glday. It was estimated
that 1 to 2 dday is entrained in the off-gas stream (see Sect. 1.4.4).

2. Component Development Dunlap Scott
2.1 FREEZE-FLANGE THERMALGYCLE TEST
F-. E. Lynch
Thermal cycling of the prototype freeze flange was resumed after the shutdown for inspection at the end of cycle 268.' Operation of the flange was continued through cycle 321, when it was again shut down for inspection of the flange and minor repairs to the
operation equipment. Very few operation problems were experienced during this period of operation.
A complete dye-penetrant inspection of the inner face and the bore of both flanges Was made at the end of cycle 321. The female flange Was S t i l l free of Cracks Of
'MSR Program Semiclnn hog. Rept. Aug. 31, 1968, ORNL4344,~~.33-36.
Fig. 2.1. Photograph of Test Freeze Flange Showing Dye-Penetrant Indication of a Crack on the Right Side of Bore.
30
c
. ,
. W

31
Fig. 2.2. Photograph of Test Freeze Flange Showing Dyepenetrant Indication of a Porosity-Type Crack on the Left Side of Bore.
indication of a defect. Penetrant inspection of the male flange inner face and the neck revealed no indication of a crack. The penetrant did indicate the crack observed: previously1 in the bore of the male flange where the alignment stub was welded to the flange face. The crack had lengthened slightly during the 53 cycles, and the porosity in and around the alignment stub weld was more extensive. Figure 2.1 shows the crack, which now extended approximately 120' clockwise from the upper bore thermocouple. A porosity band continued from t h i s point to about 150 to 155'. From this circum- ferential crack there were porosity bands which propa- gated '4 to '4 in. farther into the bore, being more pronounced at approximately 50,90,120, and 150'. A porosity band extended about 155' counterclockwise from the upper bore thermocouple, as shown in Fig. 2.2. The penetrant also indicated a porosity band extending about '4 in. farther into the bore at 90,120, and 135'.
As reported above, the female flange suffered no crack detectable by the dye-penetrant method of inspection. Therefore it appears that the service life of a flange pair would be greater if two female flanges with
an insert to aid in the remote assembly of the flanges were used in place of the present design.
Thermal cycling of the freeze flange was resumed after reassembly. By the end of February the flange had been subjected to a total of 350 thermal cycles. At the end of cycle 371 the inner face and bore of the flanges will again be inspected by the dye-penetrant method and the results checked with a fluorescent penetrant.
2.2 P W S P. G. Smith A. G. Grindell
2.2.1 Mark 2 Fuel Pump
The mark 2 fuel salt pump, which features a larger gas surge space than the pump in the MSRE: underwent initial testing with salt during this report period. By the end of the period it has circulated the molten salt LiF-BeF2 -ZrF4-ThF4 -UF4 (68-25-5-1-1 mole %) for
2MSR Rogram Semiann Ron. Rept. Feb. 28, 1967, ORNL4119, p. 64.
32
approximately 4000 hr at flows to 1350 gpm and temperatures between 1020 and 1225'F.
Because the unsupported length of shaft is longer in the mark 2 pump, careful measurements of vibration were made during th is operation. The maximum axial displacement was approximately 1 mil and the maxi- mum radial displacement was 0.1 mil at 1165 rpm and 1350 gpm, essentially identical to the displacements on the mark 1 pumps in the same facility. The oil leakage rate past the lower shaft seal and into the catch tank was less than 10 cclday.
From the beginning of salt operation, periodic plugging was experienced in the pump-tank off-gas line. Plug material was found as far as 40 ft downstream from the pump tank collected in valves and other naturally restricted flow areas, where it caused prob- lems in maintaining the purge gas flow of 4 liters/&. After a commercial filter was installed in the line approximately 15 ft from the pump tank, there were no further problems downstream. Plugging occurred later, however, in the off-gas nozzle at the pump tank. About once per week the plugging was cleared by torch heating the nozzle and about 18 in. of the adjacent line or by rapping the nozzle with a hammer. Petrographic examination of a small sample of the plug material showed that it was salt, in nearly spherical droplets of 15 p diameter and smaller. A possible solution to this problem was suggested, namely, a heated reflux trap at the pump-bowl outlet. The liquid salt aerosols would be impacted on baffle surfaces in tortuous passages in the trap, allowing liquid salt to accumulate into droplets sufficiently large to fall back into the pump tank
against the very small drag force of the gas flow. Design LJ and installation of the reflux trap were held up by insufficient funds.
Measurements were started with the radiation densi- tometer to determine the void fraction of gas circu- lating around the loop with the salt. Observations were made while the pump was operated at two different liquid levels in the pump tank: 0.3 in. above the normal operating level and 2.4 in. below the normal level. The differences between densitometer measurements taken at zero flow and 1350 gpm at each of the levels indicated that the gas content of the circulating salt was not detectable at or near the normal level, while at the lower level it was 0.1% by volume. The corresponding value at the normal level with the mark 1 pump design in the prototype facility was 0.1%: No information was obtained at the lower level with the mark 1 design.
At the end of the period, operation was continuing for the observation of the shaft seal leakage per- formance and the plugging in the pump-tank off-gas nozzle. Additional void-fraction measurements were plannea at pump-tank liquid levels considerably above normal.
-
2.2.2 Oil Pump Endurance Test
The oil pump endurance test' was continued. By the end of this report period the pump had run for 48,794 hr circulating oil at 1 60'F and 20 gpm.
3MSR Program Semiann. ROD. Rept. Aug. 31. 1966, ORNL.4037, p. 81.
3

3. Instrumentation and Controls S. J. Ditto
3.1 MSRE OPERATING EXPERIENCE
J. L. Redford
Extensive tests were performed on the relays in the rod-scram circuits to ensure that no further relay failures would be experienced. No failures occurred either during the tests or in subsequent operation. These relays are now tested once each 24 hr to detect single failures should they occur. Noise suppressors (RC and diode) were installed across some of the nonsafety contacts of these relays to alleviate the noise which had sometimes caused difficulty during in-service tests of the scram relays.
Both fission chambers were replaced once during this report period. These chambers had been in operation nine months and one year, which is a great improve- ment over the previously reported three-month average life.’ The improvement is attributed primarily to changes in the method of sealing the chamber connec- tions and cables against intrusion of water. Several components in the pulse amplifier for the No. 1 wide-range counting channel failed due to overload when the fission chamber in that channel failed. No damage was found in any other components of the channel.
The rodcontrol servo was modified to allow an increase in the servo dead band to compensate for the more rapid flux response of the reactor with ’ U fuel. A further modification was made to allow the rod servo to be used as a rod-position demand, rather than a flwJoutlet-temperature demand controller, to give more consistent rod-position variations for some of the dynamics experiments.
An eight-channel Sanborn recorder was installed to monitor several reactor parameters to assist in analysis of the power “blips” which were observed after the beryllium additions were made to the ’ 3 3 U fuel.
‘MSR Program Semirrnn Rogr. Rept. Aug. 31, 1968, ORNL4344, p. 43.
A fssion chamber and a BF3 chamber were installed in the drain-tank cell near drain tank No. 2 to monitor the neutron counting rates during the large 233U additions. (Data from these chambers on the multipli- cation of the internal neutron source also confmed the conclusion reached from calculations that the drain tanks would provide safe subcritical storage of the ‘ j3U fuel.) The chambers were removed before the cells were sealed for the final approach to criticality with ’ 3 3 U.
3.2 CONTROLS SYSTEM DESIGN P. G. Herndon
Further additions and modifcations were made to the instrumentation and controls systems as experience revealed the need or desirability of more information for the operators, improved performance, or increased protection. The number of such changes was copid- erably less than in the previous period.’ Twenty-three requests for changes in the design of the reactor system were reviewed. Of these, 2 resulted in minor changes in instrumentation and controls, 8 required only changes in process switch operating setpoints, 11 did not require changes in process instruments or controls, and on the remaining 2, design revisions were pending at the end of the report period.
The major design effort was on the documentation of the instrumentation and controls. Criteria drawings of the reactor system were brought up to date, and recent revisions’ ,were added to the drawings of the fuel processing system.
3.3 WRE COMPUTER SYSTEM
C. D. Martin J. D. Burke C. W. Kunselman
The computer system, which is used mainly for data acquisition, was originally leased from the Bunker- Ram0 Corporation with the full-time services of a
33

34
maintenance engineer included in the lease agreement. When the computer system was purchased by ORNL in February 1968, the Instrumentation and Controls Division assumed the maintenance responsibility, with emergency maintenance assistance available on call from a Bunker-Ram0 representative in Chattanooga. Two ORNL men attended a four-week accelerated maintenance course at the manufacturer’s plant in June 1968 and have been maintaining the system since that time.
Modification to the computer-room air-conditioning system to maintain the relative humidity between 40 and 60% required increasing the room temperature from 65 to 70°F. The 5’ increase caused overheat problems in three of the nine computer cabinets. This problem was remedied by installing an additional fan in the top of each cabinet to improve internal air circulation.
During the reporting period there were a nominal number of small electronic problems with the com- puter. These included power supply failures, high- frequency noise on the time-ofday clock signal, and the usual sporadic failures of transistors or diodes. One rather bothersome analog-input-system problem which held up the reactor test program for several days was finally traced to a loose connection in the analog-input cabinet. Time began to take its toll in the mercury- wetted analog input relays, but this was not unex- pected, since many of them had more than 25,000,000 operations.
A large effort was started to consolidate certain documentation on the hardware and to compile work-
ing logic diagrams of complete systems. In several areas 61 the MSRE computer has specially designed or modified sections not fully covered by the manufacturer’s stand- ard system documentation. The analog-input subsystem is a good example. This is the subsystem that has caused the most maintenance problems in the past, and adequate documentation is essential to timely main- tenance.
Approximately five man-months of programming were provided for many software system changes that were made almost routinely. (The failure of a single thermocouple sometimes required changes to as many as six different programs. Operation on ’ 33 U required changes to the reactivity-balance calculation, and the results of the experiments being conducted on the reactor frequently dictated computer program changes.) The neutron-noise-analysis program was modified to use the computer plotter to plot the power spectral density in addition to typing results.
A significant programming accomplishment during the reporting period was the adaptation of the Digital Equipment Corporation’s conversational-mode calcu- lation language FOCAL to the MSRE computer to run in background time. This allowed MSRE personnel not previously familiar with computer programming to program engineering calculations on the computer in the FORTRAN-like language and run them in the computer’s “spare time.” This &e is available in very frequent, short increments, so that a calculation can be interspersed between reactor monitoring functions and can cause a continuous typewriter printout that makes the user feel that he has all of the computer’s time rather than just a part of it.
..
.

t
- P
P
4. MSRE Reactor Analysis
4.1 LONG-TERM ISOTOPIC CHANGES AND REACTIVITY EFFECTS DURING OPERATION
WITH 233u B. E. Prince
Theoretical studies of the MSRE neutronic character- istics with ‘ j3U were extended to include the nuclide changes and reactivity effects associated with an ex- tended period of power operation. In particular, the changes in inventories of the various isotopes of uranium and plutonium were calculated, and all changes having a significant effect on the core reactivity were estimated as a function of the time-integrated fission rate. These estimates were based on a revised and updated set of reaction cross sections (ENDF compila- tion), which were averaged over the energy spectrum of the reactor and the volume of the fuel salt. Table 4.1 is a list of the averaged cross sections entering into the calculation of long-term changes. These are “effective” thermal cross sections, which can be multiplied by the thermal flux magnitude to obtain the average reaction rates per atom per unit volume of salt, that is,
G S y * 49 40. E ) dV
1 ~ S v * ~ r * W d V ’ (J=
where V, is the volume of the fuel salt and E, is the cutoff energy defining the “thermal” component of the flux. The method of approximating the neutron flux distribution, $(r, E), was similar to that described in earlier studies.’
The nuclide chain equations for the uranium and plutonium isotopes present in significant quantities in the fuel salts were integrated using the reaction cross sections listed in Table 4.1. The time-integrated fission energy deposition was the independent variable of interest, and in these calculations we assumed that the effective heat energy deposited per fission was 197 Mev
‘MSR Rogram Semiann Rogr. Rept. Aug. 31, 1967, ORNL4191, pp. 50-58.
for all three fissile nuclides (2 U, U, and 9Pu) in the fuel salt.
The results of these calculations are summarized in Figs. 4.1 to 4.3. The relative distribution of the fission rate between the various fissile nuclides is indicated in
Table 4.1. Effective Reaction Cross Sections in MSRE Thermal Flux
with 233U Fuel
Effective
(barns) Nuclide Cross Section
6Li 1OB 233U (absoqtion) 2 3 3 ~ (fission)
23sU (absorption) 2 3 5 ~ (fission)
234u
2 3 6 ~ 2 3 8 ~
239pU (absorption) 2 3 9 ~ u (fission)
Pu 240
476.30
364.74 325.67 114.17 334.74 27254 39.67 34.05
1426.99 887.43 933.99
1921.4
ORNL-DWG 69-5473
INTEGRATED POWER (Mwhr)
Fig. 4.1. Relative Distribution of Fissions Among Fissile Isotopes in Fuel Salt, for 233U Loading.
35

Fig. 4.1. These calculations were based on the best evaluation currently available of the heel of 2 3 5 U which remained from the first loading of the MSRE. The initial plutonium inventories are estimated quanti- ties determined from the cumulative irradiation of the first fuel loading. Figures 4.2 and 4.3 show the changes in total isotopic inventories of uranium and plutonium in circulation which are expected to occur during the planned operation with U. In the calculations represented by these figures, we assumed that no readditions of uranium or dilutions caused by draining and mixing with the residue of fuel salt in the drain tank would occur. Any such changes will be accounted for, however, in routine nuclear operations analysis.
The calculated long-term effects of the important nuclide changes on the core reactivity are shown in Fig. 4.4. In this figure the O B and Li burnout effects are the additional changes to be expected, relative to the
ORNL-DWG 69- 5474 I
0.5
- P
0.2 z J 3 0
0 rr
0.1 z c e 2 w > J z
0.05 8 e
0.02
0.01 0 10 20 30 40 (x 40
INTEGRATED POWER (Mwhr)
Fig. 4.2. Expected Long=rerm Changes in Inventories of Uranium Isotopes During Operation with 23 U.
36
Fig. 4.3. Expected Long-Term Changes in Inventories of Plutonium Isotopes During Operation with 2 3 3 ~ .
burnout that had already been estimated during the total exposure with the ”’ U fuel loading. The U reactivity change appearing in this figure actually represents only one component of the net change in 235U, namely, the production of 2 3 5 U from 234U. The depletion of ’ 35 U is presently being accounted for separately in the fissile uranium burnup term in the on-line reactivity balance computations. As evidenced by the curve in Fig. 4.2, these two effects very nearly cancel one another, leaving the net inventory of 35 U approximately constant.
The nonsaturating fission product reactivity effect shown in Fig. 4.4 was estimated in a manner similar to that used in some previous studies for the 235U loading? In both cases the fission product yields for
U 2MSR Program Semiann Rogr. Rept. Aug 31, 1968, ORNL-4344, pp. 12-14.

37
0.3
0.2
0.t - 2 t o
6 -0.t
t t, -Q2 9
a
w II z a
> I-
II:
- 0.3
-0.4
-0.5
ORNL-DWG 69-5476
o 5 to 45 20 25 30 35 ( ~ 4 0 ~ 1 INTEGRATED POWER (Mwhr)
Fig. 4.4. Expected Long-Term Reactivity Effects Due to Various Isotopic Changes During Operation with ’ U. the various fissile isotopes and also the fission product cross-section normalizations were those compiled in ref. 3. Similar to the studies for the 235U loading, we assumed, for calculation of the reactivity effects, that all the noble gases and none of the noble metals would be removed during operation.
The net long-term reactivity change (algebraic sum of the curves shown in Fig. 4.4) is given by the dashed curve of this figwe. To a close approximation, this net change is a linear function of the time-integrated power. This curve is currently being used in the on-line reactivity balance calculations.
4.2 ANALYSIS OF ZERO-POWER RODCALIBRATION EXPERIMENTS
B. E. Prince
Recalibration of the control rods was necessary for operation with ’ U, because of the increased impor- tance of neutron leakage effects and the more “thermalized” energy spectrum relative to the ’ U loading. For the earlier loading we had performed both period-differential-worth experiments and rod-drop- integral-worth experiments on the regulating rod! The former measurement determined the slope of the reactivity vs rod position curve at a fixed uranium concentration and an initially critical condition. By adding excess uranium and varying the initial critical
rod positions for these experiments, we were able to calibrate the rod over its entire length of travel. In the rod-drop experiments, we determined the total negative reactivity corresponding to the scram of the rod from its initial critical position at some specified uranium concentration. However, because the roddrop experi- ment required a more elaborate recording technique and analysis, it was convenient to perform it only a few times during the course of the uranium enrichments. Hence, in the earlier experiments with ’’ U, we used the results of integrated period-differential-worth data as the basis of our final evaluation of the rod worths. The drop experiments were used mainly to cross check the integrated period data, as well as to test the technique of the rod-drop experiment itself.
When we attempted to apply this same general approach to the ’ U calibration experiments, we encountered some obstacles, however. In brief, after the data from the differential-worth measurements were collected and analyzed, the precision of the results proved to be too poor for application in the manner described above. Although we have not been able to pinpoint exactly where all this “scatter” originated, there are reasons to believe that error in the determi- nation of rod position may have caused much of the problem this time (see Sect. 1.2.2).
Because of the poor precision of the differential- worth experiments, it became necessary to rely more heavily on the results of the rod-drop measurements to obtain the information required to calibrate the rods. In the course of the zero-power experiments with ” ’ U, we had performed two sets of drop experiments, one near the start of the excess uranium additions and one when the critical position of the regulating rod was near the position of maximum differential worth. The results of analysis of some of these experiments are described below. Unlike the period-differential-worth measur- ement, the reactivity determined from the rod-drop experiment is quite insensitive to small errors in the initial and scram positions of the rods. The principal new problem we had to consider was how to interpolate the information from these two sets of experiments to other values of the initial critical rod position and ’’ U concentration to obtain the shape of the rod worth curves. Although we have not yet completed analysis of all the roddrop experiments that were performed, the
’L. L. Bennett, Recommended Fission Product Chains for Use in Reactor EvaIuation Studies, ORNL-TM-1658 (Sept. 26, 1966). 4B. E. Prince et aI., Zero-Power Physics Experiments on the
Molten-Salt Reactor Experiment, ORNL4233 (February 1968).

38
results of the latter should only be to provide certain cross checks on, and information of secondary interest to, the results set forth below.
4.2.1 Rod-Drop Experiments
The first set of experiments were performed after the addition of capsule No. 23. This corresponded to very nearly 30.78 kg of added uranium contained in the fuel loop, or 33.50 kg of total uranium added t o the salt (including the drain tank residue). At these conditions the critical position of the regulating rod at 1200°F was approximately 41.8 in. with the pump off and 47.3 in. with the pump on. In the ensuing description the regulating rod will be designated as rod 1 and the shim rods as rods 2 and 3.
As described in ref. 4, in these experiments the integral count is measured starting with the reactor critical a few seconds before the scram and ending about 30 sec after the scram. The fission chamber is positioned so that the initial count rate at the critical condition is about 30,000 counts/sec. The attempt was made to start each experiment at a neutron level equivalent to about 50 w. Since it was impractical, however, to try to obtain exactly the same count rate at the time of rod scram in each experiment, for con- venience in analysis we first renormalized the measured counts for each case to correspond to an initial rate of 3 X 10⁴ counts/sec. This should not introduce any error since the system is linear in this range.
The results of the measurements and analyses for the first set of experiments (designated as series A) are
7
2
shown in the bottom curve in Fig. 4.5 and in all curves U in Fig. 4.6. Figure 4.5, bottom curve, corresponds to the scram of rod I from its initial critical position of 41.8 in. with the pump off. The circled points are the normalized integral count data, and the curve is the result of numerically integrating the reactor kinetics equations in the manner described in ref. 4. The magnitude of the negative reactivity inserted is used as an adjustable parameter to obtain a close fit to the measured count data. The average accelerations of rods 1 and 2 used for these analyses were 150 and 190 in./sec2, calculated from average droptime measure- ments made subsequent to termination of operation with ' ' U. In addition, all analyses were normalized to the values of the delayed neutron fractions given in Table 4.2. These are effective values, which include approximate evaluations of (1) the relative abundance of ' ' U and ' ' Pu in the fuel salt (source of data for measured delay fractions for all fissile isotopes was ref. 5), (2) the relative energy effectiveness of delayed neutrons in the reactor spectrum, ti and (3) calculated importance-weighted reductions in delay fractions for the conditions of steady fuel circulation.'
The data points for the top curves in Fig. 4.6 correspond to the normalized integral counts for shim
'C. R. Keepin, flysics of Nuclear Kinetics, p. 90, Addison-
6MSR Program Semiann h g r . Rept. Aug. 31, 1968,
'MSR Rogram Semiunn. Prop. Rept. Aug. 31, 1967,
Wesley, Reading, Mass., 1965.
ORNL-4344, pp. 45-46.
ORNL-4191, p. 59.
ORNL-DWG 69-5477
FUEL PUMP OFF,
0 0 2 4 6 8 IO 12 14 16 18 20 22 24 26 28 30
TIME AFTER SCRAM (sed
Fig. 4.5. Results of Rod-Drop Experiments for Regulating Rod (Rod 1).
.
Lr

39
ORNL-DWG 69-5478 (~4041
SERIES A: 30.78 kg OF ADDED URANIUM IN FUEL LOOP
I- z 1 8 4 2 Q 5 3 E
2
n
A FUEL CIRCULATING - INTEGRATION OF REACTOR
Y i i i i i i i i i i i i i i l - 0 2 4 6 8 IO (2 (4 46 48 20 22 24 26 28 30
TIME AFTER SCRAM (sed
Fig. 4.6. Results of Rod-Drop Experiments for Shim Rod 2.
Table 4.2. Effective Delayed Neutron Fractions for the 233U Loading Used in Analysis of
Rod€aliLkation Experiments
Stationary Fuel Circulating Fuel Group (neutrons per lo4 (neutrons per io4
fission neutrons) fission neutrons)
1 2.376 1.137 2 8.576 4.188 3 7.190 4.370 4 8.214 6.654 5 1579 1.544 6 1.003 0.998
Total 28.938 18.891
rod 2, scrammed from its upper limit of travel. The pump was off, rod 3 remained set at 51 in., and rod 1 remained at 41.35 in., its initial critical position for this experiment. This case is of particular interest because, except for the slight “shadowing” effect caused by the 9.65-in. insertion of the regulating rod, it is a direct measurement of the total worth of a single shim rod. (In addition, the shim and regulating rods were found to have the same poisoning effect by comparison of their critical positions.)
In order to better illustrate the sensitivity of this measurement to the magnitude of the reactivity inser- tion, in Fig. 4.6 we have shown two calculated curves corresponding to -2.50 and -2.60% Sk/k.‘ These curves closely bracket the count data, and we can assign a reactivity insertion of -2.55 f 0.05% Sk/k as the “measured” reactivity. Therefore the relative sensitivity or fractional uncertainty in this method should be better than 2%.
The effect of the slight shadowing perturbation caused by rod 1 during the first 10 in, of fall of rod 2 can be estimated from results of rod-shadowing meas- urements, to be described later in this section. This correction is quite small and should increase the measured reactivity magnitude by about 1%. Thus we can assign 2.58 * 0.05% 6k/k as the total worth of a single rod at the concentration of 233U obtaining in this first set of experiments.
The bottom curves of Fig. 4.6 represent the data and results of analysis for the same shim rod, taken with the fuel circulating. As in the experiment with the pump off, rod 2 was scrammed from its upper limit of travel. Rod 3 remained set at its upper limit, and rod 1 remained at its critical position with the pump running, 47.32 in. The solid curves are the results of integrating the kinetics equations for the same reactivity magni- tudes shown in the top curves of Fig. 4.6, but with the delayed neutron fractions for each precursor group replaced by effective fractions calculated with the theoretical model used previously for MSRE analysis (Table 4.2). These results suggest that the calculated losses in delayed neutron fraction due to circulation may be slightly underestimated by the theoretical model. The observed difference is rather small in comparison with the total effect, however, and we concluded that the calculated delayed-neutron losses are within 15% of the actual losses in the MSRE. (Note that the presence of any entrained gas in the circulating fuel salt should not be significant in interpreting this experiment, since these conditions would have re- mained essentially constant throughout the experi- ment.)
The second set of experiments (series B) was per- formed after 31.80 kg of uranium had been added to

40
the fuel loop. In this series we have completed only the analysis of the experiment where rod 1 was dropped from its new critical position at this loading (22.25 in. with the pump stopped). These results are shown as the top curve in Fig. 4.5. The negative reactivity obtained from the analysis of this experiment was -1 .lo% 6k/k. As will be shown below, the results in Fig. 4.5, together with the total measured worth of one rod, provide information sufficient for normalizing and interpolating the rod-calibration measurements.
4.2.2 Reactivity Effect of Excess Uranium
Another calibration curve of special interest which is derived from the zero-power experiments is the varia- tion of excess reactivity with the uranium concentra- tion. Each point on this curve corresponds to the excess reactivity of the system if the rod were withdrawn from its critical position to the upper limit of travel, at a futed uranium loading. This information is directly applicable to the on-line reactivity balance calculations, since the uranium is depleted and readded in the course of operation. The curve is also of theoretical interest, however, because the uranium additions without compensating rod insertions represent a uniform varia- tion in nuclear properties over the volume of the fuel salt. Of the characteristics calculated in core physics studies, this effect should be one of the most reliable, whereas quantities depending directly on the calcu- lation of the rod poisoning effect are probably the least reliable. Therefore for this problem we have made use of theoretical results concerning the shape of the excess-uranium-reactivity curve to aid in interpolating the experimental data described above.
By means of theoretical derivations and arguments based on perturbation theory, one can arrive at the following conclusions:
1. The variation in the excess reactivity p with ‘ j3U loading for a fixed rod position is closely approximated by the formula
where K is a constant, C and M are the concentration and mass of ’ 3 3 U in the salt, and subscript 0 refers to the values at the minimum critical loading.
2. If a reactivity measurement is made which involves the motion of the control rod away from its initial critical position at some fmed uranium loading and we wish to interpolate this measurement to another uranium concentration, the factor expressing this rela-
tion is approximately proportional to the uranium U concentration:
We first tested the accuracy of approximation (1) by applying it in the case where an experimental curve was attainable from independent measurements. This was the ‘ j 5 U mass-vs-reactivity data determined by inte- gration of period measurements and reported as Fig. 7 of ref. 4. We found that fitting the data by a theoretical curve of the form (1) required only a very slight change from the “empirical” curve reported in ref. 4.
Approximations (1) and (2) provide all the necessary relationships to interpolate the rod calibration data for the ’ U loading. The value of Mo , the loading of the fuel loop at the reference conditions for the initial critical experiment, was 30.59 kg of uranium with isotopic composition of the enriching salt. (Note: The heel of ’ U and 9Pu remaining in the salt from the ’ ’ U loading constitutes a base-line effect in all these measurements and can be shown to have negligible influence on the analysis following.) The approxima- tions were applied as follows. From Eq. (2) the total reactivity effect of one rod at a loading of 3 1.80 kg of uranium is approximately
2.58(30.78/31.80) = 2.497% 6k/k.
Subtracting the rod-drop reactivity from the total rod effect gives the excess uranium reactivity at 3 1.80 kg of uranium:
excess U reactivity = 2.497 - 1.10 = 1.397% 6k/k. ,
This result was then applied to generate the reactivity curve corresponding to Eq. (l),
= 0.369 . pM - (0.01397)(31.80) K=- - M - Mo 31.80 - 30.59
The curve of Eq. (1) based on these values of the parametersK and Mo is shown in Fig. 4.7.
These results may be cross-checked for consistency with the rod-drop measurement given by the bottom curve in Fig. 4.5. In this case the reactivity effect of dropping the regulating rod from its critical position at ’30.78 kg of uranium was 2.35% 6k/k. Then
excess U reactivity = 2.58 - 2.35 = 0.23% 6k/k.
.
L,

41
Fig. 4.7. Effect of Uranium Mass on Reactivity In 233U Loading; Theoretical Curve, Normalized to Results from Rod- Drop Experiments.
This is observed to be in close agreement with the value obtained from the interpolated curve in Fig. 4.7.
The results inferred from the above analysis may also be compared with the excess-uranium reactivity effect obtained from theoretical analysis. Differentiation of Eq. (1) shows that K is also equal to the concentration coefficient of reactivity at the minimum critical load- ing; that is,
= K = 0.369 . (3)
This value of the coefficient compares quite favorably with the value of 0.389 obtained from theoretical calculations?
4.2.3 Summary of RodCalibration Information
To synthesize the results of the preceding sections, we used the simple procedure of combining (1) experi-
'MSR Progmrn Semiann Rogr. Rept. Aus 31. 1967, ORNL4191, pp. 50-58.
ORNL-OWG 69-5480
Fig. 4.8. Results of Fit of Rod Calibration Data by Least Squares Formula. 0 Data obtained from measurement of critical rod i positions and use of Fig. 4.7. A Data interpolated from rod-shadowing measurements (Fig. 4.9). Reactivity effects normalized to
td h t M critical loading of 30.59 kg of uranium in fuel loop. I

42
mental measurements of the variation in critical rod position with uranium loading and (2) the information position.) For convenience in the way we apply this given in Fig. 4.7 to obtain the reactivity effect information in the on-line reactivity balance, using Eq. corresponding to arbitrary insertions of the regulating (2) we have put all numerical values of the reactivity in rod. The results of this procedure are shown as the Fig. 4.8 on the basis of one uranium concentration, circled data points in Fig. 4.8. (The small amount of arbitrarily chosen as the initial critical concentration. statistical variation in these data probably corresponds
to slight uncertainities in the temperature and the rod LI
*
8
12
= 16
e 0 e 20 3 c' - 24 to, n
z 5 32
._ - E 28
W > 0
ll. 0
z 36
40 - k H 44 48
52
ORNL-DWG 69-5481
ROD 3 FIXED AT 51 in., ROD '1 COMPENSATING 1 FOR INSERTION OF ROD 2 A RODS 2 AND 3 AT EQUAL ELEVATIONS, ROD 1-
COMPENSATING FOR INSERTION OF BOTH t SHIM RODS
52 44 36 28 20 42 4 CRITICAL POSITION OF ROD I (in. withdrawn)
Conditions:
After Capsule Reactivity Effect (so W k ) * Exp. Addition N ~ . Fuel Circulating
A 9 Y e s 0.32 B 13 No 1.10 C 23 No 2.05 D 27 Yes 2.52
*Normalized to initial critical uranium loading.
Fig. 4.9. Change in critical Position of Rod 1 as Rods 2 and 3 Are Inserted into Core.
0
*
*

43 1
I b d . .
‘ *
j .
t
The complete results shown in Fig. 4.8 constitute a summary of the rodcalibration information, which includes the effects of partial insertions of the shim rods. These additional results were obtained by the following procedure. During the course of the uranium additions, we performed several rod-shadowing experi- ments, in which the change in critical position of the regulating rod was measured as one shim rod,and then two banked shim rods were inserted. The procedure was exactly the same as used in the 235U experiments reported in ref. 4. Results of measurements carried out at four different uranium concentrations are plotted in Fig. 4.9. Here the ordinate and abscissa are the shim- and regulating-rod positions, and each plotted point represents a critical configuration of the rods. The particular conditions for each experiment are also indicated in the figure. A sequence of critical positions taken at a fmed uranium concentration and tempera- ture would represent a contour line of constant reactivity relative to the reference condition if the reactivity were being plotted in the dimension perpen- dicular to the plane of Fig. 4.9.
The data taken from the experiments in which the two shim rods were moved in a bank is of special interest in application to the on-line reactivity-balance calculations because this is the configuration used in the operating reactor. This interest is emphasized in Fig. 4.9 by the smooth curves drawn through these data points. The curves are terminated on the line of equal insertion of the shim and regulating rods because the area to the right of that line is the region in which the rods are operated in the MSRE. From the earlier work with the 23 U loading, we developed an analytical formula for the rod reactivity variation with shim- and regulating- rod insertion? This formula contained adjustable parameters which were fitted by least-squares analysis to the measured data in the region of interest. The analysis procedure described in ref. 9 was applied without modification to the U experiments, with the resulting least-squares curve fit shown in Fig. 4.8. The triangled pbints in this figure are check points for the least-squares formula, interpolated from the smooth curves in Fig. 4.9. The least-squares formula pro%des a good fit to the measured data of Fig. 4.8 for most of the range of rod travel but deviates somewhat from expected values near the upper and lower limits of the range. The total regulating rod reactivity determined from the formula is too large, and the curves probably meet to “bend” more near these limits. (This same
W 9MSR Program SemQnn. Progr. Rept. Feb. 28, 1966, ORNL- 3936, pp. 82-87.
situation was encountered earlier in the 235U meas- urements.) These deviations should not constitute a problem, however, for normal operating procedures keep the tips of the rods well away from these extremes.
In sum, the essential information obtained from the rodcalibration experiments is encompassed in Figs. 4.7 and 4.8 of the preceding description. This information is currently being used in the on-line reactivity-balance calculations, subject to possible future refinements when the final analysis and evaluation of all the zero-power physics experiments with 23 U have been completed.
4.3 CALCULATIONS OF REACTIVITY VARIATIONS FROM POWER-TIME RECORDS
B:E. Prince
In the most common problems involving theoretical analysis of reactor dynamics, the time dependence of the neutron population or fission rate is determined, corresponding to a specific perturbation in the reactor properties or geometry. The inverse type of problem arises, however, whenever one wishes to estimate the nature of the original perturbation corresponding to an observed transient in the neutron level. Recently, observation of some small ripples, or “blips,” in the power level recorded by the MSRE nuclear instruments provided occasion for some computations of this type. These blips were evidenced by temporary increases of about 1oo/o in the neutron level for various durations of the order of several seconds, followed by a return to the original level. They have lately been shown to disappear when the flow is reduced slightly, and it is believed that they are associated with the movement of gas in the core (see Sect. 1.3.4). However, some calculations were performed (1) to estimate the magnitude and time dependence of the input-reactiyity perturbations during these blips, (2) to determine if transients recorded during well-separated intervals of time had any similar features, and (3) to help identify the mechanism producing the reactivity changes. At this date these calculations have been performed for only a few of the blips, recorded during operation of the reactor at 5 Mw. The results have indicated that only a small amount of “input” reactivity (about 0.01 to 0.02% 6k/k) was involved in the production of these transients. However, there do not appear to be any significant conclusions which can be obtained from the time variation of the reactivity, at least from the few cases we have analyzed.
As a basis for mathematical description of this problem, we have used an integrodifferential equation

44
formulation of the neutron kinetics. This equation has the form
where
Pyr) = reactor power (Mw), Po = power at time zero, A P = P - P o ,
p(r) = net reactivity (input + temperature feedback reactivity),
pi = delay fraction for precursors of ith group of delayed neutrons (neutrons per fission neu- tron), i = 1,2, ..., 6 ,
$! =effective delay fraction for the ith group calculated for steady circulation and steady- state neutron level (neutrons per fission neu- tron),
= decay constant for ith group (sec-’), A = prompt-neutron generation time (sec),
H(T) = a kernel function representing the “weight” given to new precursors at time T after their birth from fission, with radioactive decay factor removed (7 = r - E).
The net reactivity is also written as an integral form governing the temperature feedback effects:
with
pin@) = input reactivity from “external” pertur- bation,
cyg = temperature coefficients of reactivity for fuel salt and graphite respectively,
Gxg(7) = kernel functions representing importance- ‘ weighted temperature changes in fuel and
graphite at time T caused by a unit change in LJ the heat production at time zero,
A, B = constants containing the heat capacities of the fuel salt and graphite together with spatial weighting factors.
*
The chief advantage of using the above formulation of the kinetics equations in this problem is that it reduces the approximations required to treat the transport-lag effects between the production of new precursors or heated salt and their influence on the chain reaction at later times. A basic assumption in the present approach is that the neutron population or fission rate can be written as the product of an amplitude function p(r) and a normalized time-independent function distributed like the fundamental mode of the flux. One obtains the kernel functions H(T) and C(T) by first integrating the distributed-parameter kinetics equations for the pre- cursor concentrations and temperatures and then by importance-weighting the solutions over the reactor core.
A study of some of the computational aspects of this general approach is still in progress and will be reported at a later date. However, in the present application it was possible to make several simplifying assumptions while still retaining the main advantages of the method. First, for the type of transients and time intervals we were interested in, the temperature-reactivity feedback due to graphite heating could be neglected. (Only a small fraction of the heat is deposited directly in the graphite, and the time constants for heat transfer are large compared with the intervals of interest.) Second, we approximated the flux and adjoint, or importance, distributions in the MSRE by a product of a sinusoidal function in the axial direction and a Bessel function in the radial direction. In this way the spatial integrations described above could be carried out analytically. Finally, we restricted the time interval for the calcu- lation to an upper limit of one fuel-loop transit time (-25 sec) so that the core inlet temperature of the salt could be assumed essentially constant and the details of the thermal dynamics of the heat exchanger could be neglected.
The resulting kernel functions used in the inverse calculations of reactivity are shown in Fig. 4.10. The functional dependence of H(T) is clearly in accord with that suggested by intuition; at time zero a “pulse” of new precursors is produced in the distribution of the fundamental mode throughout the core, and the importance-weighted value of this pulse is unity. As the fluid containing these precursors leaves the core region, their relative weight decreases to nearly zero after one
w
e
f
c,

45
I = 1 9
,
4.4
4.2
1.0 - I. 5 0.8
z
a 0 7 0.6
0.4
0.2
0 0 0.2 0.4 0.6 0.8 4.0
FRACTION OF FUEL LOOP TRANSIT TIME (T/T~)
Fig. 4.10. Kernel Functions Used for Calculation of Reac- tivity from Power-Time Records.
core transit time. (The approximate residence time in the MSRE neutron flux, including weighted contribu- tions of the upper and lower plenums, is about half the loop transit time.) The weight function then rises again as these precursors return to the core after traversing the external circuit. Superimposed on this weight function is the effect of radioactive decay of the precursors, as shown in the last term on the right-hand side of Eq. (1).
The approximate temperature kernel function Gr(7), shown as the dashed curve in Fig. 4.10, also exhibits qualitative features similar to those of H(7) during the first half of the circulation cycle. Here, however, one can show that it is appropriate to weight the spatial variation with the product of the flux and adjoint functions (the square of the flux in the present approximation). This gives rise to a relative weight of 1.33 rather than unity at time zero, and, in addition, there is a radial weighting factor of 1.67 included in the constantA of Eq. (2).
The records of the time dependence of the power level during the blips were obtained from digitized values of the compensated-ionchamber currents, re- corded every quarter-second by the BR-340 data logger. For the purposes of this calculation the power level was assumed to vary linearly with time during these quarter-second intervals. The resulting transients corre- sponding to several blips recorded while the reactor was operating at 5 Mw are shown in Fig. 4.11. In these observations the reactor control was set on manual so that there would be no compensating motion of the regulating rod during the transient. The,solid curves consisting of broken-straight-line segments represent the reactor power level, and the circled points are the
associated input-reactivity variations, calculated by use of Eqs. (1) and (2), together with the functions shown in Fig. 4.10. In each case the starting point for the calculation was chosen at the end of an interval where the flux signal appeared relatively quiet, so that the net reactivity at time zero was essentially nil. As stated at the beginning of this section, no
significant conclusions concerning original “causes” can be drawn from details of the time dependence of the perturbations. The total magnitude of the reactivity variation is quite small and within the magnitude which could correspond to temporary pressure fluctuations and movements of entrained gas in the fuel salt. (Note that the reactivity in Fig. 4.1 1 is plotted in units of the delay fraction corresponding to steady fuel circulation,) The time intervals involved in the “rise” and “fall” portions of the transients do not appear to be signifi- cantly different. However, there are also smaller varia- tions in the flux signal which have about the same slope and could also be associated with gas-entrainment effects.
Because it has lately been shown that this entire phenomenon is sensitive to the fuel flow rate and can be removed by slight reductions in the flow, and also because of the very small amount of reactivity variation involved, we have temporarily discontinued further calculations of the type shown in Fig. 4.11. These studies will be resumed if future observations suggest that it would be profitable to extend the analysis further.
4.4 THEORETICAL ANALYSIS OF DYNAMICS WITH ” j U FUEL
R. C. Steffy
In the previous semiannual progress report,’ the stability of the ”U-fueled MSRE was discussed. One of the criteria by which the system was judged to be inherently stable was the determination that the real parts of the eigenvalues of the matrix of the mathe- matical model’ ’ of the system were all negative. The previously presented results only included a few eigen- values nearest the origin for various power levels. A continuation of this investigation has resulted in determining the power dependence of all the eigen- values. Figure 4.12 is a plot of the more important
-
“MSR h g m m Semiann. Proi. Rept. Aug. 31, 1968,
“A set of 78 coupled linear differential equations which, taken together, characterize the power and temperature re- sponse of the MSRE with 233U fuel.
ORNL-4344, pp. 48-52.

46
ORNL-OWG 69-5483 6.0 0.40
5.8 0.08 - 0 CALCULATED ADDITION OF REACTIVITY, RELATIVE s
0.06 3 3 Q, I
TO ZERO NET REACTIVITY FOR TIME CO. 5.6 - 0.04
- g 5.4
Q?
Y B a i
5.0 0 ;
5.2 0.02 E L
A W
4.8 -0.02 : 3
6.0 0.40 z
5.8 0.08 3
V LL 0
5.6 0.06 v)
t 3 E 5.4 0.04 L c
2 3 I-
0.02 2 g 5.2
z =l I
W
W K
5.0 0
4.8 -0.02
5.6 0.06 - s - $ z
0.02 w, i
5.0 0 0 L 2
4.8 -0.02 2i
6.0 0.40 x
5.4 0.04 *)
3 I - 5.2 L al W
-I
l3 z 5.8 0.08 5
3 V
a: 5.6 0.06 ,"
3 0 5 v)
0.04 5 - -
2 g 5.4
B >
Y 5.0 O K
4.8 -0.02
- a
0.02 5 I-
W
5.2
0 2 4 6 8 40 12 44 16 48 20 22 24 26 TIME ( s e d
Fig. 4.11. Input-Reactivity Variations Calculated from Power-he Records.
b3

w 0.3
0.2
0.4
u)
T- - IL a v, X a > o z
!i? E
-0.4
-0.2
- 0.3 0.14
c
*
oRNL-DWG 69-16T eigenvalues and graphically shows their power depend- ence. The tendency of the eigenvalues toward the right-hand plane as power is reduced indicates that after a power perturbation the MSRE will be more sluggish in returning to its original state at lower power levels.
At zero power the eigenvalues of the nuclear kinetics POWER FOR EIGENVALUE equations are all on the real axis, with the most
dominant eigenvalue being at the intersection of the real and imaginary axes. This is typical for a zero-power reactor. Also observed in Fig. 4.12 is a set of eigen- values which do not approach the real ax is as power level is increased. These imply that any temperature disturbance in the loop would tend to “ring” around the loop as it decayed. The dependence of these eigenvalues on power is due to the power dependence of theheat transfer coefficient of the radiator.
a e. rn -..-* -% \*
CALCULATION 8MW
-
m 5MW 6 1MW
* ZERO SOLID LINES INDICATE
- A PARTICULAR EIGENVALUE
OSMW
POWER DEPENDENCE OF
\
O b . - / :b -A NEGLIGIBLE ~~~~
POWER i DEPENDENCE
’
Y A . d e/ Fig. 4.12. Power Dependence of the Dominant System
Eigenvalues for the 33 U-Fueled MSRE.
0.42 0.m 0.08 0.06 0.04 Q02 0 REAL A X l s k e d
47

Part 2. MSBR Design and Development c
R. B. Briggs
The purpose of the MSBR design and development activities is to prepare a reference design for a 1000 Mw (electrical) one-fluid MSBR plant; to design a molten- salt breeder experiment (MSBE), operation of which will provide the data and experience necessary to build large MSBR's; and to develop the components and systems for the MSBE.
Work on the reference design for the one-fluid MSBR was begun in October 1967 and has taken most of the effort. Prior progress is reported in our semiannual reports for the periods ending in February and August 1968. The studies have converged on the design of reactor core and vessel described in this report, and we are now investigating some of the more important details of the design. The flow and temperature distributions in the reactor are being calculated, and features required to attain the desired distributions are being incorporated in the design. The distribution of fission products in the reactor systems is beingesti- mated, and the results are being used to provide for adequate removal of the decay heat.
One of the important features of the reactor is the system for rapidly removing krypton and xenon by contacting the circulating fuel salt with helium. Decay of radioactive gases and their daughters results in a large heat load in the off-gas system. Design of this system to meet special requirements imposed by the distribution of heating has also been started.
With the general design of the reference MSBR reasonably well established, we have begun to look at the MSBE. Calculations indicate that a reactor with a
power level of 100 to 200 Mw (thermal) can satisfy the requirements that have been proposed to date. An early concept of the reactor is described here.
The amount of the experimental work in the develop- ment program is small and is being limited to the most important problems. Work is being done on methods for dispersing bubbles of gas in and separating them from circulating liquids. Preparations continue on experiments to measure the coefficients for transfer of dissolved gases to bubbles in circulating liquids. These experiments are in support of the gaseous fission product removal system.
Better values are being obtained for the thermal conductivities of salts for use in heat transfer calcula- tions. Experiments are in progress to confirm or improve on the relationships used to calculate heat transfer coefficients for molten fluoride salts. The sodium fluoroborate-sodium fluoride eutectic salt has, because of its low melting point and low cost, been proposed for use in the intermediate coolant systems of large molten-salt reactors. Since this is a new salt to the MSR program, a forced convection loop is being operated in engineering tests with the salt. Early difficulties have been overcome, and the loop now operates well.
The equipment for the MSBE is to be designed and built by industrial companies. We are presently pro- ceeding with a plan for obtaining pumps and are preparing a plan for obtaining steam generators from industry.
.
D
Ld
48

5. Design E. S. Bettis
5.1 GENERAL
E. S. Bettis R. C. Robertson
Design study of a lo00 Mw (electrical) MSBR power station is continuing. The basic design described in the last semiannual progress report' remains unchanged, but we have made several revisions as a result of more detailed calculations having been completed in such areas as the nuclear physics, stresses, temperatures, and fluid flow. The design modifications have largely been in the reactor internals, in the primary heat exchanger, and in the containment cell wall structure.
Afterheat removal has been more fully investigated. A listing of the design criteria has been made, and the cost estimate has been revised to reflect the design changes and escalation of costs.
The fuel and coolant salt physical properties used in the design study have been previously reported* and remain unchanged except that the thermal conductivity of the fuel salt is now established to be more nearly 0.75 Btu hr" ft-' (OF)".
5.2 PLANTLAYOUT
E. S. Bettis C. W. Collins
J. R. McWherter H. M. Poly
H. L. Watts
The general layout of the plant, described pre- viously,' remains essentially unchanged (Figs. 5.1 and 5.2). As before, the reactor cell contains the reactor, four fuel-salt circulating pumps, and four primary heat eTchangers. We have, however, increased the diameter of the reactor cell from 60 ft to 66 ft to accommodate a larger reactor vessel and additional thickness of thermal insulation.
' 'M. W. Rosenthal et d., MSR Ragram Semiann Ron. Rept. Aug. 31.1968.ORNL4344.
We have reviewed the reactor cell wall construction in some detail. The design must take into account that the wall furnishes biological shielding, insulates against heat losses, provides double containment for the radioactive systems, and is the support structure for all major equipment in the reactor primary system. The cell is being designed for a pressure of about 50 psia; leak-tightness and other characteristics must satisfy the requirements for class B vessels: concrete temperatures must be limited to less than 150°F, and dimensional changes due to thermal expansions must be accommo- dated. As a result of the review we have made some minor changes in the cell wall construction.
The reinforced concrete biological shielding is a minimum of 8 ft thick. Its maximum temperature is limited to less than 150°F by thermal insulation, gamma shielding, and a circulating-gas heat-removal system. The shielding is provided by the walls of inner and outer carbon steel vessels, which also furnish double containment for the fuel-salt system. Both vessels are designed for 50 psia, and about a 6-in.-wide annular space separates the 2-inAhick walls. Nitrogen gas at essentially atmospheric pressure will flow through this space in a closed circulating system to remove a total of 0.5 MW (thermal) of heat. The annular space will also be used for leak detection.
A 9-in. thickness of insulating firebrick is used inside the inner vessel as thermal insulation. Expansion joints are provided in the insulation to allow it to move with the vessel during temperature changes. A thin liner of stainless steel covers the inside of the firebrick to reflect radiant heat, to protect the insulation from damage, and to provide a smooth surface for the cell interior.
The reactor cell atmosphere will probably be nitro- gen, normally operated at slightly below atmospheric
'American Society of Mechanical Engineers, Boiler and Pressure Vessel Code, Nuclear Vessels, sect. 111,1968.
49

PRIMARY HEAT EXCHANGER-
PRIMARY SALT PUMP-
. 126
OFF-GAS PROCESS CELL-
c l 1 . ‘(
DISASSEMBLY AREA ACCESS HATCH 9 ORNL-OWG 6G-41976R
/SECONDARY SALT DRAIN TANKS
(BELOW GROUND LEVEL)
STEAM GENERATOR
‘,REHE ATER
SECONbARY SALT PUMP 176
STEAM PIPING
CHEMICAL PROCESSING
OFF-GAS / HOLDUP TANKS
\ (BELOW GROUND LEVEL) COOLANT SALT DRAIN TANK
(OFF-GAS SYSTEM )
\ HOT CELLS
Fig. 5.1. Plan View of Reactor Building.
Oh
* I * c ‘8

/CONTROL ROD DRIVE
A0
OWL-DWG 68-44979A
Fig. 5.2. Elevation of Reactor and Steam Cells.

52
pressure and at a cell temperature of about 1000'F. The ambient temperature in the cell is maintained by energizing electric heaters when required. The heaters are arranged in thimbles around the periphery of the reactor cell and can be maintained without violating the sealed containment. We expect that about 1 Mw of heating capacity will be required.
As the cell is heated to operating temperature, the inner vessel is allowed to expand downward and outward against spring supports. All penetrations of the cell will be provided with double bellows seals to accommodate relative piping movements. These joints will be arranged for periodic testing and replacement if required.
The biological shielding and double containment protection is continued across the top of the cell. Removable roof plugs are provided over all equipment that might require maintenance. The plugs are arranged in two layers, each 4 ft thick, and in such a manner that they can be replaced with a work shield for performing remote maintenance or, for replacement of core graphite, with a track-mounted transport cask and integral crane.
As shown in Fig. 5.1 the four steam-generating cells, the fuel processing cell, and the cell for storage of a spent reactor core are arranged around the centrally located reactor cell. The building housing the reactor cell complex is a sealed structure with a controlled ventilating system. This confinement provides an addi- tional barrier to the escape of airborne activity. This barrier is particularly needed during maintenance operations.
We have also made some minor revisions to the flowsheet for the plant (see Fig. 5.3). The most important change is that the off-gas holdup tank is now cooled by a water system rather than a circulating salt loop. Design of the off-gas system is discussed in Sect. 7.1.
5.3 REACTOR
H. F. Bauman E. S. Bettis R. Blumberg J. R. McWherter C. W. Collins W. K. Furlong
E. C. Hise H. A. McLain
H. M. Poly H. L. Watts
As the physical size of a molten-salt reactor of a given thermal output is increased over an optimum size, the nuclear performance decreases and the useful life of the graphite moderator and reflector is lengthened. Hereto- fore, optimum nuclear performance was a basic design requirement for the MSBR, and as a result the life of
the core graphite in an optimized 1000 Mw (electrical) 6.' reactor was shown in the last semiannual report' to be only 1.8 years. We have now studied the possibilities for some tradeoffs in this regard. The details of the studies of the effects of reactor core size on nuclear perform- ance are reported in Sect. 6.1 and are discussed here only with regard to changes in the mechanical design of the 1OOOMw (electrical) MSBR.
We found that if the size of the central region of the reactor core were increased from about 1 1 ft diam X 11 ft high, as previously reported,' to 14 ft diam X 13 ft high and axial reflector regions were added, the fuel conservation coefficient would be decreased by only a few percent but the estimated life of the core graphite would be doubled. In addition, increasing the thickness of the undermoderated outer zone of the core to slightly more than optimum would reduce the damage neutron flux incident on the inner face of the reflector graphite to a maximum of 4 x 1 0 ' ~ neutrons cm" sec-' and thus assure that the reflector would normally last the lifetime of the plant (30 years) without requiring replacement. This would simplify the reactor design in that the reflector graphite need not be arranged with an ease of replacement similar to that provided for routine maintenance of the core.
When the computer input parameters were adjusted to provide a configuration with a 4-year life for the core graphite and a 30-year life for the reflector graphite, the results suggested that changes in some of the intemals would improve the design of the reactor. The tradeoff studies indicated the importance of keeping the volume fraction of salt in the reflector low. They also showed that absorption of neutrons in the '"Xe that could diffuse into graphite of high gas permeability in the reflector region would be too small to have much effect on the reactor performance. Allowing the gas permea- bility to be high considerably increases the size of graphite piece that can be manufactured, so this finding opened the way to use of large graphite pieces in the reflector. On the basis of these studies the design of the reactor was changed in several respects. The perform- ance values and principal data based on the new reactor dimensions are given in Table 5.1, and the design changes are discussed below.
The central core region, designated zone I, is assem- bled from 15-ft-long graphite elements 4 X 4 in. in cross section as before. A hole through the center of each element and ridges on each side separate the pieces to furnish flow passages for the salt and provide 13 vol 95 of salt in the most active portion of the core. The elements are maintained in a compact octagonal array, as shown in Figs. 5.4 and 5.5.
.I
t
i
*
8
n
a
.

! ' *
Outside the more active core region there is an undermoderated region containing 37% by volume of salt and designated as zone 11. This region reduces the fissioning, and therefore the neutron leakage from the core, by increasing the fraction of absorptions in the thorium. We reduced the thickness of the under- moderated portion to 15 in., and rather than using graphite spheres, we now provide 2-in. by 10-in. by 14-ft-long graphite slabs with flow passages between them to provide the specified salt volume and for cooling.
Between the undermoderated region and the reflector graphite there is a 2-in.-wide annular space filled entirely with fuel salt which accommodates relative
47hr xe HOLWP
HARCML BED
c w c w
53
He RETURN _ I Y I 1,HePURGE
dimensional changes, provides clearance for removing and replacing the reactor core assembly, and further reduces the neutron leakage. The width of t h i s space is a compromise with the fuel-salt inventory.
The reflector region consists of 12- by 30- by 48-in.-high graphite blocks stacked around the remov- able core assembly. As with the core elements, the buoyant force of this graphite in the fuel salt is normally restrained by the top head structure. When the reactor is empty of salt, the weight is carried by the lower head. There is a '4 -in. annular clearance between the reflector graphite and the vessel wall to permit an upward flow of fuel salt to cool the wall and maintain it below the design temperature of 1300'F. Hastelloy N
5000 Ib/hr
PUMP COOLANT
OFF-GAS c HOLWP TANK L,J - ?COOLANT CLEANUP
-1 t
STACK SALT DRAIN TANK
ORNL-DYG 69-6002
CHEMICAL PROCESSPURGE
IODINE TRAP AND A.B.S. FILTERS
' MAINTENANCE CONTAINMENT VENTILATION ISURGE TANK
SECONDARY SALT PUMP
I X _____-______- IO' Ib/hr FEEDWATER AT 7 0 W F DIVIDER
I 9.61106 Iblhr 5 X t o 6 lb/hr-_- CREHEITSTEAM I AT IOOO'F
I ,
I I I I I I (REHEATER
5*IO6 Ib/hr REHEAT STEAM AT 650.F
PREHEAT
PRIMARY SALT DRAIN TANK
1 DRAIN TANK HEATER ASSEMBLY
DRAIN TANK GASPRESSURE
OR VENT
-HEAT REJECT STACK
T b V - COOLANT (HEATING1 GAS CW - COOLANT WATER [EJ - FREEZE VALVE
FLOW RATES ARE TOTAL FOR IOM) My,) PLANT
Fig. 5.3. Flow Diagram of 1000-Mw (Electrical) Reactor Plant.

54
rings mounted in grooves in the blocks, as shown in Fig. 5.5, expand with temperature and cause the graphite to move outward and maintain its relative position with the wall as the system is heated to operating tempera- ture.
The graphite reflector blocks at the bottom of the vessel are slotted to fit over radial Hastelloy N webs in
Table 5.1. Principal Data for IO00 Mw (Electrical) MSBR Station
Plant Thermal capacity of reactor, Mw Gross electrical generation, Mw Net electrical output of plant, Mw Overall thermal efficiency, %
Reactor Reactor vessel inside diameter, ft Vessel height at center, f t Vessel wall thickness, in. Vessel head thickness, in. Vessel design pressure, psi Core height, f t Number of core elements Length of zone I portion of core elements, ft Overall length of core elements, ft Distance across (octagonal) 5 t s ,
Thickness of undermoderated region,
Thickness of undermoderated region,
Thickness of annulus between reflector
Reflector thickness, radial, in. Average axial reflector thickness, in. Volume fraction of salt in core zone I Volume fraction of salt in undermoderated
Average core power density, kwlliter Maximum thermal neutron flux,
Maximum graphite damage flux (>SO kev),
Graphite temperature at maximum flux region, O F
Estimated useful life of graphite in core, years Total weight of graphite in reactor, Ib Weight of removable core assembly, lb Maximum flow velocity in core, fps Pressure drop due to salt flow through reactor, psi Total salt volume in primary system, ft3 Fissile fuel inventory of reactor and processing plant, kg
Thorium inventory, kg Breeding ratio Yield, %/year Doubling time, compounded continuously, years
core zone I, f t
zone 11, radial, in.
zone 11, axial, in.
and core zone 11, in.
region, zone I1
neutrons cm" sec-'
neutrons cm* sec-l
2250 1035 1000 44.4
22 20 2 3 75 13 1412 13 -15 14
15
9
2
30 "22 0.13 0.37
22.2 7.9 x 10¹⁴
3.2 x 10¹⁴
1284 4 650,000 480,000 8.5 18 1720 1470
68,000 1.06 3.3 21
the bed plate which supports the reflector. Although bj the space between the blocks will increase from about 0.05 in. to 0.1 in. as the system is heated, this arrangement will assure essentially uniform spacing. Hastelloy N rods also run vertically from top to bottom of each stack of graphite reflector blocks to provide vertical alignment. These rods are not secured to the vessel, however.
There is an undermoderated region at both the top and bottom of the reactor core. The regions are formed by molded extensions on each end of the core elements that provide a salt-to-graphite volume ratio of about 0.37. The extensions also allow orificing to obtain the desired flow distribution through the core. By varying the salt velocity from about 8.5 fps at the center to about 2 fps near the periphery, a temperature rise of about 250'F can be attained in all flow channels.
The nuclear calculations indicated that axial reflectors would improve the reactor performance sufficiently to warrant including them in the design. The reflectors would also provide thermal shields to protect the Hastelloy N heads from radiation damage. The axial reflector graphite pieces are molded in the form of wedges. They are supported at each end and spaced so that at operating temperature there is about 0.1 in. between them. Holes are provided in the bottom support plate for salt circulation through the bottom axial reflector. The top reflector is cooled by a salt stream that flows upward through the eight 3-in.-diam holes that are provided in the undermoderated region (zone 11) for insertion of lifting rods when the core graphite is to be replaced. The fuel salt flows between the top graphite reflector wedges and the head of the vessel and then exits with the bulk of the fuel salt leaving the reactor.
The above-mentioned lifting rods are different from the permanently installed rods shown in previous concepts. Eight seal-welded ports are now provided in the top head of the reactor vessel through which the temporary lifting rods can be inserted prior to the lifting operation. The 2'/2-in.-diam rods engage the bottom lifting plate by a ball latch which is actuated by a push rod passing upward through each lifting rod. After the rods are engaged they are also attached to the top head so that the entire core can be removed as an assembly. The new arrangement removes Hastelloy N from the periphery of zone I1 of the core region during reactor operation, where it acted as a nuclear poison, and also eliminates the possibility of radiation em- brittlement of the lifting rods.
.

55
, 1 -
I
1 i i i =
GRAPHITE R E F L E C T O R 1
REACTOR VESSEL- /
ORNL-DWG 69-6803 I 22ft-6'/2 in. OD
/SALT TO PUMP
Fig. 5.4. Plan View of MSBR Vessel.
i 9

56
L 2 0 ft 8 in. 4
REACTOR VESSEL
GRAPHITE
0 in.
32 ft
-
- zc
6 in. GRAPHITE REFLECTOR-
Fig. 5.5. Sectional Elevation of MSBR Vessel.
c

57
5.4 PRIMARY HEAT EXCHANGERS
C. E. Bettis H. A. McLain
H. A. Nelms H. L. Watts
The basic design concept for the primary heat exchangers remains unchanged since the last semiannual report.' Completion of stress calculations and con- sideration of problems associated with the baffles, however, led us to revise the upper tube-sheet arrange- ment. This led to changes in the configuration of the upper head.
A cross section of the revised heat exchanger design is shown in Fig. 5.6, and principal data are given in Table 5.2.
The 3/8-in.-OD by 22-ft-long tubes are assumed to have spiral grooving to improve the heat transfer and thus reduce the tube-side volume of fuel salt inventory in the exchanger. To reduce tubing stresses, the revised design has shallow sine-wave bends in the upper portion of the tubes, which are bent 90" at the top into an L shape. Rather than the horizontal tube sheet previously used, the tubes are now welded into a cylindrical vertical tube sheet at the top of the exchanger. This arrangement permits a thinner tube sheet than if a flat head were used and also allows the top head seal weld to be located in a cooler region and be more readily ' accessible at the top of the exchanger.
The upper portion of the tubing containing the bends is not grooved. Since baffling is also not employed in the bent-tube region, the top 5.5 ft of the bundle experiences parallel flow, and the overall heat transfer performance is not as good as previously reported. An 0.8 baffle leakage factor was applied to the heat transfer in the cross-flow region; a leakage factor of 0.5 was used in the pressure drop estimates. As in the previous heat transfer studies, the spiral grooving on the tubes was assumed to enhance the heat transfer coefficient by a factor of 2 on the inside of the tubes and by a factor of 1.3 on the outside. Corresponding pressure drops were increased by these same factors. In revising the design the same number of tubes and the same shell diameter were assumed. This may require some small adjustment when the circumferential and radial pitches for the tube layout are studied more closely.
As with the past straight-tube design, the tube bundle is arranged for removal and replacement in the unlikely event of tube leakage. The concentric cooling salt piping U at the top can be removed, the top clamp on the shell loosened and set aside, the seal weld ground away, and the bundle withdrawn. All these operations must be performed with remotely operated tooling.
Table 5.2.' Principal Data for Primary Heat Exchanger
For each of four units
Thermal capacity, Mw (thermal) 563 Tube-side conditions
Fluid Tube size, OD, in. Approximate length, ft Number of tubes Inlet-outlet temperatures, OF
Mass flow rate, lb/hr Volume of fuel salt in tubes, ft3 Pressure drop due to flow, psi
Fluid Shell ID, ft Central tube diameter, ft Baffle spacing, ft Baffle cut, % Inlet-outlet temperatures, OF
Mass flow rate, lb/hr Pressure drop due to flow, psi
Shell-side conditions
Fuel salt
22 5920 1300-1050 23.7 X lo6 64 129
Coolant salt 5.4 1.7 1.1 40 850-1160 17.8 X lo6 74 .
%
Approximate overall heat transfer "950 coeficient, B ~ U hr-1 ft-2 (OF)-'
The shell of the exchanger has been designed for a maximum temperature of 1300°F and an allowable primary stress of 3500 psi.
A computer program was written to optimize the straight-tube heat exchanger design to obtain the minimum tube-side (fuel salt) volume within the pres- sure drop limitation of 130 psi prescribed by the hydraulic head delivered by the primary-salt pump. After adoption of the bent-tube design, hand calcula- tions have been used, with the machine calculations as a reference, until the computer program can be revised to accommodate the new design.
5.5 STEAM GENERATOR AND SUPERHEATER
C. E. Bettis H. A. McLain
W. C. Stoddard H. L. Watts
The U-tube, U-shell horizontal steam generator pictured in the last semiannual report' remains un- changed in appearance, but the data have been slightly revised due to use of more recent values of the physical properties for the coolant salt and a change in the baffle spacing. The revised data are given in Table 5.3.
The revised concept of the steam generator uses constant baffle spacing throughout. There should be little tendency for shell-side stratification. The need for wire lacing or some other form of tube support to minimize vibrations has not yet been fully explored.

58
PRIMARY SALT
Fig. 5.6. Sectional Hevation of MSBR Rimary Heat Exchanger.
ORNL-DWG 69-6004 W
..
.
e . 8
Ld

59
Table 5.3. SteamGenerator and Superheater Data For each of 16 units
Thermal capacity-, Mw (thermal) 120.7 Tube-side conditions
Fluid Steam at 3600 psia Tube size, OD, in. Y Approximate length, f t 73 Number of tubes 384
Mass flow rate, lb/hr 630,000 Total heat transfer surface, ft2 Pressure drop due to flow, psi
Fluid Coolant salt Shell ID, ft 1.5
Inlet-outlet temperatures, OF 700- 1000
3628 150
Shell-side conditions
Baffle spacing, ft 4 Inlet-outlet temperatures, OF 1150-850 Mass flow rate, lb/hr Pressure drop due to flow, psi
coefficient, Btu hr-' ft" (OF)-'
3.85 X lo6 60
Approximate overall heat transfer 764
5.6 STEAM REHEATER
C. E. Bettis M. Siman-Tov H. A. McLain H. L. Watts
The steam reheater is a horizontal, counterflow, single-pass shell-and-tube exchanger with disk-and- doughnut baffles which transfers heat from coolant salt in the shell side to steam in the tubes. The design
Table 5.4. Principal Data for Steam Reheater For each of eight units
~~ ~ ~
Thermal capacity, Mw (thermal) Tube-side conditions
Fluid Tube size, OD, in. Approximate length, ft Number of tubes Inlet-outlet temperatures, OF
Mass flow rate, lb/hr Pressure drop due to flow, psi Total heat transfer surface, ft2
Fluid Shell ID, in. Baffle spacing, in. Inlet-outlet temperatures, OF
Mass flow rate, lb/hr Pressure drop due to flow, psi
Approximate overall heat transfer coefficient, tu hr-' ft" (OF)-'
Shell-side conditions
36.6
Steam at 550 psia
215 580 650- 1000 642,000 30 2035
Coolant salt 22.4 6 -6
"/8
1150-850 1.2 x lo6 60 355
concept previously reported' has not been changed, but the heat transfer and pressure drop estimates have been revised to make use of more recent values of the physical properties of the coolant salt. The revised data are listed in Table 5.4.
This heat exchanger will probably not encounter vibration problems, because the velocities are less than 6.5 fps and the tubes are supported by baffles on a relatively close spacing.
5.7 REMOVAL OF REACTOR AFTERHEAT
W. K. Furlong
5.7.1 Introduction
The normal method of removing reactor afterheat is to transfer it to the steam system by continuing circulation of both the primary and secondary salts. In the event of power failure, battery-operated pony motors on the salt pumps will provide the required circulation. Several abnormal situations would require alternate means of afterheat removal, however. Ex- amples are (1) major rupture of the primary system, with subsequent rapid draining of the salt to the catch basin; (2) a leak in the primary system such that circulation by the pumps will eventually cease; (3) loss of flow in more than one secondary loop;(4) mechani- cal failure of all primary-salt pumps; and ( 5 ) failure of the steam system. This section briefly discusses alter- nate means of afterheat removal.
5.7.2 Sources of Afterheat
We identify the following five heat sources which remain in the primary system after shutdown:
1. fission due to decay of flux at shutdown, including the effect of delayed neutron precursor transport by the salt,
2. decay of fission products (and daughters) dispersed in the primary salt,
3. decay of noble-metal fission products (and daugh- ters) deposited on graphite and Hastelloy N surfaces,
4. decay of gaseous krypton and xenon (and daughters) diffused into the graphite,
5 . heat stored in moderator and reflector graphite.
The contribution from fission, aggravated by pump coastdown, is shown in Fig. 5.7 for 235U fuel and in Fig. 8.3 for 233U fuel. The detailed analysis has been

60
ORNL-DWG 69-6005 28
24
T I I I I I I I I I I 0 2 4 6 8 10 12 14 46 18 20
DELAY IN INlTlATlNG ROD MOTION (sed
Fig. 5.7. Integral of Reactor Power at 300 sec After Start of Primary Pump Coastdown vs Delay Between Initiation of Coast- down and Insertion of Reactivity for ’ ’ s U. made by Sides.’*’*4 Various combinations of magni- tude and rate of reactivity insertion, salt flow change, and delay prior to reactivity insertion have been considered. As an example, the case of flow coastdown with 1% negative reactivity inserted at O.l%/sec after a 1.0-sec delay, with ‘”U fuel, would result in 3.75 Mwhr of energy production in the salt. Using only the heat capacity of the salt, this would result in a 113°F rise in salt temperature. In practice, the core heat capacity, which is twice that of the salt, would become available after the salt reached 1200’F (average initial temperature is 1175°F for salt and 1200°F for core graphite). The net effect would be a rise to 1250°F, at 5 min after shutdown, for the salt-graphite system due to the effect of fission heat production alone.
The distribution of fission products in the primary system has been estimated by Briggs’ 96 and Kedl‘ and is discussed in Sects. 5.8 and 7.2. Heat-generation rates
’Internal memorandum from W. H. Sides, “Calculations of Neutron Den+ty Following Rimary Salt Pump Coastdown and Insertion of Negative Reactivity,” February 1969.
41nternal memorandum from W. H. Sides, “Calculations of Neutron Density After Negative Step Insertion of Reactivity,” September 1968.
sIntemal memorandum from R. B. Brigs, “Distribution of Heat Production in a 100&Mw(e) MSBR,” October 25, 1968.
%term1 memorandum from R. B. Brigs, “Estimate of the Afterheat by Decay of Noble Metals in MSBR and Comparison with Data from the MSRE,” November 1968.
’MSR &gram Seminnn. Rogr. Rept. Aug. 31, 1967, ORNL-4191.
‘Internal memorandum from J. R. Tallackson, “Revised Estimates of Maximum Afterheat Deposition in MSBR by Noble Metals,” October 1968.
and total heat production based on this distribution have been presented by Tallackson.8 Figure 5.8 shows the heat generation from sources 2,3, and 4 above.
5.7.3 Heat-Removal Systems
Three heat-removal systems are presently proposed: (1) a drain tank cooling system (for sources 1 and 2
10‘
5
2
io’
5
2
r‘ IO0
5
2
io-‘
5
2
10-2 ‘c
ORNL- DWG 69-6006
10 r$ (0’ 102 to3 io4 (05 106 io’ to8 ELAPSED TIME (sed
Fig. 5.8. Afterheat Distribution with Saturation Concentra- tions of Fission Products in a 1000-Mw (Electrical) Single-Fluid MSBR Fueled with ‘’’U. Curve A - Afterheat in core region produced by Kr and Xe diffused into the graphite plus heating by 10% of the total noble metal fission products assumed to be plated on surfaces. Curve E - Afterheat in the four heat ex- changers produced by 40% of total noble metal fusion products plated on metal surfaces. Curve C - Afterheat in the chemical processing system produced by decay of protactinium and long- lived fission products. Curve D - Afterheat in the off-gas system produced by Kr and Xe plus heating by 50% of the total noble metal fmion products. Curve E - Afterheat produced by fis- sion products which remain dispersed in the p n m q salt. In curve R the concentration of Kr + Xe is that which produces 0.0065 6k/k afld is obtained by gas spaqing on a 3O-sec re- moval cycle. Curves A, E, and D are based on the assumption that the noble metals are either deposited immediately on metal and graphite surfaces or enter the off-gas system immedi- ately. In curves A, B, and D the afterheat includes that from decay of the daughter products of the noble metals and gases.
W c.
c
.
I
I
L,

61
listed above), (2) a core and vessel cooling system (for sources 3 and 4), and (3) an off-gas cooling system. The latter is discussed in Sect. 7.1 of t h i s report.
The general concept of the drain tank and associated cooling system has been previously reported? A stack 150 ft high and 30 ft in diameter was mentioned, but further analysis now indicates that a stack height of about 50 ft with a 45-ft diameter is preferable. In addition, the naturalcirculation fluoroborate system will now be made to be independent of the off-gas coolant system because the latter may operate at much lower temperatures. An independent study’ has recently corroborated the feasibility of our proposed naturalcirculation system. A maximum drain tank wall temperature of 1466°F was also previously reported. Although a detailed analysis of transient temperature and flow conditions remains to be completed, we are confident that a temperature somewhat lower than this value will result. Several alternative coolants, including Hitec’ ’ and water, have been suggested. Hitec has the disadvantage of instability at temperatures on the order of those expected. Water, in a two-phase system, has some advantages, and it is planned to look further at the use of this coolant. With the use of water, it would be possible to unify the off-gas and drain tank cooling systems.
Sources 3 and 4, listed in Sect. 5.7.2 above, affect the reactor and the heat exchangers. The heat from the noble metals deposited on the heat exchanger tubes would be transferred to the steam system, using either forced or natural circulation in the coolant loops. Several means of removing the heat from the reactor have been considered. One would be to maintain the outer vessel surfaces at a relatively loy temperature (-1 100°F) and transfer the energy by radiation through the graphite region to the vessel. A rough estimate of the resulting peak temperature has been made by Tallackson,’2 and a revised version of those results is shown in Fig. 5.9. The method used to maintain the 1100°F surface temperature has not been specified, but some suggestions include the use of a
9hfSR Program Seminnn Progr. Rept. Feb. 29,1968, ORNL- 4254.
‘OH. A. Bailey and M. Mondlak, Design Study of a Natural Convection Cooling System for the Primary Salt Drain Tank of the MSBR, ORNL-MIT60 (to be published).
“ A Du Pont trade name for a eutectic mixture of KNOJ, NaNO2. andNaN03.
12hternal memorandum from J. R. Tallackson, “Revised Estimate of MSBR Core Temperatures Developed After Shut- down,” November 1968.
ORNL-DWG 69-6007
ELAPSED TIME AFTER SHUTDOWN k c )
Fig. 5.9. Estimated Maximum Temperature of Graphite in Core After Shutdown of MSBR
gascooled shroud around the vessel, the use of cooled- plate coils in the cell, and movable sections of cell wall insulation to allow radiation and convection heat transfer to the thermal shield cooling system.
A second method of reactor afterheat removal, and the one which has received the greatest attention in the past six months, is to circulate a heavy gas (argon or nitrogen at about 50 psia) with the primary-salt pumps operated at 1200 rpm. The heat would be transferred via the secondary system to the steam system. If any of the coolant-salt pumps are not operable, natural circu- lation will provide adequate flow. If the steam system is not operable, the heat capacity of the secondary system would be adequate for several hours. The speed of 1200 rpm is above the normal primary pump operating speed but below the critical speed. The pumps would have a separate set of windings for this purpose. To prevent loss of circulating gas in the event of a crack in the primary system and to reduce the stress on the vessel, the reactor cell would be pressurized up to 50 psia. Approximately 25,000 scf of either argon or nitrogen would be required and could be stored in cylinders outside the cell. A helium supply is provided for the off-gas system, and it would have been desirable to also use this for removal of afterheat. However, with the gases in laminar flow, the low Reynolds number of the light gas gives such a high friction factor that the resulting system characteristic intersects the pump characteristics at an intolerably low flow. With argon or nitrogen, however, a flow rate of 17,000 gpm per pump is attained at 1200 rpm. With three of the four primary pumps operating at this speed, 7.7 lb of gas per second can be circulated through the reactor.internals.
Using the method of Dusinberre,13 a program was written to analyze the transient temperatures of the moderator elements (where most of the heat source is
13G. M. Dusinberre, Heat Transfer Cldculations by Finite Differences, International Textbook Company, Scranton, Pa., 1961.

62
concentrated). Results indicate that the temperature rise can be held to about 100°F above the initial temperature. The temperature-time history is shown in Fig. 5.10. The initial conditions depend on a number of factors, particularly those affecting fissions due to delayed neutrons, source No. 1. Of specific importance are the amount and rate of ' shutdown reactivity insertion, the delay prior to reactivity insertion, whether or not primary-salt flow is maintained during shutdown, and, if flow is not maintained, the rate of coastdown. In addition to the temperature of the reactor internals when the gas is introduced and the time allowance for thawing the drain valve, draining the salt, introducing the gas, and possibly pressurizing the cell, another important initial condition is the amount of energy stored in the graphite reflector. Besides considerations of graphite life, a major incentive to reduce the reflector temperatures is thus to minimize this stored energy. In present estimates the reflector peak temperatures are on the order of those in the moderator elements, thus minimizing this aspect of the problem, and most reflector sections will now con- tribute their heat capacity to that available inside the reactor. Allowing 300 sec to thaw the freeze valve and another 700 to completely drain the salt, and assuming a shutdown such that energy is produced as shown in Fig. 5.7 (with 1% reactivity at O.l%/sec and a 1-sec delay), the average initial graphite temperature inside the reactor will be about 1300'F. The vessel and head, not in contact with large masses of hot salt, will normally be somewhat cooler than the graphite. In summary, on the basis of the initial temperature and temperature rise estimates, the hottest part of the reactor when pressurized gas is used for cooling should not exceed 1400'F under conditions where it is necessary to rapidly drain the primary salt. Analysis of
1450 - LL
W 1
Ej 1400 t a W
W I- z
E a I
1350
a 1300
1250
ORNL-DWG 69-6008
0 4 8 12 16 20 24 TIME (sed
Fig. 5.10. Temperature-Time History of Maximum Graphite Temperature Using Nitrogen Coolant circulated at 50 psia by Three Pumps at 1200 rpm.
the peak transient temperature in the vessel is still in progress.
5.8 DISTRIBUTION OF NOBLE-METAL FISSION PRODUCTS AND THEIR DECAY HEAT
R. B. Briggs J. R. Tallackson
Data obtained from operation of the MSRE have indicated that the fission products ranging from ele- ment No. 41, niobium, through element 52, tellurium, are reduced to the metallic state in the fuel salt. The metal particles then deposit on metal and graphite surfaces in the reactor and also appear in the off-gas. The mechanism for transporting the particles to the surfaces of metal, graphite, and bubbles of gas circu- lating in the fuel has not been established, but the particles are believed to be sufficiently small for the transport to be similar to that of molecular spe~ies. '~ On the basis of this assumption, the mass transfer coefficients for the metal particles would be propor- tional to those that have already been calculated for xenon and krypton.
The mass transfer coefficient for xenon, the fluid velocity, and the surface area in each region of the MSBR are shown in Table 5.5. The mass transfer coefficient for metal particles is assumed to be the mass transfer coefficient for xenon multiplied by a constant that has a value less than 1. Under steady-state
I4S. K. Beal, Transport of Parlides in Turbulent Row to Channel or Pipe Walls, WAPD-TM-765 (April 1968).
Table 5 5 . Estimates of Mass Transfer Coefficients for Xenon, Surface Area, and Fluid Velocity
in MSBR
Graphite Core center 14 1.5 4,000" Core outer Core average 6 0.8 27,700 Blanket 0.7 0.06 1,700
Heat exchanger 9 2.4 40,000
Reactor vessel ? 0.5 2,400 Gas bubbles 2 52,000'
Metal
Piping 26 1.2 1,100
"Assumed to be 15% of core. 'Bubble fraction = 0.01 with O.O201n.-diam bubbles.
b,
. - .
. 8
L1'

Table 5.6. Heat Gemrated by Decay of Saturation Levels of Noble-Metal Fission PIoducts W u c e d in-a 2250 Mw(T&pal) MSBR Fueled with 2-35&v" .
3 x 10²Sec, io3 =, 3 x io3 W, io4 set, 3 x io4 s e ~ , 0.0833 hr 0.218 hr 0.833 hr 2.18 hr 8.33 hr OSeC lO2seC
Element 0- 7 Total @- 7 Total 6- 7 Total 8- 7 TOM 8- 7 Total B- 7 Total @ - 7 Total
Nb Mo Tc Ru Rh Te Subtotal I
Total
1665 810 1052 94 65
1233 4919 1154 6133
- -
2,550 4,215 810 1,140
1,465 2,511 221 321 43 108
2,056 3,289 1,211 12,190 3,002 4,156 10,213 16,346
-- --
1391 106 lo00 86 59
1201 4449 1151 5600
- -
1913 845 1425 226 43
2008 6460 3000
-
3,310 1,551 2,425 312 102
3,209 10,909 4,151
-
128 611 882 16 58
1131 3492 1141 4639
- -
364 1,095 808 1044 1,852 155 1,366 440 498 938 1308 2,190 539 836 1,315 226 302 64 224 288 42 100 55 40 95
36 416 512 220 135 355 0 I1 I1 35 113 208 48 26 14 - - - 57 144, 201 396 1025 1421 505 1411 1916 901 2496 3391 - - -
545 860 1405 213 218 491 129 226 355 59 219 218 51 36 81 566 1010 1636 1623 2629 4252 1031 2112 3143 2654 5341 7995
- - -
--- io7 set, 2180 hr
160 581 141 233 143 316
1 I5 16 50 202 252 49 31 80 140 32% 468 633 1366 1999 I19 1965 2684 1352 3331 4683
- - - - - -
3 x io7 =, 8333 hr
8- 7 Total
1922 3,049 944 1643 2,581 4611 8,109 2850 4285 1,135 2988 4,135. 1126 2935 4,061
- - - - - - -----
9460 15,060 1605 12,244 3916 1220 11,196
106 Sec, 3 x 10⁶ sec, 218 hr 833 hr
8- 7 Total 8- 7 Total
m w 108 Sec,
27,118 hr 3 x io5 =, 83.3 hr
io5 s e ~ , 21.8 hr
7 Total Element
8- y Total 8- 7 Total 0- 7 Total
Nb Mo Tc Ru Rh Te Subtotal I Total .
32 180 0 25 44 41 3 28 351 619
-
-
464 110 60 152 20 101 913 1131 2050
- -
496 290 60 111 64 154 1241 1488 2129
- -
31 101 0 23 31 30 222 169 391
-
-
443 62 34 145 16 54
414 163 34 168 53 84 916 810
-
26.4 13.5 0 19.8
316.2 8.3 4.5
126.0 13.0 12.1
402.6 21.8 4.5
145.8 46.0 24.9 645.6 182.2 827.8
- -
16.1 0 0 135 31.5 6.5
231.8 0 0 84.1 9.5 4.1
254.5 0 0 91.6 41.0 10.6
3.4 41.8 0 0 0 0 3.6 20.1 21.0 3.9 2.4 1.3 36.4 13.1
Q O
36.4 13.1
- -
- _ _
51.2 0 0 24.3 30.9 3.1
0 0.5 0.5 0 0 0 0 0 0 0
0 0 0 0 0 0 0.25 0.38 0.63 0 0 0 11.4 1.5 18.9 3.14 0.31 4.05 0.4 0.2 0.6 0 0 0 18.05 2.58 20.63 3.8 0.3 4.1 0 0 0 0 0 0 18.0 2.6 20.6 3.8 0.3 4.1
0 0
- - - - - - - - ~ - - -
33.0 12.2
154 64 1 1395 -
104.9 41.1
540.1 140.5
68.2 3.3
335.5 1.4
403.1 10.1
110.1 0
1186 146.6 681.2 71.5 342.9 414.4 110.1 ~~
"Heat rates are in kilo~ritts at the indicated times after shutdown. This tabulation is from a FOULBALLCALDRON computation in which it was assumed that the saturation levels of the noble metals are not reduced by chemical processing. These afterheat rates do not include the afterheat developed by noble metals that are born afterbhutdown and are the daughters of nonnoble parents.

64
conditions the metal particles in the primary system are distributed between the surfaces of graphite, metal, and bubbles in proportion to the products of the mass transfer coefficients and the surface areas.
Particle transport to metal, graphite, and bubbles by means of the assumed diffusion mechanism proceeds much faster than particle removal by the chemical processing system; therefore it was assumed that the chemical processing system effects no reduction in surface deposition. Assuming that once a particle reaches a surface it remains there, we find that 10% of the particles will deposit on graphite surfaces, 40% will deposit on metal surfaces, and 50% will be discharged with bubbles to the off-gas system.' Use of this method to estimate the distribution of
metallic fission products in the MSRE gives results that are reasonably consistent with the distribution based on analysis of specimens from the core. Direct extrapola- tion of data from the MSRE would lead to the conclusion that less than 10% of the metallic particles would deposit on the graphite in an MSBR and that the distribution would be different for each of the metallic elements. However, the MSRE data scatter consider- ably, so it seems reasonable to use the estimates above for MSBR design purposes. The results reported here are for the design as it existed in November 1968 and have not yet been adjusted to the current design.
The distributions shown above were used to estimate afterheating8 by noble-metal fission products in the primary system. The distribution of, and heat produced in the graphite by, fission product krypton and xenon is discussed by Ked in Sect. 7.2. In estimating heat production after shutdown, it was assumed that the iodine born in surface deposits after the salt has been drained remains there. For safety analyses it should be assumed that iodine born on surfaces escapes and must be contained.
Table 5.6 lists the principal noble-metal heat pro- ducers and their heat productions as a function of elapsed time after shutdown. Figure 5.8 includes curves of afterheat generation in the primary system vs time based on the distribution discussed above.
5.9 REACTOR TEMPERATURES, FLOWS, AND HEAT TRANSFER
W. K. Furlong H. A. McLain
5.9.1 Reactor Core
The basic approach in designing the MSBR core is to regulate the fuel-salt flow through each flow channel to achieve the desired 250'F temperature rise. Other
objectives that must be considered in using this u approach are that the fuel-salt inventory within the reactor, the pressure drop due to flow, and the vessel wall temperatures must all be kept to a minimum or within allowable limits. Since radiation-induced damage to the graphite is very sensitive to temperature, it is particularly desirable that the graphite temperatures be low in the regions of high damage neutron flux in order to assure at least a four-year useful life for the core moderator elements. The relationships between graphite life, damage flux, and temperature are shown in Fig. 5.1 1. It is also important that the radial reflector graphite have a sufficiently low temperature to allow a 30-year estimated life, as explained in Sect. 5.3.
The radial distribution of the fission power densities averaged over the total height of the core and axial reflectors in the present MSBR concept is shown in Fig. 5.12. The discontinuity in the curve is between zone I, having 13.2% salt volume, and zone 11, having 37% salt volume. The axial distribution of the fission power density in zone I can be approximated closely by a cosine having an extrapolated length of 8.1 ft.
Heat is also generated in the graphite by the gammas produced in the core and by moderation of the neutrons. Heat deposition rates for a core configuration essentially the same as that of the present MSBR concept are shown in Fig. 6.3. To adjust the heat deposition rates of zones I and I1 of the reactor for the different peak and average core power densities in the two concepts, we assumed that five-sixths of the gamma
8
*
ORNL-OWG 69-52630. 7
I
3 6 8
+ = A + 8T (BEST FI N %l
N I Q Dt
9 4 w' P k 3
g 2
-I
!z
Q GILSO A A PGA
4 + o AGOT
0 300 400 500 600 700 800 900 IO00
IRRADIATION TEMPERATURE f°C)
Fig. 5.11. Lifetime vs Temperature, MSBR Core Graphite.
.
bi

65
40
35
- a 30
R E Q E 25
k > v)
0
W
E 20 a
a
e
15
z
z IO - LL
5
0
ORNL-DWG 69-6010
-37 VOI % s
' 0 50 I00 150 200 250
RADIUS (cm)
Fig. 5.12. Radial Distribution of Pion Power Density Averaged Over Length of MSBR Core and Both Axial'ReflectoK
heating and all of the neutron slowing-down energy is proportional to the local power density and that the remaining one-sixth of the gamma heating is propor- tional to the average power density in the core.
Several factors influence the shape of the core moderator elements. Preliminary calculations indicated that the elements should be on a 4-in~quare pitch. The most recent physics calculations indicate that they should be designed so that the volume fraction of salt in zone I is 0.132 and in zone I1 is 0.37. To achieve the relatively low cost of fabrication of the elements by extrusion, the geometry should contain no radii of less than '4 in. The central hole through the sticks should not be less than 0.6 in. in diameter to assure successful deposition of the pyrolytic graphite coating used to reduce the permeability to salt and xenon gas. Cognizance must be taken of the movement of the elements relative to each other with temperature- and radiation-induced dimensional changes.
As is evident in Fig. 5.12, the highest mass velocity of fuel-salt flow is required at the center of the reactor. If all the flow channels could have equal hydraulic diameters, the pressure drop due to flow through the core could be minimized, but the restriction on the minimum size of the central hole in the elements, mentioned above, dictates that the flow channels between the adjacent elements have smaller hydraulic
diameters than the hole. The salt flow through the central hole must then be restricted by orificing. On this basis, the pressure drop of the salt flowing along the center line of the reactor has been determined to be about 18 psi. It can also be seen from Fig. 5.12 that the farther an element is from the center line,,the lower the mass velocity of the salt must be to obtain the desired 250'F temperature rise in the salt moving upward through the core.
Two typical cross sections for the graphite moderator elements are shown in Fig. 5.13. The central part of the core, zone IA, will be made up of elements of the type shown in Fig. 5.13, and those farther from the center, zone IB, will have the cross section shown in Fig. 5.13b. The hydraulic diameters of the channels between adjacent elements in zone IB are smaller than in zone IA. Since it would not be practical to size the flow passages between the elements at each radial distance from the center of the core to achieve an exact 250°F temperature rise, the central holes will be orificed so that the salt streams discharging from all these flow channels associated with each element will combine into a mixture of the desired temperature. The cross sections of the moderator elements for zone IIA of the reactor are identical to those shown in Fig. 5.13b except that the central hole diameter is 2.581 in. instead of 1.347 in.

h 4.302
( 0 )
66
0.302
I IN INCHES
( 6 )
ORNL-DWG 69-60ft
1
c 1 4.100
.
0.100
t
Fig. 5.1 3. MSBR Graphite Moderator Element for (a) Core Zone I-A, (b) Core Zone I-B.
R
Experiments have been reported in which the flow through channels formed by closely packed rods on a triangular pitch is greater than that predicted by the equivalent hydraulic diameter theory." Use of this concept for calculating the salt flow rates through the MSBR core will therefore require verification and further study, particularly in the passages formed by the comers of four adjacent elements.
As would be expected, the highest steady-state graphite temperatures and the greatest irradiation to the moderator graphite would occur at the reactor center line. Calculations were made of the temperature distri- bution through an element along the center line, both at midheight of the core, where the salt is at an average temperature of 117S0F, and in a plane about 1 ft higher, where the salt is at 1200'F. The results are shown in Fig. 5.14. They show that at midheight the
lSW. Eifler and R. Nijsing, Fundamental Studies of Fluid Flow and Heat Tmnsfer in Fuel Element Geometries. IL Experimental Investigation of Velocity Distributions in a Triclngulm Array of Parallel Rods, EURATOM report No. EUR 2193.6, Joint Nuclear Research Center, Ispra Establishment, Italy, 1965.
* maximum temperature is 1284OF and at 1 ft above midelevation the temperature is 1307'F. Figure 5.14 also illustrates the importance of the central hole in the moderator elements in maintaining the temperatures within acceptable limits.
In making the calculations described above we assumed that the heat transfer coefficient between the graphite and the fuel salt could be predicted by the Dittus-Boelter relationship, that the effect of volu- metric heat sources on heat transfer between the graphite and salt were negligible, and that there was no transfer of heat between the graphite and the salt for a distance of 0.1 in. on each side of the apex of the rib on the outer edge of the moderator element. The latter assumption is a first approximation of the fact that the flow in this area is restricted. It also illustrates why the ribs should be kept as narrow as possible. Calculations were made by use of the Astra HEATING code, which is 'a relaxation heat conduction code that assumes constant thermal conductivity of the materials. The parameters used in these particular calculations are listed in Table 5.7.
Preliminary calculations indicate that vibration of the moderator elements should not be a problem. The magnitude of the vibrations was determined by extrapo-
e
*
t
c
bi

67 ORNL-DWG 69-60t2
I (bl
I
Fig. 5.14. Temperature Distxibution in MSBR Moderator Element at (a) Mid-Height of Core, (b) 1 ft Above Midplane.
lating known information about the amplitude of vibrations with parallel flow’6 and adding to this the rod deflection due to cross flow of salt between the channels. Assuming the velocity of the salt between adjacent channels to be ‘4 fps and extrapolating information on vibration due to cross-flow vortex shedding,’7 the sum of the two effects gives a total calculated amplitude of vibration at the center line of less than 0.002 in. Model tests will be required for substantiation, but on this basis we believe that core vibrations will not limit the design.
In connection with the studies mentioned above, it may be noted that a 12- by 12-in. area has been assigned for control rods in the center of the reactor. The salt flow in this region may be in excess of that needed to cool the rods in order to help bring sufficient cool salt to the top axial reflector. Orificing of the flow in this central region will also be required, to minimize variations in the flow with control rod position. Studies are continuing, and efforts will be made to determine if there are any vibration problems associated with the control rods.
“D. Burgreen et al., “Vibration of Rod Induced by Water in Parallel Flow,” Trans. ASME(July 1958).
17Y. N. Chen, Flowfnduced Vibration and Noise in Tube- Bank Heat Exchanger Due to von K a m n Streets, ASME paper 67-ViBR-48 (January 1967).
Table 5.7. Input Parameters for Calculating MSBR Moderator Element Temperatures Using the
Astra HEATING Code
Salt temperature, OF 1175 1200 Heat generation rate, Btu hr-’ in.-3 290.8 286.1
Graphite thermal conductivity, Btu hr-’ in.-’ (OF)-’
1.415 1.415
Heat transfer coefficient for 12.26 12.63
Heat transfer coefficient for 12.85 13.22
center hole, Btu hr-’ in.-’ (OF)-’
outer surface, Btu hr-’ in.” (OF)-’
5.9.2 Flow and Temperatures in Radial Reflector
Determination of reflector temperatures is important because of their relationship to graphite life, amount and temperature of coolant required, and stored energy during afterheat removal. The relationship between life, damage flux, and temperature is shown in Fig. 5.11. For a given nuclear design there is a maximum allowable temperature for any reflector section which is intended to remain fixed in position for the design life of the reactor. Conversely, a temperature distribution calculated for given reflector geometry and coolant

68
conditions may dictate a reduction in the incident damage flux, even though this entails a departure from optimum nuclear conditions. (This compromise was necessary in the present design, as discussed in Sect. 5.3.) The amount and temperature of coolant are interdependent. The major part of the coolant tempera- ture rise is due to its own internal fission heating, and it is desirable to have each unit volume of salt experience the same plenum-to-plenum temperature rise. On the other hand, the need for improved heat transfer coefficients or lower sink temperatures may dictate a higher flow rate than that required to attain this rise.
A reflector design using graphite blocks averaging about 1 ft3 in size was rejected when analysis indicated excessive temperatures. The principal cause was fission heat from trapped interstitial salt. This heat had to be transferred to a cooled surface by conduction, which required large temperature gradients. A conclusion was that regions of static salt must be avoided everywhere within the reactor vessel. With the elimination of internal fission heat, the sources in the reflectors would consist only of photons leaking from adjacent blanket regions and from neutron slowing down, as indicated in Fig. 5.15.
The present radial reflector design, shown in Figs. 5.4 and 5.5, has been analyzed using the Astra HEATING code, employing a three-dimensional relaxation tech- nique with constant thermal conductivity. Boundary temperatures were based on the fluid temperature required at a given location for an overall 250'F rise plus an increase in wall temperature from the volu- metric heat source in the fluid. In most analyses performed, the fission heating in the salt far exceeds the heat transferred into it from the graphite. Hence the conduction problems have been treated with fmed boundary conditions rather than having to couple the salt and graphite by an energy balance. Heat transfer coefficients were based on laminar flow between graphite segments and between reflector and vessel, but on turbulent flow at the reflector-blanket boundary in the 2-in.-wide annular space between the reflector and the removable core assembly. Results at the axial midplane are shown in Fig. 5.1 6. This is the location of the peak damage flux, which has been 'constrained to about 4 X 1OI3 to achieve design life with the calculated 1250'F surface temperature. The effect of damage flux decrease with distance into the reflector overrides the effect of increasing temperature on the graphite life. Similarly, the axial decrease in damage flux is sufficient to counteract the increasing surface temperature, which reaches a peak several feet above the midplane.
Our studies indicate that to meet the heat-removal requirements and the other objectives discussed above, the flow of salt through the reflector graphite must be in the radial direction rather than vertically upward, as it is in the core. In large part this is due to the fact that the thermal coefficient of expansion of Hastelloy N is greater than that of the graphite. The reflector graphite could be restrained into essentially its room-tempera- ture geometry with little change in the flow channel geometry, but the expanding vessel would draw away from the reflector and increase the salt volume in the annulus between the vessel wall and the graphite. This would result in an undesirable increase in the primary- salt inventory. We therefore decided to restrain the reflector graphite to maintain its position relative to the wall and let the flow passages in the graphite open up as the system is brought up to temperature. With an increase in the width of the flow channels in the reflector graphite, axial flow passages for the reflector
u c - c .
ORNL-DWG 69-60t3
0.8
0.7
0.6
0.5
0.4 c
c Q
L
0 L W
.- n
% 0.3 E
n
s - 0
04 -
:OB625 expf-O.0945X) 0 :
0 (0 20 30 40 50 60 DISTANCE FROM INNER FACE OF REFLECTOR (cm)
Fig. 5.15. Heating in MSBR Radial Reflector at Mid-Height.
. L
.

69
(z W a
1250
1200
ORNL-DWG 69-6044
0.5 1.0 1.5 2.0 2.5 3.0 RADIAL DISTANCE THROUGH REFLECTOR ( f t
Fig. 3.16. Temperature Distribution in MSBR Radial Reflec tor at Mid-Height.
cannot be defmed. Connecting the reflector flow passages, the annular space at the vessel wall, and the annular space between the reflector and the removable core to common plenums located at the upper and lower ends of the reflector is not satisfactory. There would be inadequate axial flow through the reflector if the pressure difference was limited to the amount necessary to get the desired temperature rise for the salt flow through the annular space. On the other hand, there would be excessive salt flow through the annular spaces if this pressure difference was increased to get the necessary flow through +e reflector region. The use of radial flow circumvented this design difficulty.
We decided to have the salt in the reflector flow inward toward the core in order to minimize the vessel wall temperature and because of orificing considera- tions. The annulus between the core and reflector is orificed at the bottom because of mechanical assembly considerations and because this annulus serves as the collection plenum for the radial flow through the reflector. Salt flow from the undermoderated region of the core into the annulus is restricted by graphite rib seals located between the graphite slabs in the under- moderated region, zone 11. Axial distribution of the radial flow through the reflector is controlled by orifices located at the inlets of the radial flow passages. Analysis of flow in this region of the reactor is continuing.
5.9.3 Flow and Temperatures in Axil Reflectors
The axial reflectors are subjected to a 66% higher peak damage flux than the radial reflector. However, the lower one is replaced with the moderator, and the upper one must last only half of design life due to the alternate use of two heads. Hence temperature and damage flux considerations are not as stringent as in the
radial reflector. The upper reflector was analyzed using the Astra HEATING code. The axial behavior of the source is shown in Fig. 5.17. The radial variation was described by a cosine. The inner face is subjected to 1300'F salt. The other faces are in contact with somewhat cooler salt which is transported from the reactor inlet, via the control region and lifting rod tubes, to provide a low-temperature sink for the vessel head. On the above basis, the peak temperature was found to be 1363'F, and the surface temperature in the region of peak damage flux is 1265'F. This corresponds to a 20-year graphite life. The lower reflector graphite is cooled on all faces by salt at a temperature only slightly above inlet conditions. This results in a peak tempera- ture in the lower reflector of 1165'F.
A flow of fuel salt is provided for cooling the axial reflectors in much the same manner as for the radial reflector graphite. The flow through the lower axial reflector will be upward, while that through the upper axial reflector will be downward. The salt for the lower reflector is taken from the reactor inlet flow, and it is used to cool the lower head of the vessel and the graphite support plate as well as the axial reflector graphite. The fuel salt for cooling the top head and graphite is brought upward through the control rod region at the center and through the core lifting rod holes in zone 11, previously mentioned. This relatively
2.0
1.0
c c u E
0.5 c
3 Fi
0.2
ORNL- DWG 69- 60!5
0.1 0 10 20 30 40 50 60
DISTANCE THROUGH AXIAL REFLECTOR (cm)
Fig. 5.17. Gamma and Neutron Heating in MSBR Axial Re- flectors.

70
cool salt is used to remove the heat deposited in the upper head and in the upper axial reflector graphite.
5.9.4 Vessel Temperatures
Analysis of the 2-inAhick vessel wall indicates a peak temperature of 1 1 54'F, occurring at the outer surface at the axial midplane. No credit was taken for heat transfer from the outer vessel surface to the primary cell. A constant salt temperature of 1 lOO'F was used in the vessel wall coolant passage. The basis for this is the very low fission density in the passage. Hence, with radial flow in the reflector and with the flow rate sized to give an overall 250'F rise, most of the salt temperature rise will occur over the inner few inches of the reflector and in the annulus between the reflector and core zone II. The effect of gamma radiation from the heat exchangers on vessel temperature has not been included. Locally hot areas of the vessel and heads, such as the region around the outlet nozzles and other areas bathed by 1300'F salt, have not been analyzed. Temperatures within a few degrees of the salt tempera- tures are to be expected in these regions. If the calculated stress intensities are too high, a method of shielding the surfaces from the hot salt may be required.
Analysis of the 3-in.-thick upper head indicates that temperatures are on the order of 1120 to 1180'F along the outer surface. This is based on an llOO'F salt temperature on the inner face. At the junction of the hemispherical and cylindrical sections, there is a small region where temperatures approach 1300'F due to the contact with hot salt on the inner surface. This region also coincides with the location of maximum stress intensity and is therefore of concern. Analyses of modified head designs which will result in lower stress values are presently in progress.
The lower head has a reduced incident gamma flux due to the shielding provided by the lifting plate and other structure. It is cooled by salt at inlet conditions, and the combination of these two factors ,yields maximum temperatures less than 1100'F. Because it is larger in diameter than the upper head, is of different geometry, and must withstand a higher pressure, the lower head has a maximum stress intensity about twice that of the upper head. This occurs at the junction with the cylindrical wall section. Present stress analysis indicates that, with the temperatures calculated, this maximum is allowable by a small margin. Stress analysis is continuing, and additional results will be reported in the hture.
5.10 ESTIMATED COSTS OF 1000 Mw (ELECTRICAL) MSBR POWER STATION
LJ R. C. Robertson *
The last published cost estimate for a 1000 Mw (electrical) MSBR power station was in the fall of 1968.18 We have revised this estimate to more nearly represent early 1969 conditions. The total estimated construction cost is given in Table 5.8 and the power generation cost in Table 5.9. The cost of the chemical processing plant is not included in the capital costs given in Table 5.8; it is added into the fuel cycle cost in Table 5.9.
The estimated construction costs are now higher because of an average escalation of costs of about 5% since the late 1968 estimate and because the conceptual
0 .
"Internal memorandum from Roy C. Robertson, "Com- parative Costs of PWR and Single-H~d MSBR lOOO-Mw(e) Power Stations," Nov. 19,1968.
Table 5.8. Estimated Construction Cost of lo00 Mw (Electrical) MSBR Power Station
Cost (millions of dollars)
MSBR PWR
Structures and improvements Reactor
Vessel Graphite Shielding and containment Heating and cooling systems Control rods Cranes
Heat transfer systems Drain tanks and fuel handling Waste treatment and disposal Instrumentation and controls Feedwater supply and treatment Steam piping Remote maintenance equipment and other Turbinegenerator plant equipment Accessory electrical equipment Miscellaneous
Total plus 6% allowance for 54-hr week Total plus 3% local sales tax Total plus 33.5% indirect costs
11.5 15.9
5.9 8.0 6.0 3.1 a 1.3 . 4.1 1 .o 2.0 0.2 0.2 22.2 20.4 4.3 2.0 0.5 0.5 4.1 4.1 5.2 3.9 5.6 5.7 6.6 1.0
25.0 36.9 5.2 5.2 1.4 1.3 109.1 110.7 115.6 117.3 119.1 120.9 159.0 161.3
--
OPWR shielding costs are included in the structures account.
. I
L

W .1 .
E .
t
- .
Table 5.9. Estimated Power Production Cost in 1000 Mw (Electrical) MSBR Station
Mills per Kilowatt-Hour
Plant capital cost! 3.1
Fuel cycle cosf 0.5 0.3 Operating cost
Total 4.0
~ n p h i t e replacement cos@ 0.1
-
"Based on fixed charges of 13.7% and on 80% plant factor. bBased on four-year graphite life and a graphite cost of
qncludes fued charges and operating costs of the chemical $10.00 per pound.
processing plant.
design of the reactor also increased in size. The combined effect is for the reactor (plus associated indirect costs) to cost about $5 million more than in the previous estimate.
Other important cost increases are due to the in- clusion of the effect of a 54-hr work week and adding a 3% sales tax charge. The first of these increased the construction cost by about $6.5 million and the latter by about $3.5 million.
The estimated costs given here are based on the 1969 value of the dollar and therefore do not include a factor for escalation of prices during a construction period. This is a very substantial expense item that must be added to the construction cost of a plant. It can amount to about 14.5% additional cost, or around $20 million for an MSBR, for a five-year construction period, if escalation continues at the present rate of more than 4%/ year.
An important assumption in making MSBR cost estimates is that the costs apply to an established molten-salt reactor industry. This is to say that there is a proven design, development costs have largely been absorbed, and the manufacture of materials, plant construction, and licensing have become routine.
About one-half of the total cost is for more con- ventional parts of the plant, such as structures, turbine- generators, and associated equipment, and these costs are relatively well established. The reactor costs are less certain because of the preliminary nature of the conceptual design and use of Hastelloy N and special graphite for which there is limited experience in large-scale production.
We feel that the estimated MSBR costs have more relevancy if they are used on a comparative basis rather than as absolute values. Table 5.8 therefore includes the
71
costs of a PWR station19 estimated under the same set of ground rules used for the MSBR. Whereas the molten-salt reactor included relatively large allowances for the drain tanks and maintenance equipment, this is offset by savings of about $17 million over the light-water reactors for the heat-power system equip- ment as a result of using high-pressure, high-tempera- ture steam. On the basis of these estimates we believe that the construction costs of an MSBR station and a light-water reactor station would not be greatly different.
The estimated power production costs given in Table 5.9 assume a fxed charge for capital for a privately owned plant of 13.7%. The cost of replacing the graphite every four years is included as a production expense, as is the interest on the cost of the capital set aside to cover future replacements. As shown, the favorable power cost of an MSBR is largely due to the low fuel cycle cost.
5.1 1 MSBE DESIGN J. R. McWherter C. W. Collins W. Terry
5.1 1.1 Introduction
Some conceptual design studies were initiated on the MoltenSalt Breeder Experiment (MSBE). Some of the objectives follow:
1. The plant shall be a facility for testing materials, components, systems, and methods at conditions as near those of the MSBR as practical.
2. The reactor shall have the capability for exposing segments of proposed full-size MSBR core graphite elements at a fast e 5 0 kev) neutron flux of 5 X 10I4 neutrons cm-2 sec-' in primary salt at temperatures u p to 1300'F.
3. The primary- and secondary-salt compositions shall be essentially the same as proposed for the single-fluid MSBR. Differences should be limited to those which would not significantly alter the chemical or physical properties of the salts.
4. The design power level for the reactor shall be in the range of 100 to 200 Mw (thermal). A conversion ratio near 1 .O is desirable but not essential.
5 . The design of the plant should be similar to that proposed for the MSBR. Where practical, the MSBE primary system components shall be similar in design to
"~nterna~ communication to J. A. Lane from R. C. Olson, Feb. 18, 1969, based on: J. A. Lane, M. L. Myers, and R. C. Olson, Power Plant Capital Cost Normalization, ORNL- TM-2385 (to be published).

72
T
4 1
11
t 7 % L it 6 in
. .-
in.
- _.
END
'E
d e f t sin. ID I Fig. 5.18. Vertical Section Through MSBE Reactor Vessel.
ORNL-DWG 69-6016
. *
SPECIMEN ACCESS
c
0

bd * . *
t
. t
.
t
.
.. &id
73 S I
those proposed for the MSBR and of a size that can be scaled up for use in demonstration plants. The chemical processing of the primary salt shall be done by processes proposed for the MSBR and with equipment of a size which can be scaled up to that for the MSBR.
6. The maximum operating temperatures and, where practical, the temperature differences in the MSBE shall
be the same as those of the MSBR. Thermal energy shall be transferred from the primary salt to a secondary salt, from which it will be removed by steam generation at proposed MSBR conditions. Generation of electricity with the steam is not required. 7. Maintenance techniques and procedures proposed
for the MSBR shall be used where practicable in the
ORNL- DWG 69-6017
Fig. 5.19. Horizontal Section Through Core of MSBE.

74
MSBE. Facilities shall be provided for examining components that are removed from the MSBE.
5.1 1.2 Description of Reactor Plant
The core configuration under study will meet the above requirements at a power level of 170 Mw (thermal) (see Sect. 6.2 for physics analysis). It consists of a large number of 4-in~quare graphite bars arranged vertically in a 4-ft-diam assembly. The middle section of the bars is 5 ft long and has 20% of its nominal cross sectional area open for salt flow. There are l'&-ft-long axial extensions at each end with the cross section reduced so that the salt occupies ~ W O of the end regions. This assembly is contained in an !13/4-ft-diam spherical vessel with the radial region between the 4-ft cylindrical array and the vessel completely filled with salt.
A vertical section through the reactor core is shown in Fig. 5.18. Primary salt (71.5 mole % LiF, 16 mole % BeFz, 12 mole % ThF4, 0.5 mole % UF4) enters the bottom of the reactor vessel and flows through the core as indicated schematically in the figure. No hydraulic analyses of the core have been made. Four control rods
with magnetic drives are indicated, although the control u rod requirements have not been determined. A 6'/4-ft- diam extension at the top of the vessel with a removable vessel top head is proposed. This arrange- ment would permi3 removal of all the graphite, which is positioned by a lower structure supported by rods attached to the vessel top head. The four central . graphite bars can also be removed independently through a central access opening in the top head.
The graphite arrangement is shown in Fig. 5.19, a horizontal section of the core. The outer elements will be fured in position at top and bottom, but the tongue-and-groove joints in the outer elements will permit some circumferential movement without ex- cessive cross flow through the gap.
A conceptual floor plan of the reactor building is shown in Fig. 5.20. There are separate cells for the primary-salt components, the secondary-salt steam generators, the off-gas processing system, and chemical processing plant. A hot cell for dismantling and evaluation of radioactive components will be provided. All of these cells will be housed in a concrete building with an overhead crane.
Maintenance procedures are incomplete, but it is assumed that a shielded carrier on rails with a closed
. . I
ORNL-DWG 69-6048
L _ _ _ _ _ _ _ _ _ _ _ _ _ _ _ _ _ _ _ _ _ _ _ _ J
Fig. 530. Plan of MSBE Reactor Building.
. 1.

75
46 f t
cad
t
0
. t
c
le,
atmosphere can be used to move the graphite specimens or the entire top-head-and-graphite assembly to the hot .cell.
Figure 5.21 is a schematic vertical section through the reactor cell and the steam generator cell.
The primary salt enters the heat exchanger at 1300°F and leaves at 1050°F. The secondary salt enters the heat exchanger at 850°F and leaves through a con- centric outlet at 1150°F. The secondary salt is used to generate steam at 1000°F and 3600 psia.
ORNL-DWG 69-6049
60 ft 0 in. i
SECONDARY PUMP
0 in.
I
Fig. 5.21. Elevation Section Through Reactor and Coolant Cells.

. *
6. Reactor Physics A. M. Perry
6.1 PHYSICS ANALYSIS OF MSBR
6.1.1 Optimization of the MSBR H. F. Bauman
The main factors considered in the optimization of MSBR nuclear designs have been, for some years, the fuel-cycle cost and the annual yield (fractional increase) of bred fuel. However, it has been recognized for some time that the fuel yield (or its inverse, the doubling time) does not fully take into account the influence of fuel specific power in determining the overall amount of natural uranium that will be required to supply an expanding nuclear power economy. It can easily be shown, for a linearly increasing power demand, that the required cumulative input of fissile material into the system, up to the time when the system becomes self-sustaining, varies inversely as GS2 , where G is the breeding gain (breeding ratio minus 1) and S is the specific power in terms of the entire fuel inventory chargeable to the system.
No responsible projections of nuclear power capacity, of course, indicate a linear increase at any time within the next few decades. We observe, however, in compar- ing the resource requirements for various postulated reactor characteristics (i.e., inventory and doubling time) that the product GS2 gives a better indication of the fuel input requirements than does the doubling time or yield (which is proportional to GS). The quantity 100GS2, [Mw (thermal)/kg]’, we haye called the fuel “conservation coefficient.”
In view of these considerations we have modified the figure of merit used in optimizing MSBR designs to allow, optionally, the achievement of maximum con- servation coefficient rather than maximum .yield or maximum breeding ratio; we have used this option in all of our recent calculations. Indeed, the breeding ratio that results from optimizing an MSBR with respect to the conservation coefficient is typically about 0.01 lower than results from optimizing for yield, but the
fuel inventory is also lower. That is, if a reactor optimized for yield has a breeding ratio of 1.07, the modified reactor, reoptimized for the conservation coefficient, would have a breeding ratio closer to 1.06 but would still be judged the better reactor in terms of the objectives of breeding.
The objective function of the ROD’ optimization is in the form of a polynomial. This allows great flex- ibility in the selection of factors which will influence the optimum; new terms can be added easily, while terms that are no longer being used can be given zero coefficients. Two terms are employed in the current optimizations: the conservation coefficient, already defined, with a weighting factor of 10, and the damage flux factor, with a weighting of 1. The damage flux factor is computed by ROD as follows. The maximum group 1 (fast) flux is selected by scanning the core. If this flux does not exceed a preselected input flux, the flux factor is 0. If the input flux is exceeded, the difference is divided by then squared, and multiplied by -1. This gives a term which subtracts from the objective function when the damage flux exceeds the desired value. The use of the flux factor not only permits the user to investigate designs with a predetermined core life, but also tends to drive the optimization toward designs with a low peak fast flux.
The convergence requirement on the ROD calculation is particularly stringent when ROD is used for optimiza- tion. The “derivative” calculations, which determine the direction in which the optimization proceeds, are based on a pair of ROD cases which differ by a small increment in the value of the variable considered. Small convergence errors which would be negligible in indi- vidual cases can cause serious errors in the derivatives. The convergence of the diffusion calculation in ROD has been particularly slow and difficult since multiple
i
.
>
u ‘Reactor Optimization Design program; see ORNL4344, p. 68.
76

W t . t .
- . *
z
P
.
. *
W
77
thermal groups with slow-neutron upscatter have been introduced. An upscatter convergence acceleration tech- nique has been adapted for use in ROD and has helped to obtain adequate convergence in a reasonable time. There are still ROD cases that run for several hundred iterations, however, and other convergence acceleration methods are being investigated.
6.1.2 The One-Fluid MSBR Reference Design
H. F. Bauman
The nuclear design studies of the one-fluid MSBR are continuing; however, enough has been learned about the characteristics of the one-fluid system to permit the selection of a reference design which will be the basis of a forthcoming design report. The important data for the reference design are given in Table 6.1. Some of the studies which led to the selection of the reference design are presented in the following section. The performance figures are somewhat higher in the prelimi- nary studies than in the reference design, mainly because the studies were based on an assumed value for the fuel salt inventory, external to the regions being optimized, that proved to be somewhat low.
The reference design has been modified slightly from the optimum design based solely on the conservation coefficient. The conservation coefficient could, in fact, be about 10% higher than that of the reference design. The benefits of the following three modifications were considered to balance this decrease in performance.
The first modification is the extension of the core life. The core was made larger and with a flatter flux, increasing the nominal graphite life from the optimum of 2.4 years to about 4 years. As will be shown in the following section, this costs very little in nuclear performance and should have significant economic advantages.
Second, the reflector thicknesses are less than opti- mum by about a foot, to reduce the size and capital cost of the reactor vessel.
Third, the thickness of radial core zone 2 was increased by about 6 in. to reduce the fast flux at the face of the reflector. This gives a nominal reflector life of 30 years and eliminates the need for scheduled replacement of the reflector.
6.1.3 Nuclear Design Studies
H. F. Bauman
The reflector has two important effects in the one-fluid MSBR design, namely, the reduction in
neutron leakage and the flattening of the power distribution. The power-flattening effect is particularly important since it can extend the core graphite life without any sacrifice in average power density or specific inventory.
The effect of the radial reflector thickness on the MSBR performance is shown in Fig. 6.1. (The effect of axial reflector thickness is similar but, as would be expected from the geometry, about half as great.) The reactor design was similar to the reference MSBR
Table 6.1. Characteristics of the One-Fluid MSBR Reference Design
A. Description
Identification Power, Mw (electrical) Power, Mw (thermal) Plant factor Dimensions, ft
Core zone 1 Height Diameter
Axial: Core zone 2 Region thicknesses
Plenum Reflector
Annulus Reflector
Radial: Core zone 2
Salt fractions Core zone 1 Core zone 2 Plena Annulus Reflector
UF4
BeF2 LiF
Processing cycle times for removal of poisons 1. KrandXe,sec 2. Se, Zrf Nb, Mo, Tc, Ru, Rh, Pd, Ag, Sb,
and Te, sec 3. Pa, Cdf In: and Snf days 4. Y, La, Ce, Pr, Nd, Pm, Sm, Eu, and Gd, days 5. Cs and Ba, years
6. B f and If days
Salt composition, mole %
ThF4
CC58 1000 2250 0.8
13.0 14.4
0.75 0.25 2.0 1.25 0.167 2.5
0.132 0.37 0.85 1.0 0.01
0.228 12 16 72
20
20 3 50 5 5

78
Table 6.1 (continued)
B. Performance
Conservation coefficient, [Mw (thermal)/kg] Breeding ratio Yield, % per annum Inventory, fissile, kg Specific power, Mw (thermal)/kg Doubling time, system, years peak damage flux, neutrons sec-'
Core zone 1 (E >SO kev) Reflector (E >SO kev) Vessel (E > 0.8 MeV)
Power density, w/cm3 Average Peak Ratio
Core zone 1 Core zone 2 Annulus and plena Reflector
Fission power fractions by zone
C. Neutron Balance
D " n q -1 Neutron (atoms barn a n ) Absorptions
15.1 1.064 3.34 1470 1.53 20.7
3.2 x 10¹⁴ 4.2 x 10¹³ 1.3 X 10"
22.2 65.2 2.94
0.765 0.167 0.056 0.012
Neutron Fissions Captures (Including n, 2n)
Fuel salt (core volume fraction 0.1 32)
2 3 3 ~ a 3.91 E -7 0.0017 0.0017 3.72 E -3 0.9889 0.9859 0.003 1
6.49 E -5 0.9248 0.1001 0.8247 2.29 E -5 0.0809 0.0805 0.0004 5.88 E -6 0.0752 0.0140 0.0612
2 3 Z n
233u
234u
2 3 S U
2 3 6 ~
237Np 9Be ' ~ i Li
F
Moderator (core volume fraction 0.868) Graphite
Fission products Delayed neutrons lost Leakage
Sum (VI
6.05 E -6 0.0085 0.0084 6 .511 -7 0.0059 0.0059 4.96 E -3 0.0071 0.0025 0.0046 2.22 E -2 0.0160 0.0160 1.25 E -7 0.0023 0.0023 4.74 E -2 0.0206 0.0206
9.53 E -2 0.0522 0.0522 0.0196 0.0196 0.0032 0.0032 0.0244 0.0244
2.2316
4According to our present flowsheet 21, Cd, In, and Sn are removed on a 200-day cycle and Brand I are removed on a 5O-day cycle. The effect on the longer cycle time on the breeding gain is negligible.
W
a
I)
3
e . S
?

79
NO AXIAL REFLECTOR
6-s e
* .
a
ORNL-OWG 69-5484
Fig. 6.1 Effect of Radial Reflector Thickness and Salt Frac- tion in Core Zone 2 on MSBR Performance. .
*
W
except that a peak power density corresponding to a 2.25-year core life and a somewhat smaller external inventory of salt were assumed. The reactor perform- ance improves markedly with reflector thickness out to about 3 ft and then begins to level off.
Figure 6.1 also shows the effect of the salt fraction in core zone 2 for two cases: all salt and 37% salt, which is the salt fraction corresponding to a random-packed bed of spheres. The zone thickness was allowed to optimize in each case. The 37% salt case is clearly superior, although the effect is rather small considering the large difference in salt fraction.
The effect of the reflector salt fraction on the reactor performance was investigated in the series of cases given in Table 6.2. These cases are very similar to the reference design except that a lower external inventory of salt was assumed. A case with no reflector is included for comparison.
The effect of salt in the reflector is to increase the neutron leakage and the fissile inventory, both of which decrease the performance. The reactor performance is most sensitive at very low reflector salt fraction, rising sharply as zero salt fraction is approached. For the designer this implies that the more successful he is in
reducing the reflector salt fraction, the greater the incentive becomes for further reduction. Notice, how- ever, that even in the case with as much as 4% salt in the reflector, the performance was much better than in the no-reflector case. Power peaking was particularly severe in the no-reflector case.
The reflected reactor has the disadvantage of a secondary power peak at the core-reflector interface. An analysis of the temperature and damage flux in this region for an optimum case indicated that the expected life of the graphite near this interface might be about half the desired 30 years. While it is possible to design the reflector so that the graphite could be replaced at infrequent intervals, it seemed desirable to avoid such a major remote maintenance requirement. It was noted that the flux at the reflector face was quite sensitive to the thickness of zone 2 (and the annulus). The thickness of zone 2 was increased to 1.25 ft in the reference design in order to achieve a ~ominal reflector life of 30 years.
The effect of xenon in a typical reflector was also studied. It was shown that xenon at an atom density of 9 X IO-' atoms barn-' cm-' , the estimated reflector - concentration in a graphite with no resistance to xenon diffusion, had a negligible effect on the performance of the reactor (i.e., about a 1% decrease in the conserva- tion coefficient). The effect on the damage flux in the reflector was also negligible. It was shown that about half the neutrons absorbed in xenon in the reflector would have been lost as increased leakage had the xenon not been present.
The absence of a significant effect of xenon in the reflector may have an appreciable indirect effect on the reactor performance. Since the reflector graphite need not be impermeable to gases, it can be manufactured in larger blocks, permitting a lower salt fraction in the reflector.
The possible effects of flux shaping on the perform- ance of the MSBR were also studied. The flux-factor technique described in Sect. 6.1.1 was used to restrain the peak flux in the ROD optimization in the series of cases given in Table 6.3. In these three cases in spherical geometry, the first was run with no restraint on the damage flux and the next two with increasing restraint on the damage flux. The results showed that a considerable improvement in the graphite life could be obtained with only a minor decrease in the reactor performance.
These results were so encouraging that a similar peak flux restraint was applied to subsequent cases in cylindrical geometry, including the reference design and the cases in Table 6.2. The reactor fissile inventory is

80
Table 6.2. Effect of Reflector Salt Fraction on MSBR Performance
hd Fixed parameters: Salt fraction:
Core height, ft 13 Core zone 2 0.37 Thickness of plena, ft 0.33 Plena 0.85 Power, Mw (electrical) 1000 Annulus 1 .o Power, Mw (thermal) 2250 Mole %thorium 12 Plant factor 0.8
Case 1, Case 2, Case 3, Case 4, No Reflector, CC40-44 CC4142 CC42-42 CC44-45 CC46-39
Reflector salt fraction Conservation coefficient, [ Mw (thermal)/kg] '
Breeding gain, % Yield, % per annum Inventory, fissile, kg Specific power, Mw (thermal)/kg Neutron leakage, %/fissile a b . Dimensions, ft
Core zone 1, radius" Thickness, core zone 2
axial radiaP
Thickness, annulup Thickness, axial reflectof Thickness, radial reflectof
Salt fraction, core 1" Salt volumes, ft3
Core 1 Axial zone 2 + plena Radial zone 2 + annulus Reflectors
Total internal Total system
Power density, w/cm3 Average Peak Ratio
Graphite life: years
0.00 18.95
5.85 3.56 1250 1.80 1.29
7.14
1 .o 0.92 0.083b 4.0b 4.0b 0.134
279 235 308 0 821 1398
24.4 64.0 2.63 3.7
0.01 16.42
5.40 3.18 1290 1.74 2.26
7.17
1 .o 0.82 0.131 2.46 3.28 0.131
275 234 317 52 877 1454
24.5 63.0 2.57 3.7
0.02 15.41
5.47 3.11 1340 1.68 2.74
7.14
1 .o 0.89 0.142 2.58 2.59 0.131
273 234 343 86 936 1513
24.2 63.6 2.63 3.7
0.04 14.08
5.50 2.98 1406
3.26 8 1.60
7.38
1.0 0.90 0.100 2.41 2.13 0.1 34
297 250 324 146 1017 1594
23.0 60.2 2.62 3.9
11.36
6.15 2.83 1656 1.36 3.48
8.07
1.33" 1.58 0.083b 0.0 0.0 0.137
364 372 591 0 1326 1903
16.3 64.3 3.94 3.75
"Optimized. %nit. cAllowable fluence 3 X 10" nvt, E >SO kev.
increased by about 5% in extending the core life to about 4 years from the optimum of 2.4 years.
6.1.4 Optimum Thorium Concentration in MSBR W. R. Cobb
Calculations to determine the optimum ThF4 mole fraction in the fuel salt of a single-fluid MSBR were previously reported? Changes in the reactor design, in the BeFz mole fraction in the salt, and improvements in the computational methods have prompted a reexami-
. f
8
nation of the question. The previously report d results were suspect because of the known limitations of the code OFTIMERC3 and because the same cross sections were used for every salt considered.
In the series of calculations described below, the code ROD, an improved version of OPTIMERC, was used to
20. L. Smith, W. R. Cobb, and H. T. Kerr, MSR fiognzm
30. L. Smith, W. R. Cobb, and H. T. Kerr, MSR Rognzm
m
1
v
Semiann. Progr. Rept. Feb. 29,1968,0RNL4254, p. 68.
Semiann. Progr. Rept. Aug. 31,1968,0RNL-4344, p. 68.

81
Table 6.3. MSBR Performance vs Graphite Life (Spherical Geometry).
Fixed parameters: Salt fractions:
Reflector thickness, ft 3.0 Core zone 2 0.37 Mole % thorium 12 Reflector 0.005 Power, Mw (electrical) 1000 Power, Mw (thermal) 2250 Plant factor 0.8
Case 1, case 2, CFlOA-7 CFl3-27
Graphite life: years Damage flux, l O I 4 neutrons cm" sec-' Conservation coefficient, [Mw (thermal)/kg] Breeding gain, % Yield, % per annum Inventory, fissile, kg Specific power, Mw (thermal)/kg Dimensions, radial, ft
Core zone lC Core zone zc
Total core (1 + 2) Salt fraction, core IC Peak power density, w/cm3
2.4b 4.8 18.9 5.60 3.49 1224 1.84
6.50 2.04 8.54 0.130 98.2
3.9 2.9 18.0 5.70 3.43 1266 1.78
8.14 1.43 9.57 0.129 59.8
Case 3, CF16-14
5.2 2.2 16.6 5.66 3.28 1314 1.71
9.14 1.10 10.24 0.131 44.7
' =Allowable fluence 3 X 10" nvr, E>50 kev. boptimum with no restraint on damage flux. qarameter optimized.
determine the optimum design for the three reactors having salt compositions 74-16-10, 72-16-12, 70-16-14 (mole % LiF-BeF2 -ThF,). The starting point for these three optimizations was an MSBR configuration very similar to the present reference design, but with a two-year graphite life. Each reactor was optimized with respect to five variables: core height, core radius, axial blanket thickness, radial blanket thickness, and core salt volume fraction. The optimum core salt volume frac- tions and the corresponding equilibrium nuclide con- centrations for each reactor were then used to generate new cross sections appropriate for each case. For each reactor considered, three sets of cross sections were used, one each for the core, blanket, and plenum regions. The three reactors were then reoptimized using their respective cross sections, the starting estimates for the five variables being the results of the previous optimization. This procedure was continued until the differences between values of the optimized variables in two successive optimizations were less than 2%.
Characteristics of the three optimum designs are summarized in Table 6.4. Some quantities of interest are shown in Fig. 6.2. The breeding gain increases with
ORNL-DWG 69-5485
0.062
z 8 0.058 5
a m
I3
0 0.054
0.050 IO (2
mole % ThF4
Fig. 6.2. MSBR Performance vs ThFs Mole % for Optimum Reactors.

82
Table 6.4. Optimum Reactor Designs with Different Salt Compositions
b;
Fuel salt, mole % LiF-BeFz-ThF4 Core height, f p Core diameter, ft? Radial blanket thickness, ft? Axial blanket thickness, f p Radial reflector thickness, ft Axial reflector thickness, ft Core salt fractiona Radial blanket salt fraction Axial blanket salt fraction Reactor power, Mw (thermal) Average power density, w/cm3
3 Maximum power density, w/cm Graphite replacement life, years Specific fuel inventory, kglMw (electrical) Breeding ratio Annual fuel yield, % per year Conservation coefficient
74-16-10 9.75 11.2 2.5 2 1.45 3 .O 2.0 0.137 0.37 0.37 2250 29.4 97.3 2.1 1.23 1 .05 1 3.18 17.19
72-16-12 9.8 11.1 2.20 1.19 3.0 2.0 0.121 0.37 0.37 2250 33.14 106.3 1.9 1.26 1.055 3.35 17.65
~~
70-16-14 11.7 11.5 1.89 0.91 3.0 2.0
,0.114 0.37 0.37 2250 33.5 101.6 2.0 1.33 1.060 3.42 17.05
I . .I
"Variables allowed to optimize.
increasing thorium (and hence fuel) concentration, over the range shown, primarily because of reduced parasitic neutron captures in the salt and in the moderator. This increase is achieved, of course, at the expense of a larger fuel inventory. The yield also increases, but more slowly than the breeding gain, because of the increase in fuel inventory.
The conservation coefficient4 first increases because the breeding gain increases faster than the square of the specific power decreases. Above 12 mole % ThF4 the inventory rises so rapidly that the decreasing specific power dominates and causes the conservation coef- ficient to decrease.
From these results it is seen that, with the conserva- tion coefficient as the figure of merit, the best salt composition is at or near 12 mole % ThF4.
It is interesting to compare this conclusion with that previously obtained using the annual fuel yield as the figure of merit. Those results indicated that the yield continued to increase as the ThF4 concentration was increased above 12%. The 12 mole % salt was chosen primarily because salts with higher thorium concentra- tions had poorer heat transfer properties and because separation coefficients in the reductive extraction of rareearth fission products appear to be somewhat better with the lower thorium concentration. With the figure of merit in which the square of the specific power appears there is a definite nuclear optimum at 12 mole % ThF4.
6.1 .S Improvements in Computational Tools W. R. Cobb
Two recent code developments have contributed to increased accuracy and decreased cost of routine design calculations for the MSBR.
The preparation of group constants formerly done by the code TONG on the IBM 7090 is now accomplished by the code XSDRN' on the IBM 360/75 (or 360/65). XSDRN is a one-dimensional discrete-ordinates (S,) code combined with the code NIT, which calculates fme-group constants from resonance parameters by the Nordheim integral treatment. XSDRN cell calculations employ 93 fast groups and 30 thermal groups. From the XSDRN fluxes and 123-group data library, broad-group constants for 5 fast and 4 thermal groups are prepared for use in CITATION and ROD (reactor optimization) calculations.'
Multigroup two-dimensional diffusion calculations for MSBR and MSBE design, formerly done with the code EXTERMINATOR-2,6 are now being done with the
e
.
- 4Breeding gain times square of specific power. . 'N. M. Greene, W. W. Engle, and C. W. Craven, Jr., XSDRIV:
A Discrete Ordinates SpectnzZ Averaging Code, ORNL-TM-2500 e
(to be published). W
'T. B. Fowler, M. L. Tobias, and D. R. Vondy, EXTER- MINATOR-2: A Fortmn IV Code for Solving Multigoup Neutron Diffusion Equations in Two Dimensions, ORNL-4078 (April 1967).

83
u . . t .
e
1 -
t
. IL
. LJ
recently developed code CITATION? Refinements in mesh representation and convergence accelerating tech- niques in CITATION make typical nine-energy-group, two-dimensional calculations run three to four times as fast as with EXTERMINATOR.
Also, because of differences in input format as compared with EXTERMINATOR, CITATION more conveniently allows use of multiple sets of cross sections for a particular nuclide. It is especially impor- tant to use * U and thorium cross sections which are appropriate to the energy spectra in the core and blanket respectively.
6.1.6 Gamma and Neutron Heating in MSBR 0. L. Smith J. T. Ward
Gamma and neutron heat sources in the one-fluid reactor, vessel, and thermal and biological shields were calculated using gamma and neutron transport tech- niques based on the ANISN transport code. In these calculations the standard handbook recipes were specifi- cally avoided, thereby eliminating the approximations and uncertainties involved in using buildup factors in complicated geometries.
Results are given here for one axial and two radial traverses of the reactor and shields. The region thick- nesses and compositions are shown with the results in Figs. 6.3 through 6.8. For the radial traverses, two one-dimensional infiite-cylinder calculations were per-
'T. B. Fowler and D. R. Vondy, Nuclear Reactor Depletion ~ T A ~ O N , OmL-m-2496 (to be rmd D , , ~ ~ - ~ ~
published).
ORNL-OWG 69-6978 V '
C ,D N ? B )/ IA
SALT GAP (0 .635cm) , REACTOR VESSEL (5.08 cm)
BLANKET REFLECTOR
REFLECTOR 0.04
8 11
RADIUS (cm f r o m core axis)
Fig. 6.3. Gamma and Neutron Heating in Core Midplane of lo00 Mw (Electrical) MSBR

formed, the first at the core midplane, the second in a plane two-thirds of the distance from the midplane to the top of the core. In each case the neutron (and gamma) flux was normalized to the value of the actual center-line core flux at that elevation. No allowance was made for axial buckling. Thus, particularly in the shields, the calculated heat sources should be con- sidered as upper limits to the actual heat sources. I t is estimated that the calculated sources inside the reactor vessel are only a few percent high. But because of the large air gap between the vessel and shields, the calculated heat sources in the thermal shield and concrete should be reduced by about 50% to account for the actual f ~ t e height of the reactor.
In the axial center-line calculation, the system was represented in slab geometry, infinite in the radial dimension. Again, transverse buckhg effects inside the vessel are small. The results for the thermal and biological shields are upper limits, but the overestima-
ORNL-0% 69-6979
z I- O 0
2 40
P n- $ < w 1 I E z o 0 a I- 3 W z
I y DOSE: 873r/hr
THERMAL SHIELD (3-in. Fe)
H&. CONCRETE -4 ' VOID
RADIUS (cm from core axis) ,
Fig. 6.4. Gamma and Neutron Heating in Core Midplane of loo0 Mw (Electrical) MSBR.
84
U tion is lower in the axial direction since the air gap is only a few feet.
The calculations were performed in several linked stages starting with a one-dimensional ANISN transport calculation of the neutron space and energy distribution in the reactor and shields. From neutron fluxes and scattering cross sections, the neutron heat distribution was determined. The neutron heating in the reactor is shown in Figs. 6.3, 6.5, and 6.7 for the two radial traverses and one axial traverse. In each figure curve A shows the heat source per unit volume of homogenized core, blanket, reflector, or plenum. Curves B and C show, respectively, the heat source per unit volume of graphite and salt separately in those regions. CurveD shows the heating in the INOR vessel.
Figures 6.4, 6.6, and 6.8 show the neutron heating in the thermal and biological shields. The thermal shield is treated as pure iron. The concrete is a standard grade.
The gamma heat distribution is similarly presented in the figures. Three sources of gammas were calculated from the neutron flux distribution: prompt fission, delayed (fission product), and capture gammas. The first and last of these had the spatial distribution of the neutron flux. The delayed source was assumed uniform in the circulating salt. Since the salt spends approxi- mately half its time in the reactor, approximately half of the delayed gammas are emitted inside the vessel.
These three sources of gammas were combined in a fured-source ANISN gamma transport calculation using seven gamma energy groups. From the gamma fluxes the gamma heat sources were then calculated.
Also shown in Figs. 6.4, 6.6, and 6.8 are the gamma doses at the external surfaces of the biological shield.
From the results it should be particularly noted that neutron thermalization is a major heat source in the graphite.
. . *
6.2 PHYSICS ANALYSIS OF MSBE
6.2.1 MSBE Design Studies
0. S. Smith W. R. Cobb
Additional calculations were performed in the series of conceptual MSBE reactor configurations previously reported? Results of the new calculations are sum- marized in Table 6.5. There were two objectives for the cases described here: first, to determine the maximum breeding ratio achievable in a reactor having a peak fast damage flux of 5 x 10' neutrons cm-* sec-' , a core
.,
e
.
. S
u 80. L. Smith and W. R. Cobb, MSR Rogmm Semiann Ron. Rept. dug. 31.1968, ORNL-4344, p. 71.

Iu I
I I t
85
t
t
. I 9
I I .
O R N L - D W G 6 9 - 6 9 8 0
Fig. 6.5. Gamma and Neutron Heating in a Radial plane Two-Thirds of Distance from Midplane to Top of Core of lo00 Mw (Electrical) MSBR
,

Table 6.5. Nuclear Characteristics of Several Conceptual MSBE Reactor Configurations
Radial Peak Axial Plena Mole Breeding Damage Peak Power Fraction of Required
Core Axial Blanket nicknessu Fraction Ratiob fluxC Densitf Power in PoweP core [Mw (thermal)] Thickness of ThF4
(neutrons (wlcm cm" sec-'1
(ft) case Diameter Height Salt Thickness Salt (ft)
(ft) (ft) Fraction (ft) Fraction
21 4 6 0.2 2.5 22 4 6 0.2 2.0 23 4 6 0.2 1 .o 24 4 6 0.2 2.0 25 4 5 0.2 1 .5 26 4 5 0.2 1.5 27 4 5 0.15 1.5 28 4 5 0.2 1.07 2ge 4 5 0.2 1.07 30 4 5 0.2 1.07 31 3.5 4.5 0.2 1.07 32 3 4 0.2 1.07 33 3 4 0.2 1.0 34 3 4 0.2 0.75 35 3 4 0.2 1 .o 36 3 4 0.2 1.0
0.5 0.5 0.5 0.5 0.5 0.5 0.5 0.7 0.7 0.7 0.7 0.7 0.7 0.7 0.7 0.7
0.5 0.5 0.5 0.5 0.5 0.5 0.5 0.357 0.357 0.357 0.357 0.357 0.25 0.25 0.25 0.25
3.75 0.14 3.0 0.14 2.0 0.14 2.0 0.14 2.0 0.14 2.0 0.12 2.0 0.12 2.0 0.14 2.0 0.14 2.0 0.12 2.0 0.14 2.0 0.14 1.75 0.14 1.5 0.14 1 .o 0.14 1.75 0.12
1.112 1.111 1.061 1.077 1.063 1 .05 1 1.047 1.062 1.069 1 .05 1 1.049 1.020 0.993 0.956 0.893 0.972
x 10'~ 1.94 2.28 2.5 1 2.34 2.66 2.5 3 2.48 2.96 3.04 2.95 3.67 4.29 4.45 4.70 5.02 4.34
39.5 46.8 51.2 48.1 54.7 52.8 50.6 65.3 69.0 66.5 84.8 101.3 105.1 111.2 119.0 102.2
0.46 0.5 2 0.55 0.5 2 0.5 1 0.49 0.46 0.57 0.59 0.57 0.52 0.43 0.44 0.46 0.49 0.43
258 219 199 214 188 198 202 169 m 164 169 136 117 112 106 100 115
be
'Contains 6% INOR. bAt start of life with 233U fuel. CAt reactor power of 100 Mw (thermal). dReactor power required to achieve a peak damage flux of 5 X 10¹⁴ neutrons cm-2 sec-'. 'New core cross sections introduced.

6-I t
z ..
. t
..
t
.
. W
z 0 I
f THERMAL SHIELD (3-111. Fe)
\VOID
980 4020 . 1060 ((00 1440 RADIUS (cm from core axis)
Fig. 6.6. Gamma and Neutron Heating in a Radial Plane Twe Thirds of Distance from Midplane to Top of Core of 1000 Mw (Electrical) MSBR.
power fraction greater than 0.33, and a reactor power in the range of 200 Mw (thermal); second, to determine the minimum reactor power which would produce a peak damage flux of 5 X 10¹⁴ neutrons cm-' sec-I , a core power fraction greater than 0.33, and a breeding ratio near unity (i-e., 1.0 f 0.05). Cases 21-30 were performed to achieve the first objective, cases 31-35 to achieve the second. An axial blanket is shown here to have an important influence on the reactor perform- ance. Previous cases had only a few inches of blanket material in the axial direction. In particular, comparison of case 25 with the previously published case 18 (which had only a few inches of axial blanket) shows that the effect of reducing the core length by 1 ft and adding 1.5 ft of axial blanket at either end of the core improves the breeding ratio without compromising other aspects of the performance. Comparison of cases 26 and 27 shows that the desired core salt fraction is 0.2. Comparison of cases 25 and 28 shows that the axial (and, of course, radial) salt fraction should be made as large as possible in order to harden the blanket spectrum and peak the power production in the core.
87
During the course of these calculations two new codes, CITATION (an improved version of EXTERMI- NATOR) and XSDRN (a cross section code which replaces TONG), were introduced into the calculational procedures for the MSBE design studies. CITATION was available and used for all of the cases in Table 6.5, but XSDRN was not available until case 29. Hence the slight difference between cases 28 and 29 reflects the difference between the old and new cross sections.
Case 30 includes all the improvements established in cases 21 through 29 and has 12 mole % ThF4 (as currently specified in the MSBR fuel salt). This case demonstrates that a reactor operating at 169 Mw (thermal) will produce a damage flux of 5 X 10l4, a core power fraction of 0.57, and a start-of-life breeding ratio of 1.051. This appears to be the most attractive reactor cpnfiguration in the 200 Mw (thermal) range.
Cases 31-36 are largely selfexplanatory. The desired damage flux can be achieved at lower power levels by decreasing the blanket thickness and sacrificing the breeding ratio. Case 36 shows that a reactor operating at 1 15 Mw (thermal) with 12 mole % ThF, would have a damage flux of 5 x 10¹⁴ neutrons cm-' sec-' , a breeding ratio of 0.97, and a core power fraction of 0.43. This appears to be the most attractive reactor configuration in the 100 Mw (thermal) range.
6.3 MSBR EXPERIMENTAL PHYSICS
6.3.1 Initial Results of the Experiment to Measure 4' "U) in the MSRE
G. L. Ragan
Samples of the circulating fuel salt were taken during the final run of the MSRE with ' U fuel for use in the measurement of 4'' U); 01 = The method relies, as outlined in an earlier report, on precise measure- ments of the concentrations of ' s U and ' ' U relative to that of 238U.
The isotopic ratios are being measured by Lester A. Smith and co-workers of the Isotopic Analysis Depart- ment at the Oak Ridge Gaseous Diffusion Plant. Some of their early measurements have been analyzed, but the results must be considered as preliminary until additional measurements have been made and analyzed and a comprehensive study of errors has been made.
The results presently available appear to agree very well with the spectrum-average value of 01 that was
9MSR Rogram Semiunn. Rogr. Rept. Feb. 29,1968, O N - 4254, p. 12.

88
I- V 3
0 ( T - (Lm
n
E t t 2 g z
0 E
z t-
calculated on the basis of the ENDF/B cross sections determined. While additional mass spectrometer meas- W for " U. The calculated average a was 0.264, while the mass spectrometer measurements, with provisional cor- rections for burnout of '''U and 236U, indicate a value of 0.255. The errors have not yet been fully
urements are to be made, and further analysis, both of the values and of the errors, will be required, it appears that the technique will indeed provide valuable integral checks on the differential cross-section measurements.
* .
V'
_c, A
C\ I \ A N D B $ 0 ll
D PER cm3 OF INOR
U
0
Fig. 6.7. Gamma and Neutron Heating neat Core Axis of 1000 Mw (Electrical) MSBR
A I
8
s
I
. W
e

89
z E 0 3 0 - a 40 a n
y
0
I - o
DOSE: 0.8 mr/hr
Fig. 6.8. Gamma and Neutron Heating near Core Axis of 1000 Mw (Electrical) MSBR
AXIS (em from core midplane)
t I

. .
7. Systems and Components Development Dunlap Scott
7.1 OFF-GAS SYSTEM
A. N. Smith R. B. Gallaher Dunlap Scott
The general flow diagram for the off-gas system is shown in Fig. 5.3 and is still essentially as has been described previously.’ Current estimates indicate that the gas flow from the reactor primary system to the volume holdup in the off-gas system will be about 11 scfm, of which 9 scfm will come from the gas separators and the balance from the purge streams for the pump shafts and miscellaneous instruments. A liquid-metal coolant operated at temperatures below 5W°F is being considered for removing heat from the volume holdup tank. If this method is accepted, the system for cooling the liquid metal would have to be set up separately from the primary-salt drain tank coolant system, since the latter would require a much higher minimum operating temperature. The preliminary design concept for the volume holdup tank is described below.
7.1.1 Volume Holdup Tank
The function of the volume holdup tank is to delay the off-gas stream for about 1 hr to permit decay of a large fraction of the short-lived fission products and dissipation of the accompanying heat. The cooling system must be capable of handling a maximum of 18 Mw of decay heat. Provision must be made for the collection and disposal of 1 to 2 lb of solid fission products per day. Although the incoming gas will be 99% helium, it will contain trace quantities of a variety of other elements, including: tritium (3H); stable Kr and Xe; radioactive Kr and Xe and associated daughters such as Ba, Cs, La, Rb, Sr, Y, and Zr; and a “smoke” of the so-called noble metals, Mo, Ru, Tc, and Te. In addition, there will probably be small amounts of the fuel salt in the form of a mist. Such mist particles
‘MSR A.Ogram Semiann. mgr. Rept. Aug. 31, 1968, ORNL.4344, pp. 56 ff. and 12 ff.
will be microspheres and will contain all the ingredients of the fuel stream. In the volume holdup region the noble metals and the daughters of Kr and Xe will be in either the liquid or the solid state, and particles suspended in the gas will probably range in size from about 20 I.( down to single atoms.
For the initial approach to the problem, we have assumed that settling or impaction will be used to transfer the particles directly into a coolant stream. The coolant will be recirculated through external equipment for continuous removal of the solids and the associated decay heat. The primary task is the selection of a coolant which will satisfy our tentative requirements for the system. Such a coolant must safely accept and hold the “noble” metals, the daughters of the noble metals, and the daughters of the noble gases and then must release these fission products by treatment only in the proper areas. It must have a vapor pressure low enough to minimize carry-over to the 47-hr holdup system, must be compatible with its container and with fuel salt, and should have an existing technology for use as a heat transfer agent. The eutectic of lead and bismuth appears to offer sufficient attractiveness to merit first place on the list of candidates. It is compatible with the fuel salt, it has high density which should minimize settling out of entrained noble metals, and its low melting point (275OF) may permit opera- tion at low temperature and the use of relatively lowcost alloys as materials of construction.
Figure 7.1 shows a conceptual design of a volume holdup tank utilizing the impaction mechanism for transfer of the solids to a recirculating coolant stream. Performance of the device has been calculated by use of an. equation developed for a low-pressure cascade impactor? The results indicate that it should be possible to design a system of reasonable geometry for
I
. 2G. W. Parker and H. Buchholz, Size CIassification of
Submicmn Particles by a Low Pressure Cascade Impactor, ORNL4226 (June 1968). i J
90

OFF-GAS FROM 11 scfm ENTRAINMENT SEPARATOR 13OO0F I
.-)
18 Mw - 1800 gpm
4
1 hr DECAY TANK ' AND PARTICLE TRAP
(1 scfm (500 gpm 5OO0F 0 LIQzifi5TAL t- 1-
LIQUID METAL
TO 47 hr Xs HOLDUP CHARCOAL BED
HEAT EXCHANGER AND DRAIN TANK
30 ) in.
ORNL-DWG 68-123t6A
I LIQUID METAL
OUTLET
1 hr DECAY TANK AND PARTICLE TRAP
Fig. 7.1. Particle Trap and 1-ht Decay System for MSBR Off&.

92
removal of particles in the 0.1 -to-1 .O-p range. Thus, for removal of 0.159 particles at 50% efficiency, forty-two 0.080-in.-diam jets would be required for one stage to handle the gas flow. A number of stages of relatively low efficiency and operated in series will be used to distribute the heat load and to minimize short-circuiting of the gas into the charcoal beds, which are next in the gas system. The volume holdup tank proper will be 8 ft in diameter by 30 ft high. Coolant flow is from top to bottom, and the coolant is also circulated through a jacket to provide cooling for the walls of the vessel and to absorb the gamma energy which is released as part of the fission product decay.
7.2 NOBLE-GAS MIGRATION IN THE MSBR
R. J. Kedl
In the last semiannual progress report: results of ’ Xe poisoning calculations were presented for a 1000 Mw (electrical) single-fluid MSBR having a blanket and reflector. The xenon stripping mechanism uses recircu- lating helium bubbles 0.020 in. in diameter, where the clean helium bubbles are added to the fuel and ”’Xe-rich bubbles are stripped out of the fuel in a bypass around the pump. In the calculational model the fuel loop is treated as a well-stripped pot. These computations were repeated for all other noble-gas fission products, of which there are over 30 kryptons and xenons. The results are shown in Table 7.1. Some of the more significant gas-migration parameters are listed below, and the cases are characterized in the table by the ’ Xe poison fraction. The tabulated fluxes are about the same for any reasonable combination of these parameters that yield the same 3s Xe poison fraction.
I3’xe poison fraction, % 1.27 0.56 Volume fraction bubbles in fuel salt 0.002 0.006
Fraction bubbles replaced per loop circuit 0.1 0.1 Xenon diffusion coefficient in bulk io-’ 10” graphite, f t2/h
Xenon diffusion coefficient in graphite 10’ io-’ coating, ft2/hr
Available void fraction in graphite 1 1
Graphite coating thickness, in. 0.010 0.010 Mass transfer coefficient to 2.0 2.0
Graphite surface area in core, ft2 25,500 25,500
coating, %
bubbles, f t /h
’MSR Rogmm Semiann. Rogr. Rept. Aug 31. 1968, ORNL.4344.
The flow diagram that forms the basis for the u calculations in Table 7.1 is shown in Fig. 7.2. Note that the flux into the bubbles is not necessarily equal to the flux out of the reactor. Some longer-lived noble gases are recycled from the 48-hr holdup system back into the reactor with the helium, and for those gases the flux to the bubbles is less than the flux out of the reactor. For the short-lived gases the flux to the bubbles is greater, because some decay and burnup take place between the time the noble gas enters a bubble and the time the bubble leaves the salt. For very short-lived isotopes, where the half-life is a small part of the loop circuit time, one would question the applicability of the well-stirred pot model. Nevertheless, these computa- tions are adequate for the preliminary designs.
c . . t
7.2.1 Contribution of the Noble Gases to Afterheat in the Graphite
With the use of the noble-gas flux into graphite, described above, we can compute their contribution to
ORNL-DWG 69-5486
FLUX OUT
REACTOR
OFF-GAS LINE
VOLUME HOLDUP
Kr -6 hr Xe-48 hr
47-hr Xe HOLDUP
CHARCOAL
C
*
. I
--@ BUBBLE
0.8 OF FLOW
PURE FLUX TO He HELIUM
MAKEUP CLEANUP SYSTEM
I
N
Fig. 7.2. Flow Diagram to Defme Terms Used in Table 7.1.
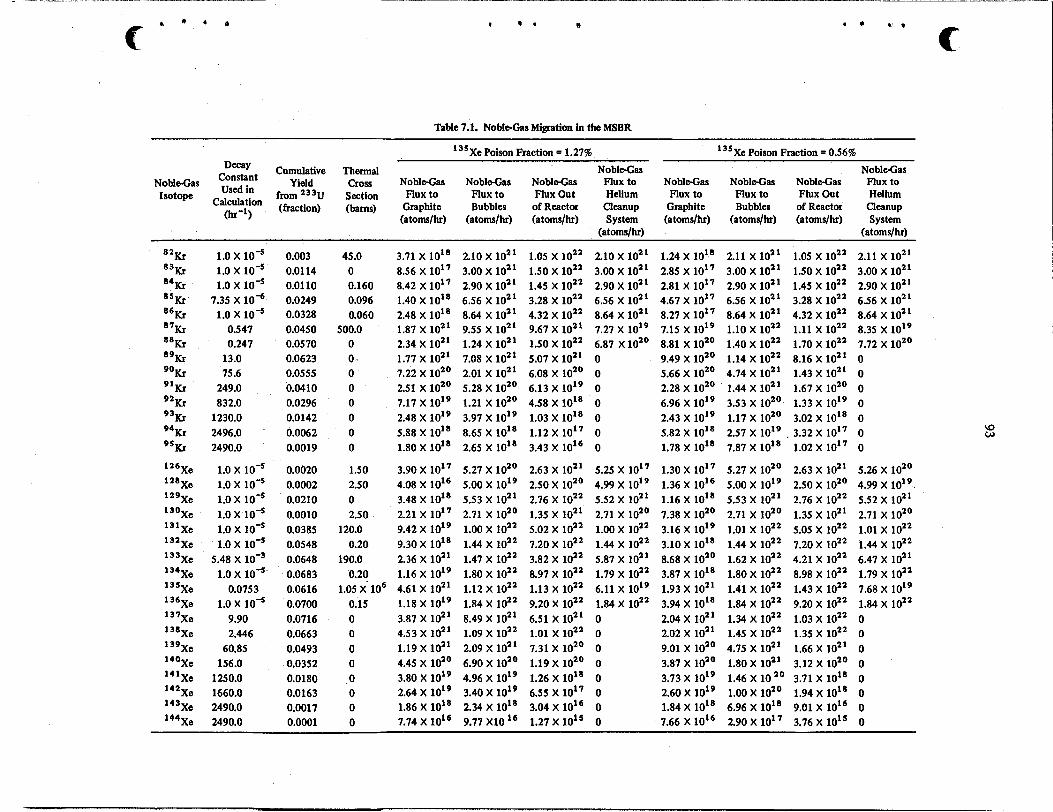
Table 7.1. Noble-Gas Migration in the MSBR
'"Xe Poison Fraction = 1.27%
Decay Cumulative ~ h e r m a ~ Noble-Gas Noble-Gas 'Onstant Yield cross Noble-Gas Noble-Gas Nobl&s Flux to Isotope Usdin fmmz33u section luxt to Fluxto FluxOut Helium
calculation (fraction) (barns) Graphite Bubbles of Reactor Cleanup m-') (atomslhr) (atomslhr) (atomslhr) System (atoms/hr)
c I b ,
'"Xe Poison Fraction = 0.56%
NobleGas NobleGas Noble-Gas Noble-Gas Flux to Flux to Flux to FluxOut Helium Graphite Bubbles of Reactor Cleanup (atomslhr) (atoms/hr) (atomslhr) System
(atomdhr)
1.0 x 10-~ 1.0 x 1.0 x 10-~
7.35 x 10" 1.0 x 10-~
0.547 0.247
13.0 75.6
249.0 832.0
1230.0 2496.0 2490.0
1.0 x 1.0 x lo* 1.0 x 1.0 x 10-~ 1.0 x 10-~ 1.0 x
5.48 x 1.0 x 10-~
1.0 x 10-~ 0.0753
9.90 2.446
60.85 156.0
1250.0 1660.0 2490.0 2490.0
0.003 0.01 14 0.01 10 0.0249 0.0328 0.0450 0.0570 0.0623 0.0555 0.0410 0.0296 0.0142 0.0062 0.0019
0.0020 0.0002 0.0210 0.0010 0.0385 0.0548 0.0648 0.0683 0.0616 0.0700 0.0716 0.0663 0.0493 0.0352 0.0180 0.0163 0.0017 0.0001
45 .O 0 0.160 0.096 0.060
500.0 0 0- 0 0 0 0 0 0
1.50 2.50 0 2.50
120.0 0.20
190.0 0.20
0.15 0 0 0 0 0 0 0 0
1.05 x 10'
3.71 X 10l8 8.56 X 10¹⁷ 8.42 X 10¹⁷ 1.40 X 10l8 2.48 X 10l8 1.87 X 10'' 2.34 X 10" 1.77 X 10'' 7.22 X 10'' 2.51 X 10"
2.10 X 10" 3.00 X 10'' 2.90 X 10" 6.56 X 10'' 8.64 X 10'' 9.55 X 10'' 1.24 X 10'' 7.08 X 10" 2.01 X 10'' 5.28 X lozo
7.17 x 10¹⁹ 1.21 x lozo 2.48 x ioi9 3.97 x 10¹⁹ 5.88 X 10l8 1.80 X 10l8
3.90 X 10¹⁷
3.48 X 10l8
8.65 X 10l8 2.65 X 10l8
5.27 X lozo
5.53 X 10" 4.08 x io16 5.00 x 10¹⁹
2.21 x 10¹⁷ 2.71 x iozo 9.42 x 10¹⁹ 1.00 x ioz2 9.30 X 10l8 2.36 X 10'' 1.16 X 10'' 4.61 X 10" 1.18 X 10'' 3.87 X 10" 4.53 X 10" 1.19 X 10" 4.45 X 10"
1.44 X lo2' 1.47 X 10'' 1.80 X 10'' 1.12 X 10" 1.84 X 10'' 8.49 X lo'' 1.09 X 10'' 2.09 X 10" 6.90 X 10"
3.80 x 10¹⁹ 4.96 x 10¹⁹ 2.64 x 10¹⁹ 3.40 x 10¹⁹
7.74 x 10l6 9.77 x10 '' 1.86 X l o t8 2.34 X 10l8
1.05 x lozz 1.50 x 10²²
1.45 X 10'' 3.28 X 10'' 4.32 X 10'' 9.67 X 10"
5.07 X 10'' 6.08 X 10''
1.50 x 10²²
6.13 x 10¹⁹ 4.58 x 1ol8
1.12 x 10¹⁷ 3.43 x 10''
250 x l O Z 0
1.03 X 10"
2.63 X 10''
2.76 X 10" 1.35 X 10"
7.20 X lo'' 3.82 X 10'' 8.97 X 10'' 1.13 X 10'' 9.20 X 10'' 6.51 X 10"
7.31 X 10'' 1.19 X lozo 1.26 X 10l8 6.55 X 10¹⁷ 3.04 X 1 O I 6
5.02 x loaz
1.01 x l 0 Z Z
1.27 x 10¹⁵
2.10 x lo2' 3.00 x 10²' 2.90 X 10" 6.56 X 10'' 8.64 X 10''
6.87 X lozo 0 0 0 0 0 0 0
7.27 x 10¹⁹
5.25 x 10'7 4.99 x 10¹⁹ 5.52 x 10²'
1.00 x l0ZZ 1.44 x 1OZ2
6.11 x 10¹⁹
2.71 X 10"
5.87 X 10" 1.79 X 10''
1.84 X 10'' 0 0 0 0 0 0 0 0
1.24 X 10l8 2.85 x 10¹⁷ 2.81 x 10¹⁷ 4.67 x 10¹⁷ 8.27 x 10¹⁷ 7.15 x 10¹⁹
9.49 x 10²⁰
6.96 x 10¹⁹ 2.43 x 10¹⁹
8.81 X lozo
5.66 X 10'' 2.28 X 10''
5.82 X 10l8 1.78 X 10l8
1.30 x 10¹⁷ 1.36 X 10l6 1.16 X 10l8 7.38 X 10''
3.10 X 10l8 8.68 X 10'' 3.87 X 10l8 1.93 X 10''
2.04 X 10"
9.01 X 10" 3.87 X lozo
3.16 x 10¹⁹
3.94 x 1ol8
2.02 x lo2'
3.73 x 10¹⁹ 2.60 x 10¹⁹ 1.84 X 10l8 7.66 X 10l6
2.11 x 10²' 1.05 x lo= 3.00 X 10'' 2.90 X 10" 6.56 X 10'' 8.64 X 10"
1.40 X 10'' 1.14 X 10" 4.74 X 10" 1.44 X 10''
1.17 X 10"
1.50 X 10" 1.45 X 10" 3.28 X 10'' 4.32 X 10''
1.70 X 10'' 8.16 X 10" 1.43 X 10'' 1.67 X lozo
3.02 X 10l8
1.10 x 10²' 1.11 x loza
3.53 x io20 1.33 x 10¹⁹
2.57 x 10¹⁹ . 3.32 x 10¹⁷ 7.87 x i o l 8 1.02 x 10 '~
5.00 x ioi9 2.50 x iozo 5.27 X 10''
5.53 X 10" 2.71 X 10''
1.44 X 10'' 1.62 X 10'' 1.80 X 10'' 1.41 X 10'' 1.84 X lo'' 1.34 X 10" 1.45 X 10" 4.75 X 10" 1.80 X 10'' 1.46 X 10 1.00 X 10'' 6.96 X 10"
2.63 X 10"
2.76 X 10'' 1.35 X 10''
7.20 X 10" 4.21 X 10" 8.98 X 10'' 1.43 X 10" 9.20 X 10'' 1.03 X 10'' 1.35 X 10'' 1.66 X 10" 3.12 X 10" 3.71 X 10l8 1.94 X 10l8 9.01 X 10l6
1.01 x loz2 5.05 x
2.90 x 10' 3.76 x ioi5
2.11 x 10²' 3.00 X lo2' 2.90 X 10'' 6.56 X 10" 8.64 X 10"
7.72 X 10'' 0 0 0 0 0 0 0
5.26 X 10''
8.35 x 10¹⁹
4.99 x 10¹⁹ 5.52 x 10²'
1.01 x lozz 2.71 X lozo
1.44 X 10'' 6.47 X 10'' 1.79 X 10''
1.84 X 10'' 0 0 0 0 0 0 0 0
7.68 x 10¹⁹

94
afterheat. Figure 7.3 shows the results for the case where 135Xe poison fraction is 0.56%. It is assumed that the noble-gas flux into the graphite is constant and continuous for two years with the reactor at power. The amount of noble gases and their daughters can then be computed after this period of time. This computa- tion is based on straight-chain decay and no side decay loops.
to4 .z - W
I t a a 5 ro3 z s W
e z 402
B
k = IO'
z W W
W
ORNL-DWG 69-5487
NOBLE GAS MIGRATION PARAMETERS SUCH THAT
IS)
I 00 (0' 402 103 104 105
Fig. 7.3. Afterheat Contribution by Noble Gases and Their Daughters Adsorbed by the Graphite in the h;ISBR Core [ 1000 Mw (Electrical)]. The residence time for krypton in the char- coal beds is about one-twelfth of that for xenon. The flux of atoms into the off-gas line was calculated by R. J. Ked using 0.56% poison fraction. Decay heat calculations were made by M. Bell using computer code.
TIME AFTER REACTOR SHUTDOWN ( m i d
REGION I 2 RESIDENCE TIME (hr) 0.005 0.005 DECAY HEAT ( M W ) GAS + DAUGHTERS 0.78 0.56 DECAY HEAT(Mw) GAS ONLY 0.31 0.24
7.2.2 Distribution of Decay Heat in the hi MSBR Off-Gas System
A. N. Smith M. Bell . *
An estimate has been made of the distribution of fission product decay heat in the 1000 Mw (electrical) USBR off-gas system. The calculations were based on the following model:
1. The flux of krypton and xenon into the off-gas line will be as calculated by R. J. Kedl for 0.56% poison fraction (see Table 7.1). Solid daughters of krypton and xenon are assumed to plate out at the point of formation, which gives a high heating value for the pipe sections.
2. The flux to the off-gas will include 50% of the noble-metal fission products. Of these, 100% will be retained in the 1-hr volume holdup.
3. Krypton delay in the charcoal beds will be '/12
xenon delay. 4. The off-gas system will be divided into 20 regions,
as shown in Fig. 7.4. The unstable noble gases will decay exponentially in accordance with an assigned delay or residence time. The 1-hr volume holdup and the 47-hr xenon delay charcoal bed were divided into compartments with various delay times in an attempt to obtain approximately equal heat loads. The delay times for the pipe sections were arbitrarily set at 18 sec each.
.
ORNL-DWG 69-5488
3 4 5 6 7 0.005 0.1 0.3 0.6 0.005 0.44 3.45 2.59 1.68 0.009
0.005 1.74 1.20 0.77 0.20
I-hr VOLUME HOLDUP
ENTRAINMENT SEPARATOR
48 I 7 I 6 I 5 14 I 3 12 I 1 I O 9 8 0.01 0.01 0.005 0.01 0.005 4 6 1 4 9 5 2 I
0.002 0.002 0.00 I 0.003 0,0014 0.47 0.92 0.69 0.48 0.24 0.36 0.001 0.001 0.0005 0.001 0.0006 0.23 0.63 0.45 0.34 0.46 0.15
47-hr XENON HOLDUP CHARCOALBED
SURGE TANK
PIPE
I 9 2 0 2160 0.01 0.27 0.002 0. I5 0.001
L
Fig. 7.4. Distribution of Decay Heat in MSBR Off& System. c,

95
POSITION POSITION TWO 90° GLASS ELBOWS B A
The results, which are shown in Fig. 7.4, indicate that the total heat load will be about 21 Mw, distributed as follows:
LJ
Heat Percent of Released Heatbad
(Mw)
Entrainment separator and 1.8
1-hr volume holdup 16.5" 47-hr xenon delay charcoal beds 2.7 Remainder, including 9O-day 0.3
21.3
adjacent pipes
xenon delay beds -
9
78 13 0.1
"Includes 9 Mw of decay heat from noble metals.
7.3 BUBBLE GENERATOR R. J. Kedl
* . t
. W
After considering several concepts for but Jle gener- ators, both fluid and mechanically powered, we have
settled on one. I t can be thought of as an inverted venturi and consists of a teardrop inside a straight section of pipe. A plastic model has been built and tested with water and air as shown in Fig. 7.5. Air is injected into the throat through fortyeight -in.- diam holes in the teardrop. It could just as easily have been injected through holes in the pipe wall or possibly through a porous material. Four teardrop shapes have been tested. The variable parameter in three of them was the throat gap thickness, and in the fourth it was the angle of the diffuser region. The generator has been tested over the following ranges of variables:
Water flow rate, gpm 20-38 Water velocity in 1-in.-ID pipe, fps Air flow rate, scfh 0-2.5 Void fraction, % 0- 1.5 Throat gap thickness, in. 0.062,0.094,0.125
8.2- 15.5
Many high-speed photographs have been taken of this device, and the following have been observed:
4 - f t I-in.-ID GLASS PIPE
t -7 PHOTOGRAPH DRAIN
POSITION C
BUBBLE GENERATOR T E S T
,4~- ( /~4- in . HOLES /
WATER
4 in! ID < I I- AIR
t h\\ PLEXIGLAS TUBE~\\\\\\\\\\\\\\\\\\\\\\\Y
BUBBLE GENERATOR DETAIL
Fig 7.5. BubbleGenerator Test Flow Diagram.
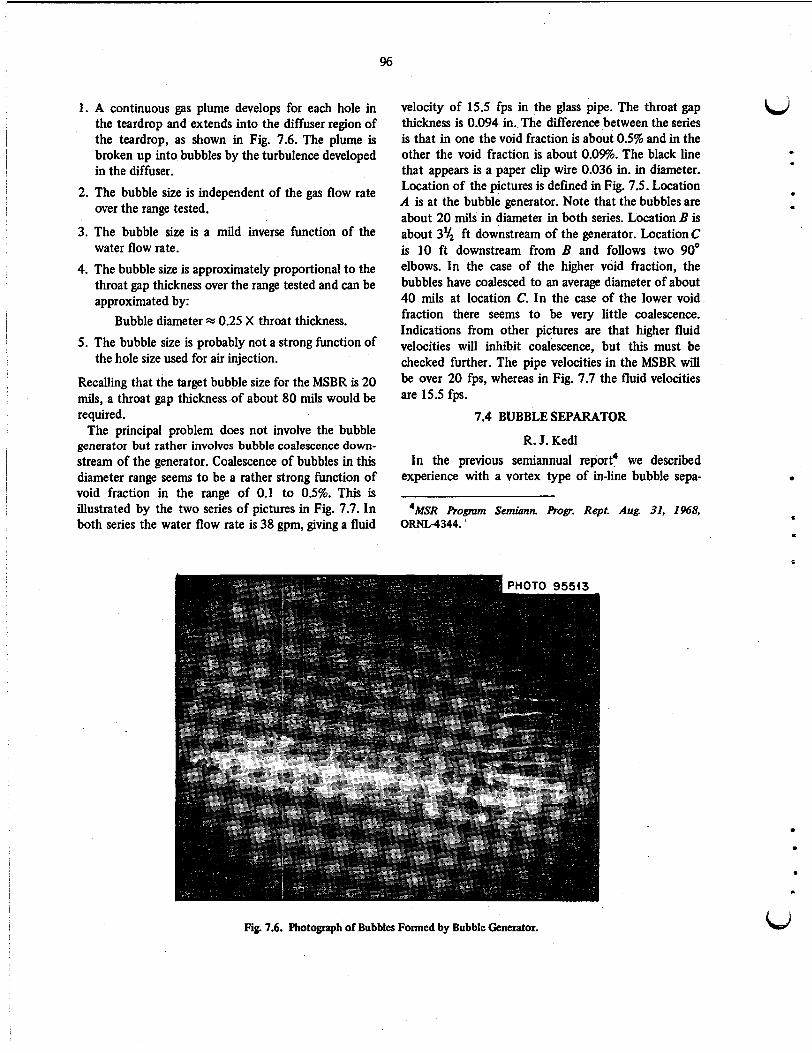
1. A continuous gas plume develops for each hole in the teardrop and extends into the diffuser region of the teardrop, as shown in Fig. 7.6. The plume is broken up into bubbles by the turbulence developed in the diffuser.
2. The bubble size is independent of the gas flow rate over the range tested.
3. The bubble size is a mild inverse function of the water flow rate.
4. The bubble size is approximately proportional to the throat gap thickness over the range tested and can be approximated by:
Bubble diameter 0.25 X throat thickness. 5 . The bubble size is probably not a strong function of
Recalling that the target bubble size for the MSBR is 20 mils, a throat gap thickness of about 80 mils would be required.
The principal problem does not involve the bubble generator but rather involves bubble coalescence down- stream of the generator. Coalescence of bubbles in this diameter range seems to be a rather strong function of void fraction in the range of 0.1 to 0.5%. This is illustrated by the two series of pictures in Fig. 7.7. In both series the water flow rate is 38 gpm, giving a fluid
the hole size used for air injection.
velocity of 15.5 fps in the glass pipe. The throat gap L J thickness is 0.094 in. The difference between the series is that in one the void fraction is about 0.5% and in the other the void fraction is about 0.0%. The black line that appears is a paper clip wire 0.036 in. in diameter. Location of the pictures is defined in Fig. 7.5. Location A is at the bubble generator. Note that the bubbles are about 20 mils in diameter in both series. Location B is about 3'4 ft downstream of the generator. Location C is 10 ft downstream from B and follows two 90" elbows. In the case of the higher void fraction, the bubbles have coalesced to an average diameter of about 40 mils at location C. In the case of the lower void fraction there seems to be very little coalescence. Indications from other pictures are that higher fluid velocities will inhibit coalescence, but this must be checked further. The pipe velocities in the MSBR will be over 20 fps, whereas in Fig. 7.7 the fluid velocities are 15.5 fps.
7.4 BUBBLE SEPARATOR
R. J. Ked In the previous semiannual report4 we described
experience with a vortex type of in-line bubble sepa-
I . . 0
4MSR Rogmm Semhm. Rogr. Rept. Aug. 31, 1968, ORNL4344. '
~~
Fig. 7.6. Photograph of Bubbles Formed by Bubble Generator.
. 8
.L
LJ

. . . . . .. " .... . .-...I. "I....--.....-..-..
Y
PHOTO 95544
HIGH VOID FRACTION-POSITION C
LOW VOID FRACTION-POSITION C
HIGH VOID FRACTION-POSITION 8
LOW VOID FRACTION-POSITION 8
HIGH VOID FRACTION-POSITION A
LOW VOID FRACTION-POSITION A
Fig. 7.7. Coalescence of Entrained Bubbles in the Bubble Generator Test. Locations of positions are shown in Fig. 7.5.

98
Fig. 7.8. Photograph of Vortex in the Bubble Separator.
rator that was not completely satisfactory because the gas core would not attach to the hub of the recovery vanes. I t was postulated that the trouble was associated with the small hub diameter. A new set of vanes was made with a much larger hub, but the problem persisted. A third set of vanes was then made up identical to those used in the HRT but scaled up for our test section diameter. With this newest set of vanes, the gas core does attach to the hub of the recovery vanes much better than before. There is some splashing as the water hits the hub, and consequently some gas bypasses the takeoff line, but almost all the gas can be made to leave through the takeoff line in the hub of the recovery vanes. Note in Fig. 7.8 how the gas core seems to hold onto the hub, as opposed to the photograph in ORNL4344 (Fig. 7.3, p. 79, where the gas core disintegrates as it approaches the hub. Since these vanes have only recently been installed, no quantitative data are available.
7.5 MOLTEN-SALT STEAM GENERATOR TEST STAND
R. E. Helms
A request for directive, Preliminary Proposal Number 450, MoltenSalt Steam Generator Test Stand, has been sent to the AEC for approval and authorization of expenditures.
The test stand will have a capacity of 3 Mw, necessary to test one or more full-size tubes for large steam generators. It will consist of a molten-salt loop with a gas furnace as a heat source and a water-steam loop capable of operation at subcritical and supercritical
pressures. The flow diagram for the proposed installa- d tion is shown in Fig. 7.9. This test stand will be operated at salt and steam conditions representative of the MSBR and will have all necessary controls and instrumentation to permit steady-state and transient operation, including simulation of plant startup. The test stand will be used to gain fundamental engineering data and to investigate ideas for generating steam with molten salt. Some of the principal objectives of the development program are as follows:
*
I .
1. To confirm the salt heat transfer and fluid flow characteristics that were used in steam generator' design studies and to confirfn the adequacy of a computer code to be used for the design and analysis of full-size molten-salt steam generators.
2. To verify thermal and mechanical design features of a small section of a full-scale molten-salt steam generator.
3. To study the stability and operational performance of a molten-salt-heated steam system.
4. To assure the absence of supercritical whistle in an appropriate simulation of the boiler heat transfer tubes under typical operating conditions.
5. To d'evelop a startup system for the molten-salt steam-generating plant and to demonstrate experi- mentally the procedures to be used for startup.
6. To investigate the degree of corrosion and scale buildup in a once-through system of this type and to verify the chemical control of the water necessary for acceptable performance. Information on the compatibility of Hastelloy N with steam and salt will supplement the data being obtained from a separate materials testing program.
7. To gain further experience in fabricating com- ponents of Hastelloy N.
A conceptual system design description (CSDD) is now being prepared. As part of the design description effort, we are completing the flow diagrams for all the systems of the test stand prior to making the physical layout drawings.
i
7.6 SODIUM FLUOROBORATE CIRCULATING TEST LOOP .
A. N. Smith P. G. Smith R. B. Gallaher 5
Except for momentary interruptions, the loop oper- ated continuously from August 19,1968, to November 4, 1968, with the clean charge of sodium fluoro- borate-sodium fluoride eutectic salt. During this period
. 1
i d

99
A ORNL-OWG 69-5490
h A v u A -
LUBE OIL SUPPLY - CW IN
*OIL MAKE-UP CW OUT
OIL PUMP FILTER
40,87t.8 Ib/h
1204.5 h
6 SC
11,761.1 Ib/hr
1204.5 h
43,700 Ib/hr 42,397 Ib/hr\ I 4,329
4 ( / 2 SCH 80 HASTELLOY N
40,052.5 Ib/hr
i204.5 h 51 psi
INCONEL 600
(424.0 h 430 psi 4 % SCH 40 HASTELLOY N
2370 3900 Ib/h psi
Vz SCH 4(
/ 44.7 psi
INCONEL 60 I303 Ib/hr 4087.3 Ib/hr
4204.5 h 430 psi 1 SCH 40
889.3 Ib/hr I 4204.5 h 850.6 Ib/hr 4424 h 780 psi 4 SCH 40
4068 Ib/hr 4424 h 1300 psi '4 SCH 40
849.3 Ib/hr 4204.5 h 51 psi 4'4 SCH 40
h 4
-4
H20 MAKE-UP - c T
A 4421 h 4970 psi V2 SCH 40
473 psi 4 SCH 40
I -TEST SECTION
100°F 3900 psi
6017.9 Ib/hr 480.4 h 54 psi I SCH 40
I 1
Y L
-4
GASFURNACE & FILTER - HTR NO. 3/
DEMINERALIZER
h
HTR NO. 6
627OF 657.6 h
HEATER 13,700 l.b/hr 0.480 Mw 1V4 SCH 40 T
- 202 470.
446.7OF HTf 426.2 h
FEED WATER PUMP 288.3OF
1 U U U 348.0 h 4 4308.9 SCH 40 Ib/hr 5198.2 Ib/hr
82.5OF 520.3OF 456.7OF 92.0 h 5t2.1 h 437.4 h 303 Ib/hr 2371 Ib/hr 3221.6 Ib/hr 4 SCH 40 3/4 SCH 40 3/4 SCH 40
850.F I
2
?5 STORAGE TANK
c Fig. 7.9. Steam Generator Test Stand - Schematic Flow Diagram.
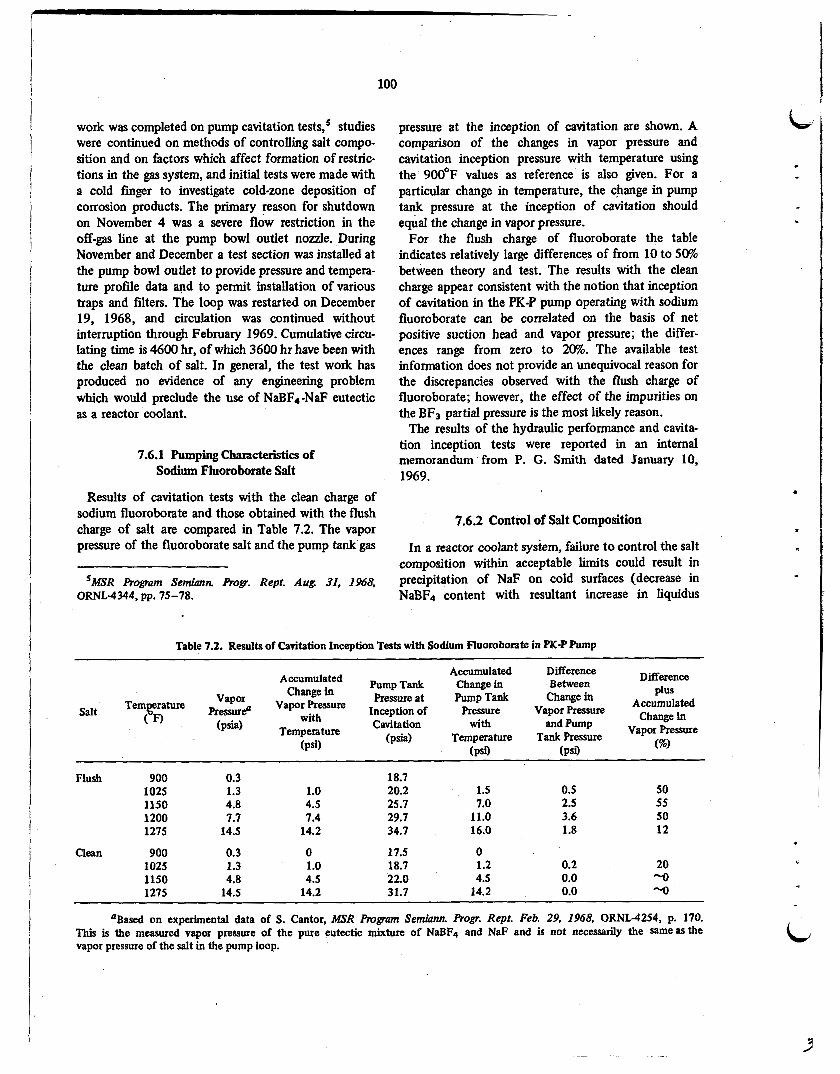
100
work was completed on pump cavitation tests,5 studies were continued on methods of controlling salt compo- sition and on factors which affect formation of restric- tions in the gas system, and initial tests were made with a cold finger to investigate cold-zone deposition of corrosion products. The primary reason for shutdown on November 4 was a severe flow restriction in the off-gas line at the pump bowl outlet nozzle. During November and December a test section was installed at the pump bowl outlet to provide pressure and tempera- ture profile data and to permit installation of various traps and filters. The loop was restarted on December 19, 1968, and circulation was continued without interruption through February 1969. Cumulative circu- lating time is 4600 hr, of which 3600 hr have been with the clean batch of salt. In general, the test work has produced no evidence of any engineering problem which would preclude the use of NaBF4-NaF eutectic as a reactor coolant.
7.6.1 Pumping Characteristics of Sodium Fluomborate Salt
Results of cavitation tests with the clean charge of sodium fluoroborate and those obtained with the flush charge of salt are compared in Table 7.2. The vapor pressure of the fluoroborate salt and the pump tank gas
'MSR Rogmm Semiam Prop. Rept. Aug 31, 1968, ORNL-4344, pp. 75-78.
pressure at the inception of cavitation are shown, A comparison of the changes in vapor pressure and cavitation inception pressure with temperature using the 900'F values as reference is also given. For a particular change in temperature, the change in pump tank pressure at the inception of cavitation should equal the change in vapor pressure.
For the flush charge of fluoroborate the table indicates relatively large differences of from 10 to 50% between theory and test. The results with the clean charge appear consistent with the notion that inception of cavitation in the PK-P pump operating with sodium fluoroborate can be correlated on the basis of net positive suction head and vapor pressure; the differ- ences range from zero to 20%. The available test information does not provide an unequivocal reason for the discrepancies observed with the flush charge of fluoroborate; however, the effect of the impurities on the BF3 partial pressure is the most likely reason.
The results of the hydraulic performance and cavita- tion inception tests were reported in an internal memorandum from P. G. Smith dated January 10, 1969.
7.6.2 Control of Salt Composition
In a reactor coolant system, failure to control the salt composition within acceptable limits could result in precipitation of NaF on cold surfaces (decrease in NaBF4 content with resultant increase in liquidus
Table 7.2. Results of Cavitation Inception Tests with Sodium Fluomborate in PK-P Pump
Accumulated Difference
Vapor Change in Pressure at Pump Tank Change in Difference
Accumulated Vapor Pressure Inception of Pressure Vapor Pressure Change in
and vapor Pressure
Change in Between plus
(Psis) Temperature Tank Pressure (%I
Accumulated Tank
Temgerature (F) with Cavitation with
Salt
Temperature (psi) (PSD (psi)
18.7 20.2
4.5 25.7 7.0
14.5 14.2 34.7 16.0
50 55 50 12
0.3 1.3 1.0 4.8
1.5 0.5 2.5 3.6 1.8
Flush 900 1025 1150 1200 1275
7.7 7.4 29.7 11.0
0.3 0 17.5 0 1.3 1.0 18.7 1.2 4.8 4.5 22.0 4.5
20 Q "0
0.2 0.0 0.0
Clean 900 1025 1150 1275 14.5 14.2 31.7 14.2
'Based on experimental data of S. Cantor, MSR Program Semiann h o g . Rept. Feb. 29. 1968, ORNL-4254, p. 170. This is the measured vapor pressure of the pure eutectic mixture of NaBF4 and NaF and is not necessarily the same as the vapor pressure of the salt in the pump loop.
.

10 1
6.i C
.
. e
. *
u
temperature) or boiling on hot surfaces (increase in NaBF4 content with resultant increase in BF3 pres- sure). Control of the salt composition is effected by controlling the BF3 content of the cover gas over the free surface of the salt in the pump bowl.
Under normal conditions a change in composition results only from transport of BF3 to the off-gas system by the flow of purge gas through the pump, and this effect is counteracted by feeding BF3 to the system at a rate equal to the loss rate. The gas flows are so small, compared with the total quantity of BF3 present in the salt, that rapid changes in salt composition by t h i s mechanism are impossible. For example, in the MSRE coolant system at 1200°F and 24 psig, removal of BF3 at the maximum rate (zero BF3 feed) for eight days would reduce the NaBF4 content by only 1%. The composition therefore can be controlled by occasional adjustments in BF3 feed rate, provided a suitable method can be established for monitoring the salt Composition. Following is a brief description and a summary of observations to date on several proposed monitoring methods.
1. Chemical Anulysis o f Salt Samples. The ratio of fluorine to boron or boron to sodium is used to estimate the mole fractions. A preliminary mathe- matical analysis indicated that the limit of error of the chemical analysis is too great to permit use of this method. A plot of the mole fraction as calculated from analyses of a large number of salt samples from the test loop (Fig. 7.10) tends to verify this conclusion.
ORNL-DWG 69-549t
CALCULATED FROM EOUATION
e RATIO OF E TO No 2.126* (E/Na) RATIO OF F TO 8 1/{[0.569* (F/E)]-3}
f00 , I I l o I I I 6
0 20 40 20 40 60 80 (00 CIRCULATING TIME (days)
Fig. 7.10. Mole Fraction NaBF4 Calculated from Salt Sample Analyses.
2. Change in Heat Transfer Coefficient Due to US& Deposit. A heat transfer surface in the salt stream is controlled at a temperature slightly above the normal liquidus temperature. A change in composition would result in a deposit on the cool surface which could be detected by a change in heat transfer coefficient. Evaluation has not been completed, but preferential deposition of corrosion products will probably prevent use of this method.
3. Differential T h e m 1 Anulysis. The composition is inferred from analysis of temperature profiles obtained by moving a salt sample through carefully controlled freeze and thaw cycles. I t appears that some work will be necessary to develop suitable sampling techniques.
4. Thermal Conductivity of Cover Gas. The off-gas is assumed to contain the equilibrium concentration of BF3 for the given salt temperature and composition. The off-gas stream is monitored continuously by a thermal conductivity cell which is calibrated in percent BF3. The partial pressure of BF3 is then calculated, and this value is related to the composition by an equation of the following form:
lnP = In (L) + (A - B / T ) , 1 -f
where
P = partial pressure BF3, mm Hg, f = mole fraction NaBF4, T = temperature, O R ,
A , B = constants.
The success of this method depends on the validity of the above equation and on the ability t o measure the salt temperature and the BF3 concentration in the gas with sufficient accuracy. Recent physical property data indicate the following derivative values for the above equation:
A = 18.67
T = 1025OF B = 2.5 x io4
f = 0.92 dp/dT = 0.75 mm Hd0F dp/df = 6.5 mm Hdl mole %
Experience with the test loop indicates that this method should be feasible for tracking the salt compo- sition. In order for the analysis of the off-gas stream to provide an accurate indication of the composition of

102
the salt, the gas must leave the pump bowl in equilibrium with the salt in the pump bowl. That this condition is attained in the test loop was indicated by two types of experiments. In one the helium flow to the pump bowl was varied, and this produced no change in the composition of the exit gas. In the second the BF3 content of the gas that is introduced under the salt through the bubbler tube of the level indicator was varied over a wide range for short periods of time. This also had no effect on the composition of the gas leaving the pump bowl. The thermal conductivity cell used to measure the partial pressure of the BF3 in the off-gas showed excellent linearity and appeared to hold its calibration adequately. A reactor-grade system would require a built-in calibration system and, as noted above, fairly precise and accurate methods for measur- ing the operating variables.
7.6.3 Corrosion Product Deposition
We are studying the use of a cold trap in a reactor coolant system to induce preferential deposition of corrosion products and thus minimize scaling of the heat exchanger tubes. Tests are being conducted with the test loop to develop information on corrosion product solubility and on the nature of the deposits which are formed on a cold finger (Fig. 7.11) inserted in the salt in the pump bowl. Operation of this unit for 3 hr at a wall temperature of about 750'F produced a deposit of green crystals of the following composition:
Na B F Fe Cr Ni 0 2
Wt% 21.4 5.91 58.2 3.50 6.61 0.04 0.27
LJ The atomic ratios correspond roughly to a mixture containing 2 moles of Na3CrF6 to 9 moles of NaBF4. Further studies will be made to determine whether keeping the wall temperature defmitely above the .- liquidus reduces the NaBF4 concentration. *
7.6.4 Gas System Studies
Our experience when operating the test loop with the clean batch of salt from August 19,1968, to November 4,1968, was similar to our previous experience with the flush salt in the following respects:
1. Initially, relatively large quantities of a dark-brown liquid accumulated in a mist filter in the off-gas line from the pump bowl. As operation continued, the rate of collection of liquid decreased essentially to zero, and an accumulation of solids became evident, as seen in Fig. 7.12.
2. There was frequent evidence of fouling of the pump bowl pressure control valve. The valve would gradually assume an 80% open position as compared with a position of 20% open when clean. On several occasions the valve stuck in the closed position. Figure 7.13 shows the accumulation of solids on the valve stem.
3. A restriction developed in the off-gas line at the pump bowl outlet nozzle. At first, it could be cleared by blowing with gas or by applying moderate amounts of heat, but the restriction gradually became more intractable and ultimately refused to yield to torching to red heat.
Following the shutdown on November 4, 1968, the off-gas lines were opened for inspection. The restriction at the pump bowl nozzle was found to be a dirty white
PHOTO 76162 COLD SURFACE
0 4
INCHES u
Fig. 7.1 1. Cold Finger Used for Corrosion Product Deposition Tests - NaBF4 Circulation Test.
.
t
c
I

103
LJ s
- 4
E
. t
. fig. 7.12. O f f a Mist Filter - N&F4 Circulation Test.
Fig. 7.13. Accumulation of Solids on End of Stem of Pressure Control Valve - NaBF4 Circulation Test. bd

104
solid, and quantities of off-white solid were found in the pipeline and in the control valve downstream of the nozzle. Samples were submitted for chemical analysis, results of which are reported as sample I11 in Table 7.3. Representative analyses of other material removed from the off-gas line since startup of the loop in March 1968 are also shown in the table.
A Calrod heater and thermocouples were installed on the ‘4 -in.-IPS by 6-in.-long vertically oriented off-gas nozzle, and the line immediately downstream was modified to permit pressure profile data to be obtained and to provide for the installation of experimental traps and filters. When operation was resumed on December 19, 1968, the test section contained, in order, a settling tank, a wet-ice cold trap, and a highefficiency porous metal filter. The settling tank and cold trap were subsequently replaced by an experimental impactor unit, and currently the system is operating with only a porous metal filter,
The normal mode of operation has been with no power to the heater on the off-gas nozzle. Under th is condition the pipe wall temperature drops below the salt liquidus, 720”F, at a point just past the nozzle inlet. Heat has been applied on two occasions to relieve flow restrictions. The first time, at 670 hr, heating the nozzle to 950°F resulted in only temporary relief. The second time, at 1000 hr, heating to 1025°F reduced the pressure drop to zero. By the end of February, or 1700 hr cumulative total, the restriction had not reappeared. During this period of operation, solids accumulated in the settling tank, impactor unit, and Mter, and a small quantity of dark-brown liquid collected in the cold trap. In all cases the solids were white or light tan; in the flush salt run, the solids removed from the off-gas system were mostly black with some green. The
light-tan material is probably a mixture of the white 6.1 solid and dark-brown liquid. Periodic weighings were made in an attempt to determine collection rates, and samples were submitted for chemical analysis.
Accumulations in the off-gas lines, traps, and control valve have been mixtures of materials. The basic ingredients of the mixtures are a white solid (sample IV) and a viscous liquid (sample I). The solid is primarily NaBF4 -NaF eutectic, which is introduced into the vapor space as a salt mist (probably generated by the fountain flow in the pump bowl) and then transported into the off-gas line. In cooling from liquid droplets at 1025°F to solid particles at 720°F, the large surface area of the droplets and the presence of BF3 at a partial pressure corresponding to the 1025°F tempera- ture make conditions very favorable for absorption of BF3 by the salt. The solidified particles should also tend to absorb BF3, but at a much slower rate. As a result, samples of salt removed from the off-gas line contain an excess of BF3 as compared with the eutectic composition. The viscous liquid is thought to be a hydroxyfluoroboric acid which is present as a low-level impurity in the original charge of salt. This material is transferred to the vapor space by the combined action of the fountain flow and the liquid level bubbler and thence to the off-gas line.
Solids accumulated in the traps have an estimated bulk density of about 0.3 g/cm3, and they appear to be agglomerates of particles about 1 I.( in size. The fact that the particles could be transported to the control valve, which is separated from the pump bowl by 30 ft of tubing having many right-angle bends, also implies particle sizes of 1 I.( or less. Solids which were found in the settling tank and the impactor unit were tan in color and had a caked appearance, factors which were
- . .
?
Table 73. Analyses of Materials from Off-Gas Line NaBF4 circulation test, PK-P loop, 9201-3
All results in weight percent
Sample Date Na B F Fe Cr Ni 0 2 C
I. Brown liquid, PKS8 4-11-68 10 51 10 off-gas venla
II. Blackpowder 5-3M8 9.3 2.9 35.1 15.0 3.0 4.4 24.6 111. White powder 11-5-68 19.3 9.5 66.0 1.0 0.26 0.29 0.67 IV. White powder from filtet 1-1369 20.4 9.6 68.6 0.05
Composition of 22.0 9.53 68.44 NaBF4-NaF (92-8) eutectic mixture
t
. s
. I
LJ “Balance of material in liquid, PK-SI, was assumed to be water.

105
attributed to absorption of the dark-brown liquid. Figure 7.14 shows material collected in the settling tank. The black appearance of solids (sample 11) collected in the trap at the pump bowl outlet during the flush salt run is attributed to debris (mostly compounds
W a . 0
4
of Fe and C) left in the loop fiom previous operations. Similarfy, the green appearance was due to residual BULT-4 salt! Deposits on the surface of the porous metal filter were initially snow white but eventually changed to tan as more material accumulated and possibly as a small amount of brown liquid collected on the solid. The deposit had remained white throughout the period in which the cold trap was in operation.
The rate of emission of the salt mist appears to be 0.1 to 0.3 g per 1000 liters of gas. Periodic weighings indicate that the rate of accumulation of material in the fdter is somewhat higher when the off-gas nozzle at the pump bowl is clean than during subsequent operation.
6MSR Rogram Semiann Rogr. Rept. Aug. 31, 1968, ORNL-4344, p. 78.
When the restriction to flow is high at the nozzle, the accumulation rate with the same flow of gas appears to be essentially zero. This effect is attributed to an increase in removal efficiency in the nozzle area as deposits build up and the gas velocity increases.
The rate of emission of the liquid is initially high and then decreases and appears to approach zero, which tends to support the theory of an impurity that is gradually stripped out of the salt. Operation for 600 hr in December 1968 and January 1969 produced an accumulation of about 2 cm3 in the wet-ice cold trap. This compares with an estimated 30 cm3 of liquid conected over the same period of time at the beginning of the clean salt operation. Estimates of the total quantity of liquid emitted are equivalent to removal of about 500 ppm of impurity from the salt.
After 1600 hr of operation following the installation of traps and filters, the off-gas pressure control valve is still controlling in its “clean” position of 20% open. This fact, plus visual examination of the fdter, indicates that the porous metal has been quite effective in
.
c
b . W
Fig. 7.14. Accumulation of Solids in 3-in.-ID Settling Tank - NaBF4 CircuIation Test.

removing the particulate matter from the gas stream. The filter now in use contains three elements in series: NEVACLOG, a patented form of perforated metal by Multi-Metal Wire Cloth, Inc., and two layers of porous metal, FM-225 and FM-204, by Huyck, Inc. Each element has a cross-sectional flow area of 3 in?, and the overall clean pressure drop for the normal loop conditions of 1 cfm/ft2 is less than 0.1 psi. After 1200 hr of service the total loading was about 5 g, and the pressure drop had not increased appreciably.
The prevention of off-gas restrictions involves a threefold approach (1) pretreatment of the salt to remove excessive quantities of the brown liquid impuri- ties, (2) development of a trap or entrainment separator which will prevent the formation of plugs in the critical transition region where the salt droplets are cooling and solidifying, and (3) use of a porous metal fdter to remove any subcooled particles which are carried past the trap. The inlet section of the trap should be a hot zone where the salt mist is efficiently deentrained and allowed to drain to the pump bowl. The outlet section should be designed to chill the unretained fraction of the mist so that the subcooled particles will remain gas borne and will be camed into the filter section. Several trap designs are under consideration, and selected models will be tested in the loop system.
7.7 MSBRPUMPS
A. G. Grindell C. K. McClothlan
P. G. Smith L. V. Wilson
H. C. Young
7.7.1 MSBR PrimarySalt Pump
The study concept of the primary-salt pump for the 1000 Mw (electrical) MoltenSalt Breeder Reactor (MSBR) has not changed significantly from that shown and described previously? s8 The conceptual layout has been modified, as shown in Fig. 7.15, to reflect approaches to resolving some of the interface problems between the salt pumps and the remainder of the primary pump system. The pump is based on a flow of 16,000 gpm, a head of 150 ft, and a speed of 890 rpm The required horsepower will be about 2500 for each Pump-
Since the reactor is the fixed component in the system, the primary-salt pumps are subjected to thermal
'MSR h g m m Semiann Rog. Rept. Feb. 29, 1968,
'MSR Rogrm Semiann Rogr. Rept. Aug. 31, 1968, ORNL-4254, pp. 76-78.
ORNL-4344, pp. 80-81.
106
expansion displacements of about 2 in. horizontally and about 1 in. vertically at the pump tank. The design effects of these displacements on the pump show in the shield configuration, method of pump support, cell and/or pump containment, and, depending on the method of mounting the drive motor, the coupling between the motor and the pump. The shielding around the concept pump is of the disk-anddoughnut type and will permit the unhindered displacement of the pump and also provide adequate shielding of the lubricant and coolant in the region of the lower bearing and seal. Additional shielding may be provided above the pump tank to reduce nuclear radiation intensity at the crane bay floor to an acceptable biological level.
In our present concept the motor is mounted directly on the crane bay floor, and the pump is suspended on spring-mounted support rods that are free to pivot at both ends. The spring constant of the springs will be suffiqiently low that the forces on the pump tank nozzles will not be excessive. The coupling between the motor and the pump is a floating shaft gear which will be installed in the maximum horizontal displacement position. During system heatup the pump will move into a position where the pump shaft will be nominally aligned with the motor shaft for normal pump oper- ating conditions. An alternative concept would have the motor mounted directly on the pump bearing housing. This would eliminate relative thermal displacement between the pump and motor and relieve the coupling from having to accommodate the displacements. How- ever, the spring-support rods would need to accommo- date the added weight of the drive motor.
The concept has a large seal leakage containment volume to accept the oil from a gross failure of the lower seal. In addition, a Visco seal, adjacent to the lower seal, will prevent oil from entering the salt system when the shaft is rotating. When the pump is stopped a static shutdown seal can be actuated by gas pressure to prevent the flow of oil down the shaft annulus. The primary purpose of the static shutdown seal is to permit the removal of the bearing housing assembly without removing the shield plug, shaft, and impeller from the pump tank.
Means for cooling the pump tank, its internal struc- tural elements, the pump shaft, and the lower end of the shield plug have been included in the modified concept. The nuclear heat generation in these com- ponents will be removed in primary salt (at about 10SO"F) from the fd and drain line of the reactor system. The salt enters a plenum around the inner periphery of the pump tank and flows upward in an annular liner. At the junction of the pump tank and
,
>
r
*

107
W
.
.
0
c . lccd
13 '
ORNL-DWG 69-6802
--E
Fig. 7.15. MSBR Primary Salt Pump, Conceptual Layout.
25 _1

108
outer pump casing the flow splits, with part of the flow passing downward between the inner and outer pump casings and part of the flow passing across the lower end of the shield plug and into the annulus between the shaft and the shaft sleeve. In the pump tank these flows combine with the fountain flow from the labyrinth seal behind the impeller, the return flow from the chemical processing system, and the return flow from the entrainment separator. All these flows are returned to the main stream of the reactor system through a drain line connecting the bottom of the pump tank to a low-velocity point inside the reactor. Block or spherical fders will be placed appropriately in the pump tank to reduce the parasitic volume of primary salt.
At each pump the primary cell containment is extended through the concrete shielding above the reactor cell to contain the pump drive motor. The drive motor heat sink is provided by cooling water circulated through cooling coils attached to the outside of the mo- tor containment vessel. Internally a blower attached to the motor shaft will circulate helium through the motor and over cooling fins attached to the inside of the motor containment vessel. The motor is mounted on a ring through which all electrical, instrument, gas, coolant, and lubricant lines are connected to the pump.
7.7.2 Pump Program for the Molten-Salt Breeder Experiment
The p l a n ~ ~ 9 ' ~ outlined previously to obtain the primary- and secondary-salt pumps for the MoltenSalt Breeder Experiment (MSBE) are progressing. A second draft of the specification for the MSBE primary-salt pump was prepared to include the comments generated in an internal review of the first draft. An evaluation team consisting of personnel from the Purchasing Division, the Reactor Division, and the Inspection Engineering Department was selected. The team de- veloped a rating system for pre- and postproposal evaluation of potential salt pump manufacturers. Also it selected 12 United States pump manufacturers and contacted each by letter to determine his interest in participating in the program and in reviewing a draft copy of the specifications for the primary salt pump. Each of the six pump manufacturers who evinced interest in the program was visited by the team. The purpose of the visit was to receive and discuss the manufacturer's comments about the pump specifica-
9MSR Rogram Semiann Pmgr. Rept. Feb. 29, 1968.
'OMSR Rogram Semiann Progr. Rept. Aug. 31, 1968. ORNL-4254, p. 76.
ORNL-4344, p. 79.
L) tion, to view his fabrication and test facilities, to discuss his quality assurance organization, and to attempt to gage his interest in the salt pump program The primary-salt pump specification is being revised to reflect manufacturer comments. An evaluation of the visits is being made to select pump manufacturers to receive a Request for Proposal to participate in the pump program. The Scope of Work portion of the Request for Proposal is being prepared. The specifica- tion for the secondary-salt pump, generally patterned after the primary-pump specification, is being prepared.
The scope of the phase I portion" was revised to obtain the maximum pump manufacturer participation that can be achieved with the funds available for fncal year 1970. As now conceived, phase I will be based principally on the following items:
1. Prepare design concepts and layout drawings that meet the general intent of the specifications. I t is intended that the primary- and secondary-salt pump designs have sufficient similarity to permit a high degree of interchangeability of parts and to avoid, as much as possible, two parallel design and development efforts.
2. Investigate the limitations of using the same impeller and pump casing design for the primary- and secondary-salt pumps and obtaining the specified hydraulic characteristics by operating at two different speeds and by changing the impeller diameter.
3. Make a parametric study, for the primary-salt pump only, of the relationship between pump speed, pump efficiency, salt volume within the pump, and required net positive suction head. A pump speed and a design concept that are mutually agreeable to both the seller and the Company can then be chosen.
4. Make a study to show that the selected MSBE pump concept can be scaled up satisfactorily to a pump size having a flow capacity of at least 20,000 gpm and a head of 150 ft, and indicate the probable amount of developmental effort required beyond the MSBE pro- gram-
5. Make preliminary calculations that will provide approximate component dimensions and show that the concept meets the general intent of the specifications. This can be considered to be the minimal analytical effort required to prove a concept.
6. Make the necessary calculations and analyses to show that the pump design completely meets the requirements of the specifications.
7. Make a detailed layout drawing of the pump concept showing all features needed to meet the specific requirements of the specifications.
8. Revise the phase 11 and phase I11 programs submitted by the seller in his proposal, giving more detail on the schedule, manpower requirements, specific
I.
..
.
. f
c
1
i
.. t

manpower assignments, material requirements, develop mental effort, facility modifications and requirements, cost estimates, and the fabrication and testing plans, including location and ownership of facilities.
9. Prepare and submit a phase I report, including all analyses, studies, and layout drawings, that will permit the Company to evaluate the concept and the program plans proposed by the seller.
10. Revise the specifications for the primary and secondary salt pumps as the phase I effort indicates necessary, and prepare new specifications or use Com- pany specifications where applicable.
7.7.3 MSBE Salt Pump Test Stand
The pump test stand'" will be capable of accommo- dating full-size MSBE primary and secondary salt pumps and will be located in Building 9201-3, Y-12. We plan to utilize capital funds for its design and construc- tion, which have been estimated to cost $625,000. The detailed design of the stand and the procurement of the requisite Hastelloy N raw materials are scheduled to begin in fiscal year 1969 (if the necessary approvals are obtained in time). Completion of construction is scheduled for early in fiscal year 1972.
Several activities have been completed or broached during the report period. The preliminary design and cost estimates were completed. Project and Laboratory management approvals for the capital fund request were obtained. The safety review was made. The request for directive was prepared, approved by UCCND manage- ment, and submitted to the Oak Ridge Operations Office of the AEC. A draft of the system design description for the stand was prepared and is being reviewed internally.
7.7.4 ALPHApump
Design work has been started on a small molten-salt or liquid-metal pump to be called the ALPHA pump. It is for laboratory use in corrosion and heat transfer studies. We will attempt to design a versatile pump for flows in the range up to 30 gpm, a head capability up to 300 ft, and a maximum operating temperature of 1400'F. None of the pumps presently in use at the Laboratory meet all these criteria. Additional criteria include (1) a minimum liquid volume within the pump, (2) a minimum salt-wetted surface area within the pump, and (3) a continuous operating capability of 10,000 hr. A small tank will be located adjacent to the
109
~
"Ibid, pp. 81-83.
pump to provide access to the salt surface for auxiliary equipment and developmental needs.
7.8 REMOTE WELDING P. P. Holz
During this period, we completed the fabrication and started the testing of the automated cutting and welding equipment based on the design developed by the Air Force and the North American Rockwell Corporation. This equipment, referred to in previous reports as "orbital" pipe cutting and welding equip ment, employs a drive carriage which fits a range of pipe sizes and provides the mounting base for the pipe cutting and welding heads. Initial tests of the ORNL equipment were performed with a welding programmer loaned to us by the Air Force, after being used by them for automated control of welding process variables during tests of their equipment at Edwards Air Force Base.
Figure 7.16 shows the welding programmer and, in front of it, the remote operation pendant which is used in conjunction with the programmer for emergency shutdown or manual checkout and cutting operations. To the right of the programmer is the welding head, with the electrode and the nozzle of the wire feeding device in the foreground. The large horseshoe-shaped piece is the orbital drive assembly, which fits a limited range of pipe sizes and drives the cutting and welding heads around the pipe. Next is the cutting head, with the blade visible in the foreground. The cutting and welding heads are designed to fit in the open space at the top of the horseshoe-shaped orbital drive mecha- nism.
Figure 7.17 shows the welding head mounted on the orbital drive mechanism but opened to show the inner parts. The remote control pendant is placed next to the orbital drive mechanism, and the whole assembly is mounted on a 6-in. pipe.
Figure 7.18 shows the orbital carriage with the cutting head in place. The teeth of the cutting head can be seen through the slot in the end of the carriage. The line of the initial cut being made is visible on the top side of the pipe near the edge of the orbital carriage.
The automatic voltage control compares and corrects arc voltage with respect to a standard polarity and a preset voltage. The resultant signal controls the input to the wire feed amplifier, which in turn varies the wire feed rate in a way that reduces weld bead irregularities as the torch traverses the pipe. The welding control programmer lent to us by the Air Force is designed to control and/or sequence each of the following welding variables or functions:

110
1. welding current vs time, 2. maximum welding current, 3. welding current pulse amperes and pulse time, 4. upslope time, 5. welding time, 6. downslope time, 7. welding voltage, 8. welding tool speed, start time, 9. wire feed speed, start-and-stop time, AVC voltage,
10. oscillator frequency.
The welding head performs the following operations: (1) locates the electrode accurately with respect to the weld joint, (2) feeds filler wire at the desired rate to the weld joint, (3) provides space to store sufficient welding wire on a spool for multiple filler weld passes, (4) provides the required flow of inert welding gas to the torch cup, ( 5 ) provides power and cooling water flow to the torch head, and (6) provides cross-seam oscillation of the electrode.
The cutter head performs the following operations: (1) cuts the pipe, (2) mi l ls the pipe ends square, and (3)
hi m i l l s the required weld joint configuration at the pipe ends.
The complete cutting, welding, and automated Con- trol assembly became available just at the close of the reporting period, and only a few operational tests were performed; but these tests, without benefit of operating experience or equipment debugging, gave very encour- aging results. The 6-in. stainless steel pipe shown in Figs. 7.16 and 7.17 was successfully cut and welded. The carriage tracked perfectly in cutting and welding through a number of trial sawcuts, bevel cuts, and test welds. The weld beads, including the root paths, looked promising for stainless materials; no other materials were tested. The evenness and consistent quality of the weld bead were especially promising, although no formal weld inspection tests were performed.
A detailed “Proposal for the Development of a Remote Control System for Cutting and Welding Radioactive Pipe and Vessels” was submitted to the Director, Division of Reactor Development and Tech- nology. The proposal covers a five-year, $3,000,000 development program to adapt the orbital equipment to fully remote operation in high radiation fields. The proposed program is planned to yield a complete system, with two prototype working units for fully
. *
Fig. 7.16. Equipment for “Orbital” Weld System. A commercial TIC welding power supply used with the equipment is not shown. L)

111
.
. 0
t
. t
automated and remotely controlled pipe cutting, be valuable for maintenance of every operating reactor, welding, and inspection and for seal welding of flanges the proposed development program was recommended on reactors and other radioactive systems. Because a for General Reactor Technology funding rather than remote cutting, welding, and inspection system would support within the MSR program.

112
Fig. 7.18. Orbital Cutter.
Lr
. 8
8 . .
-

bi+ f
.
P
- t
.
. bd
I I i I I ! 1
..% 7;.
x <
8. MSBR Instrumentation and Controls
8.1 CONTROL SYSTEM ANALYSIS
W. H. Sides, Jr.
The simulation of the single-fluid 1000 Mw (electri- cal) MSBR for the preliminary investigation of the overall plant control problems was completed. To the model previously reported,' which included a lumped model of the primary heat exchanger and steam generator, was added a lumped model of the reactor heat transfer, a two-group approximation of the core nuclear kinetics equations, and a reactivity control system. The completed lumped model is shown in Fig. 8.1. As in previous calculations, the heat transfer coefficient on the tube side of the exchangers was taken to be proportional to the 0.8 power of the tube-side flow rate and on the shell side proportional to the 0.6 power of the shell-side flow rate. The temperature of the feedwater entering the steam generator was held constant at 700°F, and system pressures were assumed constant.
The nuclear kinetics equations used in the simulation were a two-group form of those from McPhee? The transport lag introduced into the delayed-neutron pre- cursor equations by the circulation of the fuel was approximated by a first-order lag, that is,
The temperature coefficients of reactivity for the primary salt and graphite were also included in the simula tion.
The conceptual control system for controlling system flows, temperatures, and reactivity is indicated in Fig. 8.1. As in previous studies,' the objective of the control system was to maintain the steam temperature within a
transient condition. The previous studies indicated that a variable secondary-salt flow rate was necessary for sufficiently rapid steam temperature control. Therefore, the secondary-salt flow rate was altered at a rate proportional to the error in steam temperature, as indicated in the figure. Previous studies also showed that an acceptable steady-state system temperature profile could be obtained for partial plant load con- ditions if the secondary-salt flow rate were returned to its 100% power level value following a transient. Therefore the error in secondary-salt flow rate gener- ated by the steam temperature control action produces a rate of change of the reactor outlet temperature set point. This outlet temperature is compared with the reactor inlet temperature, and this reactor AT yields the reactor power level set point. This power level set point is compared with the actual reactor power level, and the error signal operates a servo controller which produces appropriate control rod motion with the maximum reactivity insertion rate limited to O.l%/sec. Thus the secondary-salt flow rate is returned to its 100% power level by altering the reactor temperature level through the reactor outlet temperature set point.
Several transient cases were run with this model, including decreases in power demand from 100% by steps of 10,30,50, and 60% and by ramp changes of 30 and 70% each at 5 and lO%/min; changes in reactivity of steps of 50.05, 20.1, and -0.5% and, with the reactivity controller disconnected, reactivity steps of 20.05, +0.01 , and -0.1% and ramp changes in reactivity of +0.05 and -0.1% each at O.l%/min. Also the step loss of one secondary-salt coolant loop was simulated. The system transfer function between control rod reactivity as an input and reactor power was also measured.
The results of load demand perturbations are sum- few degrees of the desi@ value of 1000°F during a - marized in Table 8.1. The m&um steam temperature
deviations from 1000°F are given, as well as the maximum required rates of change of the secondary-salt
ORNL-4344, p. 88. flow rate and the control reactivity. The highest reactivity rate is seen to be well below the O.l%/sec
~ M S R h o g a m Semhnn hog. Rept. Aug. 31, 1968,
*J. McPhee, NucL Sci. Eng. 4,588-97 (1958).
113

114
ORNL-OWG 69-5492
SECONDARY SALT SETPOINT FLOW RATE^] ERROR g (1000 OF)
I I
I i i I
I I J I I
I I I
"'̂ CT?R-PCGR_I r---
ncu_ CONTROL r
! I ROD
I
I
I I I I I I I I I I I I I I I I I I I I I
m STEAM I
I FEEDWATER
( 700 OF 1
REACTORCORE HEAT EXCHANGER STEAM GENERATOR
Fig. 8.1. Lumped Model of MSBR for Hant Simulation.
tJ
.
*
0
. Table 8.1. Results of Load Demand Perturbations
A. Step Losses of Load Demand (from 100%)
Maximum Maximum Value Maximum Maximum Magnitude Final Steadyatate Temperature (OF) Steam Rate Of Rate of of Control
Of Change of Reactivity Required Secondary-Salt Reactivity Of Step Reactor Reactor Secondary Salt Secondary Salt
(%I Inlet Outlet Cold Leg Hot Leg (%/=I (%I Error Flow Rate
(%/=c) (OF)
10 13 -0.74 -0.00035 -0.014 30 1009 1183 867 1077 44 -2.3 -0.00106 -0.045 50 976 1098 875 1025 147 -4.3 -0.0030 -0.075
B. 30% Ramp Loss of Load Demand from 100% to 70%
Maximum Value of Control Reactivity RC?&Kd
(%)
Rate Of Maximum Rate of Change of Reactivity (%/set)
Ramp Maximum Steam change of Rate Temperature Enor Secondary4alt
(%/min) (OF) Flow Rate (%/SeC)
10 9 5 5
-0.41 -0.000175 -0.045 -0.26 -0.00015 -0.045
. a
0

115
maximum allowed by the controller. The maximum value of control reactivity required during a transient is also shown.
The results of the simulation of the loss of one secondary-salt coolant pump indicated that the plant cannot deliver 100% of full load with the temperature and flow limits which were placed on the system in this model, namely, a limit of 110% of full flow per loop on the secondary salt and a limit of 1400'F on the reactor outlet temperature set point.
A complete report on the methods and results of this study is in preparation?
It is apparent from the results of this study that the rather narrow bands within which the temperatures of the two salts must be maintained will produce a necessity for careful control. Such plant maneuvers as increasing and decreasing the load demand on the plant and certain reactivity excursions may allow these temperatures to decrease below the freezing points. However, the models used in these simulations and calculations are abbreviated, and the results are in- tended only to indicate possible trends in future more detailed investigations. Such investigations are not possible with the analog equipment available at present without either linearizing the simulation equations (reducing the dynamic range) or simulating only a part of the plant at a time or both. Even then the modeling of such a unit as a supercritical steam generator is a difficult task on the analog computer. A more detailed simulation than is attempted here should be attempted by employing more powerful simulation techniques, for example, hybrid computation.
8.2 CALCULATIONS OF NEUTRON DECAY AFTER SHUTDOWN
W. H. Sides, Jr.
The calculation reported previously' of the decay of the neutron density in the MSBR core was extended to investigate the effects of (1) the contribution of the photoneutron reaction from beryllium and (2) the loss of all primary-salt flow rate.
8.2.1 Calculation of the Effect of the Beryllium Photoneutron Reaction on
Neutron Density After Shutdown
A calculation was made of the neutron source resulting from the 9Be(y,n)?He reaction, based on an estimation of the total gamma-ray flux above 1.67 Mev in the 1000 Mw (electrical) MSBR core. This source was treated as a seventh delayed-neutron group in the
circulating fuel kinetics equations of Meghreblian and Holmes? The total gamma-ray flux in the MSBR core of an energy above 1.67 MeV, the threshold for the reaction, and from isotopes having a half-life of between 2 and 35 min was estimated to be approxi- mately 1.3 X 10' photons cm-2 sec-' or less. With a BeF2 concentration in the primary salt of 16 mole %, the total photoneutron source was calculated to be no greater than 4.22 X Id neutrons sec-' . Treating t h i s source as a seventh delayed-neutron group yielded a value for the delayed-neutron fraction, p, for this group of 1.2 X with a mean decay constant of 7.6 X
/sec. A subsequent seven-group calculation com- pared with a previous six-group calculation indicated that the contribution of this neutron source to the decay of the neutron density after a -1% step in reactivity was negligible.
8.2.2 Calculation of Neutron Density Following Loss of Primary Flow
The behavior of the neutron density as a function of time after the loss of all primary-salt flow was investi- gated by a simulation on the Reactor Controls Analog Computer. The steady-state full power for the core was 2250 Mw (thermal). The calculations were carried out for both " 3U and
The event analyzed was one in which all primary-salt pumps coast down from full flow to zero following loss of power to the pumps. Negative control reactivity of up to 1% was inserted into the core either simul- taneously with the initiation of pump coastdown or following pump coastdown by some specified delay time. An abbreviated heat transfer model was included to approximate the effect of the temperature coeffi- cients of reactivity. A two-delayed-group model for the kinetics equations was used? The calculation was carried out for times up to 300 sec after the initiation of pump coastdown.
U is shown in Figs. 8.2 and 8.3. Figure 8.2 shows the effects of various amounts and rates of reactivity insertion on the integrated power in the core 300 sec after the initiation of primary flow coastdown and simultaneous insertion of reactivity. The ordinate is given in units of mega-
U.
A summary of the results for
3W. H. Sides, MSBR Control Studies, ORNL-TM-2489 (to be
4MSR h o m m Semiann Frog. Rept. Aug 31, 1968.
'R. V. Meghreblian and D. K. Holmes, Reactor Analjwis,
issued).
ORNL-4344.
pp. 590-601, McGraw-Hill, New York, 1960.

116
watt-seconds of energy generated in the core per initial steady-state megawatt for that fraction of the thermal power which is directly proportional to the neutron density. The insertion of the reactivity as a step is, of course, the upper limit on speed of insertion of reactivity. Figure 8.2 shows, for example, that if -1% in reactivity is inserted at a rate of O.l%/sec rather than as a step, the amount of energy generated in the core 300 sec after shutdown increases from 1.17 MwseclMw to 2.75 Mwsec/Mw. If the ramp rate is decreased by a
ORNL-bWG 69-5493 3 2 , I I I I I
AMOUNT OF REACTIVITY INSERTED (70)
Fig. 8.2. Integral of Reactor Power at 300 rec After Start of Primary Pump Coastdown vs Amount of Reactivity Inserted as a Ramp or Step Initiated Simultaneously with Pump Coastdown for 233~.
ORNL-DWG 69-5494
4
l e -1.0% AT 0.10'70/sec /x y-0 .5% AT O.tO%/sec I
4 8 !2 16 2 0 DELAY IN INITIATING ROD MOTION (sec)
Fig. 8.3. Integral of Reactor Power at 300 sec After Start of Primary Pump Coastdown vs Delay Between Initiation of Flow Coastdown and Insertion of Reactivity for 23 U.
factor of 5 to O.O%/sec, this number increases to 6.08 Mwsec/Mw. The flattening of the curves for the larger amounts of inserted reactivity indicates the diminishing value of increments above 1% in reactivity magnitude.
If there is a delay between the initiation of pump coastdown and the insertion of reactivity into the core, for example, due to the time required for sensing and evaluating an event, the integrated power generated in the core may be increased. Figure 8.3 shows this effect for delay times of 5, 10, and 20 sec. Reactivity magnitudes of -0.5 and -1.0% at rates of 0.02 and O.l%/sec were used in accordance with the previous figure. I t may be seen from the previous figure that these curves will approach 29.6 Mwsec/Mw as the delay time approaches 300 sec, since this approaches the case of no control action taken after pump coastdown.
8.3 DYNAMIC ANALYSIS OF MSBR STEAM GENERATOR
F. H. Clark 0. W. Burke
Work performed at Oak Ridge on the dynamic analysis of the MSBR steam generator has been re- ported in ORNLTM-2405, issued January 1969.
A more extensive analysis of the steam generator is being carried on under subcontract with the University of Illinois at the university's hybrid computation facility. Preliminary setup of the problem is complete, and troubles are now being experienced in attaining convergence of the pressure. Such difficulties are not uncommon in dynamic water analyses and are related to the near incompressibility of water. In the super- critical water domain it would not be justified to make the simplifying assumption of incompressibility.
8.4 HIGH-TEMPERATURE RESISTANCE THERMOMETER EVALUATION
R. L. Moore T. M. Cate
. . s
. m .
Investigation of the feasibility of measuring high temperatures in molten-salt systems with resistance thermometers was continued! Phase I tests of two sets of thermometers (one matched and one unmatched) have been completed. The purpose of these tests was to determine whether gross shifts in calibration would occur during prolonged operation at high temperature with occasional wide variations in operating tempera- ture, including return to room temperature.
c
0
i d 'MSR Rogram Semiann Rogr. Rept. Aug. 31,1968, ORNG
4344, pp. 94-95.

117
W P . *
*
. *
.
. e
0
U
The tests were performed by heating the elements from room temperature to a preselected temperature, operating at this temperature for varying periods of time, and then cooling to room temperature. The bridge output voltage was observed during the cycle to detect calibration shifts and to determine the degree of mismatch of the calibration of the two thermometers. Before and after each cycle the ice-bath (32°F) resist- ance of each element was measured to determine the magnitude of any shift which occurred.
The unmatched (off-the-shelf) set of thermometers was tested first. Results of these tests are shown in Fig. 8.4. No change in calibration was observed after initial successive cycles to 800 and 1200°F; however, when the thermometers were heated to 1400'F there was indication of a calibration shift, and when the ther- mometers were cooled to room temperature it was noted that a 14-mv shift (equivalent to 5°F) had occurred in the output signal. Subsequent checks showed that the 32°F resistance of one element, lA , had increased from 100.12 to 101.52 ohms and that the resistance of the other element, IB, had increased from 100.2 to 100.32 ohms. During five succeeding cycles to 1200'F no further shift occurred; however, during subsequent cycles of various durations to 1300,1400, and 1500"F, the resistance of element L4 decreased
4 .6
part of the way and that of 1B decreased all the way to initial resistance. This suggested that the initial shift was due to induced stresses which were relieved by subse- quent operation at high temperature.
Further testing of these thermometers was then deferred to do testing of the second (matched) set and to determine whether the calibration of the first set would continue to shift at room temperature. As shown in Fig. 8.5, the performance of the matched set was similar to that of the unmatched set.
Testing of the first set was resumed and showed that the resistance of the thermometers had not changed during a month at room temperature. This indicated that the thermometers could not be expected to recover their initial calibration in any reasonable time at room temperature. During the subsequent operation, we attempted to determine whither extended operation at ISOO'F, the maximum rated temperature, would result in stable operation at all lower temperatures. After several weeks of testing, it appeared that the 32'F resistance of both elements had stabilized, with L4 0.4 ohm above the as-received value and 1B at its initial value. No provisions were made for checking the accuracy of the thermometers at high temperature in phase 1 tests, so we do not know at this time whether the OA-ohm shift is a zero or span shift.
0 ELEMENT NO. 1 - SERIAL NO. 4743 INITIAL RESISTANCE- 400.423 Q A ELEMENT NO. 2- SERIAL NO. 4742 INITIAL RESISTANCE- 400.024 8
ORNL-DWG 69-5495 4 O F = 0 . 2 1 7 8 AT 32°F
4 O F = 0.4748 AT 42OOOF
t- FIRST SERIES TEST PERIOD .+-'E%J -+- T w t D SERIES TEST PER i OD 4
60 72 04 96 100 420 432 444 TIME (days)
Fig. 8.4. Effect of Temperature Qcling and Extended High-Temperature Operation on the Ice-Bath (32'0 Resistance of an Unmatched Set of Platinum Resistance Thermometers.

118
The matched set of thermometers was also subjected to extended operation at 15W°F with similar results, as shown in Fig. 8.5. This completed the phase 1 tests. Phase 2 tests are planned in which a more accurate
determination will be made of the calibration and rate of shift of calibration of one or more sets of ther- mometers.
0 ELEMENT NO. 4 -SERIAL NO. 4744 INITIAL RESISTANCE-i00.460 n A ELEMENT N0.2- SERIAL NO. 4745 INITIAL RESISTANCE - (00.222 0.
ORNL-DWG 69-5496
toF=0 .247 D AT 32OF 4 O F =0.4748 AT 4200OF
4.2 J 4-
0.8 Zf 5ow
z z 5E 0 SK
- 0.4
W n -0.4
- b- SECOND SERIES TEST PERIOD -~STEHd&+-------FoURTH TESTS SERIES TEST PERIOD
k 4600 W cr 3
V'
I I I r 7 a ' 406 448 (30 142 454 466 478 490 202
Y W n
I - 0 0 4 8 42 16 20 24 28
TIME (doys)
Fig. 8.5. Effect of Temperature Cycling and Extended High-Temperature Operation on the IeBath (32OF) Resistance of a Matched Set of Platinum Resistance Thermometers.
bi . .
.

u t . c
*
.
. s . W
9. Heat Transfer and Thermophysical Properties
9.1 HEAT TRANSFER B. Cox H. W. Hoffman J. J. Keyes, Jr.
In the previous semiannual report' the experimental procedure was described in detail, and a schematic diagram of the system for determining the heat transfer coefficients with molten salts flowing in metal tubes was depicted. Experiments were discussed in which a proposed single-region MSBR fuel salt (LiF-BeF2 - ThF4-UF4, 67.5-20-12-0.5 mole 76) was employed. The test section was a 24.5-in.-long, 0.25-in.-OD, 0.035-in.- wall Hastelloy N tube, resistance heated. In par- ticular, it was noted that, while the temperature data in the low laminar regime (Reynolds modulus NRe 800) were consistent with the pattern ex- pected for fully developed flow beyond a reasonably well-defined entrance length, the data in the low turbulent regime (NRe 2 10,000) showed irregular wall temperature variations along the tube which were inconsistent with expected behavior for developed turbulent flow.
During the current report period, a detailed study was made of possible sources of error which could lead to the observed temperature irregularities. It was con- cluded, for example, that effects of volumetric heat generation in the salt were negligible. Also eliminated as sources of error were effects due to non-steady-state operation, nonuniform heat loss, and spurious emf3 induced in the thermocouples by the 60-Hz heating current. Thermocouples which were suspected of being subjected to aging or work hardening were replaced, as were a few faulty channels in the scanning-type readout instrument.
The only uncertainty which could not be eliminated was the influence of a small hole which had been burned in the test section near one end and then repaired by welding. The length of test section down- stream from this point (about 120 diameters for flow
'MSR Program Semiann. hg. Rept, Aug 31, 1968, ORNL-4344, pp. 96-100.
119
entering the near end) should be sufficient, it was believed, to minimize the effect of any disturbance produced in the repair zone. However, for some of the runs at moderate and high values of the Reynolds modulus, a more abrupt decrease in wall temperature was observed at a distance about 6 in. from the inlet when the flow entered the end of the tube nearest the repair (located about 3 in. from the inlet) than was observed at a comparable distance for flow entering the opposite end. The amplitude of the disturbance in the wall temperature was about the same for flow in either direction.
Heat transfer experiments employing the modified apparatus with the proposed MSBR fuel salt revealed essentially the same irregularities in axial temperature profile in turbulent flow as had been observed in the initial experiments. The new results covered a range of NRe from 375 to 6570. Table 9.1 is an updated summary of operating conditions for all experiments with the MSBR fuel salt. In one group of runs (55,61, and 71) the Reynolds modulus was held constant at about 6000 and the inlet liquid temperature at about llOO°F, while the heat flux (based on the liquid enthalpy rise) was varied from 0.66 X IO5 to 6.02 X lo5 Btu hr-' ft-2. If the abnormalities in the axial temperature profile were due to influence of ~ t u r a l convection or variation in physical properties (possibly changing the radial velocity and temperature profiles sufficiently to delay establishment of fully developed hydrodynamic and thermal conditions), then it would be expected that variations in heat flux would alter the basic shape of the profile. That this is not the case is seen in Fig. 9.1, in which temperatures measured on the outside wall of the test section are plotted as a function of distance along the test section for three different heat flux levels. The corresponding liquid temperature lines are also indicated. Note that, while increasing the heat flux exaggerated the pkak in the temperature near the inlet, the rise near the exit, and the irregularities over the middle portion of the test section, the general shape of the three profiles is the same. Thus the heat transfer coefficients calculated from the ratio

120
Table 9.1. Summary of Operating Conditions for Heat Transfer Studies with an LiF-BeF2-W4-UF4 (675-20-1245 Mole %) Mixture Flowing in
a Long Small-Diameter Hastelloy N Tube . Run Liquid Temperature (OF) W NRe NPr 4fIA Heat 1
No. AT O b m M (exit) (exit) (Btu hr-’ ft3) Balance” Tin Tout
26 27 28 29 33 34 35 36 37 38 39
40 44 45 46 47 48 49 50 51 52 55
58 61 62 64 65 66 67 68 71 72 73
1201.6 1230.1 1256.1 1281.3 1195.5 1219.0 1244.5 1265.7 1188.4 1247.7 1285.8
1316.7 1393.8 1422.9 1452.3 1475.4 1375.4 1104.9 1111.9 1116.5 1113.3 1101.7
1091.1 1092.7 1089.7 1093.9 1100.5 1091.0 1093.6 1089.9 1101.9 1098.2 1095.7
1264.9 1284.0 1311.1 1340.9 1244.1 1266.2 1290.3 1319.7 1278.4 1331.6 1358.0
1386.2 1440.7 1477.9 1511.0 1545.9 1451.2 1241.9 1215.8 1227.6 1221.0 1199.6
1140.2 1124.7 1157.2 1146.0 1155.4 1140.6 1123.6 1142.0 1111.3 1100.9 1111.8
63.3 53.9 55.0 59.6 48.6 47.2 45.8 54.0 90.0 83.9 72.2
69.5
55.0 58.7 70.5 75.8
137.0 103.9 111.1 107.7 97.9
49.1 3 2.0 6 7 5 52.1 54.9 49.6 29.4 52.1
9.4 2.7
16.3
46.9
850.8 1305.6 1945.8 2325.0 1012.2 1434.6 2203.8 2609.4 1058.4 1524.0 21 78.0
2578.8 1715.4 1993.2 2337.6 2434.2
115.2 224.4 175.2 94.8
181.2 1792.2
1969.8 2077.8 1909.8 622.2 622.2 507.0 999.0 851.4
2073.6 1932.6 2076.6
3,770 6,098 9,749
12,543 4,250 6,399
10,483 13,363 4,837 7,999
12,227
15,491 11,713 14,737 18,515 20,658
801 920 672 3 75 705
6,568
6,097 6,146 6,204 1,959 2,016 1,571 2,946 2,648 5,906 5,331 5,916
13.2 12.5 11.7 10.8 13.9 13.1 12.3 11.4 12.8 11.1 10.4
9.72 *
8.56 7.90 7.37 6.88 8.39
14.2 15.2 14.7 15.0 15.9
18.8 19.8 18.0 18.6 18.0 18.8 19.8 18.8 20.5 21.1 20.5
x io5 1.85 2.41 3.67 4.75 1.69 2.32 3.47 4.83 3.27 4.38 5.40
6.15 2.76 3.76 4.71 5.89 0.30 1 .05 0.63 0.36 0.67 6.02
3.32 2.28 4.42 1.11 1.17 0.86 1.03 1.52 0.66 0.18 1.15
1.18 1.24 1.20 1.12 1.03 1.15 1.10 1.12 1.10 1.10 1.06
1.06 1.13 1.09 1.04 1.07 1.04 1.06 1.13 1.07 1.14 1 .05
1.06 1.07 1.07 0.94 0.94 0.94 0.90 0.98 1.12 0.94 1.01
.
sensible heat gained by fluid + heat loss electrical heat input
%eat balance =
qf/A(Twau - TEqUid) all show about the same magnitude of axial variation. These results are sug- gestive of a laminar-turbulent transition, the effect i f which persists to the tube exit.
Because the temperature data suggest that stable hydrodynamic and thermal conditions may be develop ing near the exit, preliminary estimates have been made of the Nusselt modulus, NNu = hD/k (where h is the heat transfer coefficient, D the tube inside diameter, and k the salt thermal conductivity) based on test section exit conditions. In Fig. 9.2 the dimensionless heat transfer function NNu (ps/p)0.14/Npr0.33 (where
NPr is the Prandtl modulus and ps/p the ratio of fluid absolute viscosity evaluated at the tube surface to that evaluated at the bulk liquid temperature) is plotted against the Reynolds modulus. All physical properties are evaluated near the tube exit and are based on estimates presented in ref. 2. Also plotted are results obtained in the laminar flow regime. In the transition range, 1000 < NRe < 4000, the tube wall temperatures near the exit were varying too rapidly to permit
2S. Cantor (ed.), Physical Properties of Molten-Salt Reactor Fuel, Coolant, and Flush Salts, ORNL-TM-2316 (August 1968).
.,
0
0
W

121
(rd
c . c
c
4500
4400
- 4300 L . W K 3
- 2 F ,200
W n
4400
4000
OUTSIDE WALL 0 LIQUID
I
. 0 .
a
. 0 . '
ORNL-OWG 69-5497
0 . .I
. . . . I . . a
0 4 8 42 46 20 24 DISTANCE FROM INLET (in.)
Fig. 9.1. M Temperature hofdes for Three Values of Heat Flux with LiF-BeF2-ThF4-VF4 (675-20-12-0.5 Mole %) H o ~
0
in Ue~trically Heated Tube. NRe E 6000, Np, 19.
calculation of a consistent h. The empirical correla- tions of Sieder and Tate3s4 are shown for com- parison. No validity should be attached to the absolute magnitude of the heat transfer results due to the uncertainties in calculation of h. The most significant conclusion from the plot is that, while the laminar data appear to follow the expected dependence on Reynolds modulus, the turbulent data show a greater than expected dependence (i.e., a steeper slope), an obser- vation which is consistent with speculation of a transitional phenomenon persisting to the tube outlet.
By utilizing a theoretical equation suggested by Drew' and the laminar heat transfer results, it was possible to estimate the thermal conductivity of the
3W. H. McAdams, Heat Transmission, 2d ed., p. 168, McCraw-Hill, New Yolk, 1942.
4F. Krieth, Rinciples of Heat Transfer, pp. 392-94, Inter-
'T. B. Drew et al.. Trans. Am. Znst. Chem Engm 32, 271 national Textbook, Scranton, Pa., 1965.
(1936).
Id
NR. , REYNOLDS MODULUS
Fig. 9.2. Summary of F'reliminary Heat Transfer Measure- ments near the Test Section Exit with a Proposed MSBR Fuel Salt LiF-BeFz-ThF4-UF4 (67.5-20-124.5 Mole %). The lines are the empirical correlations of Sieder and Tate.3*4

fuel salt. At an average bulk salt temperature of 1188°F the average value for the thermal conductivity was found to be 0.68 Btu hr-' ft-' (OF)-' [0.012 w cm-' (OC)-' 1. Using this value in computing the heat transfer function in Fig. 9.2, the data for laminar flow and for NRe > 104 fall very close to the Sieder-Tate correla- tion. As has been observed, the tube wall temperature
patterns near the entrance of the test section suggest the possibility of a laminar-turbulent transition, with approach to developed flow near the outlet. Using correlations for laminar entrance regions6 and for developed turbulent flow (Dittus-Boelter equation)j and physical property data from ref. 2, wall tempera- tures were predicted and compared with the observa- tions. The measured tube wall temperatures were, in all cases considered, less than those calculated, indicating that the coefficient of heat transfer was abnormally high. The discrepancy was particularly pronounced over the midportion of the test section, suggesting the possibility that irregularities in the inside of the tube codd serve for turbulence promotion - these irregu- larities arising, for example, from deposition of rela- tively high-melting-point material. However, x rays of the test section indicated no significant deposition. The possibility that excessive test section corrosion could have altered the flow pattern of the salt was also investigated. Portions of the test section were cut out, mounted, etched, and photomicrographed. Figure 9.3 shows both unetched and etched photomicrographs of the tube's inner wall. Because of the high salt tempera- tures (up to 1550OF) some corrosion is present, but not enough to affect the heat transfer results. The maxi- mum pit depth observed was about '4 mil. A chemical analysis of the salt showed that no significant compo- sition change occurred during the experiments.
Before proceeding further with MSBR fuel salt experiments, it was decided to evaluate the apparatus and technique by the use of a molten salt having well-known properties and heat transfer behavior. The eutectic mixture known commercially as Hitec, manu- factured by Du Pont (KN03 -NaN02 -NaN03, 4449-7 mole %), was chosen because it is known to behave normally with respect to agreement with the standard heat transfer correlations? A new test section, identical
122
6W. M. Rohsenow and H. Y. Choi, Heat, Mass and Momentum lhnsfw, p. 166, F'rentice-Hall, EnglewoodCliffs, N.J., 1961. 'H. W. Hoffman and S. I. Cohen, Fused Salt Heat Transfer.
II.. Forced-Convection Heat lhnsfer in Circular Tubes Con- taining the Salt Mixture NaNO2-NaNO3-KNO3, ORNL-2433 (1957).
in geometry to the original one, was used, and all b, thermocouples on the test section were replaced. Figures 9.4 and 9.5 are plots of the axial temperature profile for Hitec in turbulent flow. These profiles are in marked contrast to those of Fig. 9.1 for the MSBR salt in that the Hitec data show a region along the midsection of the tube in which the wall and liquid temperature are parallel and hence the heat transfer coefficient is constant, indicative of fully developed flow. A short entrance region is evident in Fig. 9.4, and in both figures slight irregularities in the temperatures near the exit are believed to be due to thermocouple error.
The Hitec mns included three at NRe - 9000 and three at NRe - 21,000, all with variable heat flux. For nine of the ten turbulent Hitec runs the experimental heat transfer coefficients varied by less than 13% from values predicted by the Dittus-Boelter equation? These results indicate that the experimental apparatus and procedure are reliable and should be applicable to the MSBR fuel salt. The Hitec salt has been removed, the system thoroughly flushed and dried by heating under vacuum, and the MSBR fuel salt has been introduced. No changes in the apparatus will be made.
Should irregular temperature profiles persist when the fuel salt is reexamined, the next step will probably be to lengthen the test section. The addition of a "calming section" upstream of the electrodes would help estab- lish a developed velocity profile in the salt before it is heated, so that only the temperature profile would be developing in the heated section. In the present test section the temperature profile and the velocity profile are developing simultaneously, and associated effects cannot be easily separated and analyzed.
Future plans with the fuel salt call for experiments with spirally corrugated tubes for enhancement of heat transfer. Experiments will also be performed using the proposed MSBR coolant salt (NaF-NaBF4, 8-92 mole
9.2 THERMOPHYSICAL PROPERTIES
8 - . ( .
%) .
J. W. Cooke H. W. Hoffman J. J. Keyes, Jr.
9.2.1 Thermal Conductivity
Measurements in both the solid and liquid states have been completed for a proposed MSBR fuel salt mixture (LiF-BeF2 -ThF4 -UF4 , 67.5-20-1 2-0.5 mole %). A description of the absolute variable-gap apparatus used and its operation has been given previously.8 The new
V
8
\
i 4 'MSR h g r a m Semiclnn Rogr. Rept. Aug. 31, 1968, ORNL-4344, pp. 100-103.
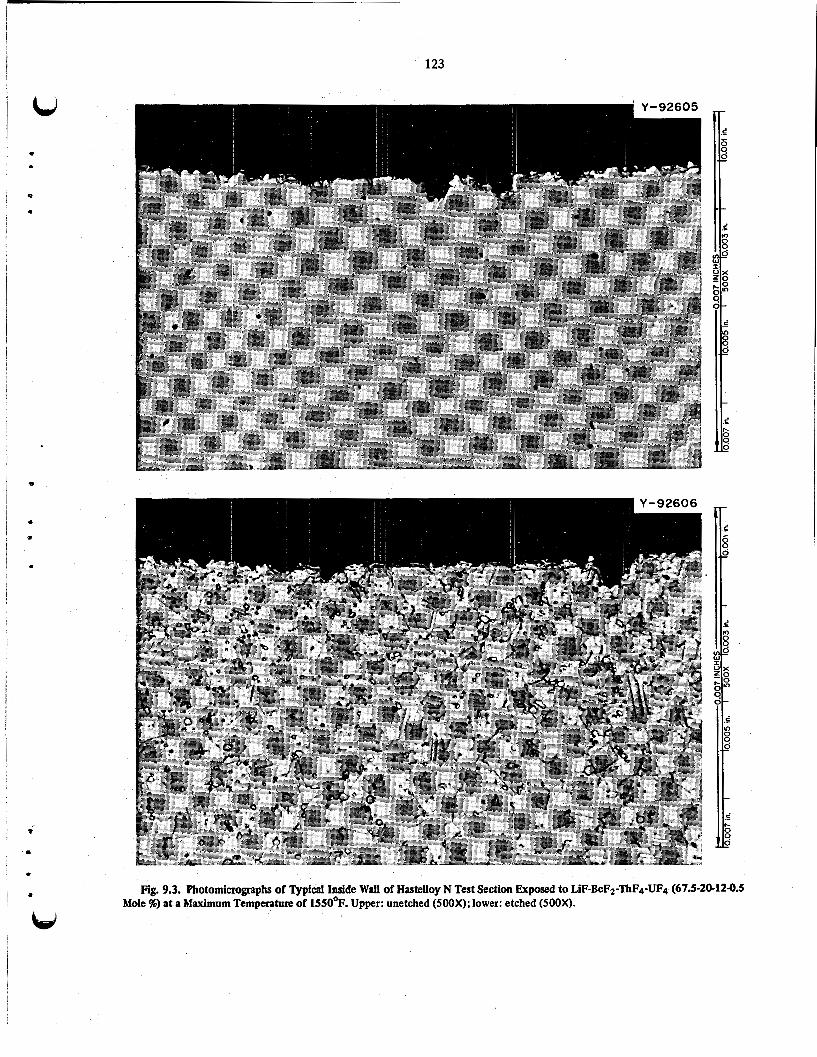
cd c . P .
a
123
c
8 Fig. 9.3. Photomhographs of Typical Inside Wall of HasteUoy N Test Section Exposed to LiF-BeFz-ThF4-UF4 (67.5-2fJ12-0.5 Mole %) at a Maximum Temperature of 1550'F. Upper: unetched (SOOX); lower: etched (SOOX).
bd

124
500 0 4 8 12 t6 20 24
DISTANCE FROM INLET (in.)
Fig. 9.4. Axial Temperature Profile with Hitec Salt (KNOS- NaN02-NaN03, 4449-7 Mole %) Flowing in m Electrically Heated Tube. NRe 8895, Np, = 6.42, q/A = 1.66 X lo' Btu hr-' ft-'.
0 4 8 12 (6 20 24 DISTANCE FROM INLET (in.)
Fig. 9.5. Axial Temperature Profile with Hitec Salt &NOS- NaN02-NaNOS, 4449-7 Mole %) Flowing in m Electrically Heated Tube. N,, = 21,055, Np, = 6.83, qflA = 3.14 X 10' Btu hr-' ft-'.
results, together with previous measurements, are shown plotted vs temperature in Fig. 9.6.
The occurrence of a maximum value of therm$ conductivity, which is observed at about 70O0C for salt mixtures containing lithium fluoride, has been observed also at lower temperatures by another in- vestibtor9 for KNOB, AgNOj, KCNS, and NaHS04. Such a maximum is therefore not unreasonable. The linearly decreasing conductivity of the solid from 300 to 45OoC is typical of polycrystalline material. The ratio of the liquid to solid conductivity at the melting point for the MSBR fuel salt was found to be 0.84, which agrees well with the average value of 0.86 f 0.13 published for a group of salts!
9A. G. Turnbull, Australiun J. Appl. Sci 12(1), 327 (1961).
Agreement with published data for the solid is Ld gratifying since measurements' in the solid state using the variable-gap technique are somewhat more difficult than in the liquid state. The specimen must be melted each time the gap thickness is changed. I t is then refrozen, and equilibrium is reestablished at the desired temperature level. The procedure is therefore slow, a full week being required to obtain each value of thermal conductivity. An additional problem relates to the possibility of formation of a void as the specimen contracts while passing from the liquid to the solid phase. However, if the void is small and consistent in shape and location, the measurements will not be affected. On the other hand, if the void is large and inconsistent, its effect on the results will be evident as irregularities in the plot of thermal resistance vs specimen thickness.
A typical plot of thermal resistance vs thickness for the MSBR fuel salt in the solid state at 44TC is shown in Fig. 9.7. Note that the thermal conductivity is derived from the slope of this graph. The data are as consistent as observed for measurement in the liquid state. Furthermore, the resistance extrapolated to zero specimen thickness is essentially the Same as that for the liquid measurements, indicating that the fured resistances (including gas films, surface corrosion films, etc.) were unchanged.
Since the validity of the experimental technique has not been demonstrated, thermal conductivity will be measured for both the solid and liquid states, when possible, for future MSBR salt mixtures. In addition to the MSBR salts, a study will be made of binary salt mixtures (probably LiFBeF2) over a wide range of compositions to develop correlations for estimating conductivities of salts, hence reducing the need for tedious and expensive experimental measurements.
. 1
. .
9.3 MASS TRANSFER TO CIRCULATING BUBBLES
T. S. Kress J. J. Keyes, Jr.
The initial concept of an experimental facility for investigating mass transfer between a liquid and gas bubbles in cocurrent turbulent flow was presented in the previous semiannual report." This project was commissioned to provide experimental data applicable to a proposed method of removing the fission product poison ' Xe (simulated by oxygen) from the MSBR
'OMSR Progmm Semiann. Prop. Rept. Aug 31, 1968, ORNL4344, p. 106.

125
ORNL-DWG 69-5500
bs 0 . P .
Y - '5 3 > > V 3 0 z 0 u J
- k i=
a E W I I-
mole ?%
LiF-BeF2-Zrb-ThF4-UF4-NaBb-NaF 0 MSRE FUEL SALT 7f.2 23 5 0.6 0 PROPOSED MSBR FUEL SALT 67.5 20 42 0.5 A MSRE COOLANT SALT 66 34 A PROPOSED MSBR COOLANT 92 6
20 '
46
42
8
4
0 200 300 400 500 600 700 800 900
TEMPERATURE ('C)
Fig. 9.6. Reliminary Results for the Thermd Conductivity of Several Sdt Mixtures of Interest to the MSRE and MSBR PI0pmS.
ORNL-DWG 69-5501
fuel (simulated by glycerol and water) by transferring it to small circulating helium bubbles continuously in- jected into and removed from the system.
Detailed design of this facility has now been com- pleted (with the exception of a bubble separating device), and assembly is about 50% complete. The only significant change from the initial concept is the inclusion of provision for operation with the test section either horizontal or vertical. Vertical orientation appears necessary for operation at low and moderate values of the Reynolds modulus to minimize the effect of bubble stratification: The analysis leading to this conclusion is presented in a later section.
Data needed for design of some of the facility components were obtained in sexeral small-scale ear&
-
/ - k-0.0462 w cm-' OC-'
! 0.04 0.06 0.08 0.40 0.42 0.14 0.46
lary -tests. These included tests on bubble generators 40 O (
SPECIMEN THICKNESS (cm) and bubble separators utilizing high-speed photographic techniques to observe the bubbles. For example, to generate the many uniform small-diameter bubbles required in the MSBR application, devices were investi- gated that introduce the gas through fine-mesh screen,
Fig. 9.,. Resistance 1s a Function of specimen mchess for a R q m d ~ B R ~~~l sdt met- point "48OOC) at 4470~.

porous metal cylinders, fritted glass disks, and through small holes into various throat positions of a variable- area nozzle. It was determined that the variable-area nozzle method being developed by Kedl" provides the most satisfactory performance.
Two types of bubble separators are being considered: a swirl flow centripetal separator being developed by Kedl' and fine-mesh conical screens wet by the liquid which act as physical barriers to the bubble. Compara- tive data for these are still incomplete; conical screens seem to provide good separation if the throughput flow is kept low enough (e.g., about 1 gpm/in? for a 200-mesh screen). Bubbles smaller than the mesh openings (-0.003 in.) are observed to penetrate the screen, but very few of these small bubbles should be present. While the centripetal separator also appears to give good separation, certain control problems remain to be solved, and such a device may have an undesirable tendency to remove dissolved gases.
To characterize the size and distribution of the bubbles, photographs have been made through a clear, rectangular plastic box filled with a liquid having the same refractive index as the glass conduit inside. A Polaroid camera with diffuse back-lighting from a Strobolume flash unit produced pictures having good resolution for the range of bubble size of interest. Figure 9.8 is an example of such a picture taken during tests on a fritted glass disk bubble generator. The pipe diameter is 1 in., and the speed of the bubbles about 10
To establish the range of parameters of interest (e.g., Reynolds and Schmidt moduli) over which the mass transfer facility could be operated, the following analysis was made to delineate the conditions con- trolling dispersion of bubbles in a turbulent liquid.
A basic assumption in the analysis-is-that bubbles should remain dispersed if the ratio, FdFg, of inertial force to gravity force exerted on the bubble is large. The gravity force is easy to determine, being simply the weight of the displaced fluid,
fps.
- pnd'g Fg=- ,
@C
where d is the bubble diameter, p is the liquid density, and g and gc are the local and universal gravitational accelerations respectively.
The inertial forces exerted on a bubble traveling at the local mean velocity in a turbulently flowing liquid
"Ibid., pp. 14-15.
126
are not so easily determined. Consequently, dimen- bi sional arguments were applied. In a turbulent fluid the mean variation in velocity, AV, over a distance d (greater than the microscale) is (dimensionally) given by
I
A V (?713 t . where e is the power dissipated per unit volume. Dimensionally, the period T for such velocity variations is given by
T - ( 3 I 3 .
Therefore it is postulated that the acceleration a undergone by a fluid element of size d is
A fluid element with this acceleration experiences a "mean" force given by L
. 8
Fig. 9.8. Sample o€ .Photographic Technique for ,Bubbles , ,, 0
Using Polaroid Camera, Strobdume Flash, and Special Photo- Port Around a l-in.-diam Glass conduit. Bubble velocity is about 10 fps. The largest bubbles are about 0.035 in. in diameter and most of the very small bubbles about 0.005 in. in diameter. U

127
W
.L
0
. c
It is postulated that a bubble in the turbulent fluid will experience the same mean forces as those exerted on a fluid element of the same size. Therefore the ratio of inertial to gravity forces after dividing Eq. (2) by Eq. (1) and reducing is
(3)
It is next assumed that the power dissipation per unit volume is uniform and related to the pressure drop by
-AP e = v r ,
where v i s the mean flow velocity and AP/L is the fric- tion pressure drop per unit length. Using the Blasius equation,
where f = 0.3 16/Nky, E becomes
(4)
where
D = conduit diameter, p = fluid viscosity,
N R e = flow Reynolds modulus, f = Blasius friction coefficient,
gc = proportionality constant relating force to the product of mass and acceleration (universal gravitational constant).
Substitution of Eq. (4) into Eq. (3) gives
Since Eq. (5 ) was established on dimensional argu- e ments, there will exist a proportionality constant of
unknown magnitude (thought to be of order of unity).
the data of Lamont and Scott," who measured mass
To establish the value that this ratio should have to serve as a bubble dispersion criterion, use was made of
transfer coefficients from individual bubbles flowing along with a turbulent liquid both horizontally and
. a
LiJ
vertically and in two conduits of different diameters. The "critical dispersion point" is here taken to occur at conditions for which the mass transfer coefficients for the vertical and horizontal orientations become equal, as given in Table 9.2, based on measurements by Lamont and Scott.
Substitution of the data of case I into Eq. (5) using consistent units gives - - Fi/Fg 15 ,
a reasonable value intuitively.
those of case I: As a check, the data of case I1 are compared with
which is very good agreement.
should remain dispersed if Therefore the final criterion suggested is that bubbles
in any consistent system of units making the ratio dimensionless. Comparison of this criterion with other dispersion data has also shown good agreement.
By applying the dispersion criterion, Eq. (6), to the He-02 -glycerol mass transfer experiment, the dashed curve shown in Fig. 9.9 was obtained. Since the pump to be used in the experiment has a maximum capacity
12J. C. Lamont and D. S. Scott, "An EddyCell Model of Mass Transfer into the Surface of a Turbulent Liquid," presented at the Second Joint Meeting of AJ.Ch.E. and Instituto de Ingenieros Quimicos de Puerto Rim, Tampa, Florida, May 19-22,1968.
Table 9.2. Conditions at Which Horizontal and Vertical Orientation Mass Transfer Coefficients
Become Equal
Case I Case I1 _ _ _ _ ~
Conduit diameter, D (in.) % 6 % Reynolds modulus, N R ~ 1.0 x io4 3.0 x io4
Density, P (dcm3) 1 .o 1 .o Bubble diameter, d (in.) 9 3 2 3 5 2
Viscosity, p (centipoises) 0.89 0.89

128
of 150 gpm (solid line in Fig. 9.9), it is seen that the Reynolds modulus range for fully dispersed operation is somewhat limited. Therefore the facility has been designed so that experiments can be conducted with the test section either vertical or horizontal. This will allow an investigation of bubble dispersion and extend the range over which useful data can be obtained to lower Reynolds moduli.
Fig. 9.9. Envelope of Experimental Ranges for the He-02- Glycerol Mass Transfer Experiment. Shows the range. for which He bubbles should be completely dispersed.
0 *
S .
t

Part 3. Chemistry W. R. Grimes
The chemical research and development efforts described below provide extensive support to the MoltenSalt Reactor Experiment (MSRE) and to the development of advanced molten-salt reactor systems.
A substantial fraction of these efforts is devoted to the chemistry of the MSRE fuel salt and off-gas streams and to the transport, distribution, and chemistry of fission products in these streams. Operations of the reactor with ” 3U fuel, as it was reconstituted using the original carrier salt, were initiated in September 1968. Several physicochemical phenomena which had not been noted previously began to appear and have since attracted attention. Principally, these concerned the relation of the redox potential, density, and surface tension of the fuel salt to gas bubble entrainment and distribution of fission products.
Studies of fission product behavior have been con- tinued with specimens removed from the MSRE fuel circuit, with the MSRE off-gas sampler-analyzer, with “synthetic” fuel mixtures, and by investigation of the chemistry of molybdenum, niobium, and ruthenium in molten fluoride mixtures.
The effort to develop chemical separations processes for application to single-fluid molten-salt breeder reac- tors continues to emphasize methods which employ selective reduction and extraction into molten bismuth containing either lithium or thorium as the reducing agent. The chemical feasibility of 233Pa isolation has
been demonstrated by a process which also requires the prior reduction of uranium from the salt mixture and its subsequent oxidation into the salt effluent of a ’ 3Pa column. An alternative process based on selective precipitation of protactinium and uranium oxides con- tinues to show promise and to yield useful information concerning pertinent oxide-fluoride equilibria. Reduc- tive extraction of the lanthanide fission products continues to prove more difficult than the protac- tinium-uranium extraction but may well lead to useful separations.
A broad program of solution thermodynamics, elec- trochemistry, spectroscopy, and study of transport processes in molten fluorides continues to supply the basic data for reactor and chemical process design. Investigations of phase equilibria in fluoroborate mix- tures continue to yield useful data for evaluation of these materials as secondary coolants.
Advances were made in the development of several analytical chemical methods which suggest their poten- tial application in semiautomated controls for molten- salt reactors. These include electrochemical and spectrophotometric means for determination of the concentration of U* in fuels and improved methods for the identification of hydrolysis products in molten fluoroborates and for the determination of traces of bismuth in molten-salt breeder reactor fuels.
10. Chemistry of the MSRE
10.1 A MATERIAL BALANCE FOR THE MSRE coulometric methods and from on-site computations of the reactivity balance.’ It was therefore desirable to continue the application of coulometric methods for
FUEL SALT
R. E. Thoma An important feature of MSRE operations with 3 5 U
fuel Was the excellent agreement between the Values of the uranium concentration as determined by standard
~ M S R f i w m Semiann. hg. Rept. Feb. 29, 1968, ORNL-4254, pp. 89-90.
129

assay of fuels with low uranium concentration, as in MSBR fuels, because of their simplicity and reproduc- ibility. Operation of the MSRE with ' U fuel afforded the first major test of t h i s application. The conditions for the test were less favorable than with the z 3 U fuel, because, in addition to the fact that the ' U concen- tration was much lower than with 3 5 U-' 38 U fuel salt, the amounts of carrier salt residues distributed between the chemical reprocessing plant and the fuel system and the amounts of uranium residues which remained in the system after chemical reprocessing were not well known. In an effort to unify the large amount of information concerning the composition, uranium con- centration in the fuel, and distribution of fuel salt in the MSRE, a comprehensive material balance was established. The results are summarized in Table 10.1.
The material balance data shown in Table 10.1 comprise the first comprehensive evidence of the fact that the quantities of fuel salt and the concentrations of its constituents are consistent with on-site estimates and with the best estimates of the densities of the salt throughout all MSRE operations. Many of the values contained in Table 10.1 have been cited previously, some in preliminary reports. The origin or significance of other items merits the following explanation or comment.
1. The amounts of fuel transferred to the flush salt were estimated from the results of chemical analyses (fluorometric and delayed neutron activation). From these, results of uranium concentration in the flush salt and weights of salt residues were computed. The masses of flush residues were estimated to be less in proportion to the relative densities of the two salts.
2. The weights of the salt given in items 2 to 5 were measured accurately when the MSRE was initially charged with salt. Items 8 and 10 were also measured accurately.
3. The bumup rate is computed on the basis that the MSRE operates at a full power rating of 8.0 Mw (thermal) and that the total burnup rate of uranium is 1.24 @wd.
4. Items 18 and 19 indicate that the total amount of 235U-238U which is not assignable to operations identified in Table 10.1 is 1.45 kg (0.063%). It is anticipated that this figure will be validated later this year, when uranium is recovered from the NaF ab- sorbers at the Portsmouth Gaseous Diffusion plant. The current values indicate a low probability that significant amounts of uranium were either transferred to the off-gas system or into the MSRE graphite moderator.
5. The mass of the 23sU-z38U heel, which was not subjected to chemical reprocessing (item 13), was inferred from isotopic dilution techniques and was
130
estimated from the best fit of analytical values for the isotopic composition of the fuel salt at various stages of preliminary operations of the reactor with 'j3U fuel with compositions which would result from inclusion of
U2 ' U residues (Table 10.2). The isotopic compo- sition of the uranium in the heel was assumed to be identical with the composition of the uranium speci- mens which were removed from the NaF absorber beds and analyzed.
6. When the MSRE fuel salt was initially constituted from 7LiF-233UF4 and 7LiF-BeF2-ZrF4, its nominal concentration was 'LiF-BeFZ-ZrF4-' 33UF4 (64.50-30.17-5.19-0.138 mole %) as compared with an average value of its composition during run 14 of 7LiF-BeF2 ZrF4 -2 ' 38UF4 (64.07-29.95-5.1 5-0.8 19 mole %). If it is assumed that the quantity of carrier salt to which the ' U concentrate was added was 4724 kg, that the uranium charge was 38.3 kg (including extra
* U added) (item 22), and that the density of the fuel at 65OoC is 134 lb/ft3, the nominal concentration of uranium in the salt is 0.807 wt %. The results of chemical analysis of the fuel salt show that the average concentration has been approximately 1% higher, that is, 0.815 wt $6. The weight of the carrier salt reserved for a forthcoming distillation experiment is known only approximately . Plans are under way to use isotopic dilution methods
to determine the quantity of carrier salt left in the fuel processing tank for use in the distillation experiment. The value of 113 kg given in Table 10.1, which is quite uncertain, could be the cause of the difference between the analytical and book concentration of uranium presently in the fuel. If 175 kg were actually in the drain tank, the total fuel charge in the reactor would be nearly 4700 kg, which would make the book value nearly identical with the analytical value. In addition, the density of the fuel salt computed from the volumes measured during drain-fill operations would be 132.3 lb/ft3, which is the same as that measured in the laboratory and reported in Sect. 12.9 of this report.
U
. f
. t
L
10.2 MSRE FUEL CIRCUIT CORROSION CHEMISTRY
R. E. Thoma
Corrosion is minimized in the MSRE fuel circuit by maintaining the fuel salt as slightly reduced with respect to the Cr&aste,loy N) -* Crw oxidation potential. This has been accomplished in the past by reduction of -1% of the uranium inventory to the trivalent state with
salt showed that the rate of generalized corrosion in the
.
s
beryllium metal. Initial experience with the 233U fuel L b

Table 10.1. Material Balance for MSRE Fuel Salt
Uranium Concentration
Carrier Total LiF-UF4 Total Total Uranium (73-27 Mole %) Uranium Fuel Salt Carrier
(kg) (ka ora ore) ora ora Nominal Analytical Addeda Salt! Added Addeda in Systema in Systema (wt %I Item
1. 2. 3. 4. 5. 6.
7.
8.
9. 10. 11.
12. 13. 14. 15.
16. 17.
18. 19. 20. 21.
Initial flush salt residue Camer salt charged to drain tank LiF-UF4 (depleted) charged to drain tank LiF-UF4 (enriched) charged to drain tank LiF-UF4 (enriched) charged to pump bowl Uranium transferred to flush salt prior
Flush salt transferred to fuel prior to
Su lementary LiF-UF4 added during
" 'U burned during power operation Loss by sampling Net balance at termination of run 14
(including flush-fd transfer effects) Net transfer in final flush Uranium not subject to chemical reprocessing Uranium subject to recovery from fuel Uranium recovered in chemical processing
Uranium subject to recovery from flush salt Uranium recovered from flush salt assuming
Total uranium recoverable Total uranium recovered
to power operation
power operation
2% power operation
99.36% efficiency
16.0 4558.1. 4574.1
4664.1 4699.6 4715.7
-17.4 4698.3
16.0 4714.4
1.5 4715.9
4715.8
4678.1 -5.4 4710.4
146.21 56.98 25.79 -0.74
2.46
-3.73 -0.256 -4.48
-0.897 -1.935 f0.035
236.2 146.21 92.5 203.19 41.9 228.98
228.24
228.24
4.0 230.70
226.97 226.71 222.23b
221.33 219.40 219.40 217.99 f 0.5 (99.36%)
6.12 6.08
4810.3 3.04 3.04 4902.8 4.14 4944.7 4.63 4.61 4926.6
4942.6 4.618 4.611
4946.6
4942.8 4937.2 4900.3 4.535 4.532
4888.2
225.5 2 224.07
Carrier reserved for distillation experiment -113.4 4553.5 Su plementary charge for 'j3U experiment 129.9 4683.5
22. z3BU fuel charge 38.298 62.30 4745.8 0.807 0.815
'The number of significant figures used here varies from two to four, depending on their origin; they are used in combination for comparison of nominal and experimental
bComputed from on-site reactivity balances (4.535% of 4900.3 kg). values.

132
fuel circuit was rapid, even though zirconium metal was used previously in chemical reprocessing operations in sufficient amount to allow a small excess of unreacted metal to remain with the reprocessed carrier salt. This treatment was effective in reducing the chromium concentration of the carrier salt from 420 to 34 ppm? Evidently, little or no excess reductant remained in the salt, for during the zero-power experiments in October and November 1968, the concentration of Cr2+ in the fuel salt increased continuously until some 28 g (6.2
'R. B. Lindauer and C. K. McGlothlan,D&gn, Construction, and Testing of a Large Molten Salt Filter, ORNL-TM-2478, p. 26.
LJ eqdvalents) of beryllium metal had been added to the salt.
Generalized corrosion of the MSRE fuel circuitry, as indicated by changes in the Cr" concentration of the fuel salt, has occurred somewhat more rapidly since the beginning of run 15 than during previous runs. Since salt was first circulated on September 14, 1968, its chromium concentration has risen approximately 36 ppm, that is, from 34 to 70 ppm (Fig. 10.1). The corrosion represented by this increase corresponds to generalized removal of chromium from the walls of the fuel loop to a depth of 0.23 mil.
Beryllium metal rods have been exposed to MSRE fuel salt on four occasions during run 15 in anticipation that a U3+/ZU concentration ratio of 1 to 1.5% would
I . P
e
Table 10.2. Isotopic CompositiOn of Uranium in the MSRE Fuel salt, Run 15
Sample m Estimated Analytical
No. 0 233 234 235 236 238 233 234 235 236 238
FPl4residue FP15-6 FP15-9 FPlS-10 Fp15-12 FP15-18 FP15-26 FP15-38 FP15-55 Fp15-65 FP15-68
1.935 23.790 30.840 35.720 35.810 36.288 36.867 37.438 38.298 38.298 38.298
80.404 82.912 84.082 84.099 84.204 84.328 84.449 84.604 84.604 84.604
0.351 32.979 0.438 66.232 6595 3.451 0.210 9.340 6.793 2.863 0.178 7.254 6.884 2.584 0.162 6.291 6.886 2.580 0.162 6.275 6.895 2.555 0.158 6.188 6.904 2526 0.156 6.085 6.914 2.496 0.153 5.988 6.927 2.443 0.152 5.874 6.927 2.443 0.152 5.874 6.927 2.443 0.152 5.874
0.006 80.833 83.182 84.214 84.162 84.285 84.569 84.680 84.610 84.641 84.687
0.358 32.983 0.412 66.236 6.692 3.348 0.094 9.116 6.849 2.850 0.087 7.089 6.881 2.459 0.081 6.346 6.906 2587 0.084 6.260 6.929 2557 0.083 6.148 6.917 2.512 0.083 5.919 6.920 2.482 0.083 5.480 6.957 2.482 0.082 5.868 6.963 2.482 0.082 5.843 6.948 2.477 0.081 5.808
ORNL-DWG 69-5503
(968
9
.
.
s
Fig. 10.1. C o d o n of the MSRE Fuel Circuit, Runs 15-17. c,

133
W c .
*
*
.
I -
be established (see Sect. 10.3). Surprisingly, the residue which was found on and within the first capsule which contained a beryllium rod was preponderantly iron, with lesser amounts of nickel and chromium. The high ratio of iron to chromium in the first residue is regarded as a surprising development, for in reprocessing oper- ations with the fuel carrier salt, concentrations of chromium, iron, and nickel were reduced, respectively, from 460 to 34,380 to 110, and 180 to <10 ppm.
If chromium was reduced as effectively as is indicated by these analyses, we would have expected no iron to be present, since most of the Fe2+ produced by fluorination should have been reduced to the metallic state by the zirconium metal and hydrogen treatments before ionic chromium was reduced. Such a conclusion appears not to be well founded, for not only was the iron-chromium ratio initially high, but corrosion of the fuel circuit continued even after four reduction equiva- lents (18 g of Beo) were introduced into the fuel salt. We infer from the high fraction of chromium in the second and third beryllium residues that the concen- tration of Fe2+ in the salt has become negligible and that beryllium has acted to reduce U4+ and Cr2+ concurrently.
The MSRE fuel circuit was not subjected to coqpa- rable corrosion during the zero-power experiments which preceded full-power operations with 3s U fuel. We must conclude therefore that the current corrosion behavior is attributable to the current salt charge and to the presence in it initially of some 3 g-atoms of iron as Fe2+.
During the initial itages of operations of the MSRE with 33U fuel, niobium behaved in an unprecedented manner. Previously, little niobium was found in salt samples, but in the early stages of run 15, essentially all of the niobium which was formed remained in the fuel salt. The subsequent changes in niobium concentration clearly reflect variations in the oxidation-reduction potential of the fuel salt; these are described in Sect. 1 1.1.3 of this report.
I t now becomes evident that because the relative free energies of formation of the niobium and chromium fluorides are close (-72.4 kcal per mole of F at IOOO’K vs -75.2 kcal for NbFS and CrF2 respectively), the presence of niobium in the fuel signals the possibility that chromium is being oxidized. The presence or absence of niobium in the fuel salt is clearly related to the U3+/ZU concentration ratio. An experimental basis exists therefore for establishing the relationship more exactly, perhaps with sufficient precision that in-line determination of the niobium concentration in such fuels can ultimately be integrated into reactor controls technology.
10.3 ADJUSTMENT OF THE U3+/CU CONCENTRATION OF THE MSRE FUEL SALT
R. E. Thoma J. M. Dale
On the basis that the oxidation potentials of chro- mium and niobium differ only slightly in the MSRE fuel salt, we have inferred that the U3+/ZU concen- tration of the ’ U fuel remained essentially nil until after -6.4 equivalents of Beo had been added to the salt and that until then the fuel salt was slightly oxidizing (see Sect. 11.1.3). Since that time an addi- tional 8.57 g (1.W equivalents) of beryllium has been added to the fuel circuit salt, which contains 35.2 kg of uranium. The U3+/ZU concentration of the fuel salt was thereafter Q1.26% as power operations began with 233U fuel. Current results of chemical analysis of salt specimens show that the concentration of Cr2+ in the fuel salt is now 70 ppm and that corrosion of the fuel circuit has not increased detectably since power oper- ations were initiated. By mid-February 1969, the MSRE had generated -4000 Mwhr with 233U fuel and had thereby consumed -200 g of uranium; hence, the U3+ fraction at that time was reduced to 0.8%. Adjustment of the U3+/CU balance will necessarily be more frequent with U fuel than with U fuel because of the relatively low inventory (38 kg as compared with 225 kg).
Attempts to measure the U3+/ZU concentration are under way. More precise methods than the hydrogen- HF transpiration technique, previously used, are re- quired to analyze this concentration since the overall quantity of UF3 in the sample is low. For this purpose a voltammetric method has been developed (see Sect. 14) and will be used in the very near future.
Introduction of beryllium metal into the ” ’ U fuel salt apparently caused a major perturbation of salt-gas interactions and resulted in an increase in void fraction in the fuel salt (see Sect. 1, “MSRE Operations’?. Initial considerations of this effect called for a review of the probable U3+/ZU concentration during ” U oper- ations for comparison with current behavior and pointed up the fact that previous estimates of U3+/ZU concentration8 were slightly lower than originally reported, since they were computed on the basis that the maximum power generated by the MSRE was 7.25 rather than 8.0 Mw (thermal). A revised summary of U3+/CU concentrations throughout the MSRE power history is shown in Table 10.3 and shows that at the beginning of operations with ’ U fuel the concentra-
’MSR hogram Semiann. Rogr. Rept. Aug. 31, 1967, ORNL-4191, pp. 110-14.

Table 10.3. Concentration of UF3 in the MSRE Fuel Sale
Uranium Uranium Net Equivalents Total Beo Net of Reductant Equivalents Net Equivalents u*/m (%I of Reductant Calculated Analytical Added of Oxidation Added (g)
Megawatt-Hours Consumed Consumed Sample No. Date
0 (moles)
11/14/66 1/1/67 1/3/67 1/4/67 1/13/67 1/15/67 2/6/67 2/15/67 2/22/67 3/28/67 4/10/67 6/21/67 6/.2 116 7 6/23/67 6/29/67 7/3/67 7/13/67 7/13/67 8/3/67 9/15/67 3/26/68 9/15/68 10/13/68 11/15/68 11/20/68 1/22/69
FP9-14 FP10-14 FP10-16 FP10-18 FP10-23 FP10-25 FPll-5 FP11-10 FPll-13 FP11-32 FP1140 FP12-6 FP12-8 FPl2-9 FP12-11 FPl2-13 FP12-15 FP12-21 FP12-56 FPl3-5 FP144F) FP15-7 FP15-30 FP15-62 FP15-66 FP17-8
0 . 12,345 14,950 15,050 17,100 17,852 18,050 19,712 21,272 22,649 28,342 30,900 36,055 36,055 36,416 37,400 37,856 38,345 39,500 43,872 44,781 72,454
0 0 0 0
850
0 0.632 0.766 0.771 0.877 0.915 0.924 1.010 1.090 1.161 1.45 3 1.584 1.663 1.663 1.866 1.932 1.940 1.966 2.023 2.248 2.314 3.743
0 0 0 0
0.044
2.67 3.23 3.25 3.70 3.86 3.90 4.26 4.60 4.90 6.13 6.68 7.01 7.01 7.87 8.15 8.19 8.30 8.54 9.49 9.76
15.79
0.19
2.14 2.58 2.60 2.96 3.08 3.10 3.40 3.68 3.90 4.90 5.34 5.61 5.61 6.30 6.52 6.55 6.64 6.83 7.59 7.81
12.63
0.15
0 3 6
7.63 18.28 18.28 18.28 29.94 29.94 29.94 38.34 38.34 46.27 56.11 56.1 1 64.24 76.12 76.12 85.83 85.83 85.83 10.08 18.42 27.80 28.80 37.37
3.13 3.80 4.46 4.82 7.19 7.19 7.19 9.77 9.77 9.77
11.64 11.64 13.40 15.58 15.58 17.38 20.02 20.02 22.18 22.18 22.18
2.23 4.09 6.17 6.39
. 8.29
3.13 0.99 1.22 1.80 1.86 4.1 1 4.09 3.79 6.09 5.87 4.81 6.30 6.03 7.79 9.28 9.06
10.83 13.38 13.19 14.59 12.42 9.55
0 0 0
0.22 1.97
I
0.33 0.10 0.13 0.19 0.20 0.43 0.43 0.39 0.64 0.62 0.5 1 0.66 0.64 0.82 0.98 0.95 1.14 1.40 1.39 1.54 1.31 1.01
0 0 0
0.15 1.31
0.10
0.66 0.60
0.69 0.45
c1 w 0.71 A
1.30
1 .o
1.60
"These numbers assume that the 23sU salt originally was 0.16% reduced; that the increase in Cr before initial 235U power operations was real, occurred before 11/14/66, and resulted in reduction of U4+ to U3+; that each fission results in oxidation of 0.8 atom of U3+; and that there have been no other losses of U3+.
e a (11 c

135
c
a .
F
8
t
.
s
.
. P
W
tions of trivalent uranium were lower than at any time during ’ U operations but have been adjusted recently to values wwch are typical of those present during run 14. Adjustment of the U3+/CU ratio to its current value of -1% did not reduce the void fraction of the fuel salt perceptibly. That the concentration of trivalent uranium is intrinsically related to the generation of voids in the salt does not therefore appear to be warranted. The contrast in the appearance of the nickel-beryllium rod assemblies seems to provide a more useful clue to the cause of bubble generation. While none of these cages appeared to be wetted by the salt during ’ U operations, each of those removed after treatment of the 233U salt showed evidence that salt had wetted the nickel cage and had adhered to it. A typical example is shown in Fig. 10.2. The presence of bubbles is suggested by the appearance of the upper part of capsule Fp17-8 (Fig. 10.3), on which the relic structures of collapsed bubbles seem to be visible. We must conclude that major changes in the salt-metal interfacial tensions were induced as transient behavior and were highly localized. Such behavior apparently had no counterpart in
Numerous causes may be cited in speculation as to the cause of the increased void fraction. For example, the 233U fuel salt density is some 5% less than the 23sU salt; the lower density, coupled with a slight reduction in the interfacial tension of this salt, might allow the spray ring jets to generate smaller bubbles which conceivably could be driven sufficiently deep into the pump bowl salt to be entrained in the pump discharge. While the reason for the changes in salt-gas behavior are not known, a variety of plausible models are thus plentiful and are amenable to future tests.
’ U operations.
10.4 EXAMINATION OF SIMULATED MSRE
PROPERTIES FUEL MIXTURE FOR FOAM-PRODUCING
J. H. Shaffer W. R. Grimes
Following the refueling operations of the MSRE to replace 235U with 233U, the reactor system has experienced some irregularities in its performance? Although the cause of these irregularities has not been identified, the results can be explained by increased foam production at the fuel-gas interface in the pump bowl. The purpose of an experiment now in progress is to examine specific chemical operations performed on the MSRE fuel mixture and their possible contribution to foam production.
,
’
4A. Houtzeel and J. R. Engel, sect. 1.3.2, this report. Fig. 10.2. Nickel Cage-Beryllium Rod Assembly No.
30 After Exposure to MSRE Fuel Salt for 10.5 lu.

136
This experiment is being conducted with approxi- m a t e l y 1 2 . 5 kg o f LiF-BeF2-ZrF4-UF4 (64.8-30.0-5.0-0.25 mole %) contained in a nickel vessel (10 in. diameter by 8 in.) to a depth of about 5 in. Penetrations in the top plate provide for the insertion of a sparge &as tube, two salt level sensing probes, a reference electrode assembly, and a salt sampling port.
The experimental objective has focused on the partial reduction of tetravalent uranium to its trivalent state by reaction with beryllium metal inserted into the pump bowl.
Since this is the principal chemical operation per- formed in the MSRE pump bowl, its possible contri-
.
I
Fig. 10.3. Top of Nickel Cage-Beryllium Rod Assembly No. FP17-8 After Expormre to MSRE Fuel Salt far 12 hr.
bution to foam production is suspected. The experi- mental procedure has examined the fluoride mixture at 600°C in the as-prepared condition, at intervals during the reduction of essentially all the uranium to its trivalent state, and after subsequent stepwise oxidation of the mixture with nickel fluoride. Tests for foam production consisted in measurements of the salt level while sparging with argon at flow rates of up to 2 liters/min. Argon was admitted through a Y4-in.diam sintered-nickel disk that closed the end of a nickel tube inserted to within '4 in. of the bottom of the vessel. Melt levels were determined by the abrupt change in electrical resistance noted as the insulated nickel rods
. s
. w
bj

made contact with the salt mixture. Without exception, these tests showed no immediate increase in the salt level in.) that would be attributed to the gas sparge operations. Only discontinuqs aorting of the probes (at ‘I1 6 in. above the salt level) by salt splashipg was noted.
The insertion of beryllium rods into the salt mixture did result in the reduction of zirconium metal. In earlier development tests, when the reactor fuel mixture contained approximately 0.8 mole % uranium, the rapid reduction of uranium precluded observations of zirco- nium reduction. While this phenomenon may not exist in the turbulent, high-flow conditions of the reactor pump bowl, the lower uranium concentration of the present fuel mixture appears to have a pronounced effect on its rate of reduction. Subsequent reductions of uranium during this test were achieved by reaction with zirconium metal rods in place of beryllium.
This experiment also provided an opportunity for evaluation of a reference electrode assembly currently being developed for rapid analysis of fluoride melts for trivalent uranium. A nickel-nickel oxide-beryllium oxide reference electrode, currently under development by Hitch and Baes: was inserted into the melt to follow the reduction process. Stable voltages were read at the various reduction intervals. However, their relation to trivalent uranium concentrations could not be accurately established.
Although no confirmation of foam production has been realized to date, the experimental program will examine other techniques for forming salt-gas emulsions and other possible chemical phenomena which may be responsible for the observed behavior of the reactor.
10.5 FOAMING BEHAVIOR IN MOLTEN SALTS
H. W. Kohn F. F. Blankenship
Molten-salt foams were studied in a glass apparatus contained in a special furnace. Purified argon was
137
introduced through a coarse glass frit at the bottom, and visual observations were supplemented, when de- sirable, with high-speed photography. Our most signifi- cant obseryation throughout these experiments is that we were unable to promote the development of stable foams in clean melts. All of the additives which we might reasonably suspect to be in the pump bowl, that is, carbon dust, graphite powder, beryllium metal, finely divided metallic nickel, and pump oil vapor, were found to be incapable of promoting foams in a vigorously bubbling melt. Melts of lithium fluoro- beryllate and of MSRE fuel salt were studied, and their behavior was found to be essentially the same. Foams were formed only by introducing enough
water into the melt, either in the sweep gas or by adding solid hydrates, to give a definite cloudiness. Even so the foam would collapse in less than a minute when the sweep gas was cut off. Simply adding solid oxide as Be0 or as Li2C03 (+ Li20 + C02, probably followed by Li20 + BeF2 + 2LiF + BeO) failed to produce foams. This mode of addition fails to produce either the proper state of subdivision or wetting since the particles appear “clumpy” rather than evenly distributed in the melt.
Conditions which cause wetting of the glass container also cause a marked change in the appearance and behavior of the bubbles. An originally wetting melt will produce small, slightly flattened bubbles 2 to 3 mm in diameter. A short treatment with SiF4 converts this to a nonwetting melt, and the bubbles rapidly change to large disk-shaped objects greater than a centimeter in diameter but less than 2 or 3 mm thick. Adding beryllium metal to such a melt makes it wetting again toward the glass and gives more nearly spherical (but still rather large) bubbles. None of these melts will form a foam.
’B. F. Hitch andC. F. Baes, Jr., sect. 12.13, thisreport.

1 1. Fission Product Behavior
e . * .
11.1 FISSION PRODUCT BEHAVIOR IN THE MSRE
11.1.1 Examination of Graphite Surveillance Specimens
F. F. Blankenship S. S. Kirslis
Most of the results of the postirradiation examination of the third long-term surveillance assembly, removed from the MSRE on March 25,1968, have been reported previously.' A few additional examinations of the graphite specimens are described below.
Saltexposed surfaces of five graphite specimens (pyrolytic, Poco, CGB, doubly exposed CGB, and impregnated CGB graphite) were examined by x-ray diffraction. Only graphite lines were observed in the pattern, as was previously observed for electron diffrac- tion, although appreciable quantities of molybdenum were found on the graphite surfaces by spectrographic analysis.
Samples of the same five graphite specimens were mounted and polished for autoradiographic and metal- lographic examination. The autoradiographs were very similar to those from previously exposed graphite specimens, showing a thin surface region of intense radioactivity with irregular penetrations toward the interior. In the deep interior there was much less activity, with sizable concentration differences between adjacent regions. The pyrolytic graphite specimen showed penetrations of high activity along straight cracks parallel to the graphite planes. These observa- tions are consistent with the previously reported radio- chemical results, which indicated considerable varia- tions in concentration profiles between different faces of the same specimens of graphite. These profile variations were. confirmed by D. R. Cuneo's results on smaller samples. The previous conclusion is thus con- f m e d that there are sizable local variations in graphite
'MSR Program Semiunn. Rogr. Rept. Aug. 31. 1968. ORNL-4344.
porosity in all the types of graphite listed except pyrolytic graphite, and that these porosity variations affect significantly the diffusion of activities from the salt interface into the graphite interior.
After rough polishing, metallographic examination of the five graphite specimens yielded results like those on previous surveillance specimens: there was no indication of chemical damage nor of surface films, and the graphite structures showed no changes. Difficulties were experienced in polishing the Specimens to the degree required for highquality metallographs.
1 1.1.2 Distribution of Fission Products in the MSRE
F. F. Blankenship S. S. Kirslis In the previously reported material balance' for
fission products in the MSRE, the values for the percentages of inventory deposited on Hastelloy N surfaces were based on an estimate' of 1.2 X IO6 cm' for the area of metal wetted by the fuel salt. A recent more detailed calculation4 indicates that the wetted metal area is actually 0.79 X lo6 cm'. Thus the previously reported values for percent deposition on metal should be corrected by the factor 0.7911.2, or 0.66. It should also be mentioned that no correction was made for the probably sizable effect of fuel turbulence' in different regions of the fuel circuit. The measured values of disintegrations per minute per square centimeter of metal remain unchanged.
11.1.3 Fission Product Inventory During ' ' ' U Operation
E. L. Compere E. G. Bohlmann
Fission product behavior of many isotopes will be interpreted with reference to the number (or activity)
'MSR hogram Semiann Rogr. Rept. Aug. 31, 1968,
'W. H. Cook and A. Taboada, personal communication. 4J. A. Watts and J. R. Engel, personal communication. 'R. B. Briggs, personal communication.
ORNL-4344, p. 136.
.
e
LJ
138

. .
of atoms existing at the time in question which have resulted from the fission history of the reactor. It is convenient to divide the total activity by the mass of salt containing the fission fuel, yielding a nominal activity at the time in question per gram of circulating salt. Mixing with residual salt by transfer to the drain tank is taken into account. Calculations are updated to appropriate reference times, frequently sample time or shutdown time. In general such calculations do not imply any particular fate for given isotopes.
Power operation of MSRE on '"U extended from January 23, 1966, to March 25, 1968. The fuel was subsequently transferred to the drain tanks and there subjected to chemical processing,6 including fluorine treatment, hydrogen-hydrogen fluoride sparging, and reduction with zirconium metal.
We computed7 fission product inventories from the power history up to the end o f2 U operation in such a way, using one- or twoelement decay *chains,8 assuming that it was not necessary to take into consideration the interaction of fission products with neutrons, and that removal of fuel from the system by sampling, etc., was negligible.
Examination of data from salt samples taken after processing, August to September 1968, confirmed that the final zirconium metal reduction treatment had removed all the Nb activity, and the activity of Nb in the salt was consistent with the ingrowth from ' Zr after this time (see Sect. 11.1.4). Consequently, the inventory of 95Nb was calculated based on this assumption. The inventory of a number of fission product isotopes at the end of runs 14, 15, and 16 and at the beginning of run 15 are shown in Table 11.1. Fission yields were taken from the data assembled by Bell: and half-lives were taken from the current Table of Isotopes. ' Power history, not directly obtainable from the MSRE computer at this time, was read from the nuclear power chart.
Computer programs were developed for the appropri- ate compression of such data and for the calculation of fission product inventories and decay rates. These were written in Basic-I1 and were run on the locally available C-AC time-sharing computer.
Inventory disintegration rates for each isotope as of the time each sample was taken have been computed
6R., B. Lmdauer, MSR Progium Semhnn. hg?. Rept. Aug.
7E. L. Compere, MSR Program Semiann. h g r . Rept. Aug.
'J. M. West, pp. 7-15 in Nuclear EngineeringHandbook, ed.
31.1968,0RNL-4344, pp. 5-11.
31,1968,0RNL4344, pp. 208-10.
by H. Etherington, McGraw-Hill, New York, 1958.
139
currently so that data~from samples can be promptly compared with inventory values.
11.1.4 Responseof 95NbActMty to Fuel Redox Chemistry
E. L. Compere E. G. Bohlmann
U operation of the MSRE (through run 14) freeze-valve samples of the fuel salt consistently showed that the 95Nb daughter of 95Zr was not appreciably present in the salt. Data from samples taken during the processing of the carrier salt prior to operation with ' U showed appreciable 9 5 Nb was present after fluorination, but this was removed by the reducing treatment with zirconium metal early in September 1968. During the preparatory and critical operations in run 15, however, the 95Nb formed from
Zr decay remained dissolved in the salt. That this was due to the salt being in an unexpectedly oxidizing condition was shown by an unusually high corrosion rate, evidenced by increasing Cr2+ concentration in the early part of run 15. Additions of Beo (6.2 equivalents) designed to inhibit this corrosion accomplished that objective and also resulted in the disappearance of the 95Nb from the salt, as shown in Fig. 11.1.
At this time, other considerations necessitated ho- mogenization of the salt in the circulating loop with an -8% heel in the drain tank. As shown in the figure, subsequent freeze-valve samples again show that sub- stantial percentages of the niobium inventory (based on power history) are again dissolved in the salt, although the Cr2+ concentration appears stabilized. Apparently the oxidant in the heel was just sufficient to reoxidize the Nb (NbF3), but not to make the melt corrosive. Addition of two more equivalents of Beo on January 24, 1969, again caused the niobium to leave the melt.
The niobium percentages were generally lower in runs 16 and 17, compared with run 15. However, the scatter of the data - including that of salt-stable Zr - makes the significance of this questionable. Such behavior could be caused by partially irreversible interaction with surfaces - metal, graphite, or gas. The response of the niobium chemistry to the oxidizing state of the melt will be followed carefully in continued MSRE operations in view of possible uses as a redox indicator. After several thousand megawatt-hours of operation sufficient niobium is present (-0.03 mole) to offer a
During the
'M. J. Bell, sect. 21.4, this report. loC. M. Lederer, J. M. Hollander, and I. Perlman, Table of
Isotopes, 6th ed., Wiley, New York, 1967.

140
Table 11.1. Inventory of MSRE Fission Products
(Total atoms existing at given time)/(grams of fuel in circulating system) ~ ~~~
Amount of Fission Product (atoms per gram of circulating salt at time shown) Half-Lifeb Run 15, Critical Run 15, Down Run 16, Down
Yield,
11/28/68,0804 12/16/68,1508' Isotope z33U Fission' (days) Run 14, Down 3/25/68,0100 10/2/68y l4Oo ro M W ~ ( 2 3 3 ~ ~ ti2.38 MWW (12.47 MMWW (%I
8 9 ~ r - 8 9 0 ~ r 9'Sr 91Y
95zr
9 7 ~ o 9 9 ~ 0
95Nb
Io3Ru loSRu '06Ru
Ag 111
"'Sb Iz9mTe I3'Te
I4'Ba I4'ce 1 4 3 ~ e 1 4 4 ~ e
137cs '47Nd
lSsEu
13II
147pm
5.86 5.86 5.57 5.57
6.05 6.05 5.23 4.80
1.80 0.48 0.24 0.024
0.086 0.72 4.40 2.90
5.40 7.09 5.99 4.61
6.58 1.98 1.98 0.023
52 10264
0.403 58.8
65 35 0.708 2.79
39.6 0.185
7.5 367
986 34 3.25 8.05
12.8 33
284
10958
957 661
0.138
11.1
1.16E16 9.68E16 1.71E14 1.56E16
1.85E16 9.33E15 2.37E14 1.07E15
5.66E15 1.21E14 3.93E15 8.20E12
2.94E14 ,
5.59E14 8.81E14 1.33E15
4.33E15 1.00E16 6.07E13 5.14E16
1.03E17 1.42E15 3.18E16 4.21E15
8.23E14 8.69E16
1.50E15
2.18E15 5.20E14d
1.80E14
2.45E15 7.3E5
2.34E14 1.02E13
1.6E8
1.23Ell 4.64E14
2.93E16
9.29E16 9.1E9 2.63E16 3.13E15
4.05E14 8.66E16 3.23E12 7.85E14
1.21E15 7.31E14d 6.22E12 1.19E13
7.23E13 4.2E10 2.24E15 7.OE10
2.25E14 5.48E12 1.13E13 8.46E12
1.63E13 1.63E14 1.67Ell 2.55E16
9.25E16 5.92E12 2.52E16 2.95E15
3.16E14 8.65E16 153E10 6.34E14
9.92E14 6.87E14d 2.7E10 1.80E11
5.22E13 5.3E8 2.16E15 3.2E10
2.22E14 3.64E12 2.71E11 1.64E12
5.50E12 1.04E14 4.8E9 2.44E16
9.24E16 1.75E12 2.49E16 2.90E15
a t
e 0
. 8
0
"Ref. 9. bRef. 10. 'Run 16 critical 12/12/68,0900. dAssumed removed during fuel processing 9/17/69.
possibility of doing redox titrations in the reactor. Such studies could giv? information concerning the oxidizing effect of fission, the behavior of noble metal fission products and corrosion products, and the U"'-U'" ratio.
11 .I .5 MSRE Off-Gas Analyzer-Sampler
E. L. Compere J. L. Rutherford
The MSRE off-gas sampler, which is downstream from the particle trap and -45 min flow from the pump bowl, was modified' prior to run 15. The major change involved replacement of the chemical absorbers for HzO and COz with a dry molecular sieve (Linde 13% absorber. This was done because decomposition
of the wet magnesium perchlorate absorber material, due to radiation, evolved gases which gave erroneous off-gas impurity measurements. The molecular sieve trap was installed dqwnstream from the heated CuO bed which serves to oxidize hydrocarbon constituents of the gas. The absorber, which may be heated, retains water even at temperatures of 300°C. Carbon dioxide is retained up to about 200°C. Thus hydrocarbon in the gas may be measured by the effect of absorbing its 0
oxidation products. a
Adequate reliability and sensitivity of the thermal conductivity cells were demonstrated by conducting
"R. B. ~allaher and A. I. =*oviak, MSR Program SemMtn Prop. Rept. Aug. 31.19aS.ORNL-4344, p. 30.

141
DEC
ORNL-DWG 69-5504
I I L,
JAN
0
.
+ n NL z
n a G
m
400 2
n 80
40
.
.
. 8
U
A 952,
0 OAg5Nb o ppm cr2+
RUN 45 c I n z
SEPT OCT NOV 4968
RUN 47- i-t
Fig. 11.1. Behavior of Fission Product "Nb in MSRE.
0
FEE

142
calibration tests with helium containing -6OO'pg of C4HI0 per standard liter. A second standard gas was employed containing 120 pg of methane per liter, 240 pg of isobutane per liter, 49 ppm krypton, and 48 ppm xenon; such levels (except for excess methane) are in the range of anticipated off-gas compositions. This gas was used to study the effects of variations in our operating parameters. Variations of test gas flow rates between 25 and 125 cc/min had little effect. Cupric oxide bed temperatures of 1200, 1350, 1400, and 1450'F were employed. Upper temperatures of the CuO are limited by decomposition into CuzO.and oxygen, which is noticeable at 1350°F and appreciable at 1450'F. However, only isobutane was oxidized at 1200'F, and a temperature of -1450°F, or possibly higher, is required to oxidize all methane. We chose a CuO operating temperature of 1350'F in order to oxidize all the hydrocarbons (including much of the methane) and to keep the amount of oxygen being evolved from the CuO bed at a tolerable level.
LiJ Tests of MSRE off-gas (at operation power >50 w) show hydrocarbon levels ranging between 100 and 300 pg per standard liter (-0.5 to 1.5 g/day). Substantially higher values have been noted after returning from standby to on-line operation; these values declined to the above steady-state range in several hours. Preceding each MSRE run, after transfer of salt from the drain tank to the circulating system, high and slowly de- clining levels of nonoxidizable impurity in the off-gas were noted. This impurity is believed to be argon, purging from the less accessible regions of the drain tank.
High quantities of impurities were noted in the off-gas during the drain following run 15. These were mostly oxidizable by CuO at 1350'F and were absorbable on the room-temperature molecular sieve absorber, and thereby hydrocarbon. However, about 10% of the impurity was not oxidized. Mass spectrographic analysis (Table 11.2, sample 28) indicated this material to be methane. Methane is a known product of hydrocarbon
t
8
*
Table 112. Mass Spectrographic Analysis of MSRE Off-Gas Samples
Sample number Date isolated Date analyzed MSRE power Type sample
Substance (~01%)
He N2 + CO 02 Ar HZO c02 I32 CH4 HC Kr Xe
22 2/10/68 11/6/68 5 Mw, 2 6 O h r Isolation line, sieve
95.27 2.82
' 0.12 0.13 0.08 0.51 0.87 0.04
0.03 0.1 2
23 2/16/68 11/21/68 5 Mw, 404 hr Isolation line, sieve
90.66 4.39 0.59 0.06 0.11 2.17 0.89 0.22
0.12 0.78
27 11/15/68 11/20/68 50 w Direct
99.75 0.04 0.01 0.002 0.18 0.002 0.007 0.002
<O.OOl <O.OOl
28 11/28/68 12/4/68 Drain+6hr CuO bed, sieve
92.0 2.3 0.4 0.05 0.03 0.05 0.2 4.9 0.01
<O.OOl 0.01
29 2/27/69 3/18/69 7-8 Mw, 298 hr Isolation line, sieve
87.6 9.94 0.46 0.13 0.02 1 .o 0.67 0.03
0.03 0.12
. 8
Isotope Yield (%) 235" 233"
0.544
8% 0.299 84Kr 1 .oo 86Kr 2.02
' 3 2 ~ e 4.38 '3'xe 2.93
13'xe 7.61 1 3 4 ~ e 8.06 1 3 6 ~ e 6.46
1.17 1.946 0.584 3.07 2.90 4.54 5.78 5.94 6.64
15.2 26.7
50.5 11.4 18.2
38.8 31.6
7.6, (8.00)
14.7 26.7
51.3 12.4 19.6
7.3, (7.79
37.6 30.4
~
12.3 17.3
32.1 35.8
2.5 (30.59
.
b qonected for decay; half-life, 10.76 years. bConected far decay; half-life, 5.27 days. ,

143
cracking and requires CuO temperatures appreciably above 1 350°F for complete oxidation.
Hydrocarbon levels of 4 to 10 g/day in the reactor off-gas were observed during the tests using a motor- generator set to vary pump speed. These high levels occurred shortly after the pump was restarted after being off for a short time and did not persist. A parallel increase in unabsorbable products was evident (ranging from 200 to 400 ppm).
During MSRE operations at megawatt power levels, a flow restriction of the lines leading to the off-gas sampler developed regularly, resulting in loss of flow in about a day. Prior operation at the end of run 14 gave similar behavior. During the recent period of operation of the reactor at low power with the pump off for several days (thermal convection operation), no plug- ging occurred. The restriction, which was found to occur in line 537, can be best relieved by blowing 40 psi helium back and then forward through the line.
A sample of reactor off-gas was taken directly for mass spectrographic analysis during a period of low- power (50 w) operation. This sample (Table 1 1.2, sample 27) showed 0.18% water, about 0.05% air, and -0.01% hydrocarbons, which were mostly methane. Most of these impurities, except possibly the hydrocarbons, are believed to have been acquired extraneously, though appropriate preevacuation and flushing techniques were used. A value of 0.01% methane corresponds to 70 pdliter, or about 0.4 g/day, which is of the same magnitude as values indicated by thermal conductivity analysis reported above.
As the standard gas mixture was first diverted through the absorber after passing through the heated CuO bed, krypton and xenon in the mixture broke through the absorber at different times, which produced “steps” in the thermal conductivity curves, thus offering the possibility of being able to use a frontal analysis technique to examine the reactor off-gas. In addition, krypton and xenon, if present, should appear as an impurity in the helium after passing through the absorber. A steady-state concentration of approxi- mately 75 ppm combined kryptons and xenons should be developed in the reactor off-gas at full power (8 Mw). However, except for some unabsorbable con- taminants observed for approximately three days which could have been 50 to 125 ppm krypton and xenon, we have not detected such impurities in the helium using the thermal conductivity cells, though these fission gases have been found by mass spectrographic analysis (Table 11.2, samples 22,23,29).
Mass spectrographic analysis has been obtained on several samples of off-gas taken during power operation.
Data are given in Table 11.2. Samples 22 and 23 were isolated between valves in line 518 during run 14 and nine months later, after decay of all short-lived iso- topes, were collected at liquid-nitrogen temperatures on the molecular sieve, subsequently reheated, and trans- ferred to the sample bottle. A third sample isolated during run 14 was lost due to a leaking nylon valve tip. Sample 29 was isolated between valves in line 518 in late February 1969 (run 17) during a period of full-power operation, subsequently transferred to the low-temperature molecular sieve, and thence to the sample bottle.
The procedure of collecting the sample on a low- temperature molecular sieve permits removal of much of the helium and some of the hydrogen in the sample, while reheating transfers most of the remaining material to the sample bottle. Thus an appreciable concentration effect is obtained.
The samples taken during power operation of the reactor were of interest particularly because of the ratios of isotopes of fission product krypton and xenon. Generally the ratios are consistent with relative fssion product yields for the fuel used. Values for Xe and 32 Xe, which have longer-lived precursors, are below
steady-state values indicated by 34 Xe and 6Xe. The ratio i36Xe/’34Xe is of particular interest
because neutron absorption by 135Xe should result in an increase in the proportion of 36 Xe. The yield ratio for 35 U fission is 0.801; and samples 22 and 23 had ratios of 0.8 14 and 0.808 respectively. For U fission the yield ratio’ is 1.1 18, and sample 29 had a ratio of 1.1 15. The ratios clearly reflect which fuel was *the reactor; closer interpretation will require consideration of the system history when each sample was taken.
Total yields of kryptons were low, doubtless because of the relatively small samples, 500 to 1500 cc, isolated between valves in line 518 in these samples. A more concentrated sample is needed to improve accuracy, and longer periods of steady operation prior to sam- pling should assist in reaching a steady state. The more concentrated samples can be obtained straightforwardly by passing the off-gas over heated CuO and through the absorber and collecting a suitable amount on the low-temperature molecular sieve.
1 1.1.6 Examination of Material Recovered from MSRE Off-Gas Line
E. L. Compere
At the end of run 16 a restriction existed in the off-gas line (line 522) near the pump, which had

144
developed since the line was reamed after run 14.12 To clear the line and recover some of the material for examination, a reaming tool with a hollow core was attached to flexible metal tubing. This was attached to a "May pack" case and thence to a vacuum pump vented into the off-gas system. The May pack case held several screens of varied aperture and a filter paper. The specialized absorbers normally a part of the May pack assembly were not used.
The tool satisfactorily opened the off-gas line. A small amount of blackish dust was recovered on the fdter paper and from the flexible tubing.
Analysis of the residue on the filter paper is shown in Table 11.3. The total amount of each element or
"E. L. Compere, MSR Program Semiann. Progr. Rept. Aug. 31,1968.ORNL4344, pp. 206-10.
W isotope was determined and compared with the amount of "inventory" fuel salt that should contain or had produced such a value.
The constituent elements of the fuel salt appear to be present in quantities indicating 4 to 7 mg of fuel salt on the filter paper, as do the isotopes 14'Ba, 144Ce, and 95Zr, which usually remain with the salt. It is note- worthy that " U is in this group, indicating that it was transported only as a salt constituent and that the salt was largely from runs 15 and 16.
The isotopes 89Sr, 91Y, and I3?Cs, which have noble-gas precursors, are present in significantly greater proportions, consistent with a mode of transport other than by salt particles.
The "noble metal" isotopes 95Nb, 9 9 M ~ , Io6Ru, and 9mTe were present in even greater proportions,
indicating that they were transported more vigorously than fuel salt. Comparison with inventory is straight-
.
Table 11.3. Material Remered from MSRE O f f a Line After Run 16
Isotope activity corrected to shutdown, 12/16/68
Total Total/(lnventory per Found Milligram of Salt) Isotope or Element Inventory
Prior Isotopes in Chain
ldsec I4OXe +66-sec I4OCs Short (Xe, Cs, Ba, La) A 2 1 - 1 n i n ' ~ ' S b ~ 2 5 - m i n ~ ~ ~ T e -
AI P 15% 30-hr 131mTe
Short (Kr, Rb, Sr) +IO-& 95Y - 3.2411 89Kr + 15-min "Rb l O - s e ~ ~ ~ K r + 1 4 - & ~ ~ R b ~ l ~ h r ~ ~ S r ~ 2 2 - s ~ '37~+3.9-min ' j7xe
Short (Kr, Rb, Sr) + 10-min 9s Y+65-day 95H
4.6-hr Iz9Sb >
Element
Li Be zr
?33u
Isotope
12.8-day I4'Ba 2 8 ~ a y ' 4 4 ~ e
8.05-day
65-day 952r
524ay "Sr 5 8 . 8 4 ~ 91Y 30-year I3'cs
35-day 95Nb 2.79-day 9 9 ~ 0
367-day lo6Ru
34-day '' 9mTe
(mglmg salt)
0.1 16 0.067 0.116 0.0067
(dis/min per mg salt)
4.1E6 4.1E7 9.8E4
7.4E6
2.9E6 5.2E6 4.1E6
9.4E6" 3.1E4,3.1Ua
2.8E6,9.8EP
5.2E4,2.0E4"
(mg)
0.80 0.35 0.47 0.0396
(diS/min)
1.77E6 1.48E8 1.01E6
3.08E7
3.13E8 1.20E8 4.31E8
1.40E9 2.76E7
3.51E6
9.2E7
7 5 4 6
8 4
10
4
110 23
110
15w
9ow
136W
1800,450W
"Assumed zero after reprocessing August 1968 before Run 15. k,

forward in the case of 2.79day "Mo and 34day lzgmTe, since much of the inventory was formed in runs 15 and 16. In the case of 367-day ' Ru, although a major part of run 14 material remains (somewhere), salt samples during runs 15 and 16 have shown little to be present in the salt; if only the ' 06Ru produced by
U fission is taken into account, the relative sample value is high.
The fuel processing, completed September 7, 1968, appeared to have removed substantially all "Nb from the salt. Inventory is consequently taken as that produced by decay of Zr from run 14 after this time and that produced in runs 15 and 16 (see Sect. 11.1.4 of this report). Thus the "noble metal" elements appear to be present in the material removed from the off-gas line in considerably greater proportion than other materials. It would appear that they had a mode of transport different from the first two groups above, though they may not have been transported all in the same way.
There remains 8.05day ' "I. The examination" after run 14 of the jumper section of the off-gas line found appreciable '' ' I, which may have been trans- ferred as 30-hr '' ' mTe. In the present case essentially all the ' ' I inventory came from a short period of high power near the end of run 15. Near-inventory values were found in salt sample FP 164, taken just prior to the end of run 16. Thus it appears that the value found here indicates little ' ' I transferred except as salt.
1 1.2 FISSION PRODUCT VOLATILIZATION TESTS
S. S. Kirslis F. F. Blankenship
A large number of hotcell and laboratory tests have been carried out in an effort to characterize more precisely the nature of the process by which fission products "volatilize" from the surface of highly radio- active MSRE fuel salt. This basic information is needed in order to predict with some reliability the behavior to be expected in the MSBR off-gas system.
Results were reported previously' from two series of hotcell tests in which helium was passed slowly over the surface of molten MSRE fuel salt and then through chemical traps or probes which were later sectioned and radiochemically analyzed. Also reported in detail was one of the tests in the fourth series in which particulate matter from the effluent helium was collected on electron microscope screens and identified as fuel salt
145
' 'S. S. Kmlis and F. F. Blankenship, MSR Program Semiann. Progr. Rept. Feb. Z9,1968,ORNL4254,pp. 100-113.
particles and aggregates varying in diameter from 35 A to several microns. The discussion of the other tests in the third and fourth series will be organized under test type. The third series comprised ten tests carried out one to eight days after installing a fresh 50% sample of MSRE fuel salt (FP14-62) in the reaction vessel. The series was terminated by a furnace failure which ruined the reaction vessel. The fourth series included 16 tests carried out 5 to 75 days after placing a fresh 50-g sample of MSRE fuel salt in a copper capsule (FP14-69) in the reaction vessel. Failure of a temperature con- troller caused the melting of the copper capsule after the eighth test (26th day). Fewer radiochemical analy- ses were obtained on subsequent tests. The top of the reaction vessel for the third and fourth series was of larger size ('4 in. ID) than for the first two series to permit the insertion of the larger test assemblies required for some of the runs.
The results of the third and fourth series of tests are given in detail in Tables 11.4 and 11.5. The main conclusions to be drawn from this mass of data will be given in the following text.
1 1.2.1 Chemical Robe Tests
In these tests dry helium was passed at 10 cc/min for 50 min over the surface of the molten fuel salt at 6OO0C, then up through a chemical probe tube whose entrance was '/4 to '4 in. above the salt surface. The probe tube contained a 4-p Felt Metal filter and 1-in.-long sections of NaF and soda lime. In the first two tests of series 111, both run one day after salt sampling, the Felt Metal filter appeared to plug, causing a rapid rise in system pressure to 5 psig and a decrease in flow to below 5 cclmin. Correspondingly, the activities found in all sections of the probes were lower by about an order of magnitude than in the similar series I1 tests. Curiously, the ' zTe and ' 9Te activities were higher than in the series I1 tests. The third series I11 test, run eight days after salt sampling, showed normal flow behavior, and the activities behaved as in the series I1 tests, except that distinctly higher amounts of the tellurium isotopes were found in all probe sections by factors of 100 to 1000.
Three series IV tests were carried out before the temperature controller failed: the first 5 days, the second 17 days, and the third 26 days after the fuel salt sample (FP14-69) was taken. When the activities were calculated back to the fuel sampling time, the results of all three tests were fairly similar and also matched the results of the series I1 tests. The tellurium isotopes did not behave exceptionally as they did in the series I11 tests.

146
The observation that the results of the series I1 tests and the three series IV tests agreed so well (within a rather wide experimental scatter) deserves comment. I t should first be realized that if it is assumed that the volatilization behavior varies linearly with the total beta activity of the fuel salt, no large differences would be expected in these experiments. The total beta power of MSRE fuel salt decreases only by a factor of 2 from 1 day after sampling to 12 days after sampling. A decrease of another factor of 2 would require another
100 days of decay. Since the series I1 tests were performed 1 day after sampling and the series IV tests 5, 17, and 26 days after sampling, the results would be expected to agree within a factor of 2 or 3, which is less than the experimental scatter. I t thus appears that the most convenient way to investigate the effect of beta activity on volatilization rate would be to add a large amount of a short-lived beta emitter such as "Sr to the reaction vessel.
Table 11.4. Results of Third Series of HotCell Tests in Quondogical Order
1+ 1 1- 1-0
1-8 1 1-PY 1-11.1 1-SL
2+ 1 2- 2 - 0
7 cc/min. 105 =in. 9.787 ( E l e c t r i c charge test) 5.288
(Chemical probe test) -986 -3E8 e586 5586
5 - e e h i n . 40 m i n . -3.887 ( E l e c t r i c charge test) 2.486
2.01810 4 .858 t4 .785 -3.685 1.887 7.7686 6.3E6 7.386 6.7486 1.92810 4.4E8 3.286 t3 .486 1.2E7 3.9586 7.186 8.886 6.9986 4.9810 1.0589 -2.187 t1 .786 5.087 4 . 1 8 6 4.087 -1.787 2.587
1.8189 4,287 2.2785 1.72E4 2.486 1.586 1.2286 2.OE6 1.9186 4.36810 9.938 4.6987 3.0E6 8.2786 1.286 4.6786 2.386 1.7486 5.687 1.186 2.1785 71.485 t7E4 t 2 . 5 8 4 t 4 . 2 8 4 t 4 . 7 8 4 t 9 . 1 8 3 1.9886 t1 .185 -1.1S4 51.384 <5% <2.384 t2.5E4 t 3 . 9 8 4 t 9 . 1 8 3
1.64310 4 .418 4.285 t6E4 6.086 1.5186 53 .385 t1 .285 -7.184 1.26810 3.388 8.9E5 c l . l E 5 4.786 1.4286 -3.4E5 t2.7E5 -7.334
-1.1810 9.488 4 . 8 8 6 t2 .285 7.486 -1.486 -1.686 <985 -2.184
5.1086 5.3386 2.587
1.5386 1.3186
t 1 . 5 8 4 t 1 . 5 8 1
t 1 . 6 8 5 t 2 . 4 8 5 -2.185
3.7887 2.2687
6.5187 1.2189 6.2389 8.4089
1.2388 5.0787
2.05 1.38
0.246 0 .22 0 .01 0.005
0.109 0.129
2-B 1 (Chemical probe test) t5E6 4.4089 1.088 1.4085 51.4E4 1.3087 -3.785 <9.2% t484 t 7 . 5 8 3 t683 6.4587 50 .01 2-PM t287 6.7439 1.788 5.7285 3.984 t6 .785 4 . 6 8 5 t l . 1 3 5 <3M t lE4 t 8 8 3 8.5888 0 . 0 3
- 8.0489 5 0 . 0 1 2-11.1 t237 - - 4.0389 0.023 2-SL -386 - 1-1-1(1") 2 15 c c h i n , 3f h r s . t3E8 1.94810 ( 4 8 8 ) -5.684 58" -9.385 51.885 -7.785 t285 t4E4 t 6 M 1.2789 0.013
1-1-2 ( 2 " ) ( F i r s t f low d i f f u s i o n 53.486 9.5689 2.288 4 . 3 3 4 5383 2.2F.6 t115 t1 .985 4 8 5 -6- t 8 8 3 2.0189 0.051
F-1-3 (4") t e s t ; s e c t i o n s of U i 9 8 6 1.0989 2.487 -1.784 e484 t3 .885 t285 t 4 . 4 8 5 53E5 4 8 4 t9E4 1.90810 0.097
F-1-4 (5") tube before m i l l i p o r e 5387 8.9987 -1.036 -1.684 e284 6.3E4 t484 0 . 8 8 5 56" 4 8 4 4 8 4 7.3489 0.026
-
fi lter)
CTI-B CTx-ua1 CTI-AIz 0, CTI-T
CTP-1(1") m - 2 (2" )
cTP-3(4") e m - 4 (5")
2 5". 15 c c h i n . 2 hrs. (587 ( F i r s t c l w e d tube run) t787
<386 t287
2-3 15 cc/min, 17: hrs . -487 (Second f l o w d i f f u s i o n t1 .287 t e s t ; s e c t i o n s of Ui t587 tube before long CU tube) t188
3.0489 1.8388 1.2888 1.7188
1.3810 3.989
7.2987 3.584 4.386 4 8 3 3.086 -583 3.8316 -1.5M
3.0288 53.984 8.687 52.584
1 .484 ~ 4 8 3 t lE4 c483
59.384 t 3 . 6 8 4
5.8038 1.286 t 1 . 0 8 5 t985 -5M 3.388 -1.885 <1.484 t 1 . 5 8 4 4 . 5 8 3
2.786 4 . 7 8 4 <1.284 t3 .984 (9.783 5.885 -2.384 1.185 t1 .884 -383
6.2088 1.187 t l . 2 8 5 t2.8B5 C7E4
2.3688 1.9B7 t l . 4 8 5 <3.585 t8E4
t 6 8 3 <I83 t 7 3 3 t4 .083
(884
t884
6.2387 0 .03
1.4088 0.09 3.4889 0 .07 9.7688 0.68
1.51810 0.082 2.59310 0.105 5.02810 0.133 7.76810 0.206
CT2-S 3 2", 15 c c h i n , 3 hrs . t216 1.01810 2.3288 - 2 . 9 M t 1 . 5 8 4 6.3487 2.685 t 4 . 5 8 4 t684 -1.684 t2E4 1.6189 0.22 CTZ-tiaF (Second c l w e d tube run) t486 6.7487 1.686 -2.1% <483 -4 .885 a l . 1 8 4 t4 .483 t1 .381 72 .683 t 4 8 3 1.5589 0.020 CT2-Al10, t686 5.3287 1.286 -3.484 t3 .583 W.2M t783 C4.483 t1 .684 <383 t583 4.7287 0.08
CT2-T t8 .615 1.7488 4.1286 - 5 . 3 8 3 t 3 . 8 8 3 -3.884 t 7 8 3 1.884 t 3 8 4 <383 t 3 8 3 8.9386 0.098
CT3-B 3 lo" , 15 c c h i n . 4 hrs. tZ86 3.7589 8.887 - - 2.2588 1.186 t 2 . 5 E 4 <I84 -1.6% t 1 m 2.4989 0.266 cT3-11a1 (Third c l o s e d tube run) t286 4.087 9.24E5 53.283 t 6 8 3 4 8 3 t483 1.0388 0.026 CT3-Al20, t286 2.187 4.5885 -2.5E4 <I83 7.8086 0.107
I+ 7.2296 g, syr inge -1.lElW3.588 t487 -1.0587 t886 0 7.59810 6.04810 9.26810 5.69810 5.06810 1.90E10 dw//s
3+ 8+ 8 c c h i n . 40 min. 5.689 1.00E10 2.5E8 9.9516 6.935 -5 .686 6.986 2.9687 4.9887 3.387 2.8087 2.9987 1 .05 3- ( E l e c t r i c charge t e s t ) 4 . 8 8 9 4.0289 1.1688 5.2686 3.2685-2.387 4.586 4.2587 9.5287 3.9287 3.1287 2.07E7 2.16 3-0 - -1.2810 2.6088 -3.787 -3.385 1.786 7.9386 3.488 2.9588 2.188 1.6E8 - 3-8 (Chemical probe t e s t ) t5E7 3.22810 7.988 1.1187 9.885 3.187 9.186 8.587 1.1588 1.1388 6.287 3.2887 3-PY 2.788 1.98810 4.688 7.686 5.385 9.586 2.986 2.387 4.526 2.386 1.686 1.6888 )-us1 6.587 1.2388 1.886 2.786 4 .785 7.44E6 3.186 6.1186 1.386 5.985 4 .485 1.0289 3-SL <7.987 1.4088 -2.lE6 2.686 -3.385 5683 5985 6.0986 1.5E6 8.185 b.685 2.0289
Analys is of Bemining S a l t .nd Liner; values for BS and Ts in dpm/g. for BIA and T U in t o t a l dpm in leach. Bs 8+ Bulk o f s a l t - - t5 .587 1.8687 8.5085-5.7810 1.29811 1.00811 1.32811 8.86810 9.1881W2.689 Ts Top 1/4,, layer of s a l t - - -4 .7588 8.9688 4.2087-4.4810 1.18811 1.04811 1.10811 8.14110 8.45810 2.63810 BI A Leach of bottom of l i n e r - - 1.2589 1.76110 1.0389 1.11811 9.289 7.1089 1.11110 6.4689 7.8089 t2810 TIA Leach of t o p o f l i n e r - - 1.25310 1.27811 6.7089 5.4810 4 .218 2.5539 2.2689 5.3788 6 .4488 t1 .0810
T
8
8
. 8
Li

147
W *
.* 8
Second, the agreement between the results for the short-lived (7744 '32Te for the series I1 tests (1-day- old salt) and for the series IV tests (5, 17-, and 26-day-old salt), when all the activities were calculated back to the time of sampling, implies that the volatili- zation rate was proportional to the total amount of ' 32 Te in the reaction vessel. The less-reliable results for short-lived 99M0 support a similar conclusion. In future tests, other short-lived nuclides('43Ce, 239Np, "'Ag) will be sought, since it is of practical significance to determine the dependence of volatilization rate on concentration.
Two more chemical probe tests were carried out after the temperature controller failed, causing the reaction vessel temperature to rise above the melting point of the copper capsule (106OOC). The amounts of noble metals volatilized decreased by about a factor of 100. The quantities of most salt-seeking nuclides found in the probes were low by a factor of about 10, but the quantities of U were normal. The analysis of a salt sample taken after the temperature rise showed concen-
trations of all nuclides except Nb similar to those in a sample taken 6 days after salt sampling. No 95Nb was found in the 45-day-old sample. Likewise, no Nb was found in the last chemical probe. These results suggest that the inadvertent heating of the reaction vessel to about 1060°C caused the noble metals to assume a less volatile form and also interfered with the formation of a fuel salt mist.
The analyses of the remaining salt and the reaction vessel liner after the third hot-cell test have several features of interest. The activities per gram of 129Te, ' Ru were distinctly higher in the top '4 in. of the salt than in the remainder, and more of these activities deposited on the liner than remained in the salt. The behavior of 95Nb was apparently different, with a sizable fraction remaining in the salt phase. However, in this case 9 5 Nb was being formed by decay of 95Zr in the frozen salt during the 34 days between the end of the third hot-cell test and the analytical separation of 95Nb. Thus the 95Nb concentration in the salt at the end of the third test was probably low, as
Ru, and '
t Table 115. Results of Fourth Series of Hotcell Tests in chtondogical Order
I .
.
11 B 1 N Nap 8L
4- 5+ 4+ 4-0
68 6 N 6NaF 6SL
5+ 17* 5- 5-0
8B 8 N amp 8SL
9-0 2 6+ 9 - N 9-UaP 7-8L
Salt snrp1e 45+ dw/g .
A
10-8 46+ 10-N IO-nsF 10-SL ' "
10 cc/min. 40 =in. (Chemical probe test)
10 cc/min, 40 1111.
(Electric charge test)
(Chemical probe test)
4.0310g. syringe
10 =chin. 40 =in. (Electric charge test)
(Chemical probe test)
10 cchin, 40 =in. (Chemical probe test)
0.2891g. ireem rod
10 cchin, 40 1111.
(Cbmie.1 probe test)
>2E7 >a87 386 1E7 4E6 <4E7 >.?E6 2.386 <7E5 2E6 <119 >3E7 5E6 387 (786 <6E6 <9E6 1E6 1E6 >5E6 <ZE7 e3E7 <5E6 1E7 -2E7 (386 <786 <1E7 t186 -2E6 4 8 7 <117 dE6 1E7 -1E7 <2E6 1E6 e386 385 1E6
e9E7 2.01119 1.387 -2E5 ~1.385 3.3487 6.285 5.685 <ZE5 1.3E5 <1.588 1.1389 7.4386 2.6885 3.34E5 3.387 -1.2E6 1.586 <1E6 5.285
- 4.919 2.887 -886 4 8 5 1.6E8 -7.985 -5.586 5885 52.6E5
- 1.5489 1.OE7 6.3E6 6.4E6 1.4187 3.9E6 2.7887 - - 9.72E7 7.985 -5.4E6 -2.3E6 2.0386 3.286 1.60E7 - - <3E6 -2.1E5 1.986 4.5B5 2.55B6 8.215 8.1486 - - 3.61E7 -5.2E5 5.786 2.1E6 5.OE6 5.6E5 1.3687 -
e6.4E8 1.6688 e5.716 5187 <1.787 -3.289 9.13810 6.67310 8.68810 9.60810
>4E5 <388 >lE6 <2810 3E5 e2E9 2E5 <8E8
C1.585 2.1188 +..?E5 9.65E7 -i.8E5 6.8E9
- 4.6E7 - 1.2E9 - 1.32E10 - 2.9489
6.67810 1.40810
51.2E7 2.2187 1.386 3.1E5 -3.334 1.03E8 4.386 1.8536 1.1787 1.0617 7.9686 2.6E8 s1.287 3.5837 2.OE6 -5E5 -3E4 7.44E6 4.686 9.816 5.4E6 4.1586 3.0986 4.9587 - -3.087 1.386 -3.1E5 -3.7E4 - 2.56E6 1.786 -3.885 2.7E5 -5.5E5 - 51.2E7 3.05E7 1.686 1.05E6 3.785 1.1087 2.186 1.3287 6.985 - Z.9E7 3.4187 <9E6 6.0336 4.485 4.3E6 -3.286 3.9086 3.886 2.85El ~1.286 - l.4E7 7.6088
- - - 1.75E10 - - - 1.5219
- -2.8E7 1.4E6 -3E5 4 8 5 6.8E6 1.3085 1.99E6 4.7085 1.486 4.5E6 1.6686 - 11.637 8.7E5 -2E6 -186 4.586 1.5536 6.1586 1.0186 7.785 6Eb 6.0887 - - 9.5916 - - 2.4E9
- . - - - 5.77E6 - - 1.888
<2.6E7 -3.4E7 <3.1E7 0 1.ObEll 8.51E10 1.14811 8.58810 8.9810 -1.4ElO
- <3.4E4 -2.083 (583 -2.7E5 2.985 -3.334 <1.285 -5.384 -5.3E4 4.987 - <3.884 <284 e583 1.18E6 5.585 4.384 e186 e385 e315 6.988 - C1.5E4 <1.8E4 <5.283 -5.2E5 2.585 -5.9- <315 -1.386 -1.3E5 1.2610 - <1.584 Cl.lE5 <883 -7.014 <1.3E4 d.484 d.415 -3.5E4 -3.584 1.389
<2.5117 <1.637 <7E6 0 1.50811 7.40810 1.10811 8.78810 7.7611C4.44810
tO.2 -33.6 <0.44 < 0 . 3
0.16 0.32 (0.221)
0.12 0.27
50 .09
0.27
0.515 ,
0.379 0.130
0.081 1.86 0.011 1.21
0.104 0.136 0.208 0.136
0.125 0.175 0.130 0.224
6.92Zlg. myringe

in the first salt sample reported in Table 11.4. There was also sizable deposition of 95Nb on the liner walls. The fission products with stable fluorides showed normal concentrations in the fuel and low deposition on the liner walls.
The particles of most aerosols are electrically charged, with equal numbers of positively and negatively charged particles. One theory of formation of aerosols such as we have observed would require both the metallic and salt particles to be positively charged with respect to the helium environment It was thus of interest to determine whether our aerosols would collect preferen- tially on charged electrodes in the gas space above radioactive molten salt, In such experiments voltages in excess of 1000 v are usually applied to the electrodes. This was not easily accomplished in a hot cell, so we compromised by using a voltage of 90 v obtained by connecting four 22'4-v batteries in series. The test assembly included the usual chemical probe tube (containing a filter and chemical traps) at ground potential and two '/*-in.-diam stainless steel rods as electrodes connected to the batteries. The electrodes and the probe were held in place '4 in. from each other and insulated from each other and from the probe tube by a Lavite spacer 2 in. from the bottom and by a rubber stopper about 6 in. from the bottom of the probe and electrodes. The three chemical probe tests of series 111 and the first two of series IV were run with electrodes of this type in position.
The activities deposited on the electrodes and on the outside of the chemical probe were leached off with 2 N HN03, and the leaches were analyzed radiochemi- cally for 12 isotopes and for U by delayed-neutron counting.
The results showed that equal amounts of each activity deposited on both electrodes and that a slightly larger amount (usually) was found on the outside of the grounded probe tube, whose exposed area was twice that of each electrode. While this experiment would have been more definitive if larger voltages had been used, the indication was that the aerosol particles carried no charge of either sign.
1 1.2.2 Electric Charge of the Radioactive Aerosols
148
11.2.3 Electron Microscope Tests
Attempts were made by two methods to collect aerosol particles which could be examined and identi- fied with the electron microscope. In the fnst method, helium was passed over the molten fuel-salt surface,
then up a '/g-in.-diam nickel tube 12 in. long to a W Millipore filter which had been coated with a thin evaporated carbon film. Five runs of this type were made with helium flow rates varying from 15 to 100 cc/min and flow durations from 1 to 4 hr. The Millipore filter was dissolved away from the carbon film, which was then picked up on electron microscope screens and examined. Very little particulate matter was found by electron microscope examination of these specimens. Two of the larger particles were identified by electron diffraction as graphite and one large particle as metallic nickel. The bulk of the foreign particles were in the micron size range, were rounded in shape, and tended to form chains. They did not yield a satisfactory diffraction pattern and thus could not be identified. No particles had the appearance of the fuel-salt particles identified by the first run of the second collection method, Apparently most of the latter particles were deposited along the length of the 12-in.-long tube which carried the helium out of the reaction vessel to the Millipore filter holder.
The second collection method, involving direct depo- sition of aerosol particles on electron microscope screens positioned just above the fuel salt, and the results of its first run were described in detail in the previous report.I3 Four subsequent runs by the same method were carried out but failed to yield satisfactory specimens for examination. Only small fragments of the thin carbon film on the electron microscope screens were found to have survived intact after the exposure, the removal from the screen holder in the hot cell, the packing of the screens into individual bottles provided with miniature desiccators, and the transport of the bottles to the electron microscope. No really satis- factory collections of particles could be found by electron microscopic examinations of the few surviving scraps of carbon film. I t is believed that most of the handling problems which destroyed the carbon films may be solved by transferring the.screens directly from the screen holder through a small funnel into small plastic-gill capsules whose rounded shape will allow only the edges of the flat carbon-coated screens to touch the inner capsule surface. I t is clear that the handling problems are not insuperable, since three of the six screens from the first run by this method were recovered in satisfactory condition.
., - 8
.
s
a
1 1.2.4 Aerosol Deposition from a Helium Stream
One of the standard methods for determining particle size and its distribution in aerosols is to measure the

149
deposition gradient along the walls of a tube through which the aerosol flows. If the aerosol contains particles of a uniform size, the diffusion coefficient of the particles can be calculated from the deposition gradient according to the equation:I4
A log n, - 5.000 Az Q '
---
where n, is the number of particles deposited per unit length, z is the distance from the channel entrance, D is the diffusion coefficient of particles in the carrier gas, and Q is the volumetric flow rate. In the derivation of this equation it is assumed that the particles stick to the wall when they collide with it. From the diffusion coefficient the particle size may be estimated.
Two experiments were performed from which values of D could be estimated. In the first, helium was passed at 15 cc/min for 18 hr over the surface of the molten MSRE fuel salt with the gas exiting through a '4 -in.-OD nickel tube 12 in. long. The nickel tube was connected to a coil of '4-in.OD copper tubing 100 ft long. The nickel and copper tubes were then disconnected and brought out of the hot cell. The exterior surfaces were decontaminated with a nitric acid wash, the tubes were sectioned, and the interior surface of each length of tubing was leached free of activity. The nickel tube was sectioned into lengths, starting at the inlet end, of 1,2, 4, and 5 in. Each section was leached with 2 N HN03 containing a little HCl. The leaches were analyzed radiochemically for the usual 12 nuclides and for ' ' U by delayed-neutron counting. The long length of copper tubing was cut into lengths of 1,3,6, 10, 15,25, and 40 ft. It was leached first with ",OH, then HCl, and finally with HN03. No radiochemical analyses were performed on these leaches, since gamma spectrometer scans showed that all of the activity was 13'I. Even after chemically removing 99.9% of the 13'1, the gamma scans showed only ' I activity remaining.
The nickel tube leaches also contained predominantly "I activity, which complicated the accurate measure-
ment of other activities. Most of the latter were on the 1- and 2-in. sections on the inlet end. Reliable analyses of the other two sections could not be made. On the basis of these rather uncertain data, the noble metal activities per inch of tube generally dropped by a factor
. of about 6 and the salt-seeking species showed no appreciable change in going from a z value of 0.5 in. to
14R. L. Bennett, W. C. Hinds, and R. E. Adams, Development of Iodine Chamcterization Sampler for Application in Humid Enviiunments, ORNL-TM-2071, p. 21 (May 1,1968).
one of 2 in. Thus D calculated from the equation given above is about 0.01 for the noble metals and very small for the salt-seeking nuclides. No conclusions regarding aerosol behavior can be drawn from the analytical results for ' ' I, since it prohably traveled as gaseous HI (or possibly CH31) produced by the hydrolysis of the molten salt by traces of water in the dried helium stream. It is clear that this gaseous iodine species did not behave as an aerosol particle and in particular that it did not stick to the wall on the first collision with it.
A second similar test was carried out on the '/,-in.-OU nickel tube 12 in. long used as the helium exit tube for the first Millipore filter run. This tube was removed from the reaction vessel after helium had flowed for 3'1' hr at 15 cc/min. The tube was put through the same leaching and sectioning procedures used for the nickel tube from the long-copper-tube run. The analyses were again complicated by high 13'1 activities, but somewhat more satisfactory results were obtained. Again the noble metals showed a decrease in activity per inch of tube from the inlet to the outlet, while the salt-seeking species showed little change. Diffusion coefficients in square centimeters per second calculated from the deposition data were 0.06 for 9 9 M ~ , 0.025 for "'Te and IZ9Te, 0.017 for Io3Ru and lo6Ru, and 0.021 for 95Nb. These values are probably reliable within a factor of 2 because of the logarithmic way in which the activity ratios enter into the calculation of D. The activity ratios themselves are only reliable within a factor of about 10. From these values of D it is estimated" that the diameters of the particles carrying the Te, Ru, and Nb isotopes were in the range 17 X lo-, to 33 X lo4 p, or 17 to 33 A. The 99M0 particles may be somewhat smaller, and the fuel-salt particles carrying the salt-seeking species are indicated to be considerably larger. It is likely that the very small size of the particles carrying noble metals accounts for the fact that they could not be characterized or identified by electron microscope techniques, particu- larly since their concentrations' in the aerosol mixture were low compared with the concentration of fuel-salt particles. The extremely small size of the noble metal particles suggests that the noble metals in the aerosol exist as groups of metal atoms rather than as species sorbed on other very small particles. These interpre- tations are based on only two rather crude diffusion tube tests and should not be relied upon too heavily until they are confirmed by more refined tests. A
"J. W. Thomas, The Diffusion Battety Method for Aerosal Particle Size Determination, ORNL-1648, pp.48-51 (Dec. 14, 1953).

150
significant source of error in the above estimates will be discussed in the next section.
11.2.5 Closed-Tube Diffusion Tests
Before results were available on the flow diffusion tests just described, it was speculated that the aerosol particles might be so large that the deposition gradients could not be estimated. Therefore three closed-tube diffusion tests were carried out to obtain steeper deposition gradients which would indicate qualitative differences in diffusion behavior of the various nuclides. Each diffusion tube was a 12-in. length of '&-in.-OD nickel tubing welded closed at the upper end. At distances of 2, 5, and 10 in., respectively, from the open bottom ends, the three tubes were provided with chemical traps made by packing 1-in. lengths of the tube with NaF and activated alumina pellets. Each tube was positioned in the reaction vessel with the open end '4 in. from the surface of the molten MSRE fuel salt, and the gas space above' the fuel salt was flushed with a slow flow of 15 cc/min of dried helium. The run durations were 2,3, and 4 hr, respectively, for the tubes with chemical traps 5, 2, and 10 in. from the open end. After leaching the exterior of each tube free of activity, it was segmented to provide samples of the NaF trap, the alumina trap, and of the tubing below and above the traps. Each sample was dissolved and analyzed radiochemically for 12 nuclides and by delayed-neutron counting for ' U.
The results for the diffusion tubes with the chemical trap 5 in. from the open end were puzzling, since the deposition gradients were hardly steeper than for the flow diffusion tubes, except for "Nb and 95Zr. The steepest gradients were observed in the tube with the trap 2 in. from the open end. The order of steepness was 9sNb, 13'1, "'Te, 129Te, 95Zr, lo3Ru, lo6Ru, '44Ce, 14'Ce, 99M~,89Sr, and '40Ba.Comparedwith the flow diffusion tube results, the 95Nb and 95Zr gradients were much steeper and that for 99M0 much less steep. These discrepancies are not easily explained except as analytical errors. The analyses for the salt-seeking nuclides were particularly difficult since the total leach solutions often contained less than lo5 dislmin in the presence of lo9 dislmin of 'I and 10' to 10'' dislmin of the noble metals. Because of analytical difficulties, complete analyses were obtained on only half the nuclides requested for the third diffusion tube samples. They agreed in general with the results from the second closed tube (trap 2 in. from open end).
The main puzzle in the closed diffusion tube results is why the deposition gradients were not much steeper
than observed. It must be concluded that modes of transport other than simple diffusion were operative. Convective currents set up by the considerable thermal gradient up the tube (600°C at the open end, 3OoC at the closed end) are a possibility. In any case, these results suggest that the flow diffusion tube results should be corrected for the deposition effects noted in the absence of net flow. This correction would appreciably decrease the deposition gradients and the diffusion coef€icients calculated from the flow diffusion tube experiments and thus increase the estimated aerosol particle sizes. The scatter of the data between runs and the lack of correspondence between specimens analyzed &e such that it would not be meaningful to attempt to carry out such corrections with the available data. An experiment in which a flow diffusion tube and a closed tube of identical geometry are set up side by side in the reaction vessel appears preferable for obtaining a good closed-tube blank for correcting the flow diffusion tube results.
11.2.6 Volatilization of MSRE Salt in the Absence of Radioactivity
Eight control tests were carried out in the laboratory to test the degree of volatilization of unirradiated MSRE fuel salt under the conditions of the chemical probe tests in the hot cell. A reaction vessel and chemical probe tubes of identical design were used, and the rest of the apparatus was similar to that used in the hot cell. The salt used was of very similar chemical composition to MSRE fuel salt, except that none of the v+ (0.2% U) had been reduced to U*. Runs were made under the same pressure and flow conditions as the hot-cell runs, as well as some at higher pressures and flows. In two runs the helium was bubbled through the salt as it was in some early hotcell tests.
After each run the chemical probe tube was put through washing, segmenting, and dissolution proce- dures exactly like those used for the radioactive tubes.
. The solutions were then analyzed for lithium by flame photometry and for uranium by delayed-neutron count- ing or by the fluorometric method. It was necessary to concentrate each solution (originally 100 ml) by a factor of 10 by evaporation to detect the elements. A blank on the chemical probe materials and the dis- solution reagents was run by carrying out the seg- menting, dissolution, and analytical procedures 'in an identical way on an unexposed chemical probe.
The analyses of the test and blank samples were difficult because the concentrations of uranium and lithium in the solutions were extremely low, of the
Li
. *
.
. .
cd
. S . S

151
W e
s .
t
- w
. .
.. L
order of 0.01 pg/ml in the blanks and in more than half the test solutions. Each sample solution was made up to a standard volume of 100.0 ml. The lithium and uranium analyses approximated the blank values for most of the NaF and soda-lime segments. The uranium contents of the Felt Metal segments also did not exceed the blanks. The bottom empty tube sections contained blank uranium concentrations in three tests, only slight excesses (1 pg) in two other tests, and about 10 pg excesses in the remaining three tests. One of the latter was a bubbling run at 20 cc/min. In general the variations in deposition were not obviously related to the helium flow rate, test duration, or pressure drop across the probe. In the case of lithium, the blank values were consistently exceeded only for the Felt Metal segment. The average excess was about 5 pg of lithium, corresponding to about 50 pg of fuel salt. For the bottom empty tube section, the blanks were usually only slightly exceeded except in the bubbling run at 20 cc/min.
It is difficult to exp1Jn the fact that the patterns of deposition of lithium and uranium were different. If both were carried by droplets of fuel salt, the patterns would be identical. Likewise if they traveled as vapors of LiF (or Li2BeF4) and UF4, similar deposition patterns would be expected. Since the deposition patterns for lithium were generally more consistent than for uranium, it may be assumed that the rare high uranium values were due to accidental contamination. In this case the lithium was probably traveling as LiF (or Li2BeF4) vapor, and the control test results should be interpreted as indicating no salt aerosol formation over the nonradioactive fuel salt. It is likely that convection and diffusion transferred a large part of the LiF vapor to the probe, since simple transpiration would transport smaller amounts. If the improbable assumption is made that the lithium travels as a component of fbel-salt droplets, the control tests still indicate less than 10% as much aerosol formation as was observed in the hot-cell tests.
1 1.2.7 Summary and Interpretation of Hot-Cell Test Results
The various hotcell and laboratory tests described above have confirmed previous information on the nature of the aerosols formed in the gas phase above highly radioactive MSRE fuel and have enlarged on this information. It was determined that neither type of aerosol is highly charged. The deposition behavior of the aerosol flowing through either packed or open tubes indicates that the noble metal aerosols travel independ-
ently of each other and their particles are of much smaller diameter (4 to 20 A) than that of the average fuel-salt aerosol particle. The control tests indicated that the molten salt must be radioactive to produce the salt aerosol. It was shown that convection and diffusion effects importantly affected deposition results. These will have to be taken into account or eliminated in future experimental work.
The mechanisms by which the metallic and salt aerosols are formed remain an open question. In the case of the metallic particles, a theory based on the difficulty of nucleation for metal atoms in a molten salt is favored. Individual metal atoms formed by fission or decay might not nucleate as crystals since their concen- trations and diffusion coefficients in molten salt are low. The solution would then become highly super- saturated in dissolved metal atoms, which would there- fore possess high activity coefficients and corre- spondingly high escaping tendencies.
11.2.8 Attempt to Sample Foam in Pump Bowl
Fuel density measurements and overflow behavior in the pump bowl during recent MSRE operation indi- cated that the fuel in the sprayed region of the pump bowl was in a foamy condition. It was of interest to sample the surface salt in the mist-shielded region of the pump bowl to see whether the foam penetrated from the sprayed to the mist-shielded region of the pump bowl and whether the surface salt was chemically or radiochemically different from bulk fuel salt.
A laboratory test indicated that a sample of frozen foam in which about 10% of the smaller bubbles visibly survived could be taken by quickly immersing a cold metal rod in foaming salt and rapidly retrieving it. The same operation was carried out in the MSRE pump bowl with a dog-bone-shaped piece of solid nickel with 3/4-in.-diam knobs at the end of a 3-in.-longY 3/8-in.-diam center section. The bottom knob and half of the 3/8-in.-diam section were covered with a frozen film of fuel salt to '4 6 in. thick. The knobs protected the brittle film on the center section from cracking off during retrieval up the sampling tube and shipment to the hot cells for examination.
The fuel-salt film was examined under a Kollmorgen periscope and under a 30-power stereomicroscope. It was mostly an opaque milky white with a faint green coloration visible in some regions. The top edge of the film and the region near the bottom of the 3/8-in.diam section were a pale transparent green with opaque white dots embedded in it. The exterior surface of the film was quite smooth compared with the jagged surface of

152
the frozen foam sample taken in the laboratory. However, two small craters about 1 mm in diameter, which looked like the remains of bubbles which burst during freezing, were observed on the outside surface, and two tiny bubbles were found embedded in the transparent salt.
The film was then cracked off the metal sampling device and the interior surface examined. Most of this surface was also smooth and white, but several dozen small hemispherical voids and a number of larger shallow depressions were visible (Fig. 1 1.2). Those almost surely represented the frozen remains of foam bubbles trapped between the metal and the salt film. Several discrete regions of the inner surface also contained large shallow depressions which were coated with a very thin dark shiny metallic-appearing film (Figs. 11.2 and 1 1.3). These may have been the remains of a solidcontaining foam. It has been speculated that small metal particles might tend to collect at salt-gas interfaces, since the salt does not wet clean metals. A few small flakes of salt actually had the porous
appearance of a frozen foam. This salt was also darker W in color than other salt flakes (Fig. 11.4).
A sample of white frozen flakes weighing 0.45 g was dissolved and analyzed chemically and radiochemically. The analyses showed normal concentrations of bulk fuel constituents and of fission products with stable fluorides. The concentrations of 9 9 M ~ , ' "Te, 129Te, 03Ru, and ' 06Ru were high by about two orders of
magnitude compared with fuel-salt samples taken in freeze-valve capsules. This degree of contamination by noble metals may be at least partially explained by the exposure of the unprotected sampler to noble metal aerosols in the pump-bowl cover gas.
A flake of salt film containing some of the dark shiny material on the inner surface was powdered and analyzed by electron diffraction. Only fuel-salt powder patterns were observed. An attempt was also made to identify the dark material on several flakes weighing 66 mg by dissolving away the fuel salt with oxygen-free Verbocit solution (a neutral mixture of sodium Ver- senate, boric acid, and citric acid) and analyzing the
. -
Fig. 11.2. Small Voids and Dark Film, Inner Surface. 30X. Reduced 44%. LJ

153
residue. The barely visible particles of gray residue (less than 1 mg) were only partially soluble in a mixture of HN03 and HC1. Spectrographic analysis of the solution detected only a few micrograms of beryllium and zirconium. A gamma spectrometer Scan and radio- chemical analyses of the acid solution showed several times more ’ Ru and Ru than were contained in the Verbocit dissolution of the original 66 mg of salt flakes. A final attempt is being made to identify the dark shiny material more positively by electron-probe examination.
The density of several flakes of the frozen film was measured by observing the density of solutions of C2 H2 Br4 in CCL in which the flakes would just remain suspended. The densities of several flakes ranged from 2.40 to 2.45 glcc. The density of simulated solid MSRE fuel salt measured by the same method ranged from 2.45 to 2.5 1 glcc, with most particles showing a density of 2.49 glcc. These readings indicate that the frozen flakes contained 2 to 4% voids.
All of the observations listed above indicate that there is probably a small amount of foam, some of which
contains insoluble material, on the surface of the fuel salt in the mist-shielded region of the pump bowl. However, it is not a thick foam such as probably exists in the pump bowl outside the mist shield.
11.3 LABORATORY TESTS ON AEROSOL FORMATION OVER MOLTEN SALTS
AND TRANSFER OF NIOBIUM FROM SALT TO BISMUTH
H. W. Kohn F. F. Blankenship S. S. Kirslis
Previously described pump-bowl gas analyses and hotcell tests with MSRE fuel saltI6 have led us to postulate the existence of two types of aerosols over the highly radioactive molten fuel salt: a fume of noble metal fission products and an aerosol of tiny fuel-salt particles. Confirmatory laboratory experiments using tracer levels of radioactivity were begun to investigate
laS. S. Kirslis and F. F. Blankenship, MSR Rogmm Semi- ann. hog. Rept. Aug. 31,1968.ORNL-4344, pp. 115-41.
Fig. 11.3. Dark Shiny Film, Inner Surface. 30X. Reduced 43%.

154
. 1,
Fig. 11.4. Dark Porous Flake of Frozen Film. 30X. Reduced 44%.
some features of the process of radioaerosol formation over molten salts. In particular, we wished to investigate the hypothesis that noble metals escape from molten salts because of the difficulty of nucleation of indi- vidually formed atoms into metal crystals. A convenient isotope for this study was 65-day 9sZr, which could be added to the melt as a soluble fluoride and allowed to decay atom by atom to 35-day 9*Nb. In a reduced melt, the reduction of niobium to metal should be zero order in reductant.
In the first tests the simulated fuel salt contained 0.1 mc of freshly separated "Zr in 40 g of salt." The apparatus that contained the salt and the procedure were similar to those used in the hotcell probe-tube tests:8 except that in some tests no flow was passed through the probes and in most cases the activity of the
"J. H. Holloway and F. N. Nelson, J. Chromatog. 14,
'*S. S. Kirslis and F. F. Blankenship, MSR Program Semi- 255 (1964).
ann. h g r . Rept. Feb. 29, 1968. ORNL4254, p. 102.
tubes was counted without decontaminating the outside of the probe tubes. These simplifications in procedure interfered with a direct comparison with the hotcell tests, but the presence or absence of flow or of bubbling had little effect on the amount of tracer collected. The first tracer experiments were also meant to be only of an exploratory nature.
The melt was treated for 1'4 hr with a 50-50 mixture of H2 and HF to convert oxides to fluorides. Then probe tubes, used as gas exit lines from the pot containing the fuel, were exposed at various sweep rates, temperatures, pressures, and degrees of reduction of the fuel salt. Other parameters - the degree of bubbling, flow rate, and distance of the probe tubes from the melt, as well as their geometry - were also varied. At the conclusion of the experiment four salt samples, one from the top of the melt, one from the middle, one from the bottom, and one more repre- sentative of the total sample, were taken and counted. The top of the reaction bomb, the inside bomb casing, four pieces of the nickel liner, and the nickel bubbling tube were washed; the washings were analyzed for
L
" . bi

..., .. y- r- 155
’Nb and ’ Zr as well as for lithium and uranium so that we could check the percent recovery in the washings and the composition of the adhering material. The results of these analyses are presented in Table 11.6. It is noted that the niobium preferentially migrates to the surface of the salt, to the bottom, and to the walls of the container. The bulk salt is somewhat depleted in 95Nb, as expected. It is possible that some of this is due to precipitation of ZrOo, since the bottom fraction of the salt is enriched also in ’ Zr.
It was considered important to make sure that the melt was indeed reducing so that the niobium would be
. in the elemental form. Otherwise the niobium would have escaped into the gas space as a volatile fluoride. A log of operations and their effects is given in Table 11.7. The first reduction (corresponding to 1% of the W‘”) was done by adding a milligram of zirconium metal. This was followed by more severe reducing conditions; further additions of 20 mg of UF3 and,
hd t
0
q .
t
after some temperature cycling, another addition of 200 mg of UF3. The degree of reduction had little effect on the amount of total deposition on the probe tubes. The ratio 95Nb/95Zr on the probe tubes was always greater than this ratio in the salt, usually more than ten times greater. The only treatment which increased the deposition greatly was applying a vacuum or sparging the melt with HF after some niobium had grown in. The HF sparge also increased the ratio 95Nb/9SZr on the probes to several hundred times what it was in the melt.
The principal conclusions of the tracer tests were as follows: (1) Small amounts of 95Nb, and to a lesser extent salt as a carrier of 95Zr, escaped to the gas phase, presumably by the same mechanisms as in the hot-cell tests on fuel. (2) The degree of reduction had little influence on the total deposition of 95Nb in the probe tubes. (3) The deposition mechanism is probably controlled by diffusion, since low flow rates and gentle
Table 11.6. Analysis of Final Samples An samples corrected to time of sampling
A. Salt Samples
Enrichment 9% 95Nb Sample (ais min-’ g-l) (dis min-’ g-l)
. ~~
Surface 3.3E7 center 2.3E7 Bottom 45E7 Bulk 2.1E7 StaIldar8 1.7E7
25E7 1.5 8.4E6 0.73 8.1E7 3.6 9.3E6 0.88 6.0E6 0.97
B. Washings
9% 95Nb Enrichmen9 Excess (cm+)c 95Nb (didmin) (didrnin)
. . - LJ
Bomb casing Bomb top Container, 5 cm just
Container, top 2 cm Container contacting
Container contacting
Dip tube
above salt
salt, top 3 cm
salt, next 4 cm
l.lE6 6.4E5 3.6E6
2.7E5 5.3E5
2.1m
9.2E4
7.9E5 1.4 2.5E3 4.3E5 1.3 3.9E5 l5ES 0.8
3.0E5 2.2 1.2E4 5.4E5 2.0 2.0E4
5.OES 4.7 1.5E4
1.3ES 2.7 2.5E3
=The stand&d salt sample was removed from the melt at the beginning of the experiment and was counted throughout to check the 95Nb/95Zr ratio and the counting procedures.
bEnrichment is the ratio of 95Nb/95Zr in the sample to the 95Nb/95Zr in the standard.
CExcess 9sNb is the total 95Nb minus that 95Nb associated with the 9 ’ ~ r in the adhering salt.

156
Table 11.7. Deposition of 95Nb and from Fuel Salt Li
Operation
Rate of Rate of Enrichment Factor, Time Deposition Deposition "m/95~r in probe
I n t d of 9% of 95Nb 9 5 ~ b / 9 ~ ~ r in melt ' (hr) (dis min-1 h - 1 ) (dis min-1 hr-l) Calculated
s t
1 Bubbled He, 56OoC 2 Bubbled He + 5% H2 3 Add Zro 4 Same 5 Sweep, no bubbling 6 Add 20 mg UFs 7 T = 605OC 8 56OoC, HF, 200 mg UF, .
9 Stopped flow 10 p = 5 psi 11 High area probe 12 Vacuum 13 0.5 mm He + H2 14 HF sparge 15 He + H2 sweep 16 T = 47OoC 17 47OoC, 200 mg UFJ 18 42OoC
20 42OoC 19 20oOc
0-44.5 445-68.5 68.5-139.5 139.5-164.5 164.5-188 188-211.5 21 15-2355 235.5 -307.5
333-334 3355-337 3555-3565 358-360 3615-363 3825-384 384-386 476-500 500-524 5305-548 581-642 642-658
3.3E4 5.0E3 6.5E3 7.4E3 2.3E2 1.9E3 l.lE3 2.6E3 1.2E3 8.1E3 . 3.2E3 2.0E4 2.1E3 I.9E4 5.3E3 5.1E4 TotaI Counts, 95Zr and 95Nb
5.2M 4.8E4 4.6E4
5.8E5 6.1E5 2 3 % 3.7E6 1.2E4 1.4E6 9.OE2 2.8E6 5.4E2 , 5.8E3 1.OE2 S.3E3 1.2E2 1.3E3
4.0E1 1.5E2
4.1 20 76 19 45 37 49 40
3.9 5.0
391 1130
29 134
26
bubbling did not give greater total deposition rates than stopped flow, in agreement with the hot-cell tests. (4) In both tracer experiments and hotcell tests most of the 95Nb remains in the salt, whereas in the reactor only a low percentage remains in the fuel. It should be noted, however, that the tracer and hotcell tests are run for only short times over a stagnant melt, whereas the reactor is vigorously circulated and sparged and is at a steady state concerning those isotopes. (5 ) In the tracer experiment about 25% of the 95Nb migrates to the container wall during the total experiment (one month).
The relative rates of escape of "Nb to the gas phase in the tracer experiment and in the second hot-cell tests (a few hundredths to one percent per hour) are in essential agreement. In the first hotcell tests, however, the rate of 95Nb escape to the gas phase was much greater. Most of this can be accounted for by a few high results obtained when the melt was vigorously bubbled. In the reactor about 50% of the "Nb escaped to the gas, and a similar amount migrated to the walls. Our best guess so far is that the differences in the three results (reactor, hot-cell, and tracer experiments) are due to
. .
s engineering parameters involving stirring and efficiency of mass transfer which are difficult to evaluate with our present experimental arrangement.
The most plausible explanation that we can offer at present is that both salt and niobium are moving by diffusion and that the niobium, under severe reducing conditions, preferentially leaves the melt as unnucleated metal atoms. The calculated nucleation rate in the melt is too low to allow nucleation, and the calculated gaseous nucleation rate is indeed adequate. However, a serious drawback to this picture is that the 95Nb metal atoms should pass across the interface between the melt and the container wall as readily as they escape through the gas-melt interface. One would ordinarily expect the "Nb to stick to the wall at every collision, yet this is not borne out by the data. The contamination of the wall and the bomb top is far too low. Some of this deficit could be due to a loss of deposited 9"b as a volatile fluoride during the intermediate HF treatment.
Some further tests were camed out to measure the extractability of reduced niobium from MSRE salt into liquid bismuth. The salt melt containing Zr and 5Nb was purified with HFH2, reduced with zirconium
. 4
. 6-'

157
metal, and contacted with liquid bismuth at 600°C in a molybdenum container. At the same time, coupons of several metals and of GrafoilI9 were exposed to the reduced melt.
Only 2% of the 95Nb in the salt phase transferred to the bismuth phase in three days, possibly because of the lack of adequate mass transfer across the interface. Deposition rates in the liquid for 95Nb on molyb- denum, nickel, and stainless steel exposed in the gas in the previous experimental melt were similar to rates on the probe specimens. Especially noteworthy were the much lower deposition rates of 95Nb and 95Zr on the Grafoil specimens.
We attempted to repeat this experiment using a better grade of bismuth, a carbon crucible, and a molybdenum lift pumpzo for stirring. Due to a failure of the circulating pump diaphragm, this experiment was a dismal failure. The salt could not be reduced. The one item of information that we were able to salvage from this experiment was that niobium from an unreduced melt will not migrate into bismuth. Deposition of niobium on the molybdenum surfaces from this oxi- dized melt was about one and a half orders of magnitude slower than it was in the previous experi- ment, and deposition on the carbon crucible was about the same as the deposition on the molybdenum crucible in the previous experiment.
11.4 THE CHEMISTRY OF THE NOBLE FISSION PRODUCT FLUORIDES C. F. Weaver J. W. Gooch, Jr. H. A. Friedman J. D. Redman
11.4.1 Molybdenum Fluoride Synthesis, Characterization, and Stability
It was previously reportedz'*22 that MoF4 may be synthesized by disproportionating MoFS in approxi- mately 1 atm of MoF6 and that the compound was stable for many days at a temperature of 200°C and pressures in the micron range. It was also found that the
l9~raf0il is a new type of graphite in the farm of a flexible sheet made by Union Carbide.
"C. F. Baes and C. E. L. Barnbergex, Reactor Chem Div. Ann. Rogr. Rept. Dec. 31, 1968, ORNL-4400.
"C. F. Weaver, H. A. Friedman, and D. N. Hess, MSR drogrrn Semhnn. Rogr. Rept. Aug. 31, 1968, ORNL-4344,
2zC. F. Weaver, H. A. Friedman, f. W. Gooch, Jr., and D. N. Hess, Reactor Chem. Diu. Ann. Rogr. Rept. Dec. 31, 1968, ORNL.4400.
pp. 153-55.
compound decomposed at somewhat higher tempera- tures (<3OO0C) to MoF3 and a volatile product. Conclusions about decomposition were only tenuous because the Pyrex container was attacked by the fluorides. Since then two samples of MoF4 have been decomposed in copper containers under a dynamic vacuum of 25 p for 14 days at 265 and 352°C. In both cases the MoF4 decomposed to form MoF3 and volatile materials, but the reaction was incomplete. The thermal instability of MoF4 was further investigated using a time-of-flight mass spectrometer and a copper Knudsen cell over a temperature range of 225 to 750°C. The results are described below under mass spectroscopic studies of fluorides.
The solubility of MoF3 in molten 2LiF*BeFz was determined by investigating the phase equilibria along the join 2LiF*BeFz-MoF3. The results are shown in Fig. 11.5. The binary compound LiF*MoF3 was previously reportedz3924 along with its optical prop erties and x-ray diffraction pattern. A ternary invariant reaction,
liquid + LiF*MoF3 2LiF. BeF2 + MoF3 ,
was observed at 404 k 14°C. The large uncertainty in temperature was caused by difficulty in achieving subsolidus equilibria. This number will be refined by experiments now in progress. The invariant reaction
z3C. F. Weaver, H. A. Friedman, and D. N. Hess, Reactor Chem Div. Ann. hog . R q t . Dec. 31. 1967, ORNL4229,
24C. F. Weaver, H. A. Friedman, and D. N. Hess, MSR hogmm Semhn. Rogr. Rept. Feb. 29, 1968, ORNL4254,
pp. 33-37.
pp. 129-34.
ORNL-DWG 69-2825 500
475
- P 450 W
g 425
p 400 K W
1 375
tcIn --- 0 1 2 3 4 5 6 7 8 9 10
MoF3 (mole X)
Fig. 11.5. The Join 2LiF- BeFz-MoFs.

158
implies the existence of the compatibility triangle: 2LiF*BeF2-LiF*MoF3-MoF3.
Recent experiments in the binary system LiF-MoF3 have shown that the compound SLiF- ~ M o F ~ ~ ~ * ~ ~ has a lower limit of stability at >525"C, the decomposition reaction being SLiF- 2MoF3 * 3LiF + 2LiF. MoF3.
The studies' '-' * of the rate of removal of Mo" from molten 2LiF- BeF2 have continued. The most stable
ORNL-DWG 68-10744 20
16 - & a 1 1 : -
z 0 0
4
0 400 800 1200 1600 2000 2400 TIME (hr)
Fig. 11.6. Removal of Mo* from Molten 2LiF-BeF2.
2!
49
47
conditions encountered thus far are at 500OC; neither the flow rate of He nor H2 firing of the copper container strongly affected either the order or rate constant for the Mo* removal from the molten 2LiF. BeF2. The half-order rate constants associated with Figs. 11.6 and 11.7 are defined as K = r-1/2(Ci/2 - C'I2) and are 8.1 X ppm112 hr" and 7.3 X ppm1I2 hr-' respectively.
The composition of the gas associated with the disproportionation of MoF3 dissolved in molten 2LiF BeF2 has been determined by mass spectroscopy and is described below.
Studies of the rate of removal of Mow from more complex systems have just been initiated. It was found that the addition of 1-2 mole % of UF4 to 2LiF- BeF2 has no appreciable effect on the behavior of the molybdenum. The addition of UF3 to the system LiFBeF2-UF4-MoF3 in the concentration range near 5000 ppm of U* reduced the Mo* at least a thousand times faster than the disproportionation. However, concentrations of U* in the 100 ppm range and in excess of the Mo* concentration did not appear to reduce the molybdenum. Experiments are now under way to determine if this surprising result is an artifact
25C. F. Weaver and H. A. Friedman, MSR Program Semi- una Rogr. Rept. Aug. 31, 1967, ORNL.4191, pp. 142-44.
W
.
. .
S . ORNL-MNG 68-43594
0 200 400 600 800 4000 4200 4400 4600 4800 2000 2200 2400 2600 2800 TIME (hr)
Fig. 11.7. Removal of Mo3' from Molten 2LiF- BeF2.
. LJ

159
of our experimental procedure or evidence for the equilibrium 3UF3 + MoF3 * Mo + 3UF4.
11.4.2 Mass Spectrometric Studies of Fluorides
Mass spectrometric studies of pure MoF3 have shown' (Fig. 11.8, dashed lines) that the gas escaping from a Knudsen cell in the temperature range 500-700°C was predominantly MoF5 with lesser amounts of both MoF6 and MoF4 and that the ratio of MoF4 to MoF~ increased with temperature. Similar studies with LiF-BeF2-MoF3 (60-30-10 mole %) in the temperature range 500 to 800°C indicated (Fig. 11.8, solid lines) that the same three materials (MoF4, MoF~, and MoF6) were present but that the amount of MoF4 was markedly increased at the expense of both MoF~ and MoF6, that the ratio of MoF4 to MoF~ again increased with temperature, and that the MoF4 became the more dominant species at -590°C. The molyb-
"R. A. Strehlow and J. D. Redman, MSR Program Semi- ann. hog. Rept. Feb. 29, 1968, ORNL4254, pp. 134-36.
40 a 9
20
denum fluoride dimer previously observed over pure MoF3 was not observed with the LiF-BeF2-MoF3 mixture. Two groups of fragments with typical molyb- denum isotopic ratios were observed at 600°C having 228 and 130 amu (for 9 8 M ~ ) . Neither of these peaks was observed in previous studies involving molybdenum fluorides or oxyfluorides in the absence of molten 2LiF. BeFz . It is possible that they represent the trimer fragments 7LiF*98MoF3*BeFZ+ and
Li, ,Be+ Mo
Li' 'Be
In any event they were a minor portion (-%) of the effusing vapor. In addition, this study has shown that the molten 2LiF* BeFz solvent tends to stabilize Mo* and that copper is much superior to nickel as a container material. Both observations are consistent with ow experience in synthesis and solution kinetics.
A sample of freshly prepared MoF4 was completely sublimed in a copper Knudsen cell over the temperature range 225 to 750°C. The residue was found by x-ray
ORNL-DWG 68-t4448
* * MOF6 0 0 200 400 600
CELL TEMPERATURE (OC)
800 f000
Fig. 11.8. Vapor Composition over MoF3 in Molten 2LiF. BeFz Compared with Tbt over Pure MoF3.

/ 160
diffraction to be molybdenum metal. No gases were observed below 225°C. As has been observed with all previous molybdenum fluorides, the gaseous products were MoF4, MoFS, and MoFs, the relative concen- trations of which varied with temperature and with the particular condensed phases involved. The dominant vapor species above solid MoF4 at temperatures greater than 560°C W ~ S MoF4.
We plan to pursue this and similar studies with other systems employed in MSR technology, since at present mass spectrometry is the only approach which has provided definite information about the composition of the gas phase associated with MoN solutions. For this reason the following work with RuF3 and NbFS was done.
The sample of RuF3, prepared by D. E. LaValle, disproportionated in the Knudsen cell between 600 and 700°C forming ruthenium metal, identified by x-ray diffraction, and either RuF4 or RuFS. The total cell pressure at 650°C was estimated to be about lo4 torr. Ionization efficiency curves for the ion fragments at 650°C are shown in Fig. 11.9. The appearance poten- tials, obtained by the vanishing-cunent technique, are listed in Table 11.8. The RuF4 ' ion may be formed either by simple ionization of RuF4 or by dissociative ionization of RuFS. The latter method is characteristic of many metal halide systems:7 including those of molybdenum and niobium.
In Table 11.9 are cracking patterns of the vapor 6.' species as a function of temperature (600 to 700") for 75 ev electron energy and as a function of electron energy (18 to 75 ev) for 650°. Over the 100" temperature range, within which the metal fluoride completely effused, no significant change in the relative abundance of the ions was seen. The temperature
*
*
27K. F. Zmbov and J. L. Margrave, "Mass Spectrometric Studies of Scandium, Yttrium, Lanthanum, and Rare-Earth Fluorides," pp. 267-89 in Mass Spectrometry in Inorganic Chemistry, ed. by R. F. Could, ACS, Washington, D.C., 1968.
Table 11.8. Appearance Potentials for Ion Fragments from Vapor over RuF3 at 650°C
Appearance Ion Potential
(ev)"
RuF~+ 15.3
RuFJ' 15.9 RuF2' 18.5 Rup 22.0
Ru' 25.5 OArgon reference gas: Ar' at 15.75 ev.
8
ORNL-DWG 68-44449
F
b
44 46 48 20 22 24 26 28 30 3 2 34 ELECTRON VOLTS (eV1 (CORRECTED)
Fig. 11.9. Ionization Efficiency Curves for Vapor over RuF3.
. .

16 1
Table 11.9. Cracking Patterns for the Vapor over RuF3
Relative Abundance (75 ev) 600°C 650°C 700°C 18 ev 19 ev 25 ev 30 ev 40 ev 60 ev
Relative Abundance (650°C) Ion
R u F ~ + 19 25 17 100 72 44 31 23 31 R u F ~ + 100 100 100 80 100 100 100 100 100 R U F ~ + 32 39 33 26 32 47 RUF+ 18 23 24 12 14 26 Ru+ 31 44 39 15 16 41
stability of the effusing ruthenium fluoride indicates the presence of only one neutral precursor. At lower electron energies (less than 30 ev) the RuF3 + to RuF4 +
ratio decreased. This effect, as seen in the ionization efficiency curves for RuF3+ and RuF4+ of Fig. 11.9, could be expected for a parent ion, as it undergoes less fragmenting at lower electron energies. It appears, therefore, that RuF4 undergoes simple ionization, which is unusual, and that the disproportionation reaction is 4RuF3 + Ruo + 3RuF4.
A sample of NbFS, synthesized by L. M. Toth and H. A. Friedman, was sublimed in a Knudsen cell at 75°C leaving a residue, containing 1.6 wt % oxygen, which was not volatile at this temperature. The resi- due gave off NbOP3 in the temperature range 300-575°C and again above 700°C. The cell pres- sure at 75°C was estimated to be between and lo-' torr. The cracking patterns for NbF5 and NbOF3 at 75 ev are shown in Table 11.10. The ionization efficiency curves are given in Fig. 11.10. The appearance potentials obtained from these curves are listed in Table 11.10. Since the NbF5+ parent peak is absent, the NbFS must undergo dis- sociative ionization, typical of metal halides?' This suggests that the neutral precursors for the NbzF9+ and the Nb3F14' ions are the dimer NbzFIO and the trimer Nb3 F1 respectively.
The behavior of the Nb, Mo, and Ru fluorides studied thus far is strikingly different. The niobium forms at least two polymers, NbzFlo and Nb3F15; the molybdenum forms Moz F, ; while ruthenium gave no evidence of polymerization. The strong tend- ency to form oxyfluorides is shared by all these elements, but the relative volatilities differ. In the case of molybdenum the oxyfluorides are somewhat more volatile than the fluorides but not sufficiently so to provide an easy separation of the species. On the other hand both ruthenium and niobium form oxyfluorides which are much less volatile and allow complete separation of the fluorides. The probability
that the ruthenium fluorides undergo simple rather than dissociative ionization, discussed above, distin- guishes them from the molybdenum and niobium fluorides.
Table 11.10, Cracking Patterns for NbF5 at 75°C and NbOF3 at 800°C
Ion Appearance Potent@
(ev)
Relative Intensity
NbFS 0.3 1 .o 2.0 14.0 100 0.06 0.4 150
55.0 0.06 210
NbOF3 14.0 8 8 13 13 100
1 .o 50 <O.l
21.2 14.5
16.0
18.7
=Argon reference gas: Ar+ at 15.75 ev.

162
60
0 48 - .- c
E 5 36 c 5 24
z 0
0
In
I-
2
1
(2
0 16 18 20 22 24 26 28
ELECTRON VOLTS (OV) (CORRECTED)
Fig. 11.10. Ionization Effiamcy Curves for Vapa over NbFs.
In addition to the noble metal fusion product work, recent interest" in the use of aluminum ha- lides to form volatile complexes with actinide or rare-earth fluorides prompted a mass spectrometric study of vapor species over LiFBeF2-ThF4 (72-16-12 mole %) containing PrF3 and MF3. The barren fuel, spiked with 10 wt % PrF3 and 11 wt % AIF3, was loaded in a nickel Knudsen cell crucible. Vapor species effusing from the cell were monitored over the temperature range of 650 to 850°C. The total pressure inside the cell at 850°C was estimated to be near 0.2 p. The only volatile aluminum com- plexes observed were LiAlF4 and Li2AlFS (about 8:l). No fragments containing praseodymium or thorium were seen.
The lack of such fragments at the low pressures involved does not imply their absence at higher par- tial pressures of MF3. It has been amply demon-
strated with chloride^^^^' that higher total pres- sures (1 to 3 atm) produce significant partial pressures (10 to 100 torrs) of the volatile com- plexes. Even though AlF3 is much less volatile than AIC13, pressures a thousand times higher than those used above (0.2 p) are available below 1000°C. If interest warrants, these studies could be profitably pursued by distillation or transpiration experiments.
28C. F. Weaver to H. F. McDuffie, personal communi- cation, 1968; A. M. Weinberg to W. R. Grimes, pemonal communication, 1968; M. A. Bredig to W. R. Grimes, per- sonal communication, 1968.
29D. M. Quen and H. A. @ye, how. Nucl Chem Letfers
30D. M. Gruen and R. L. McBeth, Inurg. Nucl. G e m
"E. W. Dewing, Nafure 214,483 (1967).
3, 453-55 (1967).
Letters 4, 299-303 (1968).
s
S

bd c . 0 .
z
.
.
*
L
. bd
12. Physical Chemistry of Molten Salts
12.1 CeF3 SOLUBILITY IN MOLTEN MIXTURES OF LiF, BeF2, AND ThF4
C. J. Barton L. 0. Gilpatrick Judy A. Fredricksen'
Data on the solubility of CeF3 in five ternary LiFBeF2 -ThF4 mixtures and one LiF-ThF4 mixture were reported earlier? 9 3 Comparison of these data with the results of previous investigations of the solubility of CeF3 in LiFBeF2 melts4 and PuF3 in similar composi- t i o n ~ ~ pointed to the conclusion that the solubility of PuF3 in the ternary mixtures will probably be adequate to fuel a reactor based on PuF3 as the fissile agent.
We have extended this study by providing data on CeF3 solubility in three additional ternary solvent compositions and three LiF-ThF4 mixtures in order to determine the effect of solvent composition on CeF3 solubility (see the following section). The data ob- tained, together with calculated heats of solution, are shown in Table 12.1 along with the previously reported data (slightly revised for the composition containing
16.7 mole % ThF4 by a reexamination of the extrapo- lation of rather scattered data). The significance of the data in the last two columns of Table 12.1 is discussed in the following section.
As indicated in the 6OO0C column in Table 12.1, the liquidus temperatures of several solvent compositions listed here appear to be higher than given by the
'Summer participant, St. Cloud State College, St. Cloud, MiM. 'L. 0. Gilpatrick, C. J. Barton, and J. A. Fredricksen, MSR
Progmm Semiunn. Rogr. Rept. Aug. 31, 1968,0RNL4344, p. 161.
'J. A. Fredricksen, L. 0. Gilpatrick, and C. J. Barton, Solubility of Cerium Trijluoride in Molten Mixtures of LiF,
4W. T. Ward et d., Solubility Relations Among Rare-Earth Fluorides in Selected Molten Fluoride Solvents, ORNL-2749 (October 1959).
EeFz and ThF4,ORNL-TM-2335 (January 1969). \
'C . J. Barton,J. Phys. Chem. 64,306 (1960).
Table 12.1. Solubility and Heat of Solution of CeF3 in Mixtures of LiF, BeF2, and ThF4
CeF3 Solubility (mole %)
6OO0C '80OoC
Heat of Free (mole %) Solution ThF4/(ThF4 + BeF2) LiF
Salt Composition Mixture
No. LiF BeF2 ThF4 (caymole) (mole %)
1 72 16 12 1.6 5.5 11,600 0.428 +4 2 73 0 27 2.6 9.0 11,560 1.000 -7 3 72.7 4.8 22.5 2.4 7.9 11,100 0.824 -4 4 68 20 12 1.35 6.0 13,890 0.375 -8 5 72.3 11.0 16.7 2.1 7.0 11,200 0.603 0 6 67.8 25.2 7.0 1.05 5 .O 14,530 0.217 -4 7 58 30 12 1.1 5.3 14,640 0.286 -38
9 58.4 20.0 21.6 (1.75)" 6.6 12,350 0.519 -46 10 67 0 33 (2.6)" 8.4 10,900 1.000 -32
12 60 0' 40 (2.5)" 8.6 11,500 1 .ooo -60
8 75 17.9 7.1 1.5 6.6 13,800 0.284 +18
11 80 0 20 (3.1)" 10.9 11,700 1 .ooo +20
13 66.7 33.3 0 0.60 (3.7)b 17,500 0 0 14 72.7 27.3 0 0.95 (5.7)b 16,700 0 +18
aExtrapolated value, below liquidus temperature of the solvent. bExtrapolated from values at lower temperatures (see ref. 4).
163

164
published phase diagrams for the LiFBeF2 -ThF4 (ref. 6) and LiF-ThF4 systems.’ Observation of phase changes other than CeF3 solubility was beyond the scope of this investigation, but there were indications from cooling curves obtained during the course of the investigation that the relatively high solubility of CeF3 in the melts lowers significantly the crystallization temperature of the primary phase of the solvent composition.
12.2 CORRELATION OF CeF3 SOLUBILITY WITH SOLVENT COMPOSITION
M. A. Bredig C. J. Barton
Preliminary attempts’ to relate the solubility of CeF3 in LiFBeF2 -ThF4 mixtures to solvent composition gave unsatisfactory results. We have found the molar ratio of ThF4 to BeFz to be the dominant factor for the binary and ternary mixtures listed in Table 12.1, which includes two LiF-BeF2 solvents studied earlier! The smooth lines of Fig. 12.1 (where the compositions in Table 12.1 are identified by mixture number) show the nearly linear dependence of the solubility of CeF3, s = 100 X CeFs/(CeF’ + LiF + BeF2 + ThF4), on u = ThF4/(ThF4 + BeF2) in accordance with the equations
~(600°C) = 0.50 + 2.60~ - 0 . 4 0 ~ ~ ,
s(700OC) = 1.60 + 4 . 2 3 ~ - 0 . 8 8 ~ ~ ,
~(800°C) = 3.80 + 5 .80~ - 0.80~’ .
The only significant deviation among the ternary mixtures, As = + 0.30, +0.70, and 1.20 mole % CeF3 at 600, 700, and 800OC, respectively, occurred for solvent No. 8, LiFBeF2-ThF4 (75.0-17.9-7.1 mole %), with a “free LiF” content, b = LiF - 2BeF2 - 3ThF4, of 18 mole % LF. The significance of b as a secondary parameter is further demonstrated by the similarity of the As values listed above with As = +0.40, +0.80, and +1.70 mole % CeF3 at 600, 700, and 80O0C for the binary mixture No. 14, LiF-BeF2 (72.7-27.3 mole %), having the same “free LiF” content, b = 18.
The solubility of CeF, in LiF-ThF4 mixtures as a function of ThF4 content is shown in Fig. 12.2. Some of the CeF3 solubility data reported4 for LiF-BeF2 mixtures are included for comparison. The solubility of CeF, in LiF at 700 and 600°C was obtained from the
6R. E. Thoma etal., J. Phys. Chem 64,865 (1960). 7R. E. Thomaet al., J. Phys. Chem 63,1266 (1959).
LiFCeF’ phase diagrams by extrapolating below the Li eutectic temperature (755°C). The measurements in the range 20 to 33 mole % ThF4 show the solubility of CeF3 to increase with decreasing ThF4 content by 20 to 3O%, depending on the temperature. The solubility may be assumed to increase smoothly with increasing “free LiF” concentration along the broken lines of Fig. 12.2. At 800°C the CeF3 solubility appeared to be higher with 40 mole % ThF4 than with 33, but the difference is within the scatter of the data. The range of ThF4 concentrations that could be conveniently investi- gated was limited by high liquidus temperatures.
In LiF-BeF2 mixtures the CeF3 solubility goes through a distinct minimum at approximately 38 mole % BeF2, its value at 48 mole % being approximately 50% greater than the minimum value? *4
An attempt has been made to rationalize the observed dependence of the CeF3 solubility in LiF-BeF2-ThF4 mixtures on solvent composition. The dependence reflects the significance of the greater availability of F- ions for interaction with Ce* in melts richer in LiF. This was indicated by the considerable negative devia- tion from ideality in the LiFCeF3 phase diagram. Values, measured or extrapolated, for the CeF3 con- centrations of the CeF3 liquidus at 600 to 800” exceed those estimated from the known entropy of fusion of CeF3 [7.62 cal (“C)-’ mole-’ at the melting point of CeF3] by factors of 4 to 2 respectively. In LiF-BeF2 mixtures containing 25 to 50 mole % BeF2, the solubility is very much smaller than ideal. This positive deviation from ideality can be attributed to the much weaker interionic forces between the singly charged Li+ ions and the relatively large BeF42- anions(cf. also the low melting points) as compared with the forces between the triply charged Ce* and the relatively small F- ions. Although molten Li3ThF7 contains even larger complex anions, ThF73-, it exhibits a CeF3 solubility intermediate between that in LiF and Li2BeF4. This apparent anomaly is readily attributed to the fact that the Ce” ions, with a charge-to-size ratio, or “ionic potential,” z/r % 3, compete for F- ions much more successfully with The (z/r I 4) than with Be” (z/r %
Several ternary compositions have negative values of “free LiF,” but they do fit the correlation shown in the bottom part of Fig. 12.1. This may be explained by reference to Fig. 12.2, which shows very little change in CeF3 solubility in LiF-ThF4 mixtures in the range 25 to 40 mole % ThF4.
. . I
6)-
s
*
e
. s
.
‘C. J. Byton et aL. in Phase Diagrams of Nuclear Materials, R. E. Thoma, ed., ORNL-2548 (November 1959).
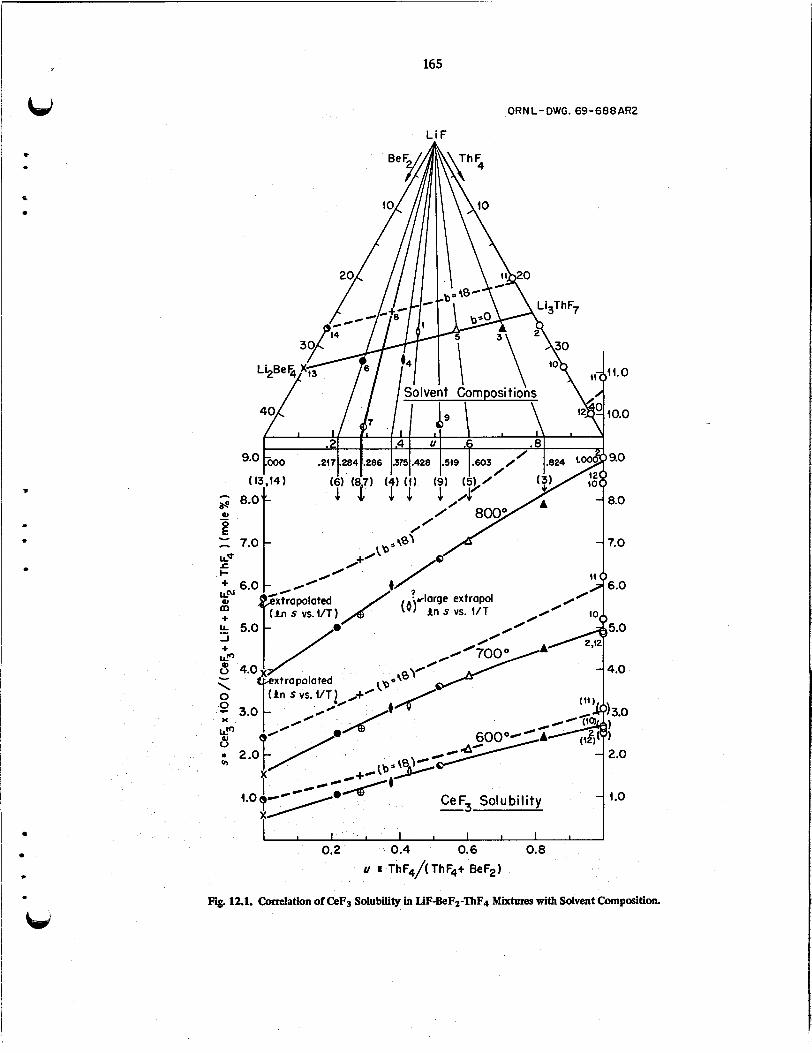
c . s
t
- t
*
165
ORNL-DWG. 69-688AR2
L iF
I I I I I I I I I I 1 0.2 0.4 0.6 0.8
u f ThF4/(ThF4t BeF2)
Fig. 12.1. Correlation of CeF3 Solubility in LiF-BeF2-ThF4 Mixtures with Solvent Composition.

166
Finally, we compare apparent heats of solution of CeF3, M(soln.) , in the various solvents (Table 12.1). Those given for LiF-BeF2 mixtures, approximately 17 kcal/mole, exceed considerably the heat of fusion of CeF3, M (fusion), which may be estimated from the value 13.4 kcal at the melting point as 10 to 12 kcal for temperatures of 600 to 80OoC. On the other hand, on substitution of ThF4 for BeF2 (Fig. 12.3) the heat of solution drops to the vicinity of the heat of fusion, that is, 11 kcal, in line with the considerations of the preceding paragraph on the smaller deviation from ideality.
ORNL-LWG 69-5505 22
20
48
- z m 44 - e z t2
8 %* 8
c =' :lo
0
6
4
2
0 0 4 8 42 (6 20 24 28 32 36 40
ThF4 OR BeF2 (mole %)
Fig. 12.2. Solubility of CeF3 in LiF-ThF4 Mixtures.
ORNL-DWG 69-279OA
The values shown in Fig. 12.3 for the heat of solution br of CeF3 in two LiFBeF2 mixtures are somewhat higher than those calculated for other LiFBeF2 solvents and are much greater than more recent values' for the heat of solution of NdF3 and SmF3 in LiF-BeF2 (66-34 mole %), 11.5 and 10.5 kcal/mole respectively. The shape of the curve in the low-ThF4 end of Fig. 12.3 is not firmly established, and this fact, coupled with the scatter of the points, indicates that only qualitative significance should be attached to the relationship between heat of solution and solvent composition in this system at the present time.
a *
. D
12.3 ZONE MELTING OF FLUORIDE SALTS
E. L. Compere Terry Dorsett' Zone melting and cyclic slow cooling tests have been
conducted on LiF-BeF2 -ThF4 mixtures (72-16-12 and 57-33-10 mole % with -0.3 and 0.025 mole % CeF3 added) to determine the separation of constituents, particularly thorium and cerium, that develops under several schemes of operation. The 72-16-12 salt is a base composition for MSBR single-region fuel. The 57-33-10 salt may represent about the maximum beryllium content that could be employed in a single-region MSBR fuel and in any event, in terms of phase behavior, is situated in a phase field different from the first composition. Cerium trifluoride was used to represent the rareearth group because it permitted straightforward chemical analysis at low concentration levels.
Two kinds of tests were conducted, zone melting and cyclic slow cooling. In all tests, nickel tubes 0.305 in. in inside diameter by 12 in. long were filled with the powdered salt and capped. After the melting cycles were completed, the salt was recovered from successive 1-in. sections and submitted for chemical analysis for all constituents. In the zone-melting experiments a heater with three 1.8-in. heating zones and two 1.8-in. cooling zones was passed along the tube at 1.5 cm/hr. Tempera- tures alternated between 650 and 35OoC. Experiments were conducted with downward, horizontal, and, in one case, upward moving zones. The upward zone move- ment resulted in cracking the tube after the first pass because of expansion of entrapped melt.
Horizontal zone-melting tests were checked with a level only in the case of tube 22. Data from several tests are shown in Table 12.2.
a . .
I
Fig. 12.3.. Heat of Solution of CeF3 in LiF-BeF4-ThF4 Mix- tures (600-80O0C). -.
~ ~~
9MSR Program Semiann h g r . Rept. Feb. 28,1967,ORNL.-
"Summer ORAU student participant from Maryville College, 4119, p. 144. . t
Maryville, Tenn. LIJ

167
6) Table 12.2. Composition of End Sections in Zone Melting and Cyclic Slow Cooling of LiF-BeF2-ThP4 Mixtures
* . Tube No. Operation Composition (mole %)
LiF BeF2 ThF4 CeF3 Section
16
10
23
22
20
14
11
17
Original composition, 72-16-12 mole % salt Six horizontal passes of three-zone heater
Four downward passes of three-zone heater
Original composition, 72-16-12 mole % salt + 0.07 wt % CeF3 Twelve slow 600-350°C cycles with vertical tube
Four horizontal passes of three-zone heater
One upward pass of three-zone heater
Original composition, 72-16-12 mole % salt + 1.0 wt % CeF3 Twelve slow 600-350°C cycles with vertical tube
Four horizontal passes of three-zone heater
Original composition, 57-33-10 mole % salt + 1.0 wt % CeF3 Twelve slow 600-350°C cycles with vertical tube
Entry Exit Bottom 3d 10th 12th (top)
Bottom TOP Entry Exit Entry (bottom) Exit (top)
Bottom TOP Entry Exit
Bottom 3d of 8 sections TOP
71.6 73.9 71.1 71.7 73.1 68.5 71.2
71.1
70.5 70.5 74.0 70.6 72.0 70.3
71.4
73.0 69.2 69.7 73.0
57.0
43.1 54.9 59.9
16.9 11.0 18.4 13.4 8.7
23.0 21.6
16.4
10.3 24.7 12.0 14.9 14.8 19.0
16.8
11.7 21.9 22.8 10.3
32.5
16.4 23.2 38.0
11.5 15.1 10.6 14.9 18.2 8.5 7.2
12.5
19.2 4.8
14.0 14.5 13.2 10.7
11.5
14.0 8.7 7.8
16.3
10.2
40.0 21.1
1.9
0.025
0.030 0.016 0.044 0.031 0.023 0.022
0.32
0.32 0.26 0.22 0.38
0.38
0.56 0.84 0.19
In cyclic slow cooling experiments, suggested by E. G. Bohlmann, the tube was positioned vertically in a furnace, heated to 600"C, and cooled to 350°C over a period of 1 hr. Twelve such cycles were made, and the tube was sectioned for analysis. Data from several tests are shown in Table 12.2.
12.3.1 Phase Behavior
The phase behavior of the LiF-BeF2 -ThF4 is given by Thoma in a published liquidus diagram' and in recent unpublished tie-line data. The composition LiF-BeF2 - ThF4 (72-16-12 mole %) lies in the phase field of the compound 3LiF*ThF4 (melting point 580°C) .
e and its solid solutions. This phase field, about 3 to 6 mole % wide, extends in a gentle curve from the region of the compound 3LiF.ThF4 toward a composition
.
. u "R. E. Thoma et& J. Phys. Chem 64,865 (1960).
finally at about 60-37-3, liquidus 433"C, with a halt at 444°C at 65-314. The tie-line data indicate that the first solid to form from our composition should be a 3LiF*ThF4 solid solution LiF-BeF2 -ThF4 (69-7-24 mole 5%) and that LiF begins to coprecipitate with solid solutions of about this composition, the melt tending toward a final composition of perhaps 67-28-5 '(or even 65-314). All our consistent data on the 72-16-12 original composition have remained within this phase field and between these limits and appear generally explicable on such a basis.
The original composition LiF-BeF2 -ThF4 (57-33-10 mole %, liquidus 500°C) falls within the phase field of the compound LiF. 2ThF4, which melts incongruently at about 940°C. The adjacent phase field is that of LiF*4ThF4, and melts should tend toward 63-31-6, 448OC, and then to 60-37-3 mole %.
The data of tube 17 suggest that the cyclic slow cooling process resulted in the precipitation of

168
LiF. 2ThF4, which settled to the bottom of the tube. This first precipitate never remelted entirely; tie-line diagrams and chemical analysis of samples imply a possible disproportionation yielding some LiF* 4ThF4, but additional material is not available for the definitive x-ray or petrographic analysis.
The final melt was about 60-38-2 mole % . Thus for the 57-33-10 mole % composition, the
observed data appear essentially consistent with pre- viously established phase diagrams.
12.3.2 Zone Melting
Five zone-melting experiments are summarized in Table 12.2, all based on the composition 72-16-12 mole %. The separations attained were modest and did not proceed beyond the phase limits discussed above. Compositions richest in thorium were generally found in the lower regions of the tubes with either upward or downward passes, suggesting sedimentation of heavy precipitates. Horizontal passes generally gave poor separation. Tube 11, which gave highest thorium concentration at the exit end, was indicated by sample volumes possibly to have been tilted slightly downward.
As will be discussed below, little separation of CeF3 was effected by zone melting.
12.3.3 Cyclic Slow Cooling
Cyclic slow cooling in a slender geometry generally resulted in appreciably higher concentrations of tho- rium being found nearest the bottom. This behavior is to be expected if precipitates are free to settle, because the phases richest in thorium are heavier and also melt highest and thus are formed first. It is also indicated that the resultant stratification may persist in favorable (tall) geometries.
Behavior is again in accord with known phase relationships.
12.3.4 Cerium
Cerium behavior is best examined with reference to the solubility study of Fredricksen, Gilpatrick, and Barton.'
This study shows that the solubility in our 72-16-12 compositions at the liquidus temperature of -5OOOC was over 0.5 mole %. However, as the melt approaches a fmal composition in the vicinity of 67-28-5, the
12J. A. Fredricksen, L. 0. Gilpatrick, and C . J. Barton, Solubility of Cerium lnftroride in Molten Mixtures of LiF, BeF2, und n F 4 , ORNL-TM-2335 (January 1969).
solubility is diminished. The final liquidus temperature L j is also lower (-450°C) for this composition, so that the final solubility would appear to be about 0.18 mole %. Tubes 11 and 14 appear to fall within this category of loss of cerium, as solubility and the decreasing amount of melt phase caused coprecipitation to occur.
The final melt from our 57-33-10 mole % mixture was not much different, and a comparable final cerium solubility would be expected. Similar but more pro- nounced coprecipitation is evident. The maximum amount of CeF3 occurring in this case is somewhat up from the bottom, probably because the precipitated thorium compounds did not remelt, as discussed above.
The zone-melting behavior of cerium trifluoride is shown by tubes 20, 22, and 23, where solubility limits were not exceeded. Because the cerium did not con- centrate in the melt but, if anything, appeared to follow thorium, it is possible that it was contained in the solid solutions based on 3LiF*ThF4.
In any event no effective separation of thorium from rare earths is shown by these experiments.
. -
12.4 BEHAVIOR OF CeF3 IN THE FRACTIONAL CRYSTALLIZATION OF
ThF4 FROM LiF-BeF2 -ThF4 MELTS
C. J. Barton
Because of difficulty experienced in separating rare earths from thorium-rich single-fluid fluoride fuel com- positions, the possibility of removing a fraction of the thorium by fractional crystallization was examined. It is necessary, of course, that the rare-earth fluorides remain in the liquid when the thorium is removed. In the experiments reported here CeF3 was used to typify the rare earths. Compere and Dorsett have also reported crystallization data for the system LiFBeF2- ThF4CeF3 (see Sect. 12.3), but the CeF3 concentra- tions used in those studies, 0.03 and 0.3 mole %, were considerably higher than in present investigations, 100 ppm CeF3 by weight = 0.003 mole %, which is presumed to be realistic for breeder reactors.
Examination of the LiF-BeF2 -ThF4 phase diagrams' led to the choice of the composition LiF-BeF2-ThF4 (58-30-12 mole %) for the first study. The phase diagram indicates that the primary phase for the composition is LiF. 2ThF4 and that secondary crystal- lization does not occur until the concentration of ThF4 in the melt is rather low.
The apparatus and sampling technique used in this study were essentially identical to those used in CeF3
"R. E. Thoma et d. J. Phys. Chem 64,865 (1960).
*
.
. (hi

u t
.
*
.
.
I
t
W
solubility studies.l4 Because of the low cerium con- centration, sole reliance on this determination was placed on the radiochemical te~hnique.'~ The melt was prepared by mixing 197 g of prepurified LiF-BeFz (66-34 mole %),250 g of ThF4 ,45 mg of CeF3, and 0.5 mc of 44Ce. The melt was treated with mixed Hz and HF at 720°C for 45 min followed by hydrogen alone. Filtered samples of the liquid were removed, the apparatus was cooled below the liquidus temperature, another filtered sample was taken, and the process was repeated at still lower temperatures. Three series of samples were obtained on different days, starting above the liquidus temperature each time, and the samples were analyzed by Analytical Chemistry Division per- sonnel for lithium, beryllium, and thorium and by the writer for cerium. The results are displayed in Table 12.3.
The data show that 565°C is below the liquidus temperature, whereas the published phase diagram indicates an approximate liquidus temperature of 525°C. A filtered sample taken at 650°C was used for gradient studies (L. 0. Gilpatrick and H. Insley) that showed LiF-2ThF4 crystallizing at 576 * 3°C and LiF*ThF4 at 489" or higher. Since the data show that CeF3 begins to disappear from the melt in the temperature range 520 to 49OoC, it seems likely that its
14J. A. Fredridcsen, L. 0. Gilpatrick, and C. J. Barton, Solubility of Cerium Trifluoride in Molter2 Mixtures of LiF, BeFz. and ThF4,ORNL-TM-2335 (January 1969).
169
removal can be attributed to association with LiF ThF4 crystals. The above-mentioned quenching study also shows that secondary crystallization oc- curred at a higher temperature than predicted by the phase diagram.'
The data in Table 12.3 show that it is possible to remove about half the ThF4 from the composition LiF-BeFz-ThF4 (60-28-12 mole %, average of four analyses) by fractional crystallization and that removal of more than 7% of the ThF4 is possible with some loss of CeF3 from the melt. Only qualitative signifi- cance can be attached to the CeF3 losses because of the scatter in the data, which may indicate that equilibrium between dissolved CeF3 and solid LiF*ThF4 was not achieved. It is not apparent from study of the LiFBeFz-ThF4 phase diagram or of Compere and Dorsett's data whether any other composition of pqctical interest for use in molten-salt breeder reactors will give better performance in regard to ThF4- rareearth separation than the one used in this investi- gation.
12.5 PROPERTIES OF THE ALKALI FLUOROBORATES
C. J. Barton L. 0. Gilpatrick H. Insley
12.5.1 Phase Relations in Fluoroborate Systems
Phase diagrams in the ternary and binary systems that include the components NaF-KFBF3 have continued
Table 12.3. Analysis of Filtered Samples of LiF-BeFz-ThFe
Sample Sample Composition CeF3 Series Temperature (mole %) Concentration
<"C> LiF BeF9 ThFa (PPd No.
1 1 1 1 2 2 2 2 3 3 3 3 3
~
720 59.6 28.3 12.1 720 59.3 29.6 11.1 530 63.2 31.5 5.3 490 62.7 33.3 4 .O 640 61.1 27.0 11.9 555 62.0 30.5 7.5 517 61.9 31.3 6.8 460 64.0 32.7 3.3 650 60.2 27.0 12.8 565 63.2 27.9 8.9 5 20 64 .O 29.6 6.4 487 64.6 30.4 5 .o 455 65 .O 31.6 3.4
100 100 lo@ 55 100 low lo@ 68 100 1000 1000 83' 29
aCerium-144 count per milligram of sample higher than that of the original melt because of the lower thorium content (less internal absorption of the soft 144Ce gamma radiation).

170
to be of interest because of possible use of mixtures of these materials as coolant salts for molten-salt reactors. Additional data have been collected covering regions previously bypassed, and some regions were reexamined using betterquality NaBF4 than was available at the beginning of the study. Efforts were made to prepare pure hydroxyfluoroborate compounds.
12.5.2 The System NaF-KF-BF3
Gradient quench analysis and differential thermal analysis (DTA) were used to examine 15 new compo- sitions near the expected minimum liquidus tempera- ture for the ternary system; the data are listed in Table 12.4. Uncertainties for the quench and DTA data are about *3 and *l0C respectively. It was previously reported that a minimum solidus temperature of 360°C
52.P 49.5 50.5 48 49 50 47 48 46 47 45 46 45 44 43 40
0 47.8 1.5 49 1.5 48 3 49 3 48 3 47 4 49 4 48 5 49 5 48 6 49 6 48 7 48 8 48 8.5 48.5 11 49
Eutectic
NaF ss
NaF ss ss ss NaF ss ss NaF NaF NaF + SS ss
ss" 384
383 379 376 385 379
381 388 383 385 388 392 406
385 392 392 377
(382 416 376 381 382 382 383 382 399 390 388 398
k 5" existed,'5 but we have been unable to locate a 6) composition with a liquidus temperature below 376°C. Liquidus and solidus are separated by a two-phase region (primary phase and liquid) in a temperature range equal to or greater than 11°C in all compositions near the minimum that have been examined to date. We are continuing the search for the minimum melting composition in t h i s part of the ternary system that theoretically should exist with a very small separation between liquidus and solidus temperatures.
Four compositions were examined by the gradient quench technique with the purpose of better defining the minimum liquidus temperature in the part of the ternary system bounded by the compounds NaF-KF- KBF4. The data shown in Table 12.5 indicate that the ternary eutectic is at a lower NaF composition than was reported previously'6 (-6 mole %) and must contain less than 3 mole 7% NaF. Presently available data show that the three solid phases in equilibrium at the ternary eutectic composition are NaF, KF, and NaBF4-KBF4 solid solution with a melting point of 458"C, 18°C higher than that reported previously.'6 The eutectic temperature reported earlier as 455" for the limiting binary KBF4-KF was revised upward to 460"." The limits of accuracy for the gradient quench temperature are of the same order as the temperature difference, +3"C. Additional work is needed to determine the exact composition of the ternary eutectic.
. *
.
Table 12.4. DTA and Quench Data for the System NnF-KF-BF3
Liquidus Composition (mole %) &ary Temperature NaF KF. BF3 Phase ("c,
DTA Ouench
~~
"Data taken from the binary system NaF-NaBF4 at the
"SS = NaBF4-KBF4 solid solution. eutectic composition where liquidus and solidus coincide.
12.53 The System KF-KBF4
The phase diagram for the system KF-KBF4 reported earlier' * was based on data for mixtures containing 50 to 95 mole % KBF4. Four additional compositions were
"Reactor Chem Div. Ann. Rogr. Rept. Dec. 31. 1968.
I6MSR Rogmm Semiann. Prop. Rept. Feb. 29, 1968,
"L. 0. Gilpatrick, H. Insley, and C. J. Barton, Reactor
"MSR Rogram Seminnn. bog . Rept. Aug. 31. 1967,
ORNL-4400, in preparation.
ORNL-4257, p. 167.
Chem Div. Ann. Rogr. Rept. Dec. 31,1968,ORNL-4400.
ORNL-4191, pp. 158-59.
Table 12.5. Quench Data for the System NaF-KF-BF3
I
Composition (mole %) Temperature Primary Temperature Secondary Temperature Eutectic NaF KF BF3 ("0 Phases ("0 Phases ("(2) Phases
9
c
7 63 30 621 KF 610 KF + NaF 458 KF + NaF + SS 3 61 36 538 KF + NaF 538 KF + NaF 45 7 KF + NaF + SS
458 KF+NaF+SS 3 57 3 52 45 554 NaF 485 NaF + SS 458 KF + NaF + SS
40 511 NaF 485 KF + NaF

cd t
. .
examined in the high-KF composition range of this system. Liquidus temperatures were measured by DTA and gradient quench methods. Results were in agree- ment with the partial phase diagram presented earlier, and we still find no evidence of the KF*KBF4 and KF. 2KBF4 compounds reported by Pawlenko.' Ex- perimental temperatures determined by DTA were from 17 to 36" higher than those determined by the quench technique. We .believe the DTA data to be the more reliable, since they represent in each case the results of measurements made during several thermal cycles. Data are shown in Table 12.6.
12.5.4 The System NaBF4-KBF4 Compositions containing 80, 85, 90, 95 mole %
NaBF4 were examined by the gradient quench tech- nique. The data for these compositions made from high-purity materials confirm the DTA results which were reported earlier:' showing a minimum liquidus temperature of 396 f 2°C at a composition of approximately 90 mole 7% NaBF4 in this solid-solution system. We usually find agreement of this sort for invariant temperature determinations, in contrast to differences in liquidus measurements mentioned in the previous section.
12.5.5 The System NaF-NaBF4 New compositions were made from the better NaBF4
now available to improve the data for th is two- component system, which was the first to be studied. DTA was used to measure the liquidus temperatures given in Table 12.7. Results indicate an increase of about 10°C in the liquidus boundary temperature in the region of 30 mole $6 NaBF4, where the deviation from the previously reported diagram' tj is greatest.
12.6 LIMITS OF MISCIBILITY IN MOLTENSALT SYSTEMS: KBF4-LiF,
Liz BeF4 -KI, AND Liz BeF4 -KBF4
A. S. Dworkin M. A. Bredig
12.6.1 The System KBF4-LiF
The NaF liquidus in the phase diagram of the reciprocal salt system NaF-KBF4, containing cations and anions all of unit charge but of widely differing
19S. Pawlenko, 2. Anwg. Allgem. Chem. 336,172 (1965). "MSR Progmm Semiann h ~ . Rept. Aug. 31, 1968,
21 hl. A. Bredig, MSR Progmm Semiann. h g r . Rept. Feb. 29, ORNL-4344 p. 156.
1968,ORNL-4254, pp. 167-68.
17 1
sizes, has been interpreted in terms of a large positive deviation from ideality? I t was then predicted and has now been confirmed that replacement of NaF by LiF brings about separation into two liquids. In this system the more stable ion pairing is: [Li+ (charge-radius ratio z/r = 1.7), F- (=0.75)] and [K' ( ~ 0 . 7 9 , (BF4)- (=0.40)].
At 840°C the miscibility of molten LiF and KBF4 is indeed small, the two conjugate monotectic liquids containing 3 and 9% LiF in equilibrium with solid LiF (Fig. 12.4). The observed slight variance of the mono-
Table 126. DTA and Quench Data for the System KF-KBF4
Composition Liquidus
Phase (mole %) Primary Temperature ("C)
KF KBF4 DTA Quench
60 40 KF 715 679 66.7 33.3 KF 745 713 75 25 KF 778 748 90 10 KF 828 811
Table 12.7. DTA Data for the System NaF-NaBF4
Composition Temperatures ("C f 2") (mole %) - Liquidus Solidus Crystal Transition
17.9 82.1 538 37.0 62.9 736 56.7 43.3 858 77.7 22.3 937 384 247
ORNL-OWG 68-44191A
I I
400 -~ 0 20 40 60 80 4 0 0
Li F mole % KEF4 KEF4
Fig. 12.4. The System LiF-KBF4.

tectic temperature with composition may be caused by the formation of some KF through dissociation of KBF4. The eutectic point lies at 564OC and about 0.5% LiF. No attempt was made to determine the predictably high temperature of complete miscibility because of the large BF3 dissociation pressure involved.
12.6.2 The System Liz BeF4-KI
The system contains as the more stable ion pairs [Li' (z/r = 1.9, (BeF4)'- (=0.8)] and [IC' (=0.75), I- (=0.45)]. We have been able roughly to delineate the region of two conjugate liquids as well as the eutectic and monotectic equilibria (Fig. 12.5). At a critical solution (consolute) temperature of 945OC (above which only one liquid phase exists) the critical solution contains 53% KI. At 665OC the two conjugate mono- tectic liquidus contain 7 and 98% KI in equilibrium with solid KI. The observed large variance of the monotectic temperature, a decline with decreasing KI concentration, may be caused by the presence of excess BeFz in the Li2BeF4 sample used (LiF-BeF2, 66-34 mole %). However, it must also be recognized that the system is a reciprocal pseudobinary one and that even
ORNL- DWG 68-4449OA too0
900
800 - 0
W a 3 5 700 a n
-
W
5 I-
600
500
400 0 20 40 60 80 4 0 0
Liz Be$ mole 70 KI K I
Fig. 12.5. The System Li2Bep4-KI.
172
without excess BeFz the compositions of the two liquid phases are likely to be more complicated than shown in Fig. 12.5. The eutectic point lies at about 450' and 4 mole % KI. Large supercooling effects and our observa- tion of what may be a metastable phase of the Li2BeF4 with added KI made the establishment of the eutectic approximate at best.
12.6.3 The System Liz BeF4-KBF4
The more stable ion pairs are: [Li+ (z/r 1.9, (BeF4)'- (=0.8)] and [IC' (=0.75), (BF4)- (=0.4)]. With the similarity in z/r for BF4 - and I-, the eutectic and monotectic equilibria in the system were expected, and found, to be very similar to those reported above for the Li2BeF4-KI system. At 554°C the two con- jugate monotectic liquids contain about 5 and 98% KBF4 in equilibrium with solid KBF,. The eutectic point lies at about 450" and 4 mole % KBF4. Because of expected high BF3 gas pressure, no attempt was made to determine the consolute temperature, but it is probably close to that found in the LiZBeF4-KI system. The difficulties described above in establishing the monotectic and eutectic equilibria for the LizBeF4-KI system were again encountered in almost identical fashion for the Liz BeF4 -KBF4 system.
The much greater miscibility in the LizBeF4-NaBF4 system indicated from the liquid-liquid distribution studies of Bamberger et aLZz is due to the smaller size of the sodium ion. Further delineation of the entire two-liquid region may be desirable, possibly by the technique of thermal analysis. In the present study it was the only method thus far employed by us. More detailed knowledge may be gained by the use of additional techniques such as sampling at temperature or quenching with subsequent analysis of the separated phases (high-temperature centrifuge?). More studies of simpler systems such as LiF-KI, LiF-KBr, LiFCsC1, etc., may also be desirable to further our basic, quantitative understanding of the phenomenon of liquid-phase separation in molten-salt systems.
12.7 SOLUBILITY OF THORIUM METAL IN
FLUORIDE MIXTURES MOLTEN LITHIUM FLUORIDE-THORIUM
H. R. Bronstein M. A. Bredig
With an improved analytical technique (R. Apple, Analytical Chemistry Division) involving the mass-
%. E. Bamberger et d., MSR Program Semiann Rogr. Rept. Feb. 29,1968,0RNL-4254, pp. 171-73.
. . 8
?
a
.
. *

173
I * I . I i - .
' 8
c
u i
spectroscopic determination of hydrogen produced on dissolution in aqueous acid, the apparent solubility of thorium metal in molten LiF-ThF4 (73-27 mole %) at 62OoC has been firmly established as 0.1 mole %. The particular form in which the thorium metal dissolves in the melt is as yet undetermined. Russian workers, using electrochemical techniques: 3- claim to have demonstrated the presence of ionic species of lower valency when the metals beryllium, zirconium, and thorium are equilibrated with alkali halide melts containing the normal chlorides of those metals.
If on dissolving in the LiF-ThF4 melt the thorium metal forms an ion of lower valency, Th(4-n)+, an inert metal electrode such as tantalum should assume the same potential in that melt as a thorium metal electrode, because the potential-determining process occurring at each electrode is the same,
Th(4-")+ Th4+ + ne- . (1)
However, a dissolution mechanism other than the formation of a thorium species of lower valency might conceivably also yield a zero potential difference. This is the reaction
Tho + 4LiF ThF4 + 4(Li+ + e-) , (2)
where the electron may be considered to have F-, or color-, center-like properties. At equilibrium the poten- tial developed will be the same for the thorium electrode and for an inert metal electrode,
RTln aLiF -- a(Li+-e-) -
In two experiments the potential developed initially between a thorium electrode and a tantalum electrode
23M. V. Smirnov and L. E. Ivanovskii, Zh. Fiz. Khim 31 802 (1957).
24M. V. Smirnov and V. A. Chernezov, DokL Adad Nauk SSSR 120,122 (1958). "M. V. Smirnov and N. Ya. Chukruv, Russ. J. Znorg. G e m
4,1168 (1959). "N. I. Kornilov and N. G. Ilyushchenko, Electrochem
Molten Solid Electrolytes 5,71(1967). 27V. Ya. Kudyakov et d, At . Energ. (USSR) 24, 448
(1969). "M. V. Smimw and L. D. Yushina, Izv. Akad NuukSSSR,
Otd. Khim Nuuk, No. 2, 1285 (1956) and No. 2, 251 (1959). See, however, R. Srinivasan and S. N. Flengas, Can J. Chem 42,1315 (1964).
placed in an LiF-ThF4 (73-27 mole %) melt at 62OoC was 950 mv. This potential remained constant for approximately 20 min, and then a slow downward drift commenced, terminating after 8 hr in a potential difference of essentially zero. The second solution model does not seem to afford a very satisfactory explanation of the zero potential, since available ther- modynamic data for reaction (2) above (AG; = 4 3 5 and -126 kcal/mole ThF4 and LiF, respectively, at 60OoC) would predict a quantity of color centers two orders of magnitude smaller than that found analyti- cally (4 X 0.1 mole % "Th metal"; cf. above). The assumption that a thorium species of lower valency exists seems, at present, to provide a better tentative explanation of the results obtained, even though attempts to confirm this conclusion with spectroscopic techniques (J. P. Young, Analytical Chemistry Division) have not yet proved to be successful.
12.8 THE CRYSTAL STRUCTURE OF KBF4
G. D. Brunton
Although the low-temperature polymorph of KBF4 has always been considered to be isostructural with KC104 and BaS04, the structure has never been adequately determined, and the lattice parameters which were published were incorrect? 930 The struc- ture has been completely determined from three- dimensional x-ray data as a part of an extensive study of complex fluoride compounds, and precise values for the lattice parameters were determined.
The low-temperature polymorph of KBF4 crystallizes with the orthorhombic space group P n m and with lattice parameters a. = 8.6588(5). bo = 5.4800(4), and co = 7.0299(8) A. The calculated density is 2.5067 glcc. The structure is shown in Fig. 12.6.
In the low-temperature form of KBF4 the K+ ion is coordinated by eight F- ions at.distances less than 3.0 A and by more F' ions at 3.075 A. The IC+ polyhedron shares edges with three and corners with four BF4 tetrahedra. The BF4 tetrahedra are slightly irregular, with tetrahedral angles of 108.5 to 111.4O and B-F distances 1.378 to 1.391 A. The B-F distances are almost equal to the 3-F distances for NaBF4 (1.386 and 1.392 f 0.002 A) found from a refinement3' of the
29B. Pesce, Cazz. Chim. Ztd. 60,936 (1930). ''A. Bdanca and F. Sgarlata, Rend Soc. Mined. Ital. 7,42
31G. Brunton,Acta Gyst. B24,1703 (1968). (1951).

174
ORNL- DWG 69-4306
Fig. 12.6. Structure of the Orthorhombic Low Temperature. from Percent KBF4.
NaBF4 structure proposed by Weiss and Zohner." A calculated B-F single-bond distance is 1.37 A?3
12.9 DENSITIES OF MOLTEN SALTS Stanley Cantor
A dilatometric apparatus, previously described: is being used to measure densities of molten salts. Since the last report34 the accuracy of the measurements has improved, primarily by minimizing the volume occu- pied by bubbles below the surface of the melt. Apparent bubble volumes as high as 0.8% have been estimated from measurements of melt volume vs pres- sure. For melts which do not wet the nickel contain- ment vessels, the apparent bubble volume comprises 0.3 to 0.8% of the melt volume; for melts which wet (e.g., NaN03 and KN03), the apparent bubble volume is 0.1% or less.
Three steps are now taken to reduce bubble volume: (1) evacuation of the solid salt for at least 16 hr, (2) evacuation of the apparatus just above the liquidus temperature of the salt (this procedure is not applied to volatile melts such as fluoroborates), and (3) main- tenance of an inert-gas pressure of about 70 p ig during measurements. By these three procedures apparent bubble volumes are reduced to less than 0.1%.
"A. Weiss and K. Zohner, Phys. Status Solidi 21, 257
'jL. Pauling, Nature of the Chemical Bond, 3d ed., p. 318,
34S. Cantor and J. A. Bornmann, MSR Program Semiann
(1967).
Cornell University Press, Ithaca, N.Y., 1960.
Rogr. Rept. Aug. 31,1968,ORNL4344, pp. 159-60.
L:
b
The reliability of the dilatometric apparatus has been assessed by determining the densities of NaN03 and KNOB. Both salts have been measured extensively by the buoyancy method. For our density measurements of NaN03, in the range 313 to 425"C, the results are given by the equation p (glcmj) = 2.131 - 7.08 X 10-t ("C); the standard deviation inp is 0.001 glcm3. These densities are 0.4 to 0.5% greater than those compiled by Jam? Densities of KNOB were measured in the temperature range 346 to 612°C; the equation representing the results is p = 2.136 - 7.62 X 10⁴t. Our densities are 0.1 to 0.3% greater than those measured by Bloom et aL3 Thus the measurements of NaN03 and KNOB indicate that the dilatometric technique is providing densities that are accurate to within 0.5%.
Five other melts have been measured. The results are summarized in Table 12.8. The first salt, NaE3F4-NaF (92-8 mole %), is a possible coolant for molten-salt reactors. Densities of this melt were previously meas-
over a shorter temperature range. The densities given in Table 12.8 are believed to be more reliable and are approximately 0.27% less than the earlier results.
The second salt mixture is very similar in chemical composition to the present MSRE fuel salt. The experimental densities are within 1% of the densities calculated from additive molar volumes? ' for example, . 35G. J. Jam, Molten Salts Handbook, p. 42, Academic, New
36H. Bloom et aL, Dan& Fara&y Soc. 49,1458 (1953). "S. Cantor, Reactor Chern Div. Ann. Rogr. Rept., Dec. 31,
York, 1967. . s
t: 1965, ORNL-3913, pp. 27-29.
a . .

175
12.8. Density of Molten Salts
Salt Composition Temperature Range Density-Temperature Equation (mole %) Measured ("0 (P, g/cm3; t , "0
92.0 NaBF4 8.0 NaF 64.79 LiF 29.96 BeF2 4.99 ZrF4 0.26 UF4 66.0 LiF p = 2.280 - 4.88 X lo* t 34.0 BeF2 Standard error in p = 0.000462 NaBF4 410.9-544.6 p = 2.304 - 8.42 X lo4 t
Standard error in p = 0.0027 KEF4 577.7-673.6 p = 2.178 - 7.65 X lo4 t
Standard error in p = 0.0096
399.5-590.8 p = 2.252 - 7.11 X lo4 t Standard error in p = 0.0018 p = 2.553 - 5.62 X lo4 t Standard error in p = 0.001 7
524.3-761.1
514.5-820.3
at 60O0C the calculated density is 2.198 g/cm3 ; the experimental density is 2.216 g/cm3.
The third mixture listed is the composition of the MSRE coolant. The measured densities are approxi- mately 1% greater than those predicted from additive molar volumes? '
The fourth and fifth salts in Table 12.8 are single- component melts. The results listed were obtained before we established suitable methods for reducing bubble volume. More refined measurements of these salts will be made. For the present the densities given may be considered accurate to within 2%.
12.10 SPECTROSCOPY OF FLUORIDE MEDIA
L. M. Toth G. P. Smith
The establishment of a molten-fluoride visible- ultraviolet absorption spectroscopy program has been essentially completed. I t includes the development of the diamond-windowed spectrophotometric cell?' which is unreactive to molten fluorides, and the production of fluoride solvents and solutes of the punty required for spectroscopy.
12.1 0.1 The Diamond-Windowed Cell
Operating experience with the diamond-windowed cell has been acquired during t h i s period. With the production of pure solutions (described in the next section), it has been possible to use the automatic
c
38L. M. Toth, J. P. Young, and G. P. Smith, MSR Rogram Semiann. Rogr. Rept. Aug. 31,1968,ORNL-4344, p. 168.
data-handling systems presently available on commer- cial spectrometers.
In particular, we are now able to record spectra on paper tape and either combine them with others or subtract components from composite spectra through the use of the computer. It represents an improvement in molten-fluoride data handling, both with respect to speed and quality of output, which has never before been available.
Continuous usage of the diamonds during the past seven months with a wide variety of molten fluorides has caused some wear on the diamonds. Examination under a microscope reveals a slight etch on one face of one window. It is not known why the wear has been confined to only one surface. Possible causes of e t c h g can be associated with either the reactivity of the fluoride solutions or oxygen contaminants in the helium cover gas surrounding the diamond cell. This wear on the diamonds has not detracted from their usage as molten fluoride windows because it is too slight to be detected by the spectrometer. I t is possible, however, that the diamonds will have to be repolished on an annual basis to remove any accumulated damage.
12.10.2 Salt Purification for Fluoride Spectroscopy
L. M. Toth G. P. Smith
Although the production of pure fluoride salts may be viewed as a trivial task for the experienced molten- salt personnel, there is little information on record concerning details of technique or quality of product. It is anticipated that this section might be of use to others who may need salts of the quality described here.

176
Table 12.9. Purity of ZrF4, NbFS, and LiF SingIe Crystals
Purification Process Product Evaluation
i
i ~
~
i ! ~
I i ! i i .
i
i i
KBrF4 Oxide Analysis (ppm) General Salt Temperature Process
(“0 Time Method
ZrF4 Two sublimations 590-600 3 days each TSC 0.258 70 NbF5 Sublimation 100 5 days Tsc 0.50 0 0 LiF HF sparging 900 1lU TSC 0 0
OTSC 0.25 g: “transparent single crystals’’ followed by average weight of single crystals
Melts which are both low in oxide content and free of suspended matter are a prerequisite for spectroscopy of dilute species in fluoride solvents. Even small amounts of solutes which react with the soluble oxides and leave solution cause problems either by remaining suspended and scattering light or by precipitating and collecting on the windows of the cell.
The salts are best purified as individual components instead of as the mixed salts. We use the customary approach of subliming volatile fluorides and HF sparging molten nonvolatile fluorides with gaseous HF.
I t is usually the practice to sublime volatile fluorides at temperatures where the vapor pressure of the salt is 10 to 100 torrs. These pressures in a system with background pressures of the same magnitude result in sublimation rates yielding approximately 100 g of “purified” salt per day (see, for example, ref. 39). These high sublimation rates cause entrainment of impurities which baffle plates are only partially effec- tive in removing.
We have found that low sublimation rates produced by salt pressures of <0.1 torr in a background pressure of to lo-’ torr eliminate the need of baffles and yield much better results. For some very impure salts it has been necessary to sublime a second time (as in the case of ZrF4). At these low sublimation rates we have been able to produce up to 50 g of salt in two to three
The results on some of these fluoride salts are listed in days.
Table 12.9.
12.1 I THE DISTRIBUTION OF v’ BETWEEN MOLTEN LiF-BeF2-ThF4-UF4 AND
A (U-Th)02 SOLID SOLUTION
C. E. Bamberger C. F. Baes, Jr. A. L. Johnson
We have previously reported studies4’ *4 of the distribution of v’ between a molten fluoride phase and a (U-Th)02 solid-solution phase by the ion ex- change reaction
(1) u4+(F) + Th&(O) u4“(0) + ,
for which we may write the quotient
x U 0 2 XThF4
xTh02 xUFq Q =
The results obtained indicate that in the stirred vessel used at a stirring rate of 150 rpm and a fluoride to oxide phase ratio >1:1 (on a weight basis), several hundred hours were required for equilibrium at 680°C.
In continuing these measurements, we have improved the seal in the stirred vesselp’ and this has permitted an increase in the stirring rate from 150 to 500 rpm. With this more rapid stirring and an increased ratio of fluoride phase to oxide phase (4:1), exchange equi- librium has been attained in periods less than 70 hr when the oxide phase was <0.8 mole fraction U02. This was true whether the previously equilibrated system had been disturbed by the addition of U02, Tho2, or UF4, or just by a change of temperature (Fig. 12.7). The path followed by the UF4 concentration of the fluoride phase was unexpectedly complex when U02 or Thoz was added, showing both a maximum above and a minimum below the final equilibrium value. Considerably more information is needed con- cerning the effects of a number of variables - such as the stirring rate, the quantities of each phase, and the amounts of material to be exchanged - before the rate of approach to equilibrium can be predicted or perhaps significantly increased. However, it seems clear from the
39L. B. Yeatts, Jr., and W. T. Rainey,‘Jr., Reactor Chem Div.
40B. F. Hitch, C. E. Bamberger, and C. F. Baes, Jr., Reactor
41C. E. Bamberger and C. F. Baeh Jr., MSR Rograrn
42C. E. Bamberger et al., Reactor Chem Diu. Ann. Row.
Ann. hog . Rept. Jan. 31.1965,ORNG3789, p. 330.
G e m . Diu. Ann. Rogr. Rept. Dec. 1966. ORNL-4076, p. 18.
Semiann. Rogr. Rept. Aug. 31,1968,0RNL-4344, p. 171.
Rept. Dec. 31,2968,ORNL-4400 (in preparation).
L,
. . *
\
.
. *
s
id

177
W t
e
* e
*
.i
.
. c
. U
ORNL-DWG 69-!5506 lo4
E 5 to3 ILO 3
0 10 2 0 30 40 50 80 120
I I I I I '. I I I
Fig. 12.7. Approach to Equilibrium in the Exchange of and Th* Between Molten Fluoride and Solid Oxide solution^ After the System Has Been Disturbed.
present results that the exchange process is as rapid and reversible as could be expected in view of the fact that each time the system is disturbed the return t o equilibrium requires that the composition of the entire oxide phase must be changed by repeated recrystalli- zation until it is brought to a homogeneous equilibrium composition.
The fluoride phase has been sampled frequently by means of copper filter sticks, and uranium analysis of these samples has been obtained in order to follow the u4'-Th4* exchange. Material balance has been used to determine the concentrations of the other major com- ponents of the fluoride phase and the composition of the oxide phase. The oxide phase, sampled less fre- quently, has been analyzed by x-ray diffraction! This has continued to show that below Xu,, = 0.8 a homogeneous (U-Th)02 solid solution is the equi- librium oxide phase, as expected. Its composition, based on a determination of the lattice constant, has been within <2% of the material balance value.
43Performed by R. L. Sherman, Analytical Chemistry Divi- sion.
In some of these equilibrations, hydrogen was added to the argon cover gas used in order to reduce to the tetravalent state any traces of oxidized uranium which might be present in the oxide phase. The equilibrium quotients obtained in such cases agreed well with values obtained in the absence of hydrogen, suggesting that oxidized uranium had not been present in significant amounts in the system.
When the uranium content of the oxide phase was increased above Xuo2 = 0.8, increasingly long equili- bration times were required before the distribution quotient became constant. Furthermore, some x-ray analyses43 indicated that oxide crystals of more than one composition persisted for long periods in this composition range. At Xu, - 0.95, equilibrium results have not yet been ogtained. This decreasing exchange rate is probably caused by decreasing solu- bility of the oxide phase in the fluoride phase as Xu,, is increased. For future measurements in this region, we plan to begin each experiment with prepared oxide solid solutions and fluoride melts of nearly equilibrium compositions.
The results obtained thus far (Fig. 12.8) with Xuo2 < 0.8, with a salt phase of the composition LiFBeF2- ThF4 -UF4 (72-16-1 240.36), and with temperatures in the range 580 to 780°C show that Q varies considerably with the oxide composition and the temperature. The results may be represented by the expression
log Q = log = (2124 + 509xuo2)/T.
ORNL-DWG 69-5507 2
to3
5 0
2
I I I I I I 0 0.2 0.4 0.6 0.8 i.0 1.2
xuo,
Fig 12.8. Variation of the Exchange Quotient for Reaction (1) with Composition of the Oxide Phase and the Temperature.

178
Table 12.10. Values of Q for Reaction (1) at Xuo2 = 038 and 680°
~~~~ ~
XLiF xThF4 Free Fluoride' Q 0.719 0.120 +3.83 215 f 16 0.684 0.164 -11.23 222 f 16 0.751 0.124 +12.82 220 f 16 0.743 0.110 +12.02 229 f 17
It has been found, however, that Q is not significantly changed when the composition of the fluoride phase is varied while holding the composition of the oxide phase constant (Table 12.10).
Since the exchange reaction, Eq. (l), involves two ions of the same charge and nearly the same size, Q might have been expected to be near unity. Actually, however, it has been known for some time that U02 is much less soluble than is Tho2 in these molten fluoridesP4 and hence Q should be considerably above unity, as indeed is the case.
The dependence of Q on the composition of the oxide phase, along with its lack of dependence on the composition of the fluoride phase, shows the oxide phase to be a nonideal regular solution with
and
wherein there is a zero excess entropy of mixing but a positive heat of mixing. Finally, the simple two- parameter expression for Q, above, indicates that the entropy of the exchange reaction is also zero.
Upon completion of the measurements at high values of Xuo2 , we will investigate the distribution of Pa"+ in this system in order to define the behavior to be expected in an MSBR fuel inadvertently contaminated with oxide and also to explore further the potential applicability of this system to fuel reprocessing.
44J. H. Shaffer, G. M. Watson, and W. R. Grimes, Reactor Chem Div. Ann. Rogr. Rept. Jan. 1960,ORNL-2931, p. 90.
12.12 AN Ni-NiO-Be0 ELECTRODE As A REFERENCE ELECTRODE IN
MOLTEN FLUORIDES
B. F. Hitch C. F. Baes, Jr.
We have reported4' previously that the Ni-NiO-Be0 electrode showed promise as a reference electrode in molten fluorides. The potential of this electrode is established by a low (0.002 molelkg at 600°C)46 Ni2' concentration produced by saturating 2LiF-BeF2 mix- tures with both Be0 and NiO.
Studies of the cell
Beo lLiFBeF2 llLiFBeF2 , Ni2+1Be0, NiOlNiO , (1) (66-34) (66-34) (4 (4
with the assumed cell reaction being
Beo + Niqc) BeO(c) + Nio ,
were completed. Since all the reactants and products are of fmed activity, the measured cell potential should be the standard cell potential E" and a function only of temperature if the LiF-BeF2 mixture is the same in both half-cells.
In our early potentiometric measurements of the above cell, the compartment for the nickel electrode was constructed of copper tubing with a copper frit (25 to 40 p porosity) welded onto the lower end. Excess Be0 and NiO were added to this compartment, and the LiF-BeF2 solution was then forced through the copper frit into the compartment by a small gas pressure. A nickel tube served as the nickel electrode and also permitted gas sparging. Cell potentials were erratic, but on various occasions we were able to achieve stable potentials for as long as 24 hr. The major difficulty encountered was that the cell potential would reach a maximum value and then begin drifting toward a lesser value. In an attempt to improve the performance of the nickel electrode, we modified the compartment described above by using a more dense copper frit (<lo p pore size), and in another version we used nickel tubing clad in copper. Neither modification resulted in any significant improvement in the behavior of the cell potential.
Since the possibility of electrical shorts between the Ni2'INi electrode and the metal electrode compart-
I
. *
* .
. 45B. F. Hitch and C. F. Baes, Jr., MSR Rogram Semiann
46C. F. Baes, Jr., Thermodynamics, vol. 1, p. 409, IAEA, Rogr. Rept. Aug. 31.1968.ORNL-4344, p. 167.
Vienna, 1966.
.

179
W t
a .
1
.
.
. 0
-
W
ments could have been responsible for some of the difficulties described above, we fabricated a compart- ment using silica tubing and a silica frit. The silica served as an electrical insulator for the nickel electrode and contained the oxide-saturated 2LiFBeF2 mixture! ' An improved nickel electrode was also used in the silica compartments. This electrode was fabricated by weld- ing a s m d (3/1 6 x '& in.) rectangle of sintered metal to '&-in. nickel rod. The sintered nickel was then "painted" with an aqueous slurry of Ni(OW2 and fired at 1000°C. This provided a larger surface area for the electrode reaction as well as a source of NiO.
Using a silica compartment and the improved nickel electrode, we obtained standard cell potentials (E") over a temperature range of 525 to 715"C, as shown in Fig. 12.9. The standard cell potential is given by h"' = 1.8872 - 0.000044T (v). Potential measurements were made over a period of one week, and although the silica was attacked by the fluoride melt, it did not rupture, nor did the electrode potential show any appreciable variation during this period. The standard cell potential compares well with values calculated using the forma- tion free energies of Be04 ' and NiO."
We are presently using the Ni2'lNi electrode described above, with the silica clad in nickel tubing, to measure the redox potential of the v4*/U3 couple in the cell
If, in the above cell, we assume that the internal transport number of Li+ is 1, which seems reasonable from the work of Romberger and Braunstein?' we may then sum the following processes:
F-(l) + UF3(I) + UF4(1) + e - ,
Li+( 1) -, Li+(2) ,
e- + '/?NiO + '/zBeFz(2) + '/?Ni' + '/?Be0 + F-(2) ,
where (1) denotes the half-cell containing UF4, UF3, LiF, BeF2 and (2) denotes the nickel reference elec- trode half-cell.
"C. E. L. Barnberger, C. F. Baes, Jr., and J. P. Young, J.
48B. F. Hitch and C. F. Baes, Jr., J. Inmg. them 8(2), 201
49J. F. Elliott and M. Glehn, Themzochemistiy for steel-
"K. A. Romberger and J. Braunstein, sect. 12.13, this report.
Inorg. Nucl. G e m . 30, 1979 (1968).
(1969).
making, p. 190, Addison-Wesley, Reading, Mass.
4.855 1- ORNL-DWG 68-94693
4.840 5 0 0 5 5 0 6 0 0 6 5 0 700 7 5 0
TEMPERATURE ("C)
Fig. 12.9. Standard Cell Potential (Cell 1) E" as a Function of Temperature.
The cell reaction is then
'/,NiO + LiF(1) + UF3(1) + */?BeF2(2)
+UF4(l) + LiF(2) + YNi' + YBeO,
and the Nernst expression is
'LiF(2)
'LiF(l)'BeFz(2)
Measurements so far have been made in an LiF-BeF2- UF4 (66-33-1) melt. Uranium trifluoride has been formed by adding beryllium or zirconium metal as the reductant. Results indicate that the first few additions of reductant were consumed by impurities in the melt, and even after careful purification a small amount of impurities existed. From the potential measurements the major impurity seems to be hydroxide ion. Repro- ducible results have been difficult to obtain using beryllium and zirconium metal as reductants. However, results obtained using NiF2 to oxidize the UF3 are reproducible but are not in agreement with cell poten- tials calculated from available thermochemical data. This inconsistency of about 40 mv will be investigated further.
The Ni?+lNi electrode shows promise for use as a reference electrode in molten fluorides. We hope to improve the compartment assembly by using porous Be0 or Zr02 instead of silica. Both of these materials will be investigated in the near future.

180
Be
12.13 EMF MEASUREMENTS WITH CONCENTRATION CELLS WITH
TRANSFERENCE IN MOLTEN MIXTURES OF LiF AND BeF,
K. A. Romberger J. Braunstein
The correlation and interpretation of ionic transport properties in molten fluoride systems, especially BeF2 - containing mixtures, is important in the development of electroanalytical methods for the molten-salt reactor and for electrolytic separation processes?1 Here we report measurements of the transference numbers of Li+ and Be2+ in LiF-BeF2 mixtures.
Electromotive force measurements have been made of the concentration cell with transference
LiF LiF BeF2 BeF2 Be
I I1
These measurements have covered the composition range in the indicator half-cell (11) from 0.33 to 0.51 mole fraction BeF2 at 500°C and from 0.27 to 0.70 mole fraction BeF2 at 610°C. The reference half-cell (I) contained 0.34 mole fraction BeF2 at 500°C and 0.70 mole fraction BeF2 at 610".
The furnace" and cell, the latter shown schemati- cally in Fig. 12.10, were of silica. Spectrophoto- metric5 and conductances4 measurements have demonstrated the compatibility of silica containers with these LiFBeF2 mixtures. Beryllium rod electrodes, clamped to nickel rods, were dipped in melt in the bulk compartment (11) and in the small reference half-cells. The liquid junction between the two compartments was made through coarse-grade (1SO-p) fritted silica disks. These disks have relatively little surface area and ensure a conduction path through liquid rather than through a silica membrane. Behl and Egan had reported drift of emf with fine-porosity silica frits in emf measurements with molten chlorides and adopted powdered alumina as the diffusion barrier.'5 No such drift was observed with our silica frits.
'lK. A. Romberger and J. Braunstein, Reactor Chem Div. Ann. Ron. Rept. Dec. 31.1%8.ORNL-4400(in preparation).
52K. A. Romberger, MSR Rogram Semiann Rogr. Rept. Feb. 29,1968,ORNL-4254, p. 149. 'jC. E. Bamberger, C. F. Baes, and J. P. Young, 1. Inorg.
Nucl. Chem 30,1979 (1968). 54G. D. Robbins and J. Braunstein, in Symposium on
Characterization and Analysis in Molten Salts, ed. by G. Mamantov, Marcel Dekker, Inc., New York, 1969 (in press).
55W. K. Behl and J. Egan,J. Phys. Chem 71,1764 (1967).
J The smaller reference compartment (I) was filled initially from melt contained in the larger indicator compartment (11). The initial emf's were 0 f 1.7 mv. The composition of the bulk compartment was changed by stepwise additions of BeF2 and also LiF at each temperature while measuring the emf, Et. The emf equilibrated within about 15 min after an addition of BeF2 or LiF, the approximate time re- quired for salt dissolution and reestablishment of temperature control. Mechanical stirring through a Teflon seal, under a dried helium atmosphere, speeded equilibration.
The emf of cell I is shown as a function of composition in Fig. 12.11. At 500" the composition was first varied from 0.34 to 0.51 mole fraction BeF2 by additions of BeF2. I t was then lowered to 0.33 mole fraction BeF2 by additions of LiF. At 610°C the composition was vaned from 0.70 to 0.27 and then back to 0.33 mole fraction BeF2. Values of Et for both LiF and BeF2 additions fell on the same line within *2 mv. Additions of LiF and BeFz were made through a ball valve under helium pressure. Lithium fluoride w a s previously sintered under hydrogen, while BeF2 was a clear glass which had been vacuum distilled in nickel. The LiFBeF2 mixture (0.34 mole fraction BeF2) was filtered through fritted nickel under hydrogen before
I
*
use.
ORNL-DWG 69 - 873
c
c
#
. 4
Q
Fig. 12.10. Silica Cell Compartment and Reference Half Cell for Measurement of EMF of Cell with Transference.

18 1
A E a 3 ADDITIONS ~
0 INITIAL SALT Equation (4) may be applied to small composition I
0
-50
-+oo
-150 - > - E -200
bi & -P50 -300
-350
-400
-450
ORNL-DWG 69-2856
7 LiF ADDlTlDNS I
200
450
100
50
0
-50
where x is the mole fraction of beryllium fluoride. The mean transference number over the range of composition between I and I1 is
(4)
Fig. 12.11. EMF of Concentration CeUs With (Et) and I At 6100C, Eqs. (3b) and (4) both yield values for Without” (E,,,) Transference. in the System LiF-LkF?.
Hitch and BaesS6 measured the emf of the cells
as a function of temperature for BeF2 mole frac- tions of 0.30, 0.33, 0.40, 0.50, 0.60, 0.70, 0.80, and 0.90. The difference of emf of two cells such as (2), with differing melt concentrations, is the emf of a concentration cell without transference, with beryl- lium electrodes, corresponding to the same electrode reactions as for cell I. These differences, E,, also are shown in Fig. 12.11. The difference between E, and Et over relatively small differences of compo- sition indicates liquid junction potentials of appreci- able magnitude.
If the transference numbers of lithium ion and beryllium ion, relative to fluoride ion as the internal reference, are tLi and tge, with TLj = 1 - tge, consideration of the electrode reactions, transference, and the Gibbs-Duhem equation gives’ ’ 9’
or
“B. F. Hitch and C. F. Baes, Jr., An EMF Study in LiF-BeF2 Sdutions, ORNL4257;Inorg. Chem 8,201 (1969).
57C. Wagner in Electmchemisfry and Electrochemical Engi- neering, vol. 4, ed. by P. Delahay, p. 11, Interscience, New York, 1966.
rLi of 1.00 f 0.05 in the composition range 0.30 < xBeF2 < 0.50. At higher concentrations of BeF2, the magnitude of the changes in E, and especially in E, is considerably smaller than at the lower BeF2 concentrations (see Fig. 12.11). For the composition range 0.50 < xBeF2 < 0.70, the error in E, is approximately 1596, while for the range 0.60 < xB,,F,, < 0.70, the uncertainty in E, is over 100%; that is, E, = 2.9 f 3.4 mv. If the E, value at 0.60 mole fraction BeF2 is omitted, then fLi is 1.0 f 0.2 for the composition interval 0.50 < xBeF2 < 0.70. The large uncertainties in E, in this composition range render use of the derivative relation (3b) imprecise. On a plot of Et vs E, the value of E, at 0.60 mole fraction BeF2 falls about 2 mv below the smooth curve through the other points, this smooth curve corresponding to tLi = 1.0 f 0.05. The error is within that quoted by Hitch and Baes.s6 The value of rLi calculated with Eq. (4) from the 500°C data is 1.00 f 0.05 for the interval 0.33 < xBeF2 < 0.50. Scatter in the values of Et for th is preliminary experiment is too large and the number of measured values qf E, in this range is too small to apply Eq. (3b).
E, can be calculated as a function of composition as
from experimental values of E, if rLi is known. The bands shown in Fig. 12.11 are the calculated limits of E, when rLi is assumed to be 0.95 and 1.05. Within their listed uncertainties the values of E,,, as given by Hitch and Baes fall within these bands. We conclude that tLi = 1.0 f 0.05 in the range 0.3 <

182
xBeF2 < 0.5, probably in the range 0.3 < xBeF2 < 0.7, and possibly over the entire concentration range.
The mobility of lithium ion is given bys ,”
”S. Cantor, W. T. Ward, and C. T. Moynihan,J. chem Phys. (in press).
In the above expression, K is the specific con- ductance of the melt, the Ws are the formula weights of the components, Z is the charge (ZLi = l), F is the faraday, and p is the density. With fLi = 1 and the reported conductances4 and densitys8 of LiF-BeF2 mixtures, the calculated mobilities of lithium ion (relative to fluoride) in mixtures con- taining 0.34 and 0.51 mole fraction BeF2 are, re- spectively, 4.0 X 10- and 2.7 X cm2 sec-’ volt-’ at 500°C and 6 X 10- and 4 X lo4 cm’ sec-’ volt-’ at 61OoC. (These values are smaller than those for Li+ in LiC1-PbCl2 mixtures and for K+ in KCI-MgC12 mixtures, but are similar to those for M F in KC1-MgCl2 mixtures.”) The mobility of beryllium ion is zero within the experimental error. A negative value of t g e , corresponding to the reported experi- mental uncertainty (tge = 0 T 0.05), seems highly unlikely since it would imply that beryllium ions move toward the anode faster than fluoride ions.
Additional emf measurements are in progress to extend the range of temperatures and BeF2 concentra- tions. Measurements will be made in metal (Mo, Ta) systems to verify inertness of the silica apparatus and to permit the use of Li(Bi) alloy electrodes, which react with silica. With both Be and Li(Bi)-alloy reference electrodes, Ew and Et can both be determined in one experiment. This will provide an independent check of activity data in the LiF-BeF2 system and extend the results to composition regions where gas electrodes, used in previous measurements, are difficult to employ. Precise determination of the transference numbers should make it possible to use beryllium electrodes in fritted compartments as thermodynamic reference electrodes, for example, for the evaluation of free energies and enthalpies of mixing. High BeF2 concen- trations in the reference compartment retard mixing and increase electrode lifetime.
12.14 ELECTRICAL CONDUCTANCE OF MOLTEN KNOB
G. D. Robbins J. Braunstein
Specific conductances K are obtained from measured resistance R by employing the relation
where l/a is the cell constant. The value of l/a usually is obtained by measuring the resistance of a material of known specific conductance, preferably one having properties similar to the system to be investigated.
In the course of investigating electrical conductivities of molten fluoride systems of relevance to the MSRE and MSBR programs, it became necessary to select a reference salt for use in the determination of cell constants. Based on ease of handling, availability, stability to atmospheric conditions, and compatibility with container materials - especially silica - molten potassium nitrate seemed the most reasonable choice among molten salts for such a reference material. However, the results of reported investigations in this system at temperatures up to 100°C above the melting point differ by amounts considerably larger than the claimed experimental uncertainty.
In a recent review of electrical conductance meas- urements in molten fluorides: errors arising from the use of a Wheatstone-type (or Jones) conductance bridge were discussed. Some possible origins of frequency variation of the measured resistance were also pre- sented.
The object of this work was a careful measurement of specific conductance as a function of temperature for molten potassium nitrate to provide reliable values for use in cell constant determination in our molten- fluoride program. Because of the frequent use of potassium nitrate as a reference point in studies of transport properties of molten s ~ ~ ~ s P O - ~ ’ accurate values of its specific conductance and temperature
. 8
r
. r
59G. D. Robbins, Electrical Conductivity of Molten Fluorides A Reuiew, ORNL-TM-2180 (March 1968);J. Electre chem. Soc., in press.
6oC. A. Angell,J. Phys. chem 68,1917 (1964). 6’Zbid.. 70,2793 (1966). . “B. DeNooger, The Electrical Conductivity of Molten
Nitmtes and Binary Nitmtes, thesis, University of Amsterdam, Netherlands, 1965. .
6 3 J . C. T. Kwak, DiffirsioncJ and Elechicnl Mobilities of D a c e Ions in Ionic Liquids, thesis, University of Amsterdam, Netherlands, 1967.

183
dependence are important quantities in their own right to the physical chemistry of molten salts.
As discussed previously, errors can arise in deter- mining molten-salt conductivities from the use of measuring bridges with a balancing arm having a parallel resistance and capacitance. Accordingly, a specially constructed bridge64 with series components in the balancing arm was employed in measuring resistances in the molten nitrate. The type of silica conductance cell used here has been previously For the determination of the cell constant a O.ldema1 aqueous potassium chloride solution (prepared from single- crystal KCI) was used, for which the specific con- ductance is well established? 76 The resistance of the aqueous electrolyte was determined in a controlled- temperature bath at 25°C employing the Jones bridge because of the large resistances involved.
For measurements in the molten nitrate the maxi- mum peak-to-peak voltage applied to the series- component bridge was 30 to 110 mv, and the measured resistance did not varv with frequency (<0.2 ohm * 0.2%, random) from 1 to 20 kilohertz. More specific experimental detail may be found in ref. 68.
Table 12.1 1 shows specific conductance vs tempera- ture data for molten potassium nitrate as determined with the series-component bridge. To check for possible errors in conductance due to nitrite formation, the following procedure was adopted:
Between each resistance determination at successively higher temperatures, the resistance was measured near the melting point (see Fig. 12.12). I t was planned to discard the last datum at the elevated temperature when a low-temperature value failed to duplicate the pre- viously determined values. However, no discrepancy appeared up to 541"C, the temperature limit of the furnace. From this one might conclude either that sufficiently little nitrite had formed to be detected or that the specific conductances of KN03 and KN02 were identical within the limits of measurements, in which case the results remained valid. However, the possibility exists for identical conductivities near 350°C with divergent values appearing at increased tempera- tures. Accordingly, an addition of 5 mole % KN02 was made, which resulted in the datum represented by the
"G. D. Robbins and J. Braunstein, Reactor Chem. Diu. Ann
"G. D. Robbins and J. Braunstein, MSR Program Semiann.
"R. A. Robinson and R. H. Stokes, Electrolyte Solutions, 2d
"G. Jones and B. C. Bradshaw, J. A m Chem SOC. 55,1780
Progr. Rept. Dec. 31,1967,0RNL-4229, p. 57.
Progr. Rept. Aug. 31,1968,ORNL.4344, p. 163.
ed., p. 462, Buttemorths, London, 1959.
(1933).
Table 12.1 1. Specific Conductance of KN03 vs Temperature
Temperature ("0 K (ohms-' cm-')
345.4 349.9 35 1.6 353.5 353.5
354.9 355.4 357.5 358.5 360.6
360.8 363.7 376.6 380.0 386.6
392.0 419.9 445.2 464.4 485.2
485.7 499.5 520.5 541.3
0.6459 0.6599 0.6647 0.6705 0.6696
0.67513 0.6764 0.6834
0.6921
0.6934 0.7042 0.7444
0.7740
0.6867
0.7536
0.7908 0.8731 0.9462
1.0565
1.0557 1.0937 1.1470 1.1988
1.001~
triangle in Fig. 12.12 at 359"C, well outside the data scatter .
To iecheck the KN03 specific conductance results, a completely new dip cell was constructed and its-cell constant (141.4 cm-') determined in 0.1-demal KCl as before. A newly calibrated Pt vs Pt-10% Rh thermo- couple measured temperature. The squares at 370 and 422°C show these results, which agreed with the previous results within 0.2%.
The curve shown in Fig. 12.12 represents the computer-fitted least-squares equation (u = 0.0008)
K = -0.7098 + 4.6202 X 10⁻³t ("c) - 2.0221 x 10⁻⁶t2
based on the 24 data in Table 12.11. Of the previous investigations in this system only the limited- temperature-range equation (343-391 "C) of Smith and Van Artsdaled' agrees well with the results reported
"G. D. Robbins and J. Braunstein, The Specific Conductance
"D. F . Smith and E. R. Van Artsdalen, Chem Div. Semiann ofPotassiltm Nitrate, ORNL4375 (March 1969).
h g r . Rept. June 20,1956, ORNL-2171, p. 80.

1.20
1 .16
1 .12
1.08
1.04
too
as6 - - L 0.92
0.88
0.84
0.80
0.76
0.72
0.68
0.64
n cn
L
-
184
ORNL-DWG 68-12952132
. *
.
-.-- 340 360 380 400 420 440 460 480 500 520 540
r FC)
Fig. 12.12. Specific Conductance of Molten KN03 vs Temperature.
here (maximum deviation = 0.4%). If all errors are assumed to be random and independent with uncer- tainties assigned to K of 0.2% from cell constant determination, 0.1% from resistance measurement, 0.2% from possible nitrite impurity, and 0.2% from temperature measurement, the probable error is 0.3%. We consider these results to have an accuracy of better than +OS% and to demonstrate the potential of KNOJ as a molten-salt conductance standard.
12.15 ELECTRICAL CONDUCTANCE OF MOLTEN BERYLLIUM FLUOFUDE
G. D. Robbins J. Braunstein
As part of an investigation of the temperature dependence of electrical conductivities in the molten LiFBeF2 system, a preliminary study of the variation of conductance with temperature in pure molten beryllium fluoride has been completed. In addition to its importance as a primary component of fuel and coolant salts for the MSW, much fundamental interest is centered on the conductance of molten BeF2 because of its ability to supercool, allowing approach toward the theoretical "glass-transition-zero-mobility" tem- perature. One might thus expect marked non-Arrhenius behavior in its transport properties (particularly vis- cosity and electrical conductivity). Yet such behavior was not found for the viscosity over many orders of magnitude.'
The extremely high viscosity (>7 X 10' poises at 600°C)70 and the network structure of molten BeF2 pose special problems in the measurement of specific conductance due to the large resistances involved. Consequently, a different type of electrode configura- tion from that previously described was employed in this investigation. This consisted of two parallel Lshaped platinized platinum wires (20 gage) immersed directly into the melt to a depth of 7 mm. A silica thermocouple well, dipping into the melt and at- tached to the electrode assembly, contained a cali- brated Pt vs Pt-10% Rh thermocouple for accurate temperature measurement (kO.2OC). The cell constant at 7 mm depth of immersion was determined to be 0.638 ohm-' an-' (*5%) in O.Oldema1 KCl solu- tion," prepared from singlecrystal potassium chloride.
Hand-picked glass-clear pieces of distilled beryllium fluoride72 were loaded, in a dry box, into a silica cell of the type previously described7' and melted in a helium atmosphere. A silica-Lavite furnace74 permitted visual
t
.
708. Cantor, W. T. Ward, and C. T. Moynihan,J. Chem Phys. .. 7'0btained from A. S. Quist and W. L. Marshall. 7 2 B ~ s h Beryllium Co.; distilled by B. F. Hitch. 73MSR Progmm Semiann bog. Rept. Aug. 31, 1968,
74K. A. Romberger, MSR Program Semiann Progr. Rept.
in press (1969). . .
ORNL-4344, p. 163.
Feb. 29,1968,ORNL-4254 p. 149. i d

185
observation of the melt. On melting, the BeF2 chunks slowly coalesced, trapping inert-gas bubbles which slowly disappeared with heating during the first day of operation. Small immobile gas bubbles were observed to form and adhere to the silica wall about the third day. (This was probably SiF4 formed via the reaction 2BeF2 + Si02 + SiF4t + 2Be0.) A wisp of particulate matter could also be seen in the bulk; otherwise the melt appeared clear and colorless. Neither bubbles nor particulate matter was observed in the conducting region between the electrodes. No change in appearance occurred during the subsequent 11 weeks the molten fluoride remained in the cell (except an occasional initiation of crystallization during supercooling). At the end of this period, analysis of samples from the interior of the frozen melt (all of which was glass clear) showed the following impurities (in ppm by weight): 3 Fey 15 K, 50 Li, and 100 Na. Other metals detectable by semiquantitative spectrographic analysis were below the limits of detection. While this impurity level is higher than desirable, it is several orders of magnitude lower than the only previous investigation in this ~ystem.~’
The Jones conductance bridge76 was tested with dummy components in place of the cell (calibrated resistances and 20 pf capacitance, connected in series) as a function of frequency to ascertain the accuracy which could be expected with the very large experi- mental resistances (considerably greater than those for which the bridge was designed). For a given level of accuracy the range of frequency over which this accuracy could be maintained decreased as the re- sistance increased. For 1% accuracy the available frequency range for resistances of 1 X 10’ ohms was 0.3 to 10.0 kilohertz, while the range decreased to 0.6-2.0 kilohertz, for resistances of 1 X lo6 ohms. (For resistances of the order of 1 X lo7 ohms, 3% accuracy was possible only over the frequency range 0.80 to 0.90 kilohertz.) Measured resistances of the cell containing molten BeF2 ranged from 8 X 10⁴ to 8 X lo6 ohms and were invariant with frequency within the accuracy limits of the bridge. This is an indication (although not proof) that the conductance is not by minor electroactive impurities, which would very likely result in frequencydependent conductance if the impurities were oxidized or reduced at the electrodes. This is especially so due to the large peak-to-peak voltages of 0.1 to 2.0 v which had to be applied (depending on the magnitude of the resistance) to obtain a detectable current of 1 to 5 pa. Even with the
7 5 J. D. Mackenzie, J. Chem. Phys. 32,1150 (1960). 76P. H. Dike,Rev. Sci Instr. 2,379 (1931).
large resistances encountered here, the silica appeared to be an electrical insulator, and no parallel con- ductance through the silica could be detected.
Specific conductances, K , for molten BeF2 obtained after two weeks and after three weeks are presented in Fig. 12.13 for the temperature range 685 to 530°C - the latter temperature being 25” below the melting point. Also shown are data (triangles) obtained during
?he last eight weeks of the experiment which represent long equilibration periods before measurement. These periods ranged from 5 to 75 hr, depending on the temperature, often with repeated monitoring to ensure that true equilibrium had been attained. The absence of long-term drift in the data is an indication that no corrosion suffrcient to affect the results occurred. Data obtained during the first several days of the experiment (not shown) varied from day to day, with points falling on both sides of the curve. This behavior is possibly due to the slow migration to the surface and evolution from the melt of inert-gas microbubbles too small to be visible. The extreme viscosity of this material reflects, in slow motion, effects which normally would have terminated before measurement began.
The curve shown in Fig. 12.1 3 is represented by
7939 (k1124) T ln K = -21.32 (*2.57) -
+ 0.01855 (kO.00146)T ,
where T is in degrees Kelvin and the values in parentheses are standard errors of the parameters. This equation was obtained by a least-squares computer fit to equally weighted values of In K ,which corresponds to assigning constant relative errors to values of K . The standard deviation of fit was 0.0213 (+2% in K). The one previous investigation of specific conductance in this system7’ contained one datum near the tempera- ture range encompassed here. I t differed by approxi- mately 30% from our extrapolated value. However, viscosities obtained with the same apparatus have been shown to be in error?
Specific conductance data were combined with the density data of Cantor7’ to yield equivalent con- ductances A, shown in Fig. 12.14 (A = K X equivalent weightldensity). Although the curvature of this plot indicates nonArrhenius behavior, the curvature is in the wrong direction to correspond to “glass-transition- zero-mobility” concepts. Empirically fitting an equa-
77C. T. Moynihan and‘s. Cantor, J. Chem Phys. 48, 115 (1968).
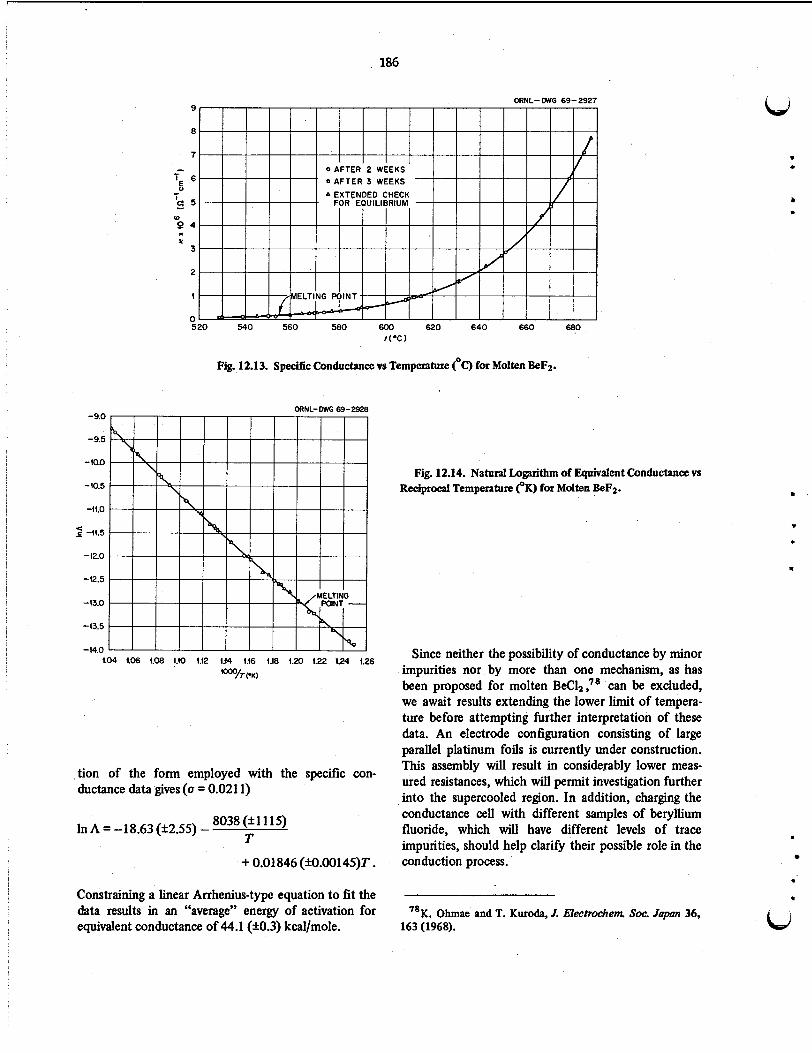
186
.
520 540 560 580 600 620 640 660 680
Fig. 12.13. Specific Conductance vs Temperature (“C, for Molten BeF2.
1.04 1.06 4.08 !.40 1.12 1.14 166 1.18 1.20 1.22 1.24 1.26
‘OOO!, CK)
tion of the form employed with the specific con- ductance data gives (u = 0.021 1)
8038 (k1115) T In A = -18.63 (k2.55) -
+ 0.01846 (k0.00145)T.
Constraining a linear Arrhenius-type equation to fit the data results in an “average” energy of activation for equivalent conductance of 44.1 (k0.3) kcal/mole.
Fig. 12.14. Natural Logarithm o Equivalent Conductance vs Reciprocal Temperature e K ) for Molten BeF2. * .
Since neither the possibility of conductance by minor impurities nor by more than one mechanism, as has been proposed for molten BeClz,” can be excluded, we await results extending the lower limit of tempera- ture before attempting further interpretation of these data. An electrode configuration consisting of large parallel platinum foils is currently under construction. This assembly will result in considerably lower meas- ured resistances, which will permit investigation further into the supercooled region. In addition, charging the conductance cell with different samples of beryllium fluoride, which will have different levels of trace impurities, should help clarify their possible role in the conduction process. . .
bi “K. Ohmae and T. Kuroda, I; EIectrochem Soc. Jupun 36, 163 (1968).
U 9 . .
9
*
. .I
. U
13. Chemistry of Mo Reprocessin
Current design of the two-region, single-fluid MSBR includes provisions for chemically reprocessing the reactor fuel for isolation of 233Pa and for removing rare-earth fission products. Development efforts for these processes have pursued the reductive extraction concept whereby constituents of the fuel salt are selectively extracted into molten bismuth containing either lithium or thorium as the reducing agent. The chemical feasibility of Pa isolation has been demonstrated by a process which also requires the prior reduction of uranium from the salt mixture and its subsequent oxidation into the salt effluent of the 33Pa extraction column. Chemical researches are engaged in further evaluation of the supporting equilibrium data and in determination of the chemical behavior of those fission products and salt impurities which will be simultaneously extracted in the Pa isolation process.
The rareearth removal process will likely utilize the barren salt effluent of the Pa isolation process. Although the chemical feasibility of the salt-bismuth extraction process for removal of rare earths has been demonstrated, their separation from thorium, a major constituent of the salt phase, may be insufficient for engineering design purposes. Present studies seek other molten-metal systems, metal additives to bismuth, and varied process applications to achieve improved rare- earth separations.
13.1 SIMULTANEOUS EXTRACTION OF ZIRCONIUM AND URANIUM AND OF
ZIRCONIUM AND PROTACTINIUM
D. M. Moulton J. H. Shaffer
I t is known that the solubility in bismuth of uranium and zirconium together is much less than when they are separate. For example, Weinberg et al.' report the solubility of uranium at 4000C to be about 1400 ppm, while at 210 ppm zirconium it falls to under 1100. (Zirconium solubility by itself is about 360 ppm.) Prom these data it is not possible to make an accurate
ken-Salt Reactor Fuel 5 Technology
extrapolation to 600", but the effect of zirconium on uranium solubility seems to rise slightly with higher temperatures. Zirconium is produced in large amounts as a fission product. Earlier work'" had indicated that it would be extracted from LiFBeF2 (66-34 mole %) a little less easily than uranium.
It is important to know where zirconium will extract in a single-fluid reactor salt and also whether there will be any interaction with uranium in the bismuth phase, affecting either the extractability or the solubility. These systems have been investigated in the single-fluid salt LiF-BeF2 -ThF4 (68-20-1 2 mole 96). Zirconium analyses, which had been a source of trouble earlier, were made by counting the 95Zr on a lithium-drifted germanium diode, which will resolve this peak from that of its daughter, 95Nb. Chemical and spectro- chemical analyses for zirconium gave generally good checks with this method. Graphite apparatus was used throughout.
In the first experiment 2.97 kg of salt containing 6.06 g of labeled zirconium as ZrF4 was extracted with 3.00 kg of bismuth at 600 and 700' using portions of thorium metal as the reductant. About 6.2 g of uranium metal was next added, and the system was hydro- fluorinated to oxidize the uranium and the zirconium. The reduction was then repeated as before. In the second experiment, 3.97 kg of salt with 6.05 g of zirconium and about 1 mc of 233Pa was extracted with 3.00 kg of bismuth in $e usual fashion at 600 and 700'.
In the first part of the first experiment, the object was to determine the extractability of zirconium alone. The reduction potential difference between lithium and thorium was 0.09 v lower than had been found several times before in this salt. It seemed that abnormally high
'A. F. Weinberg et al., nuns. Met. SOC. AIME 221, 83 (196 1).
'Reactor Chem. Diu. Ann hog. Rept. Dee. 31, 1967. ORNL4229, p. 41, and unreported work from this experiment.
187

188
lithium values were responsible, so this voltage has been added to both the Li-Th and Li-Zr potentials. No such anomaly appeared at 700'. Zirconium balance was good throughout the experiment. The potentials found in the first half of this experiment are as follows:
Temperature (Oc) E;)Li - E;)Th E;)Li - EbZr E;)Th - E;)Zr
600 -0.426 f 0.060 -0.597 f 0.077 -0.145 f 0.047 700 -0.433 f 0.027 -0.615 f 0.027 -0.166 f 0.053
Ferris et a2.j report E;)Th - EAzr = -0.25 at 600' for a somewhat different salt (69.2-19.4-1 1.4 mole %) of higher free fluoride content.
The potentials found in the second half of th is experiment are listed below:
Here again there is no difference within the accuracy of the measurements. Protactinium balance was good throughout the experiment. The maximum zirconium concentration in the metal (1900 ppm) was not far from the 2020 ppm added originally. From the protactinium-zirconium difference in this experiment and the protactinium-uranium difference in the older one,one can findEAZr - EbU = -0.018 at both 600 and 700'; this is derived from experiment where uranium and zirconium were present separately and is about the same as that where they were together.
The error limits on these experiments prevent any positive claims of solute-solute interaction in these experiments. Nevertheless, there is some indication that protactinium is easier to extract in the presence of
63
8 - v
t
600 -0.452 f 0.053 -0.597 f 0.080 -0.017 f 0.009 -0.128 f 0.049 700 -0.476 f 0.053 -0.638 f 0.070 -0.003 f 0.015 -0.168 f 0.056
Within the error of the measurements there is no difference in the zirconium behavior with and without uranium. The zirconium and uranium balances were not good, however. The maximum of these found in the metal (when they were essentially gone from the salt) was about 900 and 1400 ppm, respectively, or 45 and 67% of that present and 30 and 10% of saturation at 600'. We had reached 1900 ppm zirconium, or 95% of that added, in the first part of the experiment. Ferris4 reached 2900 ppm uranium and 2200 ppm zirconium at 600' using filtered samples. He found - E&, = -0.243 and E&, .- E;, = -0.002 in a salt of composition 72-16-12 mole %.
In the zirconium-protactinium extraction the effect of zirconium on protactinium could be observed but not the converse, since only tracer protactinium was used. The potentials are shown in the table. In the last column are shown the potentials obtained in an earlier protactinium-uranium extraction from the same salt.
zirconium and that zirconium and uranium are both harder to extract when together than when separate. Protactinium-zirconium separation should be quite easy; the uranium-zirconium separation may be rather difficult.
13.2 PROTACTINIUM STUDIES IN THE HIGH-ALPHA MOLTEN-SALT LABORATORY
C. J. Barton R. G. Ross
Part of the data obtained from an experiment (8-20-68) in which the single-region, fuel salt LiF-BeF1- ThF4-UF4 (72-16-12-0.25 mole %) containing 100 ppm 231Pa was equilibrated with Bi-Th alloy in a molyb- denum container was reported previously? The ex- periment was conducted in two parts (1 and 2). Initially (part 1) sufficient thorium was added to the bismuth to reduce all the UF4 and PaF4 to the metals and leave an
Tem erature (c) g E;)Li - E;)Th E;)Th - E;)Th - E;)Zr - '$2, - E&J
600 -0.440 f 0.021 -0.148 f 0.016 -0.165 f 0.040 -0.085 f 0.004 700 -0.435 f 0.028 -0.152 f 0.004 -0.209 f 0.025 -0.082 f 0.011
600 -0.422 f 0.013 , -0.128 f 0.015 700 -0.434 f 0.019 -0.138 f 0.006
~
3Private communication, Dec. 2,1968. 4Private communication, Feb. 3,1969.
-0.067 * 0.025 -0.064 f 0.029
. 'MSR Rogmm Semiann h p . Rept. Aug. 31. 1968, ORNL-4344, pp. 184-85.
t
9
t

W e *
9 .
4
t
*
I
.L . W
Table 13.1. Separation Factors for Uranium and Protactinium Between LiF-BeFz-ThF4
(72-16-12 Mole %) and Bi-Th AUoy
Temperature Average Experiment cc> XTh(Bi) q h a a!a
x io3 Part 1 630 1.26 25,800 1680 15.4 Part 2A 630 1.67 25,300 1275 19.8 Part 2B 805 2.34 6,000 380 15.8
excess of 1700 ppm of thorium. This mixture was held at 630" for about seven days, during which time the only changes involved changing the sparge gas between argon and helium, flowing or static. The protactinium and uranium concentrations were essentially constant regardless of the sparge gas or flow condition. The protactinium and uranium were then returned to the salt phase by oxidation with Hz -HF, and reduction was again effected (part 2) but this time with incremental thorium additions. With the melt temperature at 630°C (part 2A) additions were continued until thorium solubility in bismuth at t h i s temperature was exceeded. The temperature was then increased to 805°C and equilibrium reestablished (part 2B).
Separation factors,
calculated for this experiment are shown in Table 13.1. The large separation factors in the table confirm that
uranium, protactinium, and thorium can be effectively separated in a fuel processing plant using the reductive extraction method.
13.3 FURTHER STUDIES OF THE REDUCTIVE EXTRACTION OF PROTACTINIUM FROM
SINGLEFLUID MSBR FUEL SALT BY THORIUM IN MOLTEN BISMUTH
R. G. Ross C. E. Bamberger C. F. Baes, Jr.
Successful reductive extraction of '"Pa at the 100-ppm level from a single-region MSBR fuel compo- sition by thorium in liquid bismuth has been demon- strated by Ferris et aL6 and by Barton et al. (Sect. 13.2). Additional measurements have since been under-
%. M. Fenis, MSR Prognzm Semiann hog. Rept. Aug 31. 1968,ORNL-4344.
189
taken by us to help determine accurately the equilib- rium quotient for the extraction reaction
(1) Pa4+(F) + Tho(Bi) * Pao(Bi) + Th4+(F) ,
and to determine also whether th is quotient depends significantly on the concentration of Pao and/or U" in the bismuth phase. While the previous studies indicate that reproducible results should be obtained when molybdenum is used as a container material, such data in fact have been difficult to obtain. These additional measurements therefore seemed especially desirable in view of the importance of good equilibrium data to the development of a fuel reprocessing method employing reductive extraction.
The present measurements were performed in a molybdenum-lined nickel vessel (Fig. 13.1) equipped with a gas lift to provide improved mixing of the phases. (Tests in a siIica container revealed that gas sparging alone produces negligible mixing of molten bismuth into the molten fluoride.) To avoid the possibility that appreciable amounts of impurities such as water or oxygen might be introduced by a once- through sparging gas system, a recirculating gas system was used. The circuit included a neoprene-diaphragm pump, the gas lift in the extraction vessel, a fritted nickel filter in the gas exit line, an NaF trap (for any trace of HF), and an Mg(C104)2 trap. The experiments were performed at 625°C k 2" using -250 g of single-region salt (LiFBeF' -ThF4, 72-16-12 mole %) to which initially 23 'Pa and '33Pa were added and later 0.25 mole % UF4 was added. This was hydrofluorinated in situ together with 250 g of bismuth in the molyb- denum liner. Hydrogen gas sparging for 4 to 6 hr followed, and then the hydrogen was replaced by argon at 4 to 5 psig before recirculation was started. Crystal bar thorium metal was added as the reducing agent. Stainless steel filter sticks were used for sampling the bismuth phase, and copper filter sticks were used for sampling the salt phase. Molybdenum filter sticks were also fabricated and tested by sampling both phases. These, unlike fdter sticks of stainless steel or copper, are fully compatible with both phases. They were mechanically satisfactory, and the surface oxide can be easily reduced with hydrogen at 1000°C.
Thus far, two successful runs have been made in the absence of uranium and one with uranium present. In the first series of measurements it was found, Surpris- ingly, that quite large amounts of thorium could be

added to the bismuth phase - XTho(Bi) calculated to reach 0.0014 - with very little protactinium extraction, and even this small amount decreased slowly with time. It was surmised that the thorium was consumed by an oxidizing impurity present in relatively large amounts. The contents of the vessel were re-treated with HF-H2 and hydrogen. After this second treatment, thorium metal additions produced protactinium extractions in the absence of uranium (Fig. 13.2) which agree well with results obtained previously by Barton in the presence of 0.26 mole 76 UF4. (The cause of the initial thorium consumption without protactinium extraction, we are tempted to speculate, was molybdenum oxide, initially present and not completely reduced in the initial treatment of the salt.) Uranium tetrafluoride was then added to bring its concentration in the salt phase
ORNL-DWG 69-2234
190
Ar -
Fig. 13.1. Vessel for Reductive Extraction Experiments.
6, to 0.25 mole %, and' the thorium additions were continued. Again the results compare well with those obtained by Barton (Fig. 13.3). The favorable com- parison in Fig. 13.2 is based on material balance . calculations of the thorium concentration in bismuth (allowing for the consumption of Tho by Lrand Pa .
Fig. 13.2. Variation of Pa Distribution Coefficient with Mole Fraction of Thorium in the Bismuth Phase.
ORNL-DWG 69-6654 400
8
W . a
. 0.1 1.0 40 100 4000
DU 0
t Fig. 13.3. Variation of Pa Distribution Coefficient with U Distribution Coefficient.

191
. . (i
P
*
a
I
. W
reduction) for the present results and on direct thorium analysis for Barton’s results.
Interestingly, it appears that in all these measure- ments, mole fraction of thorium was ineffective in extracting protactinium. This could have been caused by a small amount of some unknown substance, present in reproducible amounts in the bismuth, which com- bined with this much thorium, the product remaining in solution. A more likely possibility, we believe, is that this effect is caused by ZrF4 which was present initially in the salt at -150 ppm. This should have been extracted by the thorium and could then have been mistaken for thorium in the subsequent colorimetric determinations. It would be included as well in the material balance calculation of the thorium in the bismuth phase.
The correlation of D,, vs D,, where DM = xM ( B i j x M ( F) 9 in Fig. 13.3 is excellent, giving the expected slope of 4/3, which confirms that protactinium is tetravalent and uranium is trivalent under these extraction conditions. ;‘his correlation further indicates that interactions of t?‘ and Pao do not occur in the bismuth phase at the concentration levels involved. From the results in Figs. 13.2 and 13.3 we have:
QF, = D ~ 3 / D , , = 121 (625°C) ,
QR =DPa/DTh = 1450(625”C).
One result reported by Barton et QZ. may be used to calculate
QPh = 414 (805°C) .
The two results are given within their uncertainty by
log Qph = 2830/T . This would indicate that AS for the extraction reaction (1) is zero, a result which could well be general for such reactions which involve ions of similar size and valence in the salt phase and metal of similar character in the
* bismuth phase. The value of QK is unaffected by the presence of up to 7000 ppm uranium in the bismuth phase.
In our future measurements we expect to extend the present study to include the extraction behavior of protactinium and uranium when they are both present at high concentrations (e.g., 1500 ppm each) in the bismuth phase.
13.4 REDUCTIVE EXTRACTION OF RARE EARTHS FROM MOLTEN MIXTURES OF
LiF, BeF2, AND ThF4 INTO BISMUTH
D. M. Moulton J. H. Shaffer
Studies of the equilibrium distribution of cerium, neodymium, and samarium between the simulated MSBR solvent mixture, LiFBeF2 -ThF4 (72-16-12 mole %), and bismuth have been completed. Values for their distribution coefficients, DLn, and their separation factors, DLn/D,,, at 600 and 700°C when the bismuth was saturated with thorium are as follows:
600°C 700Oc Rare Earth
Cerium 0.077 3.67 0.157 2.64 Neodymium 0.051 2.43 0.142 2.68 Samarium 0.045 2.14 0.082 1.55
DLn DLnfDTh DLn DLnfDTh
These separation factors are based on DTh = 0.021 at 600°C and D,, = 0.053 at 700°C.
The investigation of salt composition effects on the reductive extraction of cerium into bismuth was ex- tended to two additional salt compositions.’ In the mixture LiF-BeF2-ThF4 (67-30-3 mole %), the extrac- tion of cerium by thorium can be described by the equation
K = D&/D;h = 8.2 at 600°C . At the limiting reduction potential of thorium satura- tion in bismuth, the distribution coefficient for cerium is about 0.26 and the separation factor is about 3.2 at 600OC. The equilibrium distribution of cerium between the salt solvent mixture, LiF-BeF2-ThF4 (76.8-6.2-17 mole %), and bismuth yielded a value of about 5.3 for the equilibrium constant K at 600°C. At thorium saturation in bismuth, the distribution coefficient for cerium is about 0.064 and its separation factor is about 4.4 at 600°C. This salt composition was proposed for a reprocessing scheme which would precede the reductive extraction process by a vacuum distillation process. The experimental results obtained for both of these salt mixtures are in fair agreement with the “free fluoride” model of M. A. Bredig for describing salt solvent effects on the extraction equilibrium.
’MSR Program Semiann Ron. Rept. Aug. 31,1968. ORNL- 4344, p. 176.

13.5 METAL PHASES OTHER THAN BISMUTH FOR RARE-EARTH EXTRACTION
D. M. Moulton J. H. Shaffer
By now it is well known that the extraction of rare earths from thorium-containing molten fluorides into bismuth requires large bismuth volumes, because of the low solubility of thorium, and gives rather small rareearth-thorium separations. While it is possible to design a reprocessing facility using this system, there could be practical advantages in changing the metal phase to reduce one or both of these difficulties.
There is not a good theoretical basis for choosing an alternative metal system, though, as discussed presently, our understanding of the nature of these mixtures is growing. We have investigated a number of combina- tions using a new technique, shown in Fig. 13.4. A 2-g sample of the metal contained in a small graphite cup serves as the cathode for the electrolytic reduction of labeled cerium from a 3.9-kg melt of LiF-BeF2-ThF4 (68-20-12 mole %) at 700'. A beryllium rod is used as a sacrificial anode and also as a reference at zero current. After a few hundred milliampere-hours of electrolysis (the exact time is determined, somewhat intuitively, when the potential levels out), the entire metal sample is removed and analyzed. The amount of material extracted does not affect the salt composition signifi- cantly, so it can be reused many times. The pool of bismuth in the bottom of the steel vessel extracts some of the thorium daughters (Pb-Bi-TI) which might otherwise confuse the radiochemical analysis; it is not sampled or used in any other way.
This method is useful for screening metal combi- nations because it takes only a few hours per sample, in contrast to the old way where a large metal pool was in the bottom and a new vessel and salt had to be prepared for each combination. So far we have not been able to get very quantitative results because we cannot de- termine the point of thorium saturation very well and any precipitate is necessarily included with the sample. For this reason the metals are here simply grouped into the three categories listed in Table 13.2: those ex- tracting more, about the same (within a factor of 2), and less cerium than pure bismuth (per weight of solvent metal).
It will be noted that Bi-Au is not a good extractant, in contrast to what had been reported earlier? In the present experiment the solvent contained 30% gold rather than 3% and apparently has rather different
'MSR Rogram Semiann. Rogr. Rept. Aug 31, 1968. ORNL-4344, p. 180.
192
ORNL- DWG 69- SSOB
h,
MOUNT
.
1 - C
SAMPLE
8
Fig. 13.4. Electrolytic Apparatus for Alloy Testing. Cas lines, valves, furnace, etc., not shown.
Table 13.2. Extmction of Ce from UF-BeF2-ThF4 (68-20.12 Mole %) at 700'
into Various Metals
. .
. More than Bismuth Same Less
Mg-Ag, MgCu, Sn, Bi, In-Au, Bi-Ag, Sn-Au, Bi-Sb, ALA& AEAu, AlCu SRCU Bi-Au, Pb-Au, Zn, Bi-Pt,
GeAu, Pb, Sn-A& pb-Ag
a
gP,

W . . .i
t
-
t
- . . W
properties. The Sn and SnCu both contained amounts of Th far in excess of the saturation value for pure Sn. ThSn3 undoubtedly precipitated, and the high cerium count probably is due to a solid solution of CeSna in this; the structure is the same (Cu3Au), and the lattice parameters are practically identical. We did not really expect the tin-, lead-, and zinc-based systems to be very good, but this was based on reasoning too speculative to exclude such easy experiments.
The magnesium- and aluminum-based solvents, especially the former, extracted quite a lot of rare earth. The thorium content of the aluminum was also high (the Mg was not analyzed by this writing). Cerium separation in these systems is probably lower than in bismuth. Thus they may be better suited for removing the thorium and leaving rare earths behind. The investigation of these and other metal combinations is continuing.
In addition to the experimental results, increasing familiarity with liquid-metal systems in general allows us to make certain observations on the possible altema- tives to bismuth. Ideally one would like a liquid-metal system which will form strong intermetallics with the rare earths and weak ones or none with thorium. Thorium and the rare earths are similar enough as metals so that this solvent probably does not exist, at least not if it contains one of the low-melting non- transition metals. Starting with bismuth, we can con- sider what additives might stabilize the rare earths more than thorium. Alkalis and alkaline earths will not help. Metals in the first half of the transition series are likely to be of little use and are scarcely soluble anyway. Those in the second half will form intermetallics with rare earths and thorium, but the thorium compounds will probably be stronger, except perhaps for the coinage metals. Many of these compounds owe their stability to geometric structures which will not persist in dilute solution. Posttransition metals form increas- ingly strong compounds with partially ionic bonding. Here the stabilization of the rare earths will be somewhat greater, as is seen with bismuth. To be useful, however, the relative stabilities of the rare-earth and thorium intermetallics must be such as to overcome the substantial difference in stability of rareearth and thorium fluorides. A large enough difference between rareearth and thorium alloys will probably not be found in the more electropositive metals to the left of bismuth. Of the elements which might form stronger compounds than bismuth, antimony seems to go in the wrong direction, and arsenic, selenium, and tellurium have not been tried. It is very likely that these considerations will apply to extraction systems based
193
on any of the posttransition elements. In all of these the solubility of the thorium intermetallics is a prob- lem, and stronger intermetallics may be less soluble still. The preliminary experimental results with lead, zinc, tin, germanium, and indium are in agreement with these predictions.
I t is not likely that there will be any solvents based on the ordinary transition metals with low enough melting points to be useful, though there are some interesting eutectics of cerium with 15 to 3% of the elements from Mn to Cu and also Ag and Au that melt at 400 to 600’ and should dissolve Th very well. They will probably be rather strong reducing agents and will pose severe containment problems.
Of the pretransition metals, only Mg and A1 are worth considering. These are the only good pure solvents for thorium if Hg and F’u are excluded as impractical. They are both quite active and will reduce the salt to some extent, especially magnesium; thus some alloying to lower their activity may be useful. However, this may also lower the thorium solubility.
In general, then, it looks as though improvements in reductive extraction will be fairly small as long as bismuth is used as the basis for the solvent. Of course, small improvements could be very welcome. The use of entirely different solvent systems containing mag- nesium, aluminum, or cerium could result in much higher thorium and rareearth extraction, but there would be some contamination of the salt by these metals.
13.6 SEPARATION OF CERIUM FROM THORIUM IN BISMUTH BY COLD ZONE DEPOSITION OF THORIUM BISMUTHIDE
D. M. Richardson W. R. Grimes J. H. Shaffer
In experiments conducted thus far on the reductive extraction of rare earths from LiF-BeF2 -ThF4 mixtures into bismuth, separation factors (DLn/DTh) of less than 10 have been found under equilibrium conditions and at temperatures from 500 to 800OC. Although these values may be sufficient for reprocessing the MSBR fuel solvent by the reductive extraction process, much higher values could greatly improve the plant efficiency. Accordingly, various parameters of the extraction process principle are being investigated to improve its application to the reprocessing requirements of the MSBR. To this end, an experiment is now in progress to examine the cold zone deposition of thorium from bismuth which also contains a dissolved rare earth. The chemical feasibility of this application will depend on the precipitation of pure ThBi2 rather than a coprecipi-

194
tation with the metallic rare earth. The experimental procedure embodies the extraction of cerium from a simulated MSBR fuel solvent at 700°C into flowing bismuth and its back extraction by hydrofluorination into a recovery salt mixture, as shown schematically in Fig. 13.5. The recirculating bismuth stream will be contacted with solid thorium bismuthide at 700°C to achieve its saturation with thorium. The exit stream from the extraction vessel will pass through a cold trap (outlet temperature of about 400OC) before flowing to
RECOVERY VESSEL (RARE EARTHS OXIDIZED
BY HYDROGEN FLUORIDE)
the recovery vessel. Thus the comparative transport of b, cerium and thorium to the recovery salt will indicate the effectiveness of the cold zone deposition applica- tion. At the conclusion of the experiment the cold trap will be drained of bismuth and sacrificed for analyses of its cerium content and possibly the composition of the precipitating phase. .
The objectives of this experiment have resulted in the construction of a simple pump loop which utilizes an electromagnetic device to achieve low flow rates of
0 .
. *
SATURATOR (THORIUM DISSOLVED
BY BISMUTH AT 700 "C) <
>
VHNL-OWG 69 -5509
EXTRACTION VESSEL RARE EARTHS REDUCED BY THORIUM METAL)
PRECIPITATOR (THORIUM PRECIPITATED
FROM BISMUTH AT 400 "C)
Fig. 13.5. circulating Bismuth Loop for Separating Thorium from Rare Earths by Cold-Zone Deposition.
. 1
i.
.

i
1 I -
bismuth. The hot trap and cold trap are of identical construction and depend upon tightly packed stainless steel demister material (Yorkmesh) for the retention of solids. Each trap is equipped with Calrod heaters and will be cooled by a countercurrent flow of an external air-water stream. The extraction and recovery vessels were fabricated from 4-in. iron pipe size (IPS) 304L stainless steel pipe and are fitted with graphite cylinders of '&-in. wall thickness for primary containment of the salt mixtures. Bottom penetrations provide for the circulation of bismuth through each vessel, while top penetrations provide for loading and sampling pro- cedures.
The experimental assembly contains approximately 35 kg of bismuth, which provides an approximate 1-in. depth of bismuth in each vessel. The fuel solvent mixture will be simulated by approximately 2 kg of LiFBeF2-ThF4 (68-20-12 mole %) which contains 100 ppm cerium and about 5 mc of '44Ce activity. Because of relatively large requirements, thorium will be intro- duced into the bismuth system by reduction from LiFBeFz -ThF4 (68-20-12 mole %) by added beryllium metal in the recovery section of the apparatus. When thorium reduction is complete, the recovery salt will have a composition of approximately 60 mole % LiF and 40 mole % BeF2 and a liquidus temperature of about 45OoC.
Experimental progress thus far has included the circulation of bismuth in the system with the EM pump at rates of about 50 to 200 cclmin, the addition of the recovery salt mixture, and hydrofluorination of the recovery salt while recirculating bismuth to remove oxides from the metal phase. Beryllium metal is currently being added to the recovery salt mixture incrementally to achieve thorium reduction. Upon ascertainment of near-complete removal of thorium from the recovery salt and its collection in the appropriate trap, the fuel solvent mixture will be loaded into the extraction vessel. The progress of the experi- ment will be monitored from radiochemical analyses of samples taken periodically from each salt phase and at four locations in the metal phase system. The results of chemical and spectrographic analyses of these samples for thorium, lithium, and beryllium will provide further description of the experimental results.
195
13.7 EXTRACTION OF THORIUM BY ELECTROLYTIC REDUCTION INTO FLOWING
LIQUID LEAD FROM MOLTEN MIXTURES OF LiF, BeF2, ThF4, AND
RARE-EARTH FLUORIDES
D. M. Richardson J. H. Shaffer
The experimental result of earlier unreported work was that rare earths did not reductively extract into lead from molten LiF-BeF2 (66-34 mole 96). A practical use of this finding may be that the separation of rare earths and thorium can be achieved by the reductive extraction of thorium into lead with the rare-earth fluorides remaining in the barren molten salt. Subse- quently the thorium dissolved in lead would be back extracted by hydrofluorination into a clean melt of LiFBeF2, and the resulting salt mix would be suitable for the addition of uranium fluoride and recharging as single-region breeder reactor fuel. In the absence of thorium, rare earths can be effectively extracted from the barren salt into molten bismuth.
Since the chemical feasibility of such a procedure appeared promising, a small pump loop has been constructed to test this process in a dynamic, non- equilibrium system in which the reduction of thorium is effected by electrolysis. The entire system was con- structed of stainless steel and was assembled by inert arc welding and is shown schematically as Fig. 13.6. The extraction and recovery vessels are vertically mounted 4-in. IPS tanks that are interconnected at the bottoms by two parallel, horizontal "-in. IPS lines. An ac electromagnetic pump is installed in one of the lines. The vessels are fitted with graphite sleeves of '4 -in. wall thickness for primary containment of the salt mixtures. Top penetrations provide for loading and sampling, gas sparging and venting, and insertion of insulated probes for electrolysis and level measurement.
The extraction vessel salt will be hydrogen sparged and will be exposed at its center to a noble-metal anode. A hydrogendiffusion anode thimble of 75% palladium-25% silver has been constructed for trial in initial operation. The recovery vessel salt will be sparged with a mixture of hydrogen and hydrogen fluoride. In addition to salt, both vessels will contain approximately 2 in. of recirculating liquid lead. Since the vessels are separately sparged and vented, and because the relative
w

1%
height of the liquid columns is sensitive to small differences in gas phase pressures, a liquid level inter- lock has been installed. When the liquid level in either vessel is depressed more than a preset amount, a level probe open circuit occurs which opens a fast-acting valve connecting the two gas volumes, turns off the pump, and disconnects power supplied to the anode. Manual reset is required.
The net effect of this process is to transfer the thorium fluoride in one container of salt to another, and the total mass of salt remains constant. In each container, however, there are large changes of salt volume and density from the beginning to the end of the transfer. Provision.has been made to follow the progress of the transfer on a periodic basis by meas- urements of salt density using a bubble-pressure vs liquid-depth probe. Additionally, salt samples will be taken.
I If the composition of the simulated MSBR fuel solvent is selected as LiF-BeF2 -ThF4 (65-23-12 mole %), the reduction and removal of all thorium electre lytically (i.e., no added metals) would result in the binary mixture LiF-BeF2 (73.8-26.2 mole %), which melts at about 625°C. However, the lead stream at saturation with thorium (-200 ppm) will contain about 10 ppm lithium. Thus, assuming a constant transport ratio of 1.66 mole of Li per mole of Th, the resulting binary salt mixture should contain about 66 mole % of LiF and the balance of BeF2 and should melt at less than 500°C. Accordingly, this experiment will be conducted with these salt mixtures. Experimental status at this time is the successful operation of the pumped loop with a charge of hydrogen-fired lead. After additions of the appropriate salt batches, isothermal operation at 600°C will be initiated.
t
I
t
ORNL-DWG 69-5510
H, SPARGE.. H2 DIFFUSION ANODE PROBE
-
EXTRACTION
H p - HF SPARGE, LEVEL, SALT DENSITY PROBE
SAMPLE PORT
RECOVERY VESSEL
Fig. 13.6. Circulating Lead Loop Thorium Electrolyzex.
. v . 1

l - .
j + 1 . .
,
14. Development and Evaluation of Analytical Methods for Molten-Salt Reactors
J. C. White
14.1 DETERMINATION OF OMDE IN MSRE FUEL
A. S. Meyer
The first sample of the 233U fuel (FP 17-5) was analyzed by the hydrofluorination procedure, and a concentration of 61 ppm was determined. A satis- factory recovery of oxide from an SnOz standard indicated that the apparatus was functioning reliably. This concentration does not differ significantly from that found through the 235U operation (54 * 8
During the last few analyses a potential failure of the oxide apparatus was noted. Increasingly high pressures are required to maintain the flow of gas through the system during the hydrofluorination step. This increased Ap 'apparently occurs across the NaF trap that is used to separate HF from water in the effluent gas. It is assumed that during the re- peated absorption and regeneration steps the absorb- ent particles degraded to form a more tightly packed bed, particularly at the entrance end of the trap. As these more closely packed particles swell during HF absorption, the flow is restricted.
The problem has not yet interfered with any anal- yses; but, on the basis of a rough extrapolation, only a few more analyses can be made before it will be necessary to replace the trap. The shutdown of the MSRE is imminent, and the replacement of the trap would be expensive and involve radiation ex- posure to personnel. It has been decided, therefore, to defer replacement at this time and to restrict determinations to essential MSRE samples. If the technique is applied to the in-line analysis of MSR salt streams, it will obviously be necessary to pro- vide remotely replaceable traps.
R. F. Apple J. M. Dale
PPm)*
14.2 DETERMINATION OF THE OXIDATION STATE OF CONSTITUENTS
OF MSRE FUEL
J. M. Dale A. S. Meyer
R. F. Apple J. E. Caton
C. M. Boyd
The measurement of the redox condition of the 233U fuel is currently the most important analytical development problem remaining for the MSRE. It is believed to influence corrosion rates, it affects the distribution of certain fission products within the reactor system, and it is readily adjustable via the addition of beryllium metal. Accordingly, the main development effort has been directed toward the development of techniques for this measurement. Three diverse approaches have been pursued.
14.2.1 Determination of Total Reducing Power of MSR Salts
A sealed-tube dissolution technique has been ap- plied to the determination of the total reducing power of radioactive MSRE fuel. Preliminary feasi- bility studies of this approach are described else- where.' A special apparatus was required for this determination. The requirements were that the ap- paratus would provide a means of evacuation and sealing of the dissolution tubes and be compact enough to be transferred between hot cells. A photograph of the apparatus is shown in Fig. 14.1. Fragments of salt weighing about 250 mg are placed in a dissolution tube that is fitted with a break seal
R. F. Apple and A. S. Meyer, MSR PrOgrmn Semiann. Rogr. Rept. Aug. 31,1968,ORNL.4344, p. 189.
197
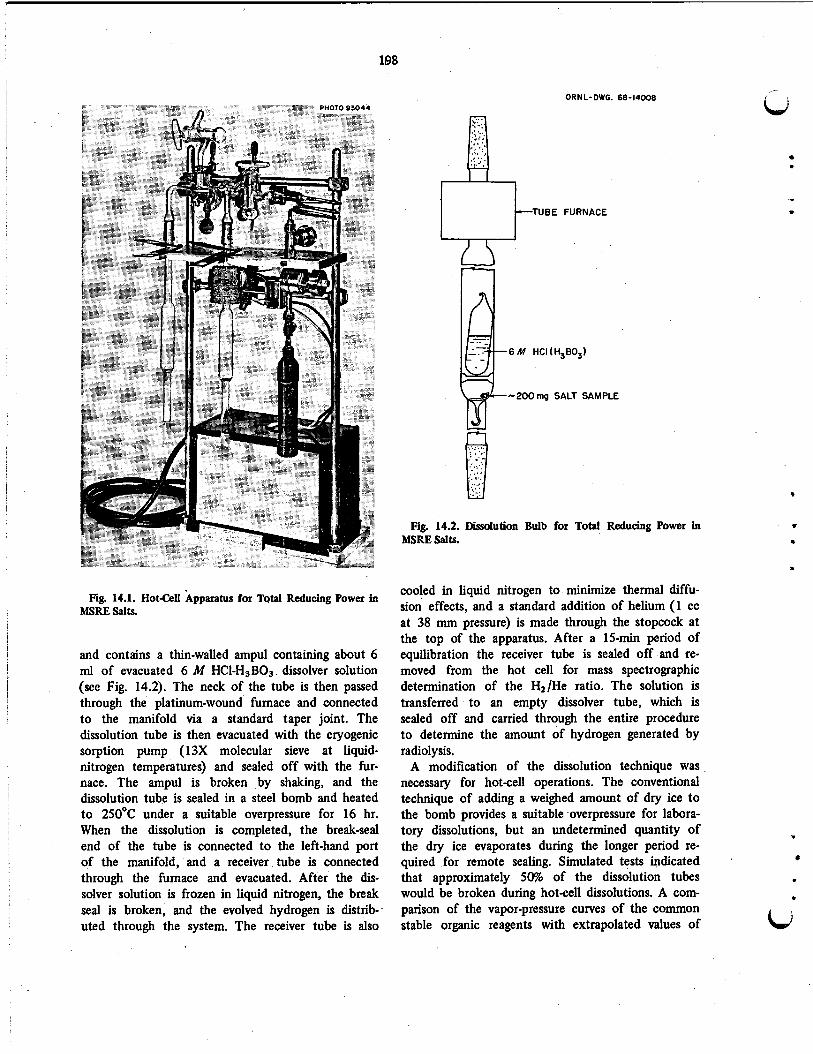
ORNL-DWG. 68-14008
Fig. 14.1. HotCell Apparatus for T ~ t d Reducing Power in MSRE Salts.
and contains a thin-walled ampul containing about 6 ml of evacuated 6 M HCl-H3B03 dissolver solution (see Fig. 14.2). The neck of the tube is then passed through the platinum-wound furnace and connected to the manifold via a standard taper joint. The dissolution tube is then evacuated with the cryogenic sorption pump (13X molecular sieve at liquid- nitrogen temperatures) and sealed off with the fur- nace. The ampul is broken by shaking, and the dissolution tube is sealed in a steel bomb and heated to 25OoC under a suitable overpressure for 16 hr. When the dissolution is completed, the break-seal end of the tube is connected to the left-hand port of the manifold, and a receiver tube is connected through the furnace and evacuated. After the dis- solver solution is frozen in liquid nitrogen, the break seal is broken, and the evolved hydrogen is distrib- uted through the system. The receiver tube is also
r;: ; ,! ... ,; .. ':.. .:' . ,
: :. .. ;
n
-TUBE FURNACE
Fig. 14.2. Dissolution Bulb for Total Reducing Power in MSRE Salts.
t
* . cooled in liquid nitrogen to minimize thermal diffu- sion effects, and a standard addition of helium (1 cc at 38 mm pressure) is made through the stopcock at the top of the apparatus. After a 15-min period of equilibration the receiver tube is sealed off and re- moved from the hot cell for mass spectrographic determination of the H2/He ratio. The solution is transferred to an empty dissolver tube, which is sealed off and carried through the entire procedure to determine the amount of hydrogen generated by radiolysis.
A modification of the dissolution technique was necessary for hotcell operations. The conventional technique of adding a weighed amount of dry ice to the bomb provides a suitable overpressure for labora- tory dissolutions, but an undetermined quantity of the dry ice evaporates during the longer period re- quired for remote sealing. Simulated tests indicated that approximately 50% of the dissolution tubes would be broken during hotcell dissolutions. A com- parison of the vapor-pressure curves of the common stable organic reagents with extrapolated values of
-
. bj

the pressures reported for 6 M HC12 revealed that the pressure of the dissolver solution was most closely paralleled by that of methyl alcohol. When 10 ml of methyl alcohol was sealed into the bombs, no breakage occurred.
The method was originally developed to determine free metals in the reprocessed solvent salt. When the apparatus was completed, uranium additions to the fuel had already been started, and an attempt was made to apply it to the determination of U(II1). The results of the analyses of two fuel samples are summarized in Table 14.1.
During the period between samplings sufficient beryllium metal was added to the reactor fuel to increase the yield of hydrogen by 0.55 micromole/g. Also, some LiUFs fuel concentrate was added. The calculated increase in the hydrogen yields was not obtained. It is evident that the method in its present form is not suitable for the determination of U(II1) in these samples. The hydrogen is derived pre- dominantly from dispersed metal in the samples; and because a fragment that represents only about 2% of the sample is taken, any inhomogeneities in the distribution of the metals in the frozen salt would yield nonrepresentative samples. Also, the weighing and transfer of the salt fragments in the hot cell is time consuming, and this atmospheric exposure may introduce significant indeterminate oxidation errors.
The technique offers high sensitivity, and a special- ized sampling approach will undoubtedly prove of value for reducing-power measurements of other types of MSRP samples. As time permits, studies will be resumed to determine its ultimate sensitivity and precision and to determine its limitations as to sample size and types of salts that can be dissolved.
14.2.2 Determination of U(III) in Radioactive MSRE Fuel by a Hydrogen Reduction Method
The application of this method to the determina- tion of U(II1) in the original 2 3 s U fuel and the development of a remote method for the measure- ment of HF generated by the hydrogenation of the current U fuel have been described previ~usly.~ 94
When the precision of the remote determination of HF was demonstrated to be adequate for the meas-
2Z. I. Simkhovich, J. Appl. Chem USSR 30, 1312 (1957). -
3J. M. Dale, R. F. Apple, and A. S. Meyer, MSR bogram Semirmn hog. Rept. Aug. 31, 1967, ORNIA191, p. 167. 4J. M. Dale e t al., MSR Rogmm Semiann Pmgr. Rept.
Aug. 31, 1968, ORNL4344, p. 188.
199
Table 14.1. Total Reducing Power of Fuel Salt
Sample Sample FP-15-5 FP115-25
Uranium, ppm Nickel, ppm Iron, ppm Chromium, ppm Total H2, micromoles/g Blank car., mimomoles/g Nickel COH., micromoles/g Iron car., micromoles/g Chromium COP., micromoles/g U* equivalent u*//xu, %
4730 46
140 42
4.07 0.22 0.78 2.5 1 0.1 1 0.44 4.3
7340 51
140 50
3.69 0.22 0.87 2.51 0 0.09 0.6
urement of HF in the effluent from the hydrogena- tion of 233U fuel, an apparatus was assembled to simulate the hydrogenation of radioactive salt sam- ples. This apparatus consisted of a copper block furnace fitted with a nickel liner of internal diam- eter equal to that of a sample ladle, appropriate sparging and exit tubes, and an addition port. The hydrogenator was heated with a precision furnace that maintained a temperature differential of less than 5°C over the region occupied by the sample. Provision was also made to change the depth of the melts to determine whether equilibrium was closely approached during the hydrogen transpirations.
Before salt was added to the hydrogenator, pulses of HF in a stream of hydrogen were passed through the system to determine the time constant of -the apparatus. A portion of the HF was delayed in the apparatus. This delay is apparently caused by adsorp tion on the surface of the hydrogenator, since the effect becomes less pronounced when successive pulses are introduced. The period of delay is on the order of 1 hr and is the result of chemisorption, as the retention period increases with temperature. The adsorption is stronger on nickel than on copper surfaces. By comparison of the shape of the HF pulses with those of an unadsorbed gas, argon, the quantities of HF adsorbed were estimated to be about 2 to 3 micromoles. Adsorption of such quan- tities of HF would not introduce a significant error in the results of the analysis of the 23sU fuels, but a complex correction would be required for the lower yields expected from the 233U fuel. I t should be noted that while the adsorption of HF compli- cates batch analyses of the fuel, it would not inter- fere with in-line methods.. Surfaces would become rapidly saturated, so that the steady-state concentra-

200
tion of HF in the effluent would correspond to its rate of production in the fuel.
Investigation of the method was discontinued temporarily because the voltammetric method, de- scribed in the following section, gave promise of more immediate results.
. 14.2.3 Voltammetric Determination of U(IV)/U(III) Ratios in MSRE Fuel
An apparatus has been designed to permit electro- chemical measurements in a sample of radioactive MSRE fuel. The objective of this work is to measure the potential (E3,,J of the U(IV) to U(II1) reduc- tion wave vs the potential (li) of a platinum refer- ence electrode which is poised by the bulk concen- tration of U(IV) and U(II1) in the melt. The differ- ence between these two potentials gives a measure of the U(IV)/U(III) ratio, as shown in Fig. 14.3. This has been verified in nonradioactive melts, and the experimental results are described in the next section of this report.
The electrochemical cell (Fig. 14.4) was designed so that the measurements could be made directly in the sampling ladle. The ladle is cut at a prescored point below the level of the salt, and the lower portion, which contains the bulk of the salt, is placed in a nickel liner. Both are then placed in the cell. This operation can be completed in about 5 min to minimize atmospheric contamination of the sample. The top of the cell is fitted with a Teflon bushing which is penetrated by three '/g-in. metal electrode support rods and a sparging tube. The electrodes (-50-mil platinum-rhodium wire) are sheathed with boron nitride insulators, which define their area and prevent electrical contact between electrodes or with the cell walls.
A cell identical to the one which is to be installed in the hot cell was used in the laboratory to carry out measurements on a sample of simulated MSRE fuel. It was shown that the U(II1) in the molten salt was stable in the system and that a 5-min exposure of the surface of the solid salt to the atmosphere did not change the U(II1) concentration upon re- melting.
The electrochemical cell is being installed in the hot cell, and it is planned to make measurements on a sample of radioactive MSRE salt.
t c-
a z w K 3 0
C
T
TEFLON
U(rn)-, ucm,
.~ I - 0 -0.2 -0.4 -0.6 -0.8 -1.0 -f.2 -1.4
APPLIED POTENTIAL (volts vs saturated nlckcl mference 1
Fig. 14.3. Electrochemical Analysis of U(IV)/U(rII).
ORNL-DWG. 68-13739
I BORON NITRIDE
m k-1 i n . 4
f
.
T
e
Fig. 14.4. Electrochemical Cell for U(IV)/U(III) Ratio De- termination in MSRE Fuel.

14.3 EMF, VOLTAMMETRIC, AND SPECTROPHOTOMETRIC MEASUREMENTS
ON THE U(IV)/U(III) COUPLE IN MOLTEN Li-BeF2 -ZrF4
H. W. Jenkins’ Gleb Mamantofl J. P. Young
D. L. Manning
When the MSRE fuel is in a reducing condition, the U(IV)/U(III) couple determines the redox condi- tion of the salt. The measurement of the U(IV)/U(III) ratio is therefore essential to a funda- mental understanding of fuel chemistry.
Potentiometric determination of this ratio requires the value of the standard electrode potential of the U(IV)/U(III) couple relative to the standard elec- trode potential of a reference couple. The standard potential of the U(IV)/U(III) couple was calculated with respect to a hypothetical unit mole fraction Ni/Ni(II) electrode (arbitrarily set at 0.0 v) from emf measurements on the galvanic cell PtlU(IV), U(III)I(Ni(II)INi. The cell consisted of an Ni/Ni(II) reference electrode contained in a boron nitride compartment and a platinum wire immersed in a melt containing U(II1) and U(1V). The cell potential was measured as a function of the U(IV)/U(III) ratio, which was varied by the controlled reduction of U(IV) to U(II1) with a zirconium rod immersed in the solution. Measured cell potentials were cor- rected, using the Nernst equation, to values vs a unit mole fraction Ni/Ni(II) electrode. The corrected po- tentials were plotted vs log [U(IV)/U(III)] ; the slope of a line through these points agreed well with the theoretical slope predicted by the Nernst equation. The standard potential of the U(IV)/U(III) couple, corresponding to a U(IV)/U(III) ratio of 1, was found to be 1.48 2 0.01 v at 500OC.
A simple voltammetric method was also developed for the determination of the U(IV)/u(III) ratio, when U(1V) > U(II1). This method should be gen- erally applicable to the determination of the ratio Ox/Red, where Ox and Red are the oxidized and reduced forms of the reversible soluble couple Ox + ne = Red. The method involves the measurement of the potential difference between the equilibrium po- tential of the melt, measured by an inert platinum electrode immersed in the melt, and the voltam- metric equivalent of the standard potential of the
For linear sweep voltammetry at a stationary elec- trode, the polarographic half-wave potential E,;, corresponds to the potential on a voltammogram at which the current is equal to 85% of the peak
YIV)/U(III) couple, E,/,:
201
Table 14.2. Determination of U(lv)/U(llI) Ratios
E vs Equilibrium
Calculated MeaSlKed
U(IV)/U(III) U ‘‘‘potential (v) Rat id (mole %)
140 ”0.3 -0.329 -0.345 29.3 “0.3 -0.225 -0.225 6.7 “0.3 -0.127 -0.130
10 “0.15 -0.153 -0.175
“Determined from spectral measurements.
current. This assumes a reversible couple with both oxidized and reduced forms being soluble, which is the case for the U(IV)/U(III) couple.
The equilibrium potential of the U(IV)/U(III) couple is given by
2 3RT U(IV) Ees = E “ +-log -
nF U(II1) ’
and since E,,, is approximately equal to E“,
Simultaneous with the emf and voltammetric meas- urements on the U(IV)/U(III) couple, samples were withdrawn for a spectrophotometric determination of both U(1V) and U(I1I) directly in the fused salt. The samples were contained in graphite windowless cells. Each sample was allowed to solidify and was then transferred to a heated spectrophotometric facility. The complete operation was performed without ex- posing the sample to the atmosphere; such exposure would probably alter the oxidation state of the solute. On remelting the sample in a helium atmo- sphere, its spectrum was obtained. The absorbance of U(IV) was determined at 640 nm and that of U(II1) at 360 or 890 nm, depending on its concen- tration
A comparison of the spectrophotometric and volt- ammetric results is shown in Table 14.2. Determina- tion of the U(IV)/U(III) ratio yielded results in good agreement with values determined spectrophotometri- ’ cally over a range of about 140 to 7. This method has several advantages: (1) no other reference elec-
’ORAU Fellow, University of Tennessee. %onsultant, Department of Chemistry, University of Ten-
‘J. P. Young, Inorg. Chem 6, 1486 (1967). nessee.

202
trode is required, (2) no standard electrode poten- tials need be known, and (3) the electrode area need not be known in order to determine the U(Iv)/v(III) ratio.
14.4 EMF MEASUREMENTS IN MOLTEN FLUORIDES
H. W. Jenkins' D. L. Manning Gleb Mamantovd
The nickel/nickel(II) couple, contained in a boron nitride compartment, was demonstrated to be a use- ful reference electrode for emf measurements in molten fluorides? Utilizing the nickel/nickel(II) ref- erence, the program of emf measurements was con- tinued on galvanic cells of the type NilNiF211Mn+IM and NilNiF211Mn+IMm+JPt, and the standard elec- trode potentials evaluated so far are shown in Table 14.3. It is believed that the agreement between the measured values and those calculated by Baes is quite good, even though the solvents were not the same. The standard electrode potentials for Fe(II)/Fe and Fe(III)/Fe(II) relative to nickel were evaluated in both LiF-BeF2 -ZrF, and LiF-NaF-KF (FLINAK). FLINAK, having a higher concentration of free fluo- ride ions than LiF-BeF2 -ZrF4 , did not appreciably change the value of the Fe(II)/Fe couple; however, the Fe(III)/Fe(II) standard potential exhibited a
8D. L. Manning, H. W. Jenkins, and Gleb Mamantov, MSR Rogram Semkznn. Rogr. Rept. Feb. 28, 1967, ORNL.4119, p. 162.
U cathodic shift of 366 mv. I t is believed that this is attributable, in part, to a greater complexing affinity of fluoride ions toward Fe(III) than Fe(I1).
The wetting of the boron nitride reference elec- . trode compartment by the two melts was observed to be quite different. FLINAK wets the boron ni- tride quite rapidly; the resistance is lowered to e
<lo00 ohms in 24 to 48 hr at 500°C; in LiF-BeF2- ZrF4, 10 to 14 days are required to lower the resistance to about 10 kilo-ohms at 500°C. The difference in wetting ability of the two solvents appears to depend on the free. oxide content of the melts. In support of this it was observed that LiF- BeF2 wets the boron nitride at about the same rate as FLINAK. The LiF-BeF2 differs from LiF-BeF2- ZrF4 by the 5 mole % ZrF4 which is added to precipitate free oxide as insoluble Zr02. An alter- nate explanation is that wetting is a function of the free fluoride concentration and is delayed in melts containing negative free fluoride.
*
14.5. DEVELOPMENT OF A MOLTENSALT SPECTROPHOTOMETRIC FACILITY
FOR HOTCELL USE
J. P. Young
Work on the molten-salt spectrophotometric facil- ity for hot-cell use has continued? The contract for
'3. P. Young, MSR Ptogram Semiann. Rept. Aug 31, 1968, ORNL4344, p. 192.
Table 14.3. Standard Electrode Potentials in Molten Fluorides
Measured Electrode Potentiale (v)
at 500" at 500" 5oo"c Electrode Couple In LiF-BeFz-ZrF4 In LiF-NaF-KF
~
-2.120 -2.21 1 -1.742 -1.772 -1.480 -1.517 -0.701 -0.5 14 -0.410 -0.390 -0.413 0.000 0.000 0.0 0.166 -0.200
%mdard state for all solutes except beryllium(I1) is the hypothetical unit mole fraction solution. The beryllium(II) standaxd state is the solvent com osition LiF-BeF2 (66-34 mole %).
[C. F. Baes, Jr., Thermodynamics, vol. 1, IAEA, Vienna, 1966 (values in LiF-BeF2, converted to 500°C).
e
*
.
LJ

203
the design and fabrication of the extended optical path has been awarded to Cary Instruments, of Varian Associates; delivery of the completed system, including a Cary 14H spectrophotometer, is sched- uled for August 1969. The general arrangement of the spectrophotometer, the extended optical path into and out of the hot cell, and the various com- ponents required for handling the radioactive molten
hd . i
0
fluoride salt samples are shown in Fig. 14.5. A description of the design and function of the pieces of equipment shown in the hot cell was given pre- viously? Fabrication of the optics furnace, top as- sembly, and transport container has been completed; fabrication of the sample loading furnace is almost complete. The completed pieces of equipment have undergone preliminary testing, and where necessary they have been modified to improve their functional operation. Not shown in the figure are the various service lines, such as water, electrical, vacuum, and helium, or the various traps for vacuum operation or radioactive gas retention, which are necessary for
0
c
e
* . 0
u
proper performance of the system. Design of these components is presently under way. Decontamination of the hot cell, cell 7 of Building 3019, where the facility will be installed, has been completed. F. L. Hannon (General Engineering Division, OWL) has assisted in all these operations.
The joint electrochemical-spectrophotometric study of the determination of U(III)/U(Iv) mixtures in simulated MSR fuel, described elsewhere in this sec- tion, carried out in cooperation with Jenkins, Man- ning, and Mamantov, was quite helpful. The excel- lent correlation of analytical results for this ratio by two independent methods, directly in the melt, pro- vide a very firm basis on which to proceed in the development of both methods for use with reactor fuels. The method of sampling for spectral measure- ments closely parallels the procedure to be used in the transfer of a sample of MSR fuel from the reactor to the optics furnace? The main differences result from the nonradioactive nature of the present case and the fact that the sample was caught and
ORNL-DWG 69-32521
TOP ASSEMBLY
MANIPULATOR ARM I
SAMPLE LOADING FURNACE7 I .
TRANSPORT CONTAINER / / f
Fig. 14.5. Spectrophotometer Installation.

204
3d9
3d8
3d7
3d6
3d5
3d4
3d3
38
3d'
removed directly in a windowless cell. In the MSR procedure, 5 g of sample will be removed from the reactor and dispensed, without exposure to the atmosphere, into several windowless cells for spectral determination. Path-length determination of liquids confined in windowless cells is generally difficult. With the captive liquid cells we use, the path length of molten fluoride salts contained therein will be approximately 0.7 cm (*lo%). One point that be- came obvious in the electrochemical-spectrochemical study was that the intensity of the U(IV) absorption peaks could be used as an internal standard to check the path lengths of the melts held in the cell. This improves the accuracy .of the U(II1) measurement. In the MSR samples the total uranium concentration will be known from other analyses, so the path length of MSR melts in windowless containers can be calculated from this knowledge and the intensity of the VgV) absorption peaks in the sample. If the
-
-
-
-
-
-
-
-
-
U concentration of U(II1) happens to be large, correc- tions of the U(1V) concentrations wil l be necessary, of course, and can be applied.
8
14.6 ABSORPTION SPECTRA OF 3d TRANSITION-METAL IONS IN MOLTEN Li-BeFz
Further spectral studies of 3d transition-metal ions in molten fluoride salts have been carried out. A summary of the absorption spectra of the ions that have been studied in molten LizBeF4 is presented in Fig. 14.6. The information in the legend describes how to interpret the figure. Horizontal lines show general areas of absorptions, and vertical lines denote peak and shoulder positions. Relatively weak absorp tions are noted. The regions where the absorption of these solutions becomes very intense are shown as non-d-d transitions. The , solvent LizBeF4 is trans-
r
, J. P. Young *
ORNL-DWG. 68-14183
I W c-)( NiUS) -
LEGEND ABSORPTION
TENTATIVE - NON d-d TRANSITION
--c- W
Sh P Fe (E)
Sh P - Ti(III) I I
WAVENUMBER (cm-' x ~
38 36 34 32 30 28 26 24 22 20 I 8 16 14 12 IO 8 6 I I
I I I I I I I I I I 1 I I l l 300 350 400 450 500 550 600 700 800 900 loo0 (200 %XI 1800
WAVELENGTH (nm)
w
.
v
. iJ Fig. 14.6. Absorption Peaks of M Solutions in Molten LlF-BeFz at 550°C.

205
6.' 6 . 5 -
t
1
. a
LJ
parent over this range of wavelengths. At least one example of each 3d" configuration, except 3d5, has been observed. Except for Fe(II), Ni(II), Cl(II), and Cr(III), which were described earlier," the figure is comprised of data that have been collected this period. Molar absorptivities are not known accurately yet but in all cases appear to be less than -20. From the weak intensity of the spectra, coupled with the position of the spectral peaks, it is reason- able to assume that these solute ions are situated in high symmetry, possibly Oh, in these melts. Excep- tions to this generality are Ti(II1) and Fe(II), which may be distorted for 0, symmetry by Jahn-Teller effects. Although many of these ionic species are not of direct importance to MSR melts, it is desired to obtain such related spectral data for several rea- sons: 1. Such data provide a broader basis on which to
generalize about the nature of solute species in fluoride melts.
2. They provide background information to apply to new areas of interest and applications as they occur.
3. They demonstrated that the techniques, appara- tus, and methods of preparation are adequate to handle and maintain unusual or reactive oxidation states of certain elements. For example, Ti(1II) was made from Tio + Ti(IV); V(II) was prepared in the melt by reacting
The study of the effect of solvent composition on the coordination and spectrum of solute species in fluoride melts is also continuing? The spectrum of Co(I1) is not altered, even in an Li2BeF4 melt that is made BeF2-rich to LiF-BeF2 (6040 mole %). Considering stabilization energies for octahedral co- ordination, it would be expected that the coordina- tion of Co(II) could most readily be changed from octahedral to tetrahedral9 as the solvent composition is altered. Further studies of coordination behavior are under way.
with Fe(I1I).
14.7 EFFECT OF REDUCTANTS ON METACFLUORIDE-SALT W E m G BEHAVIOR
J. Braunstein Because of the practical implications arising from
changes in the wetting behavior of molten fluoride salts, particularly LiF-BeF2-base salts, it is of value to describe our experimental observations of these
J. P. Young K. A. Romberger
'OJ. P. Young, znorg. ha, in press.
phenomena. These observations were generally made peripherally after some other experiment. Wetting and nonwetting behavior is summarized in Table 14.4. Most of these observations were made on cooled samples that had been prepared for window- less-cell spectroscopy. It is assumed that no gross change in contact angle occurred on freezing, and, in fact, those solutions which appear wetting as solids were more prone to run out of windowless cells when molten. Evidence to support this comes from visual observations made during filtrations of molten LiFBeF? through sintered-nickel frits. In these ex- periments an LiFBeFz melt which was in contact with a hydrogen atmosphere and beryllium metal completely wet a sintered-nickel frit during filtration, while a similar melt in the presence of hydrogen but in the absence of beryllium remained completely nonwetting to the frit during filtration. The typical appearance of a wetting and nonwetting layer of LiF-BeF2 on a nickel frit is shown in Fig. 14.7.
The mechanism for this wetting action is un- known, but certain generalizations can be made. From Table 14.4 it can be noted that all containers are electrical conductors. In all cases when very active metals are in contact with melts containing one or several of their dissolved solute species, wet- ting occurs. Nickel was not wet by melts that con- tained dissolved Ni(I1); nickel is a relatively noble metal. It is interesting to note that U(IV)/U(III) mixtures which contain no do not wet, while melts containing only Sm(I1) do wet. This may imply that, under the experimental conditions of the test, U(II1) did not disproportionate t o where Sm(I1) did disproportionate to yield Smo. In the Nd(III)-Ndo case, no evidence of Nd(I1) was seen spectrally, but wetting occurred. LiF-BeFz which contained added, and relatively insoluble, oxides did not wet. This is perhaps in line with the generally observed fact that molten LiF-BeF2 does not ini- tially wet Si02 containers. In-Table 14.4, salts and metals in parenthesis indicate that these states were present as a result of the container material or as a result of chemical reaction. In the latter case spec- tral proof of this species was obtained. Further studies are planned to investigate the electrochemical and chemical causes for this behavior.
14.8 DETERMINATION OF CONTAMINANTS IN THE BLANKET GAS OF NaBF4 TESTS
R. F. Apple A. S. Meyer
The off-gas system of the circulating fluoroborate loop has been found to be contaminated with a

206
hs Table 14.4. Wetting Behavior of Various Fluoride Melts
Molten Solution Contacting Reductant
Container Material Wetting
LiF-BeF2 None Graphite, copper, nickel No LiF-BeF2 H2 (1 a h ) Nickel No LiF-BeF2 Beryllium Graphite, copper, nickel Yes
LiF-BeF2 + (BeO), LiF-BeF2 + (Th0~)~
LiF-BeFz-ZrFb LiF-BeFz-ZrFd LiF-BeFz-UF4-UF3, U(IV)/U(III) = >140 to 7 LiF-BeF2-UF4-UF3 LiF-BeF2-U(IV)-U(V) LiF-BeFz-NiFz (1%)
LiF-BeFz-TiF4 (1-2%) LiF-BeFz-TiF4 (TiF3) LiF-BeFz-NdFs LiF-BeF2SrnFj (SmF2) LiF-BeFz-EuF3 (EuF2) LiF-BeFzSrnFz
LiF-ThF4 LiF-ThF4 LiF-ThF4
None None None Beryllium or zirconium
None Uranium or beryllium None
Nickel None Titanium Neodymium Samarium Europium None
None '
Thorium (Thorium)
Graphite Graphite Graphite Graphite Graphite Graphite, copper Graphite
Nickel Graphite Graphite
Copper Graphite Graphite Copper Graphite Graphite Thorium
No No No Yes No Yes No
No
No Yes
Yes Yes Yes Yes No Yes Yes
0 4 2 3
1111111111111 INCHES
Fig. 14.7. Appearance of LiF-BeF2 in Contact with a Nickel Frit. Top, nonwetting; bottom, wetting.
t
bj

207
dense corrosive liquid and a white solid. Both of these materials are deposited, at least in part, at points remote from the pump bowl and could intro- duce maintenance problems when NaBF., is used as an MSR coolant salt. The white deposit was found to consist of agglomerated particles of an NaBF4 aerosol, which can be removed by mechanical means, so the analytical effort is being concentrated on the liquid deposits.
The liquid deposits were originally thought to be associated with pump oil, but their almost complete solubility in water indicates that they are inorganic. Initial samples were dark brown, but one sample was transparent with a greenish-brown tinge. The material appears to be volatile, since in at least one case a deposit was observed to dry up during later opera- tions of the loop. Collection rates decreased during the loop operations. The total quantity collected was not precisely measured but was estimated to cor- respond to a few hundred parts per million of con- taminant in the salt charged to the loop.’ ’
A. A. Palko” suggested the material was an equi- librium mixture of hydroxyfluoroboric acids, which are almost always formed from the reaction of BFa with traces of adsorbed moisture when BFs is first introduced into a metal system. It was not possible to confirm this analytically because the samples were not available in a weighable form. The samples were collected in a I-ft section of l-in. borosilicate glass pipe fitted with brass end plates and packed with stainless steel mesh. The composition of the original samples was probably altered through loss of BFa on attempted transfer. In subsequent samples a vis- ual estimate of the quantity of liquid was made, and the fitting on the end of the trap was then opened under water. Copious fuming was observed, with the formation of an evanescent white scum (presumably boric acid) on the surface of the water. After the initial reaction had subsided, the trap was washed with water to yield a turbid solution. The combined solution was analyzed to determine the total quan- tity of soluble material present.
Some generalizations can be made for the liquid samples analyzed. The predominant components are fluorine and boron, present in a ratio slightly in excess of 3 to 1 after corrections ‘are made for fluoride combined with cation contaminants. Stain- less steel corrosion products are present in ppm to percentage range, with iron and chromium predomi-
1 ‘A. N. Smith, Reactor Division, personal communication. ‘2Chemistry Division.
nating. Varying quantities of silicon and sodium are present, along with traces of copper. Some plating of copper on the stainless steel packing was also observed.
The analyses are consistent with a liquid of aver- age composition of BFsHaO which at room tem- perature contains a complex equilibrium mixture of fluoroboric and hydroxyfluoroboric acids.’ 3 L. 0. Gilpatrick has found that the oxygen in NaBF4 is not completely removed by the heating and evacua- tion treatment used to prepare the loop’s charge. Approximately 200 ppm remain, probably as NaBF30H or its hydrate. He has found that this oxide is removed by sparging with BF3.
Since the liquid is no longer being collected in the off-gas system, it will not be possible to characterize it unambiguously. In view of the above information we plan to assume that it consists of BF3 hydrates, to generate such hydrates within a laboratory sys- tem, and to study their transfer and develop meth- ods for removing them from off-gas streams. A gas train consisting of fluorothene traps connected by Teflon tubing has been assembled to perform these tests. The fast trap was charged with water and sparged with an equimolar mixture of BF3 and helium. When no further increase in the volume of the solution was noted and BF3 passed freely through the system, the delivery tube was withdrawn to a point just above the solution, and the effluent gas was passed through two traps cooled in an ace- tone-dry-ice bath. This temperature is not sufficient to condense BF3. Liquid was observed to be trans- ferred at a significant rate. After 40 hr sparging at 100 cc/mm approximately 0.5 cc was collected. The trapping was obviously of low efficiency, since com- parable quantities were collected in both of the traps. The traps have now been packed with Teflon- 6, and the experiment will be repeated to try to obtain valid transfer rates. When a reliable rate has been established, various adsorbents will be inter- posed between the source and collection traps. We plan fast to test molecular sieves because of their high capacity and convenience in handling. A large- pore (13X) sieve will be tested as a total adsorbent of the hydrate. Also a 3A sieve will be evaluated to determine if these compounds can be dehydrated.
‘3Chxistian A. Wamser, J. Am Chem. Sot. 73, 409 (1961).
208
14.9 DETERMINATION OF BISMUTH IN MSRP SALTS
W. R. Laing C. Feldman G. Goldberg
P. F. Thomason
T. H. Handley
The use of the liquid-metal extraction system pro- posed for the reprocessing of molten-salt breeder reactor fuel will generate return streams to the reac- tor that may be contaminated with bismuth. During the lifetime of a power reactor, trace concentrations will represent a cumulative transfer of substantial quantities of bismuth. More sensitive methods are needed to determine the concentration of bismuth that is introduced to MSRP salts during extraction steps and to evaluate the efficiency of methods for stripping bismuth from salts. A number of groups have carried out development studies by diverse methods. Only a brief summary of this work will be presented at this time; a more detailed report will be made when optimum methods have been selected.
14.9.1 Polarography
The first salt samples were analyzed by derivative polarographic measurements in perchloric acid media. For LiF-BeF2 and LiF-BeF2 -ZrF4 samples, detection limits are approximately 20 ppm. Because the ura- nium and bismuth waves are too close (-0.1 v) for complete resolution, a positive bias is encountered in the analysis of uranium-bearing fuels. The method is not considered to give accurate results for typical fuel compositions containing less than about 100 ppm bismuth. It has been discontinued in favor of the spectrophotometric method described below.
14.9.2 Spectrophotometry
Both potassium iodide and thiourea give selective color reactions of approximately equal sensitivity. The iodide reagent is favored because the solid rea- gent can be added with little dilution of the sample solutions. By the use of 5- optical paths, measure- ments can be extended to the 10-ppm range for 1-g samples. No interference results from the usual con- centrations of corrosion products; up to 200 pg of iron and copper can be tolerated. Uranium inter- ference begins at about the 5-mg level but can be eliminated by the use of a sample blank. This is the method now used for routine analysis. Recent sam- ples have contained undetectable quantities of bis- muth.
14.9.3 Emission Spectrography LJ The detection limits for bismuth in a dc arc are
approximately 30 ng, but it is possible to introduce only a few milligrams of the salt to an arc, and the measurement is subject to interference from the
nary experiments using tracer techniques have dem- onstrated that it is possible to quantitatively separate the bismuth from the major sample constituents by extracting sulfuric acid solutions with dithizone in chloroform. The extract can then be evaporated onto a graphite electrode so that the bismuth from a substantial sample of salt can be arced. The limits and precision of the method have not yet been established, but on the basis of past experience with similar techniques, measurements at the 1 -ppm level appear practical.
. . complex spectra of uranium and thorium. Prelimi- P
14.9.4 Polarographic Stripping
The sensitivity of the polarographic determination of metallic ions can be increased by plating the metal onto an electrode for an extended period and measuring the stripping current generated during an anodic scan. In the technique now being tested, bismuth is plated onto a small ( -0 .5 mm) suspended drop of mercury. A small drop is used to minimize diffusion periods within the electrode, so that sharp stripping current peaks are obtained. The principal problem in the application of this technique to MSRP samples is that the stripping waves of copper and bismuth almost coincide. In addition to that in the salt samples, traces of copper are present in most analytical reagents. Attempts to separate these waves by complexing have been unsuccessful, and we are now attempting to plate the bismuth selectively. Thiocyanate strongly complexes copper so that its reduction wave becomes cathodic to bismuth, and it appears feasible to separate the bismuth by plating it at a potential intermediate to that of the bismuth and copper waves. Optimum conditions for the de- termination are now being established. With a 5-min plating period followed by stripping at 1 v/min, detection limits are estimated at 0.1 ppm.
8
0
B
14.9.5 Isotopic Exchange
Isotopic exchange methods are based on the equili- e bration of a solution of the element with an essen- tially immiscible phase that contains in fixed concen- tration a comparable quantity of a radioisotope of
. . the element. When exchange is complete the radio- bd

209
W P
a
0
- *
0
isotope will be distributed in proportion to the quantity of the elements in the two phases, and the original concentration can be computed from a measurement of the distribution coefficient by counting. Practical analytical application of t h i s prin- ciple can be made through the liquid-liquid extrac- tion of metal ion complexes. This technique has been applied to the determination of ppm concentra- tions of mercury with a precision of about l%.I4 For simplest applications the extraction system must rigorously fulfill certain criteria. (1) The complex must be essentially undissociated and strongly dis- tributed to the donor phase; that is, the radioisotope complex must be quantitatively extracted in the absence of excess ligand. (2) Any constituents of the sample that form complexes of comparable or
I4T. H. Handley, And. Chem 36, 153 (1964).
greater strength must be removed before the equili- bration.
A two-step procedure for bismuth appears to fulfill the above criteria. The bismuth is first extracted from ammoniacal cyanide solution into a chloroform solution of dithizone. Only Pb2+, T1+, and Sn2" ac- company the bismuth. The organic phase is then equilibrated with an aqueous solution of 207Bi- EDTA complex. Bismuth forms a much stronger EDTA complex than any of the three accompanying ions. The method has the disadvantage of rather slow exchange. Approximately 20 min are required for equilibration. It has not yet been possible to determine the ultimate sensitivity of the method because the radioactive bismuth available is con- taminated with normal bismuth. A new preparation (by bombardment of a purified lead target) will be needed to evaluate the method at the ppm level.

I I !
I I
i i
! 8
i i
I i
I 1
I I i
I I
I
i i I
i 1 j
j
I I j I
I
!
1
Part 4. Molten-Salt Irradiation Experiments t*
E. G. Bohlmann
As indicated in the last report of this series, the in-pile program has been suspended because of budgetary limi- tations. Additional wetting studies indicated that very stringent gas purification measures will have to be used in future small-scale experiments, such as the in-pile thermal convection autoclave, if wetting by the salt and concomitant confusion of the experimental results are
to be avoided. Titanium or uranium metal hot trapping at the points of entry of gas streams into the loop are indicated as minimum requirements.
A reexamination of the ORR Engineering Test Facil- ities (HN-1 and HS-1) indicated that the maximum power density achievable in an in-pile loop experiment would be -400 w/cc even with major modifications.
15. Molten-Salt Convection Loop in ORR E. L. Compere H. C. Savage E. G. Bohlmann
15.1 STUDIES OF SURFACE WETTING OF GRAPHITE BY MOLTEN SALT
Surface wetting of graphite by molten salt at the point of contact with a gas phase has been shown in glove-box experiments to occur at extremely minute concentrations of moisture (<1 ppm) id the helium cover gas; subsequently, salt crawled along graphite that extended into the gas phase. Graphite immersed in molten salt in contact with such atmospheres was not wetted. The results suggest that the graphite in the ORR molten-salt loop experiment became wetted dur- ing the multiple sample-withdrawal drain operation in which tank argon containing -4 ppm moisture was used to manipulate the salt.
The observed importance of the three-phase contact area also suggests that moisture-promoted wetting is lateral only and should not proceed inward from a graphite surface, since salt which has covered the sur- face will prevent moisture-containing gas from getting to a deeper contact area and furthering the penetration.
Bubbling tank helium (4 ppm H20) at -100 cc/min successively through three containers (30 g each) of molten salt at 60O0C was not an effective cleaning pro- cedure, because oxygen analyses of the salt showed equal increase in each bubbler and only about half of
the moisture was removed. Graphite was wetted in less than a day by a droplet of salt in a heated quartz tube through which the gas from the bubblers was passed. Reaction rates thus do not appear to be very rapid rela- tive to residence time in a bubbler.
Laboratory experiments were conducted in a vacuum line made up of quartz and stainless steel tubing. The specimen used was a droplet of molten salt (LiF-BeF2, 66-34 mole %) on a graphite planchet. The graphite had been preheated under vacuum in the quartz tube, and the salt was placed on it in an argon glove box. All gas which entered the system was passed through titanium sponge hot traps and in this experiment also passed over' 5 in. of heated titanium sponge in the quartz tube be- fore reaching the salt. The system was evacuated, the droplet melted, and helium flow started. With such stringent precautions it was possible to maintain the salt droplet unchanged, clear and nonwetting, for a week. We then continued the gas flow but ceased to heat the titanium sponge adjacent to the droplet. After five days
graphite. During this period, only enough moisture . entered the system to cover the estimated titanium surface a few times.
Thus it was shown that wetting could be prevented by stringent purification of the gas.
. the droplet showed evidence of beginning to wet the 6
.
. e
210

W c . *
* P
.
J Part 5. Materials Development
W. P. Eatherly H. E. McCoy J. R. Weir, Jr.
Our materials program has emphasized four main problem areas during this reporting period (1) irradia- tion damage to graphite, (2) sealing graphite to obtain a low permeability to fission gases, (3) irradiation embrit- tlement of Hastelloy N, and (4) the compatibility of Hastelloy N with our proposed coolant salt, sodium fluoroborate.
Several graphites were obtained from commercial vendors, and some were fabricated in local facilities for study in our irradiation damage program. Some of these materials have been inadiated to a fast fluence of 2.5 X
neutrons/cm2 (>SO kev). Experimental tech- niques are being developed so that we can use transmis- sion electron microscopy, x-ray diffraction, and physi- cal property measurements to characterize these ma- terials before and after irradiation.
Graphite substrates having helium diffusivities in the range of to cm2/sec are being sealed by impregnation with a gaseous hydrocarbon to obtain
surface diffusivities of <lo-' cm2/sec. Most of our work to date has been with optimizing process param- eters, but some samples have been irradiated.
Hastelloy N is embrittled in a thermal-neutron envi- ronment by helium produced by the 10g(4a)7Li transmutation. This embrittlement can be reduced by alloying with titanium, but good postirradiation proper- ties result only when the irradiation temperature does not exceed 66OoC. This temperature sensitivity has been related to the instability of the MC-type carbide, and further alloying additions to stabilize the desired carbide are being sought. Our proposed coolant, sodium fluoroborate, seems to
corrode Hastelloy N more than salts containing lithium and beryllium fluorides. Our results indicate that the corrosion rate in the sodium fluoroborate is sensitive to the water content. Several thermal convection loops and one forced convection loop are being used to study this problem.
16.1 EXAMINATION OF PARTICLES REMOVED FROM PUMP BOWL WITH MAGNETS
R. E. Gehlbach H. Mateer T. J. Henson J. L. Miller, Jr.
Examination of three MSRE pump bowl magnets, FP-15-53, FP-15-67, and FP-16-2, revealed magnetic particles clinging to the magnets and cladding material. In some instances these particles resembled whiskers, but in most cases, closer optical examination showed them to be finely divided metallic particles. We utilized
tion, spectrochemical analysis, and metallography to identify the particles. The results are summarized in
- gamma scanning, electron microprobe, x-ray diffrac-
W Tables 16.1 to 16.3.
16. MSRE Surveillance Program
21 1
To obtain the sample from the magnet in the hot cells, a camel's-hair brush was used to remove the particles into a receptacle. In this brushing operation a small amount of the hair from the brush was unavoid- ably mixed with the sample. Removal of the hair was extremely difficult, so the hair was weighed as sample material also. In the spectrographic analysis, this por- tion of the sample went undetected as carbon along with the fluorine from the MSRE salts. Since the sample weight was in the milligram range, the weight contribution of the hair was considerable. Consequently the spectrographic results were inordinately low. How- ever, by calculating the fluorine salt contribution that is known to accompany the sample and normalizing the

212
Table 16.1. Summary of Spectrochemical and X-Ray Diffraction Analyses of Batches of Partides Removed from MSRE Pump Bowl Magnets
Spectrochemical Composition (%) X-Ray Diffraction zr Magnet Al Be Cr Cu Fe Li Mn Mo Ni
~~
FP-15-5 3' FT M vs T T T S VFT FP-1567 0.12 2.21 1.27 15.1 4.01 0.13 1.80 1.31 Fe (S); Ni 0 FP-16-2 . 0.11 3.88 0.7 17.7 7.0 0.095 2.46 1.85 Fe (S); Ni 0
'VS = very strong, S = strong, M = medium, T = trace, W = weak, FT = faint trace, and VFT =very faint trace.
Table 16.2. Normalized Quantitative results, the percentages to two significant figures were Spectrochemical Analysis obtained (Table 16.2).
Composition (%)
Fe Ni Cr Mo A1 Magnet fluorine salt
FP-1567 59 34 4.0 2.9 0.29 0.27 FP-16-2 68 27 3.7 1.1 0.15 0.17
Table 16.3. Summary of Microprobe Andy= of Individual Partides
Particle Composition (%) No. Fe Ni Cr Mo
Magnet
FP-15-5 3 1 >95 20 65.0 8.9 20.8 3' 69.8 7.0 18.1 4 97% A1 + 1.6 Cu + 1.9 Zn + two phases;
phase No. lb: A1 + 12Si + 7Cu + 2Zn; phase No. 2b: A1 + 3Si + 1.7Cu + 22Fe
FP-16-2 1 >99 T 2 91 9
* 3 6 94 4 2 98 5 6 92 2 6bx 75 2 22 7b 60 4 36 2 8c vs T sc vs W
1W vs M 1 lC W vs 12C W vs
'Particles identified as stainless steel shavings (see text). *Phases and particles were very small, and extreme caution
CVS -very strong, M = medium, W = weak, and T = trace. should be used in interpretation.
16.1.1 Observations on Particles from Magnet FP-15-53
Four particles from FP-15-53 were mounted and examined with the electron microprobe. One particle was >95% Ni, and neither Mo nor Cr was detected. Two other particles examined by microprobe analysis were Fe with about 18% Cr and 8% Ni, similar to many austenitic stainless steels. These particles appeared metallographically to be primarily single phase. At- tempted etching with 2% Nital (iron etchant) did not alter the polished surface, but the structure shown in the insert of Fig. 16.1 resulted from a glyceregia etch, indicating either a very small grain size or severe deformation. Both particles were magnetic, indicating either bcc iron or heavily cold-worked austenitic stain- less steel. One particle was removed from the mount and is shown in Fig. 16.1. DebyeScherrer x-ray patterns revealed that the particle was austenitic, indicating that both were probably stainless steel shavings picked up during removal of "real" MSRE particles from the magnet.
Another particle was primarily aluminum. Metallo- graphic study revealed a typical cast eutectic structure with at least two phases in the matrix. Besides Al, one phase contained Si, Cu, and Zn, and the other Fey Si, and Cu. The matrix contained very small amounts of Cu and Zn. This particle had a very low level of activity, and gamma spectroscopy was employed to determine the nuclides responsible for the limited activity. Long counting times were used, and only 95Nb, lo3Ru,and loSRu were detected. The nuclides present in highest concentrations in the MSRE salt were not detected, presenting some doubt that the particle was removed from the pump bowl, particularly since the particle was
Li
. *
7 8
w .
. gs

213
PHOTO 95517
Pig. 16.1. Austenitic Stainless Steel Shaving Introduced to FP-15-57, 1OOX. Insert shows microstructure of particle after polishing and glyceregia etch. Interference contrast, 1OOOX.
! *
nonmagnetic. Due to the small quantity of particles, x-ray diffraction analysis of FP-15-53 was not possible.
16.1.2 Observations on Particles from Magnet FP-16-2
A batch of particles from FP-16-2 was mounted for microprobe and metallographic study. These particles were much smaller than the stainless steel shavings, ranging from 30 to <1 p in size. Nearly 50 to 60 particles were apparent, and microprobe x-ray displays indicated that the majority were primarily Fe and several were primarily Ni; Mo and Cr were detected in some very small particles. Semiquantitative analyses were performed on several particles, with the results shown in Table 16.3. Generally the particles were relatively pure Fe, primarily Ni with some Fe, or mixtures of Fe and Cr with some Ni. Small amounts of Mo were present in two particles. Metallographic studies revealed that the iron particles had similar structures after etching with 2% Nital, as shown in Fig. 16.2.
X-ray diffraction analysis of batches of particles from FP-15-67 and FP-16-2 revealed bcc Fe (rather than austenite) as the primary constituent, with Ni as a minor phase.
Fig. 16.2. Microstructure of 'LLpical Iron Particles Removed from FP-16-2. Etchant: 2% Nital, 15OOX (1 mil = 1.5 in.). Note s d particle size compared with Fig. 16.1.

. c .
17. Graphite Studies
17.1 FUNDAMENTAL STUDIES OF RADIATION DAMAGE MECHANISMS IN GRAPHITE
D. K. Holmes S. M. Ohr
J. C. Crump T. S. Noggle
W. E. Atkinson
An effort is being made to contribute to improvement of the characteristics of reactor graphite under condi- tions of longexposure, high-temperature irradiation by trying to understand the basic nature of radiation damage in graphite. The years of research effort put into this problem by various groups in the past have not produced any acceptable quantitative model of the accumulation of damage in graphite even under the most ideal conditions. Therefore, in an attempt to establish a clear understanding of the basic processes, it has been considered worth while to take a new look at damage in natural single crystals of graphite and in good pyrolytic material.
The justification for undertaking such a program in the face of the obvious difficulties shown by the lack of progress in the past lies in the hope of using a better experimental approach and in a closely correlated effort between theory and experiment in a group whose past interests have been in the basic nature of radiation damage.
The experimental idea is to use fast electrons or charged particles to produce the damage in simulation of fast-neutron irradiations. In its optimum form the idea is to irradiate graphite specimens in the 200-kev Hitachi electron microscope with the electron beam of the instrument (which is energetic enough to displace carbon atoms from their lattice positions) and to examine them in situ. This would allow for very accurate control of dose rate and total dose along with fair control of the specimen temperature. It is known from previous work of other groups that the damage in graphite is easily observable in the electron microscope in the form of large dislocation loops and defect clusters, the former arising from the clustering of interstitial carbon atoms between the layer planes. A careful study of the formation, growth, and annealing
of these clusters should lead to an understanding of the reason why so much damage persists in th is form rather than suffering annihilation.
The experimental work is as yet only in a preliminary stage. Some single crystals (provided by G. Hinman of Gulf General Atomic) and some pyrolytic material have been irradiated in the microscope. Observable damage has been produced in the form of defect clusters. For example, in a sample of pyrolytic material exposed to a total of IO2 200-kev electrons per square centimeter at 550°C there were observed clusters having average radii of about 50 A with a density of about 10'" clusters per cubic centimeter. In a general way these results are consistent with those obtained by previous investigators using fast neutrons at a roughly equivalent total dose. However, no detailed comparison can be made until many more irradiations have been made under varying conditions. The exact nature of the clusters obtained to date has not been clarified; further study in the electron microscope is needed to determine if the defects being observed are indeed interstitial loops and, if they are not, whether interstitial loops are also present.
The intent of the theoretical program is to attempt to understand the experimental results by a closely corre- lated study of kinetic equations covering the produc- tion, diffusion, annihilation, and clustering of defects. With such a set of equations, various hypotheses can be introduced and tested by comparing the results with the equivalent experimental data. As the initial effort it has been decided to study Mayer's theory, which says that substitutional boron atoms play a vital role in the damage process. The suggestion is that wandering interstitial carbon atoms are trapped near such boron sites and are thus effectively slowed down in their rate of diffusion through the lattice. Further, as the inter- stitial rests at its trapping position, it is very likely to be joined by a second interstitial which will thus nucleate a stable cluster. Mayer's experimental results indicate that such boron trapping sites are the dominant feature of radiation damage in graphite even down at concentra- tions as low as lo-' atomic fraction of boron.
. i
e
L J
. 8 ..
214

A set of coupled kinetic equations has been pro- grammed for the IBM 360 model 75 computer. These equations determine the time variation of the densities of interstitials, vacancies, interstitials trapped at boron atoms, clusters of interstitials at boron atoms, and clusters of interstitials homogeneously nucleated. Such equations present considerable difficulty toward obtain- ing acceptable accuracy and stability. Most of the research effort to date has been expended in adapting a GaussSeidel integration scheme to this particular set of equations in order to integrate with enough efficiency to permit the achievement of the desired total damage level. Mayer himself has not integrated such equations, although he discussed them and deduced what their asymptotic solutions should be. Our very preliminary results tend to confirm the general form of his solution.
17.2 GRAPHITIZATION CHEMISTRY AND
R. A. Strehlow
BINDER SYSTEM DEVELOPMENT'
Increase of the microstructural strength and density of graphite for MSBR use should improve both gas permeability characteristics and irradiation lifetime. The chemical studies program on carbonization and binder system development is concerned with chemical factors which influence the structural properties of a fabricated graphite. This concern stems principally from two facts: The first is that weight and volume yields of carbon are strong functions of the chemical structure of starting material as well as of carbonizing conditions. The second is that carbon precursor mixtures can yield coke mixtures with significant variability in micro- structure and graphitizability.
Economic and technical factors operate together to place coal tar pitch in an eminent position among binder systems for nuclear graphite. However, measured volumetric yields of coal tar pitch were found to range from 20% for the softer grades to only about 40% for the highest-softening-point materials (grade 350). Since some carbon precursor compounds offer volumetric yields of more easily graphitized carbon near 60%, marked improvements in strength and fabricated den- sity are possible. For improvements of this magnitude, overall process costs competitive with those of the coal tar materials may be realized.
215
Of course, volumetric yield is but one of several essential qualities of a carbon-binder system. Appropri- ate fluidity, carbonization kinetics, and product carbon structure are all required for the optimal application of a binder system. Appropriate flow properties may be achieved by construction of polycomponent mixtures or by proper use and selection of fugitive material. It is not now known whether a reasonably small number of components will yield a suitable liquid. Studies have been begun of phase relations among carbon precursor materials such as acenaphthylene and isotruxene. How- ever, knowledge of the kinetics of crystallization processes for mixtures is also needed for further development of synthetic binder systems and for altered or modified pitches.
Carbonization reactions proceed with rates and tem- perature coefficients of rate which vary with the structure of the pyrolyzing species. Mixed coke types can be generated from mixtures of compounds such as biphenyl and anthracene? Since it may be safely presumed that a segregated development of coke types within a carbon body during baking will lead to structural weakness and impaired crystallinity in the product, a study of microstructural development is a necessary accompaniment to the carbonization studies. Model compounds with sufficiently low vapor pressure to prevent facile evaporation generally have a complex structure which may follow more than one route in the carbonization. Since this is so, either high-pressure coking or great restriction in selection of compounds must be employed. Fortunately, there are a few polycyclic aromatic hydrocarbons such as decacyclene, C36H18, which are at once symmetric and of high molecular weight so that studies can be made on their carbonization. Work of this type is continuing.
The inference should be drawn from the above discussion that binder system development can proceed from two complementary bases. The first is the use of model compounds primarily to define the carbonization process - rates, catalysis, product quality, and its alteration. The second is to determine the basic phase data needed to construct a useful improved binder system using either precursor mixtures or modifications of coal tar or petroleum pitches.
'These comments are based on work performed in the Chemistry Development Department of the Development DM- sion, Y-12 Plant.
2Ahrin Weintraub, thesis, Pennsylvania State University, Grad- uate School, Department of Nuclear Engineering, September 1967.

216
173 HOT PRESSING OF GRAPHITE PELLETS USING VARIOUS BINDERS3
L. G. Overholser
Graphite pellets were prepared for machining and subsequent irradiation testing in HFIR by hot pressing AXM graphite flour4 and various binder materials. Variables examined include the type and quantity of binder as well as pressing temperatures and pressures.
AXM graphite flour (-200 mesh), purified by HCl treatment at -22OO0C, was used as filler in all runs. Isotruxene (ITX), acenaphthylene (ACN), decacyclene, and Allied Chemical Company grade 350 coal tar pitch were used as binders. The binders were crushed, where necessary, sieved, and the -70 mesh fraction used in hot pressing. The flour-binder mixture was prepared by superficially dry blending the powders, slurrying with acetone, and evaporating the acetone to yield a dry powder. The graphite sleeve and die used in hot pressing gave a pellet having a nominal diameter of 3 in. Pellets hot pressed at 140OoC were heat treated later at 280OoC without pressure.
'Work performed by Chemical Engineehg Department,
4This flour was obtained by milling AXM graphite produced Development Division, Y-12 plant.
by Poco Graphite, Inc.
U Data obtained for the various graphite pellets are given in Table 17.1. The bulk density was calculated from the weight and geometric volume and the residual binder carbon content from the increase in weight of the formed graphite over the weight of contained flour. The carbon yield or coking value represents the ratio of weight of residual carbon obtained after pyrolysis of the binder to the weight of binder originally present. Pellets prepared using ACN as binder are charac- terized by low bulk carbon densities and low binder carbon contents. These binders also give low carbon yields. All pellets pressed with these binders had at least one large radial crack. The high-melting grade 350 coal tar pitch gives the highest bulk densities, carbon yields, and carbon binder contents. Isotruxene- and de- cacyclene give bulk densities, binder carbon contents, and carbon yields intermediate between the 350 pitch and the ACN binder.
The density of parts cut from one of the pellets prepared with ITX as binder increased from 1.63 to 1.80 g/cm3 when given a single impregnation with ITX. This technique makes it feasible to prepare graphites of higher density than obtainable by merely varying the conditions of pressing but still using a single binder material. In addition to the variation of densities found for the various binders, the carbons formed by pyrolysis of these binders differ in graphitizability. For example,
r t
rc
c
Table 17.1. Data for Various Hot-Pressed Graphite Pellets
Pressed Pellet ~ Carbon
(' ~ c m 3 ) ( ~ 6 )
Pressing Conditions Bulk Binder yield Binder AXM
Grade" Filler ~ Temperature Pressure Length Weight Density (73 pph ("C) (PSO (in.) (& TYPe
Y M I 4
YMI-3' (YMI-2) (YM-5) YMI-13'
(YMACN-8) YM350-1W (YM35@12) (YM350-9) YM35@1lc (YM350-14)
410 410 410 400 410 410 400 380 390 390 410 400 400 390 390
ITX ITX ITX ITX ITX ITX ACN ACN 350 pitch 350 pitch 350 pitch 350 pitch 350 pitch Decacyclene Decacyclene
25 25 35 35 25 25 35 50 35 35 35 35 35 35 35
1400 1400 1400 1400 2800 2800 1400 1400 1400 1400 1400 2800 2800 1400 2800
1600 1600 1600 2400 2400 2400 1600 1600 1600 1600 1600 2400 2400 1600 2400
2.63 48 1 1.63 14.8 70 2.59 47 1 1.62 13.0 62 2.60 475 1.63 13.7 48 2.42 458 1.68 12.7 42 2.28 475 1.76 13.7 64 2.35 478 1.76 14.2 61 2.50 430 1.55 7.0 21 2.42 421 1.54 9.7 22 2.60 490 1.69 20 74 2.65 49 1 1.67 20 74 2.77 515 1.67 20 73 2.39 500 1.80 20 72 2.43 501 1.78 20 72 2.48 463 1.65 15.8 54 2.24 463 1.76 15.8 54
'Those with grade designations are those supplied to ORNL for evaluation, and those enclosed in parentheses are those that are
bThis grade, which is similar to YMI-3, was impregnated with ITX at 1000 psi and graphitized again at 28OOOC; some of the result-
%is material has been selected for the irradiation studies in the High Flux Isotope Reactor (HFIR).
currently being evaluated.
ing properties are given in Table 17.2.
8
0

217
ITX and 350 pitch yield carbons which are more difficult to graphitize than the carbons obtained from ACN and decacyclene.
The original AXM graphite is known to be remarkably stable under irradiation (cf. Sect. 17.9). Hence the flour used in the above samples should also be stable. Since the microstructures of the above binders differ signifi- cantly, the irradiation of these materials should clearly delineate the role of the binder in controlling dimen- sional changes of graphites under irradiation.
17.4 PROCUREMENT AND PHYSICAL PROPERTY MEASUREMENTS ON NEW GRADES
OF GRAPHITE
W. H. Cook
The first trial fabrications of new grades of graphite have been received and are in the early stages of examination. The objectives are (1) to develop the most radiation-stable and fabricable grades of graphite for MSBR applications and (2) to determine the funda- mental factors that make one grade of graphite resist radiation damage more than others. In many instances, the data from the research toward these objectives are mutually beneficial; however, the research associated with the first is on a more pressing time schedule.
The development programs are of the mutual interest and effort of the Chemical Engineering Development Department (CEDD) of the Y-12 Plant and ORNL.5 All of the fabrication data reported for these new graphites were supplied by R. L. Hamner and L. G. Overholser. Some of the fabrication details are given in Sect. 17.3.
To develop the most stable and fabricable material, the work is concentrated on the most radiation-resistant ma- terials currently known, the Poco graphites. These ma- terials are not currently being fabricated in large enough sizes for the present MSBE and MSBR designs; so work has been initiated in CEDD to make shapes by the classi- cal extrusion techniques with these and other materials as filers. Grades Y586 and Y588 shown in Table 17.2 are typical. They are bonded with polymerized furfuryl alcohol, Varcum; which produces a poor-quality, turbostratic graphite for the binder phase. Grade AXF bodies were crushed and sized by the CEDD to supply one filler, and the other, grade 2033, was supplied by the manufacturer already crushed and sized. Little is
’The fabrication work is in part done by ORNL personnel on loan to the CEDD, R. L. Hamner, L. G. Overholser, and R. A. Strehlow.
%arcurn Chemical, a Division of Reichhold Chemicals, Inc, Niagara Falls, N.Y.
known about grade 2033 material. Grade AXF has a bulk density ranging from 1.80 to 1.88 g/cm3 and a typical gas permeability to helium of 4.0 X cm2/sec. As shown in Table 17.2, the grade AXF “reconstituted” as grade Y586 did not sacrifice these starting properties. In fact, the gas permeability was improved (i.e., decreased) by a surprising amount to 3.1 X IO4 cm2/sec. Additional properties are being measured, and their irradiation stabilities to fast neu- trons will be determined in the HFIR. Should the overall properties of the starting materials not be de- graded too much by this process and in the scaleup to MSBR sizes, this wellestablished technology for fabric- ation would be suitable for fabricating the shapes required for MSBR’s.
The rest of the grades of graphite listed in Table 17.2 are being studied for more special and fundamental purposes. Historically, graphite has been made from natural materials and/or their by-products. Thousands of complex hydrocarbon compounds may be involved in these natural materials, and they are usually typical of their particular source. This presents such problems as (1) maintaining the quantity and quality limits of starting materials required for a product when a certain natural source is depleted and (2) sorting out the complex compounds that may contribute to resitance to radiation damage. One approach that may be helpful toward solving both of these problems is to synthesize part or all of the starting components. Grades YMI-3, YMI-41, and YMI-13 represent initial work in this direction. Preliminary data suggest that radiation dam- age may be decreased if the binder component is equal to or greater in quality to the filler material so that in effect they are indistinguishable from each other, that is, the finished product behaves as if it were a monolithic material. A secondary but desirable goal is to find binders and impregnants that produce higher carbon yields during pyrolysis. This would decrease both the initial porosity in the base stock and the number of impregnations required to reduce porosity and pore entrance diameters in the base stock. An attempt to do this has been to synthesize the starting materials, the isotruxene [C6H3(C6H5)3] binder and impregnant in these studies. The molding technique is used to conserve the limited quantities of the synthe- sized isotruxene.
Poco grade AXM was used as the filler in these experimental grades because of low cost and avail- ability. I t differs from grade AXF in that its bulk density is lower (1.70 to 1.79 g/cm3). The relatively high resistance to radiation damage of the filler should help emphasize the effects of irradiation on the isotruxene binder and impregnant. Grade YMI-3 is a

Table 17.2. Initial Fabrication and Roperties Data“ on New Grades of Graphite
Accessible Modulus Strain Helium
with ‘Ore With Grainc ( m i ~ h m - c m ) Resistance Strength Elasticity Fracture (cm2,sec) Filler Moldins Graphitizing Density Porosity (96) Specific Flexural of
to Permeability Orientation Grade particle Binder Conditions Temperature (g/cm3) Size pi “C cab Bulk Real Total Entrances (psiid (psiid (%Id
<1 L
AXFJ Y58@ AXFf
Y58M 2033
YMI-3 A&
YMI41’ AXM
YMI-13 AXM
YM350-10 AXM
YM350-11 AXM
K Z P ) -60 mesh Varcum’ (<250L) -60mesh Varcum (250L) -200 mesh ITXl 1600 1400 K75L) -200mesh ITX 1600 1400 (<75L)
6 7 5 d
K75P)
K75L)
-200mesh ITX 2400 2800
-200mesh Pitch35d 1600 1400
-200mesh Pitch350 2400 2800
1.81 2900 1.84 2.002i
2900 1.82 1.99gi
2800 1.62
2800 1.82
1.73
2800 1.65
1.75
15.0 90 6.51 88 I I
1 6.87 85 II
1 II 1 II 1 II 1 II 1 II 1
1575 1475
1585
2200 2340 1785 1935 2150 2790 2220 2350
2000 2750
x 106 6720 1.40 0.669 4.0 X 10’ 4950 1.50 0.456 3.1 X lo4
2.7 X 10-
4510 -0.4 7.3 X lo+ 4.1 X 10-
6.0 X 10’
1.1 x lo* 2.7 X 10’
1.6 X 10’
1.6 X 10’ ~ ~~~~~~ ~~~~ ~
aThese are typical, not statistical. bAt temperatures 1-1’4 hr. These and dI data to the left are from CEDD of Y-12; the fabrication details for some of these are given in Sect. 17.3. %e long dimension of a filler particle and the general orientation of the a axes of the grain (faer particle). dDetermined by the Mechanical Properties Group. ‘Grade AXF is included for comparison with the reconstituted material, grade Y586. fhfanufactured by Poco Graphite, Inc., Garland, Tex. @“he= were extruded; the rest were hot pressed. ’Polymerized furfuryl alcohol manufactured by Varcum Chemical Co. %upplied by R. L. Hamner, Y-12 CEDD.
hpregnated with isotruxene at 1000 psi and graphitized again at 2800OC. lAUied 350 hard pitch (mp -18OOC).
hSOtruXelle, C6H 3(C6H5)3.
c- I. ,, d a .

body bonded with isotruxene, and YMI41 is both bonded and then impregnated with isotrwrene.
The common commercial coal tar pitch binders usually used in the fabrication of graphites have a carbon yield of approximately 55% (ref. 7). The carbon yield for isotrwrene is around 67%, an appreciable increase over that of the coal tar pitch binders. However, the overall results are somewhat disappoint- ing. The bulk density of the YMI-3 is lower than that of the filler material, and that for YMI-13 is not usually high for the forming technique used. The density of YMI-41 was increased substantially by the single impreg- nation with isotruxene, but the gas permeability was not altered much when compared with that of YMI-3 in Table 17.2.
The YM350 series in Table 17.2 brings us back to more complex binders. However, the 350 pitch used for these is a relatively hard binder that has a good carbon yield of approximately 72%. Again, the bulk densities and gas permeabilities are not outstanding for these first trials.
The specific resistances reported for grades Y586 and Y588 in TabIe 17.2 are slightly high, as one might expect with furfuryl alcohol binder and the particle size of the filler used. The specific resistances for all the YMI and YM350 series are very high. In a qualitative way, the high resistance suggests that the particles are covered well by the binders, as they should be, and that the binders are not producing good graphitic structures.
It is important when considering the properties of the grades listed in Table 17.2 to recall that these are all the first products produced by these new approaches. The full potential of these materials cannot be assessed until the fabrication parameters are further developed. Other synthesized binders will be introduced as these studies progress. We shall continue to make relatively com- prehensive property measurements on these and other grades of these series in order to (1) assist in developing desirable fabrication techniques and (2) to determine the potentials of these new materials.
17.5 PHYSICAL PROPERTIES OF GRAPHITES
D. L. McElroy R. S. Graves J. P. Moore
219
We initiated a physical properties study of potential MSBR materials of construction. Initial interest is focused on the thermal conductivity of various grades
‘W. P. Eatherly and E. L. Piper, “Manufacture,” p. 32 in Nuclear Graphite, ed. by R. E. Nightingale, Academic, New York, 1962.
of graphites and the influence of temperature, anisot- ropy, and irradiation.
A comparative longitudinal-heat-flow apparatus’ was used to measure the thermal conductivity (A) of three types of graphite from 300 to 475°K in the directions perpendicular and parallel to the pressing direction. Some of the properties of these graphites were reported previously? Our measurements of the thermal conduc- tivity and the room-temperature electrical resistivity (p) are given in Table 17.3. The thermal conductivity values have a probable accuracy of *3%. The electrical resistivity results are 25 to 50 microhm-cm lower than those reported previously. This difference is in the correct direction to be caused by a geometric effect of isopotentials at the current leads of short samples. The thermal conductivity of these graphites decreases with increasing temperature and indicates from 5 to 30% anisotropy. This temperature dependence agrees with our previous findings on CGB graphite, which showed an inverse relation between thermal conductivity and the absolute temperature.’ This indicates three phonon scattering processes are acting, and this scatter- ing limits lattice heat conduction insulators above their Debye temperature. Our previous findings show this relation to hold below the Debye temperature of graphite. The anisotropy ratios Al/hll and p l l /p l of the various graphites agree to within 5%. In a previous study we noted that the resistivity ratio changed less than 8% from 300 to 1300 K.”
Finally, thermal conductivity measurements were obtained on one sample irradiated in the ORR to an approximate fast fluence of 4.8 X 1OI9 neutrons/cm2 at 700’C; the results are given in Table 17.3. This 50% reduction in the thermal conductivity agrees with reported findings on the effects of irradiation. Further tests and analysis of this are planned.
17.6 X-RAY STUDIES
0. B. cavin
The dimensional stability of polycrystalline graphite shapes under neutron irradiation is partially a function
8J. P. Moore et al., Thermal Conductivity Measurements on Solids Between 20 and 150°C Using a CompamtiveLongi- tudinal Apparatus, ORNL-4121 (June 1967). 9W. H. Cook, J. L. Griffith, and 0. B. Cavin, MSR Program
Semiann. Rogr. Rept. Aug. 31, 1968, ORNL-4344, pp.
loJ. P. Moore, T. G. Godfrey, and D. L. McElroy, “Thermal Roperties of Grade CGB Graphite” in Proc. Fourth Conf: Thermal Conductivity U.S.N.R.D.L. (October 1964).
226-27.
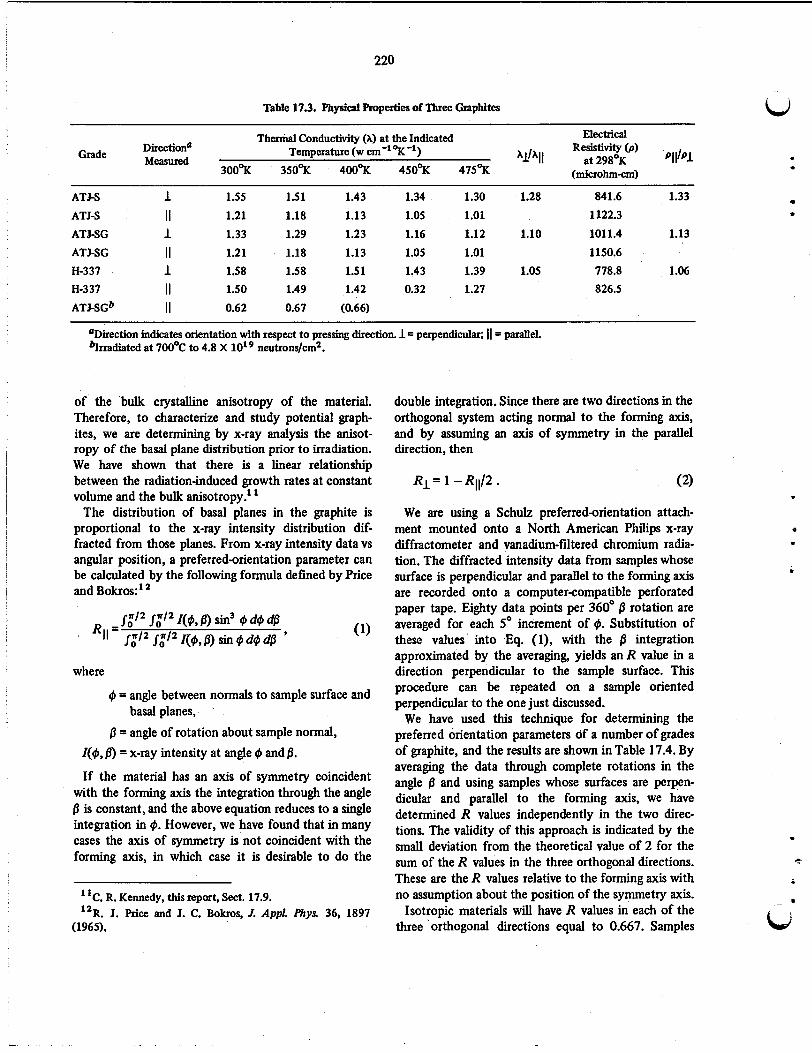
220
Table 17.3. physical Properties of Three Craphites
Thermal Conductivity (A) at the Indicated Electrical Resistivity (p)
A l b l l at 298% 'III'l Directionu Temperature (w an-'%-') Measured
300% 350% 400% 450% 475% (miCIOhm-Cm)
Grade t
ATJ-S 1 1.55 1.51 1.43 1.34 1.30 1.28 841.6 1.33 ATJ-S II 1.21 1.18 1.13 1.05 1.01 1122.3 ATJ-SG 1 1.33 1.29 1.23 1.16 1.12 1.10 1011.4 1.13 ATJ-SG II 1.21 1.18 1.13 1.05 1.01 1150.6 8337 1 1.58 1.58 1.5 1 1.43 1.39 1.05 778.8 1.06 H-337 II 1.50 1.49 1.42 0.32 1.27 826.5 ATJ-SG~ II 0.62 0.67 (0.66)
ODirection indicates orientation with respect to pressing direction. 1 = perpendicular; 11 = parallel. %radiated at 700°C to 4.8 X 10'' neutrons/cm2.
of the bulk crystalline anisotropy of the material. Therefore, to characterize and study potential graph- ites, we are determining by x-ray analysis the anisot- ropy of the basal plane distribution prior to irradiation. We have shown that there is a h e a r relationship between the radiation-induced growth rates at constant volume and the bulk anisotropy.' '
The distribution of basal planes in the graphite is proportional to the x-ray intensity distribution dif- fracted from those planes. From x-ray intensity data vs angular position, a preferred-orientation parameter can be calculated by the following formula defined by Price and Bokros: '
where
@ = angle between normals to sample surface and
f l = angle of rotation about sample normal, basal planes, .
Z(@, p) = x-ray intensity at angle @ and fl . If the material has an ax is of symmetry coincident
with the forming axis the integration through the angle 6 is constant, and the above equation reduces to a single integration in tp. However, we have found that in many cases the axis of symmetry is not coincident with the forming axis, in which case it is desirable to do the
"C. R. Kennedy, this report, Sect. 17.9. "R. J. Price and J. C. Bokros, J. Appl. Phyr 36, 1897
(1965).
double integration. Since there are two directions in the orthogonal system acting normal to the forming axis, and by assuming an axis of symmetry in the parallel direction, then
R l = 1 - R11/2 . (2)
We are using a Schulz preferred-orientation attach- ment mounted onto a North American Philips x-ray diffractometer and vanadium-filtered chromium radia- tion. The diffracted intensity data from samples whose surface is perpendicular and parallel to the forming axis are recorded onto a computercompatible perforated paper tape. Eighty data points per 360" fl rotation are averaged for each 5" increment of @. Substitution of these values into Eq. (l), with the fl integration approximated by the averaging, yields an R value in a direction perpendicular to the sample surface. This procedure can be repeated on a sample oriented perpendicular to the one just discussed.
We have used this technique for determining the preferred orientation parameters of a number of grades of graphite, and the results are shown in Table 17.4. By averaging the data through complete rotations in the angle fl and using samples whose surfaces are perpen- dicular and parallel to the forming axis, we have determined R values independently in the two direc- tions. The validity of this approach is indicated by the small deviation from the theoretical value of 2 for the sum of the R values in the three orthogonal directions. These are the R values relative to the forming axis with no assumption about the position of the symmetry axis.
Isotropic materials will have R values in each of the three 'orthogonal directions equal to 0.667. Samples
. 0
I
. e
.

bd I
e .
i ~ 1
*
t
1
I
. * -
U
Table 17.4. Anisotropy Values of Various Craphites
Grade RII R l T O
BY 12 RY 1'&2-00029 RY 1240031 AXF AXF-3000 AXFJQBG AXF-5QBG (30OO0C) H 364 H 337 ATJS ATJ-SG BY 12 NF 1425b (pipe)
0.588 0.706 0.792 0.600 0.808 0.594 0.673 0.663 0.667 0.666 0.667 0.666 0.656 0.671 0.645 0.676 0.659 0.670 0.617 0.684 0.638 0.680 0.585 0.707 0.783 R, = 0.590
Re = 0.627
2.000 1.992 1.996 1.999 1.999 1.999 1.998 1.997 1.985 1.985 1.998 1.999 2.000
~~
aT=Rll + 2Rl. kueedimensional anisotropy.
having RII less than 0.667 indicate a molding texture, while those having RII greater than this have an extrusion texture; the magnitude of t h i s deviation indicates the degree of anisotropy. A single crystal will have RII = 0 and Rl = 1. Note that several of the materials studied have R values very close to the predicted 0.667 for complete isotropy (Table 17.4).
These anisotropy values have made it possible to better understand the effects of binder and filer on the radiation growth rates of various graphites (Fig. 17.14, Sect. 17.9). The growth rates at constant volume and the preferred orientation parameter correlate as a straight line, indicating that, even though some have different binders and fabrication procedures, the growth rates are dependent mainly upon the degree of anisotropy.
17.7 ELECTRON MICROSCOPY OF GRAPHITE
221
C. S. Morgan C. S. Yust
Direct observation of the substructure of polycrystal- line graphites by transmission electron microscopy may permit a better understanding of the process of radia- tion damage in these materials. Although a substantial amount of transmission microscopy has been done on single-crystal graphite, the transmission work on bulk polycrystalline graphite is quite limited. The first requirement in this study was the development of a suitable thinning technique. We found that thinning by mechanical polishing can be used to prepare satisfactory specimens of AXF graphite. The application of th is technique to other graphites is being evaluated.
A variety of graphites will be examined in the as-fabricated and the irradiated conditions to determine
the substructure change with irradiation. Fig. 17.1 shows a transmission electron micrograph of type AXF graphite as fabricated. The structure is composed of regions about 1 p in diameter within which exist aligned ribbons of materials. Cracks are sometimes seen be- tween the ribbons, as well as between regions of different alignment. Although numerous spots are usually present, electron diffraction patterns of the smallest possible selected area always yield rings, thus indicating that the crystallite size is quite small. Smaller units which go in and out of contrast with tilting agree in size with the crystallite size determined by x-ray line broadening (250 A). Boundary regions in the AXF graphite are not well defined.
17.8 GAS IMPREGNATION OF GRAPHITE WITHCARBON
R. L. Beatty D. V. Kiplinger
We have been studying a vacuum-pressure pulsing technique to seal graphite for MSBR use as discussed earlier.' The current specification on surface tightness of the graphite is a room-temperature permeability to helium not greater than lo-' cm2/sec. Accordingly, we are studying means to optimize the gas impregnation process.
The effect of process temperature is shown clearly in Fig. 17.2. In this set of experiments we maintained constant the substrate type (Poco AXF graphite) and the vacuum and butadiene exposure periods. The initial slopes of high rates of weight gain shown by the curves in Fig. 17.2 indicate the coating of a very large surface area, namely, the walls of the entire open-pore struc- ture. The sharp changes of slope indicate the closing of most of the pore volume during a relatively small increment of processing time, thus attesting the mi- formity of pore size of the AXF graphite substrate. Each specimen was sealed to a low helium permeability after this sharp change in slope, and the leveled-out section of each curve involves essentially coating of only the specimen geometrical surface area. A compari- son of the slopes of the latter portion of these curves shows clearly that increasing the temperature increases the rate of deposition. This effect is also shown by the points at which pores are closed at the different temperatures. Lowering temperature results in slowing down the sealing process while increasing the depth of penetration and, eventually, the final amount of im- pregnant deposited. The 75OoC deposition curve leveled out at a specimen weight increase of 7.576, essentially
I3MSR Bogmm Semiann. Rogr. Rept. Aug 31, 1968, ORNL4344, pp. 230-31.

222
. .
.
Fig. 17.1. Transmission Electron Micrograph of a Thinned Area in the AXF Graphite. The sample has a uniform thickness and the various tones varying from white to black indicate variations in the orientation of different regions. 85,OOOX.
. t

-4
all internal deposit. Data indicate t&t 4 finite, though often immeasurable, amount of surface coating is required to achieve a helium permeability less than IO-* cm2/sec at room temperature.
We must optimize the gas impregnation process for a given type of substrate. Figure 17.3 shows the effect of varying the vacuum pulse period. For the Poco AXF substrate, a sealing temperature of 85OoC, and a butadiene pulse of 'A sec, we found that shortening the vacuum pulse from 60 to 15 sec served to increase the rate and depth of impregnation as well as to accelerate the process. In t h i s case further accelerating the sealing by shortening the vacuum pulse to 7.5 sec resulted in some sacrifice in penetration.
The effect of substrate pore structure on deposition and sealing rates is shown in Fig. 17.4. The fine-pore AXF graphite exposes a very large surface area for coating, so that the deposition rate is high until essentially all the pores are closed. The ATJSG graphite, which has about the same open-pore volume
b 8 0.10
5 0.08 z
-
E 0.06
p 0.04 B z
9 0.02
I I I I I I 0 5 (0 15 20 25 30
W A L PROCESSING TIME (hr)
Fig. 17.2. Effect Of Temperature on Rate and Final Amount of Carbon Impregnation.
ORNL-DWG 69-1978 0.10 I I I I I I I
2
!i 0.08 8 5 5 0.06 z .E 0.04 $0.02
z
;4 I I I I I I
0 5 (0 15 20 25 30 TOTAL PROCESSING TIME (hr)
Fig 17.3. Effect of Vacuum Period on Rate and Final Amount of Carbon Impregnation.
223
.~ but a mucklarger average pore size, gains weight at a lower rate for the given set of processing conditions. The lack of a sharp change of slope in the ATJSG curve attests the wide pore-size distribution of this material. These data indicate that for the processing conditions shown a small, uniform pore size is very desirable for gas impregnation. However, a graphite such as the ATJSG can be impregnated fairly efficiently if process- ing conditions are optimized for it. In this case the temperature of 850°C may be near optimum for the AXF, but- higher temperatures improved processing efficiency for the ATJSG.
Evaluation of the carbon impregnant seal, of course, must include irradiation testing, and this is in progress. The first group of gas-pulse-impregnated specimens prepared for irradiation in the HFIR was unloaded in December. The eleven specimens had received fast- neutron fluences ranging from 7.6 to 12.7 X 10²' neutrons/cm2 at 705°C. Helium permeabilities before irradiation ranged from 1.2 X to less than 1.3 X lo-'' cm2/sec. After irradiation ten of the specimens showed helium permeabilities greater than cm2/sec, and the eleventh specimen was measured at 1.7 X cm2/sec. While these results do not show spectacular success, we are very encouraged that in the first test one specimen came very close to giving the desired performance. Since the permeability of this specimen before irradiation was about lo* cm2/sec, the increase due to the test was approximately one order of magnitude, an acceptable damage if the initial permeability were lower.
There were two complicating factors in assessing the irradiation performance relative to helium permeability, both of which brighten the outlook for achieving satisfactory results over that obtained by a cursory glance at the data. First, we were attempting to study
- ,D 0.10
B Q 3 008 Y
c U
VACUUM. 15 sec c Oo6
; 0.04 8 3 0.02
0 0 5 (0 15 m 25 30
TOTAL PROCESSING TIME (hr)
Fig, 17.4. Effect of Substrate Pore Structure on Rate and Final Amount of Carbon Impregnation.

224
only the seal on the outer surface of the cylindrical specimens, since the inner surface is in contact with a stainless steel spine in the test rig assembly during irradiation. This may cause damage other than that induced by neutrons. Since a coating which tends to form on the inner surface, if undisturbed, can dominate the helium-leak measurements, we reamed out the bore of each specimen after impregnating and before leak checking. However, after the irradiation experiment was assembled we learned that the reaming operation was inadequate. It seems that reaming can serve to smear the graphite and actually make the surface less perme- able. To eliminate this problem it is necessary to actually gouge a groove in the bore of the specimen before leak checking, a procedure we employed in fabricating the second set of specimens. The second complication is the problem of how to determine permeability. Since we actually measure a leak rate, some wall thickness must be used to calculate a permeability. We arbitrarily use the total wall thickness of the specimen for this purpose, but we know that the gas-tight section is much thinner. It is interesting to note that if we use one-tenth of the total wall thickness
in the permeability calculation, the result for the best specimen after this first test is about lo-' cm'/sec, the value which is currently specified as the necessary graphite surface permeability for an MSBR.
We have prepared a new group of test specimens, which were inserted in the HFIR in early February. Seven new specimens and three of the first set, including the one having the lo-' cm2/sec helium permeability, will be irradiated in the HFIR to a peak fast fluence of about 2.5 X 10²' neutrons/cm'.
17.9 GRAPHITE IRRADIATION IN HFIR
C. R. Kennedy
HFIR graphite irradiation experiments 5 and 6 have been removed from the reactor, the specimens meas- ured, and a number of the samples recycled in experiments 7 and 8. The samples have received exposures up to 2.5 X lo'' neutrons/cm' (>SO kev) and will accumulate up to 3.8 X Id' neutrons/cm' when they are removed from HFIR in May 1969.
The materials that have been irradiated and have given significant results are listed in Table 17.5. The linear
Table 17.5. Craphites irradiated in HFIR Experiments
Forming Density Method (glcm3)
Grade Source Remarks
BY-12 Y-12 Molded 1.88 GLCC 1008 graphite flour; pitch binder;
RY-12-29 Y-12 Extruded 1.89 85% GLCC 1008 graphite flour; 15%
RY-12-31 Y-12 Extruded 1.80 GLCC 1008 graphite flour; Varcum binder; 3000°C Natural flake Y-12 Molded 1.83 Madagascar natural flake flour; pitch
H364 GLCC ? 1.94 Proprietary materials and forming
two impregnations; 3000°C
Thermax; Varcum binder; 3000°C
binder; 3000°C
method; reasonably isotropic; 2800°C; laboratory processed
H337 1425
GLCC ? 2.00 Same as H364; pilot plant processed UCC Extruded 1.82 Needle coke graphite; pitch bonded;
multiple impregnation; 2800°C ATJS ucc Molded 1.91 Needle coke graphite; pitch bonded;
ATJSG UCC Molded 1.80 ATJS processed using Gilso carbon coke AXF Poco Molded 1.82 Proprietary materials and forming;
AXF-3 Poco Molded 1.82 AXF heat treated 1 hr at 30OO0C AXF-5QBG Poco Molded 1.86 AXF material with a single impregnation;
multiple impregnation; 2800°C
very isotropic; 2300°C
heated to 2500°C
i
. . *
.
f
AXF-5 QBG3 Poco Molded 1.85 AXF-5QBG heat treated to 3000°C c
AXF-UFG Poco Molded A fme-grained AXF graphite; 2500°C hid

225
dimensional changes resulting from the irradiation are given in Figs. 17.5-17.8. The curves drawn in these figures, with the exception of the Poco grade, were
63 * obtained from least-squares fitting of the data to a
quadratic expression. The volumetric changes were
The more isotropic grades, H364, H337, and Poco
. calculated from the linear dimensional change data. The
8 volumetric change curves are given in Figs. 17.9- 17.1 1. . grades, have considerably more scatter in their results than the anisotropic grades. This is undoubtably a result of small sample-to-sample variations in the preferred orientation. Dimensional stability is a result of isotropy where the high growth rates in the c and CI axis directions are balanced. Slight variations in the pre- ferred orientation will result in a much larger fractional variation in growth than for the anisotropic grades having much larger linear dimensional changes.
The analysis of these results is still in progress; however, several significant behavioral characteristics which are important to the development of a more radiation-resistant graphite are apparent. The first is that the maximum densification of the graphite is a linear function of the original density, as shown in Fig.
45
40
I - b?
a
0
5 5
0
. - -5 c
1 '7
ORNL-DWG 69-554 I
14258
0 40 2 0 ( X I 0 2 FLUENCE (neutrons/cm', E>50 kev)
Fig. 17.5. Growth of Graphite Normal to the Extrusion Direction or Parallel to the Molding Direction, 715'C.
17.12. One material, grade 1425, is obviously off the curve, and grades ATJS and ATJSG are on the low side; however, the Poco grades have not densified fully and are not plotted. The 1425 grade is the only material in which the impregnate is apparent in the microstruc- ture and appears to be a distinct second'phase. This
ORNL-DWG 69-5542 5
0
- 2 0 s
4
-5
-40
I I
I
RY-42-29
1 0 -
I \4425 I .
I .\ I I
(0 20 (XI02 FLUENCE (neutrons/cm*, E > 5 0 kev)
Fig. 17.6. Growth of Graphite in the Extrusion Direction or Normal to the Molding Direction, 715OC.
ORNL-OWG 69-5543
5 40 +5 20 25 (~40~') -2 - 0
FLUENCE (neutrons(cm2, E>5Okev)
I I I I 5 40 +5 20 25 (~40~')
-2 - 0
FLUENCE (neutrons(cm2, E>5Okev)

226
A :. A
A 2 8 #la f a
1
a
0 a
O P
' A
0
- 4
-2
ORNL-DWG 69-4038R
o AXF - AXF-3
a AXF-5QB A AXF-508-3
AXF-UFG
ORNL-OWG 69-5545
FLUENCE (neutrons/cm*, E ~ 5 0 kev)
Fig. 17.9. Volume Changes of Graphite Grades at 715OC.
would suggest that the second-phase carbon is not part of the structure and that the true structural density is much lower than 1.83 glcm3. The ATJS and ATJSG are heavily impregnated grades; however, the im- pregnate has graphitized and cannot be distinguished in the microstructure. I t might be that again the im- pregnate has not completely integrated with the struc- ture and is not completely a part of the true structural density. The major difference in the graphites with different original densities is a reduction of open-pore volume with increasing density. Therefore the relation- ship shown in Fig. 17.12 is strong evidence that the closure of the open pore volume is the major contribu- tion to the densification of the graphite. The signifi- cance of the relationship in Fig. 17.12 is that it demonstrates a serious problem in obtaining an ex- tended life for conventional graphites fabricated to the high density required for the MSBR. The term "conven-
ORNL-OWG 69-5516
3* 2
-1
-2 ' I I I I I I 0 5 10 45 20 25 ( ~ 1 0 ~ ' )
FLUENCE (neutrons/cm*, €=-5Okev)
Fig. 17.10. Volume Change of Graphite Grades H-364 and H-337, 715OC.
ORNL-DWG 69-5517 2
g a -I
-2
-3 0 5 10 45 20 25 (x IO2')
FLUENCE, nvl ( E -50 kev)
Fig. 17.11. Volume Changes in Poco Graphites at 715OC.
iJ
e
bi

227
RY - 42-29 /OH - 364
1
0
-2
-4 - d s? I
\ b
- 6
-8
-40 4.6 . 4.7 4 .8 4 .9 2.0 2.4
ORIGINAL DENSITY (g/cm3)
Fig. 17.12. Maximum Densification as a Function of Original Density, 715OC
tional graphites” excludes grades H364, H337, and the Poco grades in the light of an exceptional behavioral characteristic extending their expected lifetime as de- scribed below.
If the densification rate is common for the graphites, then the fluence required to obtain the maximum density will also be a linear function of the original density. This relationship is shown in Fig. 17.13. This means that the more dense conventional materials will achieve their maximum density more quickly, begin to expand, and have a shorter lifetime.I4 There are two materials, H364 and natural flake, that do not fall on the curve, and obviously the unplotted Poco grades would not follow this correlation. The initial structure of the natural flake grade is probably the most highly graphitic of the group. Thus the initial Crystallite growth rates and the initial densification rate would be lower, and the fluence required for maximum densifica- tion would be extended. The lower crystallite growth
I4The “lifetime” of the graphite is defined as that exposure where void generation as evidenced by volume expansion is sufficient to increase the open-pore size, allowing excessive f ~ o n product and poison accumulation. We have arbitrarily chosen the fluence required to return the material back to its initial volume after some densification. This is a conservative approach and may be particularly conservative for those graphites which only densify 1-2% before expansion. The actual limitation in lifetime will have to be determined by experiment.
0 1.5 4.6 4.7 4.8 4.9 2.0
ORIGINAL DENSITY (g/cm3)
Fig. 17.13. Fluence to Obtain Maximum Density as a Funo tion of Original Density.
rate can only be hypothesized, since it will be shown that the crystallite growth rates at minimum volume are the same for all the grades of graphite tested.
The H364 and the Poco grades do not fall on the curve in Fig. 17.13 because of a delayed densification. This factor is very significant since i t results in an extension of the lifetime of the graphite. This delay in densification is undoubtedly a result of the high continuity of c axis in the structure. The high con- tinuity of c axis is reflected by the very high coefficient of thermal expansion for these materials, 7 to 7.5 X 10⁻⁶/oC for the Poco grades and 6 to 7 X for H337 and H364 grades. Although the Poco and H337 grades have not reached their maximum density and could not be included in Fig. 17.13, they do exhibit an initial delay period (Figs. 17.7 and 17.8) and will very likely fall above the line. A high continuity of c axis in the structure is required for the c-axis growth to cancel the a-axis shrinkage and eliminate linear dimensional changes and densification. The isotropy can be obtained .either by randomization of anisotropic coke particles or by randomization of the crystallites within the coke particle to obtain an isotropic cbke. If anisotropic coke is used, the coke particle will change dimensions, and differential growth must be absorbed in the boundaries between coke particles. However, if the coke is iso- tropic, the differential growth will be absorbed in the boundaries between crystallites witw the coke parti- cle. The isotropic particles would not change dimen- sions, and the differential growth between particles

228
would be eliminated. At present, it is not certain how grades H337 and H364 obtain their isotropy, but preliminary observations using electron transmission microscopy'5 of the Poco grades indicate that their isotropy is obtained by using isotropic coke particles.
We do not understand why these graphites begin to densify after a significant period of irradiation. The c-axis continuity appears to be reduced, as evidenced by the observation that the coefficient of thermal expan- sion decreases as the material begins to densify.I6 The internal stresses created by the differential growth should be compressive in the c-axis direction, so it is difficult to understand how this could cause separations along the c axis. However, these graphites (H364, H337, Poco grades) have begun to densify after an initial delay, and the H364 has already achieved maximum density and experienced some volume expansion.
The Poco and H364 materials are significantly supe- rior in their resistance to both linear and volumetric change during irradiation. The Poco grades have not achieved their maximum densification in the present data. It is fairly evident that if the relationship in Fig. 17.12 holds for the Poco grades (density of about 1.85 glcm3) and they densify to the indicated 3-3.5% volume change, the fluence required to achieve maxi- mum density will be greater than 3 X I d 2 neu- trons/cm2. The extent that the lifetime will be ex- tended would be conjecture at this time. The Poco material is not available in the necessary shapes and sizes required for an MSBR, and it will be necessary to develop fabrication procedures for this graphite before it can be considered a potential candidate for MSBR applications. The H364 and H337 grades of graphite are reasonably stable and are available in the necessary sizes and shapes. This mitterial is still in the development stages, and further property improvements may be possible. These materials are currently prime candidates for use in early MSBR's.
One final significant result in this study is our analysis of the linear dimensional changes. The linear dimen- sional changes are largely dependent upon the preferred orientation of the graphite. However, volumetric changes, due to void closure, void production, and lattice parameter changes, are also reflected in the linear dimensional changes. These volumetric changes gener- ally do not have the same anisotropy functions as the crystallographic growth rates, so it is difficult to separate the observed linear growth rates into crystallite
"C. S. Morgan and C. S. Yust, sect. 17.7, this report. "A. L. Pitner, Irradiation Behavior of Poco Graphites,
BNWL€C-193 (November 1969).
and volumetric growth. This must be done to compare the effects of fabrication variables on the growth rates under irradiation. The solution to this problem is to obtain the linear growth rates when the volume change rate is 0, thereby eliminating the volumetric contribu- tion to linear growth. This allows a comparison of the growth rates when they are dependent solely upon the dimensional changes of the crystallites and their pre- ferred orientation. This can be done by using the following equation which describes the growth rates in the i, j , and k directions in a single-phase model:
* Gi=RiGa+(l -Ri)Gc+F,tf) ,
Gi=~,ka+(i - R @ ~ + F K ~ ~ , ( 1 ) d k 'RkGa + ( 1 -Rk)dc + Fk( f) ,
where
flh =contribution of volumetric changes to linear
R = orientation parameter determined by x-ray growth,
diffraction.'
The linear growth rate of each material determined when fli3 = 0 is plotted as a function of its orientation parameter, R , giving a graphical representation of Eq. (1). For the unique condition of f l 3 ) = 0, the intercept of such a plot at R = 0 and R = 1 yields the average crystallite growth rates in the c and a direction respectively. The linear growth rates obtained for all the materials at their respective fluence when f l V ) = 0 are given in Fig. 17.14.
The rather remarkable agreement of ten grades of graphite is surprising. This indicates that all ten ma- terials have essentially the same average crystallite growth rates independent of binder, Thermax additions, impregnations, and filler coke. I t is also significant to note that the linear growth rates when l@) = 0 were obtained over a range of exposures (7 X lo2' to 17 X Id' neutrons/cm2). This implies that the average crystallite growth rates are constant over this exposure range. As mentioned earlier, it has been previously reported' * that crystallite growth rates decrease with
I7O. B. Cavin, sect. 17.6, this report. "J. C. Bockros and A. S. Schwartz, A Model to Describe
Neutron-Induced Dimensional Changes in Pyrolytic cmbon. GA-7700 (Mach 1967).

I 229
c
. *
I .
i = 1 -
ORNL-DWG 69-3852 17.10 CALCULATION OF LIFETIME AND INDUCED STRESSES IN MSBR CORES
S. J. Chang W. P. Eatherly J. W. Prados
To assess the potential effects of fast-neutron damage in the core graphite of a molten-salt reactor, prelimi- nary calculations of induced stress distributions and distortions have been carried out by three different techniques. As a first approximation, the core graphite is assumed to be in the form of long cylindrical tubes, although the actual shape will be more complex.
We start with the basic constitutive equations
[U j - p (Uj + 6, )] 0 0.2 0.4 0.6 0.8 4 .O
R
+-L [bi - p " ( 6 j + o k ) l f ( @ , t ) Fig. 17.14. Growth Rate of Graphite as a Function of Re- E"
ferred Orientation, 715OC + k4[oj -P' (oj + 0, 11 +d4, t )
increasing crystallite size. These differences in crystal- lite growth rates may be real at low exposures when they were measured. However, crystallite size measure- ments of irradiated materials indicate that all materials increase or decrease to a common crystallite size of -150-200 A." This observation indicates that only short-term benefits can be obtained from increased crystallite size in the graphite.
In general, these results and the analysis of the results lead to several conclusions:
1. Linear dimensional stability is obtainable only with isotropic or near-isotropic materials.
2. Volumetric changes also contribute to linear dimen- sional changes, and the magnitude of their contribu- tion is reduced by increasing the original structural density.
3. The major behavioral characteristic that separates grades H364, H337, and Poco graphites from the conventional graphites is that of a delayed densifica- tion. This is the only process observed which appears to extend the useful life of the graphite. The origin of this desirable characteristic is not clear, but we have observed it only in the two types of materials having isotropic structures with very high coef- ficients of thermal expansion.
in which ei and ai are the strain and stress in the ith direction, the first term on the right is the elastic distortion, the second the primary creep, the third the secondary creep, and the last the rate of radiation- induced distortion. Since the primary creep is a rapidly saturating function, one may substitute.the asymptotic value of the function f, thereby suppressing its time dependence and combining it with the first term. Hence
ei - =- [ ' # Cu>(aj+6,)] 0 Cr--
+ k + [ a i - P' (ai + a,)] + t ) 9
where (E) and(p) are the effective Young's modulus and Poisson's ratio respectively.
A solution to these equations in closed analytic form can be found by using operator algebra. The solution is limited to the requirement that the parameters <E>,@), k+, and p' not be functions of radial position in the ' cylinder. This restriction is not a serious one for the present calculations.
A second solution has been developed by modifying an iterative technique employed in the analysis of stress and distortion in coated-particle fuels?' This approach permits k+ to be a function of radial position, does not
I9J. W. Helm, lReH-3Imdiation Experiment: Imdktion of 2oJ. W. Prados and T. G. Godfrey, STRETCH, a Computer EGCR Graphite - Interim Report No. 2, HW 71500B Rogram for Predicting Coated-Particle Imdktion Behavior, (September 1964). Modification IV, ORNL-TM-2127 (April 1968).

230
require isotropy in the graphite, and permits the secondary creep to be a more general function of the stresses.
The third solution, using an impulse-type analysis, has also been derived:' which further generalizes the solutions to arbitrary boundary shapes providing only that elastic solutions can be found. It is limited, however, to a linear stress dependence in the secondary creep.
All three solutions have been computer programmed, debugged, and shown to give the same numerical results within their region of overlap. In particular, the stresses and distortions have been calculated for the present reactor parameters aimed at a four-year graphite life. The material parameters employed are as follows:
Young's modulus: E = 1.9 X Id psi, Poisson's ratio: p = 0.27, thermal expansion coefficient: a = (5.52 X + 1.00
thermal conductivity: K = 37.63(T+ 273.1)O.' w cm-'
secondary "Poisson's ratio": p" = 0.50, creep coefficient: k = (5.3 - 1.45 X T + 1.4 X
The induced distortion rate g(4, r ) was derived pri- marily from the experimentally determined behavior of British isotropic Gilso graphite:
x I O - ~ T ) ( O c ) - ' ,
("c)-', 1
1 0 - ~ P ) x (psi nvr)-'.
where
C, = -4.01 t 2.97 X lO-'T percent, #7 =(9.36 - 8.93 x ~ o - ~ T ) x ld2 (nvr),
7 = lifetime, sec.
In all the above equations Tis the graphite temperature in degrees centigrade.
Parameters associated with the reactor were taken as follows:
salt temperature: To = 625 - 75 cos- deg C,
flux: + = (3.2 X lo") sin - neutrons/cm' (E > 50
7fZ
1 7fZ
1 kev),
"S. J. Chmg, Visco-Elastic Analysis of Gmphite Under Neutron Irradiation and Temperature Distribution, ORNG TM-2407, to be published.
7fZ gamma heating: q = 0.71 + 4.39 sin- w/cm3 ,
graphite outer radius: b = 5.39 cm, graphite inner radius: a = 0.762 cm,
where z/l is the fractional height along the core center line. The heat transfer coefficient between the salt and graphite was calculated from the Dittus-Boelter equa- tion for turbulent flow with salt properties as follows:
thermal conductivity: 0.75 Btu hr-' ft-' (OF) - ' ,
flow: 6.08 X IO6 Ib ft-2 hr-' , viscosity: 0.193 exp [7816/T("F)] Ib/ft, specific heat: 0.324 Btu Ib-' (OF)-' .
I
Over the temperatures of interest this yields a heat transfer coefficient
ORNL-DWG 69-4735
0 0.1 0.2 0.3 0.4 0.5 0.6 0.7 0.8 a9 4.0 z, i , FRACTIONAL HEIGHT
Fig. 17.15. Maximum Thermal Stresses Developed in the Graphite at Reactor Startup.
500
L' 400 B - wm tJ 200 t+
:* 400
W fK
e
0
ORNL-DWG 69-4736
0 0.t 0.2 0.3 0.4 0.5 0.6 07 0.0 0.9 4.0 z/d, FRACTIONAL HEIGHT
LI
. e
. -
, Fig. 17.16. Maximum Radiation-Induced Stresses Developed
in the Graphite at the End of Core Life.

231
. c .
t
.
3
a
I
.
The results of the calculations are as follows: The graphite is under the most severe flux-temperature environment at z/Z = 0.55 (i.e., slightly over halfway up the core) and at that point has a lifetime2 of 4.1 years. The maximum thermal stresses are tensile and occur at the surfaces of the graphite (see Fig. 17.15). They anneal out due to creep in a few weeks time and do not
22As the definition of lifetime, we take a priori the time at which the most damaged region in the graphite returns to its original volume.
exceed 560 psi. The maximum radiation-induced stresses are tensile and occur at the end of the graphite life (see Fig. 17.16). They do not exceed 500 psi. Since the graphite should have an ultimate tensile strength of about 5000 psi, these stresses are not significant.
The dimensional behaviors are shown in Figs. 17.17 and 17.18. These are expressed in terms of the function Gi, representing the percentage distortion of the ith dimension. The cylindrical graphite tubes will show a maximum radial shrinkage of about 2.2% and a
Fig. 17.17. Radially Induced Distortion of Graphite as a Function of Axial Position o n the Reactor Core Centerline as a Function of Time.
ORNL-DWG ss-473m
0 I 2 3 4
TIME AT 80% PLANT FACTOR (years)
Fig. 17.18. Axially Induced Distortion of Graphite on Re- actor Core Centerline as a Function of Time.
maximum axial shrinkage of about 1.6%. These dimen- sional changes are significant but can be compensated for in the core design.
Recent data on the irradiation of newer graphites given in Sect. 17.9 suggest that materials superior to the British Gilso graphite will be available within the next few years. Hence the above numbers represent an upper limit to the stresses and distortions which can be expected in an actual reactor.

18. Hastelloy N
U
.
18.1 INFLUENCE OF TITANIUM AND CARBON ON THE MECHANICAL PROPERTIES
OF NICKELBASE ALLOYS
C. E. Sessions
We have extensively investigated the influence of titanium and carbon interactions on the high-tempera- ture creep-rupture properties of laboratory melts of Ni-12% Mo-7% Cr alloy. The influences of heat treatment, strain rate, and composition were evaluated for creep testing at 650°C in air. Representative results of the heats listed in Table 18.1 will be discussed. The material investigated has a base composition of Ni-12% Mo-7% Cr-0.5% Ti, with the carbon content in- creasing from 0.003 to 0.3% for heats 193 to 242. We also included heat 198, which contains no titanium and 0.04% C. Thus a comparison of heats 196 and 198 would give the effect of titanium alone, since these two alloys have an equivalent carbon content.
Carbon concentration has a marked effect on the rupture life of this alloy (Fig. 18.1). The rupture life increases by four orders of magnitude for a factor of 100 increase in the carbon level. No added strengthen- ing is found, however, above -0.1% C. This increase in rupture life is the result of a marked decrease in the rate of secondary creep deformation, as shown in Fig. 18.2. The steady-state creep rate decreases by three orders of magnitude over the carbon levels investigated for each
of the three different pretest heat treatments shown in Fig. 18.2. Note that the samples aged 100 hr at 87OoC have a higher creep rate than either of the solution- annealed samples. Also, the presence of 0.5% Ti lowers the creep rate at the 0.05% C level by a factor of approximately 10.
A correlation of the creep ductility as a function of carbon content and secondary creep rate is shown in Figs. 18.3 and 18.4 respectively. The total elongation experienced at rupture when tested at 40,000 psi and 650°C shows little variation for the heat treatments investigated over the range of carbon concentration of 0.003 to 0.1%. Above 0.1% C we observed an increase in ductility at 40,000 psi. The heat with no titanium, No. 198, exhibits roughly the same ductility as the heats containing titanium.
Correlating the total elongation with creep rate, as in Fig. 18.4, for the intermediate and high carbon levels, we find lower ductility at a given creep rate for the heat without titanium (No. 198). The corresponding heats containing titanium(heats 195 and 196) show 8 to 10% greater total elongation for a given creep rate at 650°C. For the higher carbon levels (0.27 and 0.3% C) the ductility-strain-rate relationships differ even though the carbon levels of the two heats are nearly the same.
A final comparison of the effect of titanium on the rupture life of this alloy is shown in Fig. 18.5 for three different heat treatments. The presence of 0.5% Ti
AUOY
193 194 195 196 238 197 242 198
Table 18.1. Compositions of Experimental Nickel-Base Alloys
Mo Cr Ti
13.5 7.0 0.48 13.4 7.3 0.47 13.7 7.6 0.54 11.5 6.7 0.51 12.5 7.2 0.50 11.3 6.6 0.47 12.0 7.4 053 12.4 7.3 <O.Ol
In weight percent
C Fe Si
0.003 0.03 0.01 0.007 0.03 0.02 0.037 0.03 0.01 0.053 0.07 0.01 0.096 0.22 0.02 0.27 0.07 0.01 0.32 0.31 0.02 0.042 0.13 0.01
Mn
<0.02 <0.02 <0.02 <0.02 0.08
<0.02 0.12
<0.02
A1
<0.05 <0.05 <0.05 <0.05 <0.05 <0.05 <0.05 <0.05
S
<0.002 0.003
<0.002 <0.002 0.004
<0.002 0.004
<0.002
. -
.
G* 232

233
5
2
405 c - I)
n
v) In w
c v)
a
5
(2 :
2
do4
\ (28 .9:
40-' 2
0 494 0 495
0 238
4 497
A 242
CARBON CONTENT (*lo)
0.003 0 .007 0 .037
0 .05
0.40
0 . 2 5
0.32
I I A 498 0 . 0 4 (NO TITANIUM ) I
5 40' 2 5 40' 2 5
ORNL-DWG 69-5519
4 4 04
RUPTURE LIFE (hr )
Fig. 18.1. Creep Rupture of Ni-12% Mo-7% Cr-0.5% Ti Alloy at 650°C as a Function of Carbon Content.
increases the rupture life by about 1% orders of magnitude at a given stress level and increases the ductility to some extent, particularly at the lower stress levels.
The strong influence of carbon and titanium on the creep properties of this alloy indicates that carbide precipitates very likely play an important role in determining the properties. Future work will concen- trate on identifying these precipitates.
18.2 AGING OF MODIFIED HASTELLOY N
C. E. Sessions
We are evaluating the tensile and creep properties of four heats of titanium-modified (0.1 5 to 1.2%) Hastel- loy N after aging at temperatures of 650 and 760°C. As reported previously,' 9' the tensile property changes
after 3000 hr of aging at 650 and 760°C indicated that aging did result in a reduction in the high-temperature ductility of the modified alloy and that the change was more significant after the 760°C treatment. This indica- tion of a thermal instability in the alloy system, however, required assessment for longer aging times and for creep conditions to fully characterize the material.
Table 18.2 shows the effects of aging on the properties of the four alloys investigated. The samples were aged for 1500 and 3000 hr at 650 and 76OoC, and the tensile properties were measured at 650°C at a
' C . E. Sessions, Fuels and Materials Development R o p m Quart. Roc. Rept. Sept. 30, 1968, ORNL-4350, pp. 163-73. 'C. E. Sessions, MSR Rogmm Semiann. Roc. Rept. Aug. 31,
1968,ORNL4344, pp. 239-43.

234
Fig. 18.2. Influence of Carbon on the Sewn& Creep Rate of Ni-12% Mo-796 Cr-0.5% Ti Alloy at 650°C and 40,000 psi.
60
A I hr AT 4477OC
tl 0 4 hr AT 4260°C 0 4 hr AT ((77 PLUS
IOOhr AT 870°C
i Eal 0 10-3
ALLOY WITHOUT TITANIUM
I 0-2
ORNL-DWG 69-!
l l l l m IO-' roo
CARBON CONTENT (i)
Fig. 18.3. Effect of Carboh and Titanium on the Total Creep Elongation of Ni-12% Mo-7% Cr-O.5% Ti AUoy at 650°C and 40,000 psi.
60
50
- E 40 z g 30
s 3 20 P
w -I
IO
0 40-3 10-2
I 1 I I I I I l l l l I I 1 1 l 1 1 ORNL-DWG 69-5522
HEAT CARBON CONTENT
40-'
0.04 (NO TITANIUM1
0.04 0.05
0.27 0.32 1
U 100 40'
SECONDARY CREEP RATE (%/hr)
Fig. 18.4. Correlation of Total Creep Elongation with the Secondary Creep Rate at 650'C for Ni-12% Mo-7% Cr-0.5% Ti Alloys with Varying Carbon Contents After a 1-hr Annealing at 1177OC. Solution anneal.
strain rate of 0.002 min-' . The effect of aging at 650°C is to reduce the high-temperature ductility slightly after 1500 hr and significantly after 3000 hr for each heat except 466-548. Aging at 760°C reduces the ductility for all heats a significant amount after both 1500 and 3000 hr. A corresponding increase in the yield and ultimate tensile strengths is found for most aging conditions.
The effect of pretest thermal-mechanical treatment is to influence the overall level of strength and ductility, as shown in Table 18.2; however, the influence of any particular pretest heat treatment differs from heat to heat.
Representative tensile curves showing the effect of prior aging on the 650°C behavior are shown in Fig. 18.6. Each curve is for heat 467-548 (l.%Ti), with the heat treatments listed in the caption. If we interpret the serrations as being due to the effect of solute-atom- dislocation interactions, then the 760°C aging treat- ment has eliminated the serrations by precipitation of solutes from solid solution.
Evaluation of the effects of aging on the creep properties of these modified alloys is currently in progress. Table 18.3 lists the results from control and aged samples tested to date. The control tests on unaged samples show the greatest strength and the lowest ductility for the prestrained material. The optimum ductility was obtained from the samples solution annealed at 1260°C prior to creep testing. Tests on the aged samples indicate no deterioration in the creep properties due to aging 1500 hr at either 650
.,
.
. -

40-'
235
HEAT
ORNL-DWG 69-5523
i 10' 402
RUPTURE LIFE (hr)
Fig. 18.5. Influence of Heat Treatment on the Stress Rupture Roperties of Ni-12% Cr-0.04% C Alloy With and Without 0.5% Titanium.
or 760°C. However, heats 466-535 (0.15% Ti) and 466-541 (0.30% Ti) exhibit a loss of creep strength and ductility after aging 3000 hr at 760°C. In agreement with the tensile results, heat 466-548 (0.45% Ti) actually showed an increase in strength and ductility after 1500 and 3000 hr at the 65OoC aging temperature. No conclusions can be drawn from the tests on heat 467-548 (1.2% Ti) except that the as-annealed prop erties are d e f ~ t e l y superior to the c;eep properties of the three heats containing lesser amounts.
The few tests completed indicate that in some heats a deterioration in high-temperature properties is found after aging, but none of these changes are large enough to account for the gross deterioration in creep strength and ductility that has recently been found for modified Hastelloy N when irradiated at temperatures above 700°C: that is, the effects found under irradiation can- not be accounted for by thermal aging effects alone.
18.3 INFLUENCE OF IRRADIATION
PROPERTIES OF HASTELLOY N H. E. McCoy
TEMPERATURE ON THE CREEP-RUPTURE
Our previous studies showed that titanium-modified (0.5%) Hastelloy N had good postirradiation properties when irradiated at temperatures up to 660"C, but that very poor properties resulted for irradiating above 704"CP We also found that a small melt that did not contain titanium exhibited a similar dependence on irradiation temperature; so we suspected that the variation of properties with irradiation temperature
'H. E. McCoy, Fuels and Materials Development Rogram mart. bog. Rept. Sept. 30, 1968, ORNL4350. pp. 163-73. 4H. E. McCoy, MSR Rogmm Semiann. hog . Rept. Aug. 31.
IWS,ORNL-4344, pp. 244-47.

236
1 Table 18.2. Comparison of Pre- and Postaging Properties of Modified Hastelloy N Measured at 650°C"
Percent Change in Properties After Aging
Percent Change in Properties After Aging
Properties Before Indicated Time at 650°C Indicated Time Titanium Heat Aging ~ at 76OoC
Heat Contentb Treatment Uniform Yield uniform Yield uniform Yield (%I Elongation Strength ti^^ Strength Elongation Strength
1500 3000 1500 3000 1500 3000 1500 3000 h r h r h r h r h r h r h r h r
466-535 0.15 121c 27.4 28.9 -9 -32 34 36 -42 -51 22 13 123d 30.4 25.3 -31 -60 31 39 -55 -53 30 21 109e 18.9 48.5 -20 -43 19 11 -38 -42 2 -8
466-541 0.30 1 121 31.4 27.0 12 5 30 28 - 4 3 -51 23 16 123 30.7 21.4 -47 -66 24 40 -50 -56 46 39 109 22.6 44.9 -4 -20 7 -2 -51 -57 0 - 4
466-548 0.45 121 29.3 24.7 38 35 20 21 20 -31 22 22 123 30.0 20.4 57 48 19 28 8 -17 33 26 109 20.0 42.8 36 34 5 3 -26 -27 -3 -5
467-548 1.2 121 34.5 36.6 -18 -24 27 18 -25 -29 14 11 123 41.3 29.1 -41 -58 47 54 -73 -68 61 53 109 23.1 68.8 -6 -21 -6 -11 -10 -11 -10 -19
(%I
"Tensile tested at 650°C and 0.002 min-' strain rate. bAll alloys haze a nominal composition of Ni-12% Mo-7% ( 2 ~ 0 . 2 % Mn-0.05% C. c1 hr at 1177 C solution anneal. dl hr at 1260°C solution anneal. el hr at 1177OC anneal plus 10% prestrain at room temperature.
might be general for Hastelloy N. However, our work with standard air-melted Hastelloy N showed that this material was insensitive to irradiation temperature. The types of carbide precipitates were found to depend on the alloy composition and the irradiation temperature; in general, MC carbides were associated with good properties, and M6C and M2C were found in samples having poor postirradiation properties.'
We then irradiated several experimental alloys that contained various amounts of carbide-forming elements such as Hf, Nb, Ti, Zr, and Y. The nominal chemical compositions of the alloys studied are given in Table 18.4, and the results of postirradiation creep-rupture tests are summarized in Fig. 18.7. All the data points shown in Fig. 18.7 are for samples irradiated at 760°C and tested at 650°C. The first number by each point is the heat designation, and the second number is the fracture strain. The lines were determined by previous tests and are labeled, but no data points are shown.
'R. E. Gehlbach, this report, sect. 18.4.
.
Heat 5911 is standard Hastelloy N that has been vacuum melted. When irradiated at 650°C its properties are represented by the indicated solid line; but after irradiation at 760°C the rupture life is much shorter, and the fracture strains are very low.
Several heats containing 0.5% Ti were included in t h i s study. The data on heat 66-548 used to construct the line on the extreme left of Fig. 18.7 were presented previously? The indicated pointk for this same heat from the current experiment agree well with the previous observations. The other heats containing 0.5% Ti (21545, 104, 7320, 67-526) were not affected as drastically by irradiation temperature, but their postir- radiation properties are not as good as those for standard air-melted Hastelloy N. Alloys 107 (1% TG and 67-548 (1.2% Ti) give some indication that alloys with higher titanium concentrations may be stable
Alloy 273 was prepared to determine whether a small addition of silicon (0.5%) would help stabilize the desired MC-type carbide in an alloy containing OS% Ti during irradiation at 760°C. Comparison of the results
during irradiation at 760°C. c
..
.)
bj

108.4
100.2
92.0
73.8
- 65.6 .- u)
0" 57.4 0
49.2 v)
E 41.0
32.8
24.6
16.4
8.2
0
mg, 18.6. Tensile'Curve for Aged and Unaged Samples of HnsteUoy N. Heat 467-548 (1.2% Ti). (1) As solution annealed 1 hr at 1177OC;(2) as solution annealed at 1177°C plus aged 3000 hr at 650°C; (3) as solution annealed at 1177°C plus aged 3000 hr at 760°C; (4) as solution annealed at 1177OC plus aged 1500 hr at 760°C; (5) as solution annealed at 1177OC plus aged 1500 hr at 65OOC.

238
Table 18.3. Results of Creep-Rupture Tests on Titm2rnModified Hastelloy N Tested at 40,000 psi and 650 C Li
Reduction
(%)
Minimum
Rate
Rupture Fracture Creep hArea Aging \e Temperature Life Strain
(%/hr) (hr) ("0 (hr) (%I Heat Anneal
466-535
466-541
466-548
467-548
1 2 f 123b logc 121 121 123 123 121 121 121 123 109 121 121 123 123 121 121 123 109 121 121
123 123 121 121 123 109 121 121 123 123
0 0 0
1500 1500 3000 3000 3000 3000
0 0 0
1500 1500 3000 3000 3000
0 0 0
1500 1500 (duplicate) 3000 3000 3000
0 0 0
1500 1500 3000 3000
650 760 650 760 650 760
650 760 650 760 650
650 760
650 760 760
650 760 650 760
166 51
194
136 217 26
138 64
34 2 189 309
217 50 41
508 358 125 620 670 42
594 345 175 135
1100 2472 2149
1006 2 5 0 1454
9.5 13.6 3.6
11.3 13.7 8.3
13.6 9.5
15.2 21.5 5.9
18.9 9.7 9.9
27.6 16.7 19.3 11.7 27.2 7.9
42.1 29.1 24.1 16.7 41.1 21.6 30.5
32.4 x 20.4
0.0 13 0.012 0.005
0.049 0.035 0.087 0.063 0.007 0.006 0.008 0.004
0.054 0.072 OiO84 0.031 0.012 0.011 0.006 0.020 0.120 0.025 0.097 0.066 0.054
0.004 0.005
0.019
0.010
10.6 24.4
6.4
17.4 15.2 9.5
14.3 13.2 17.7 26.6 13.9
19.5 12.9 17.6 26.9 22.3 28.2 17.8 30.1 18.3 34.2 37.3 37.6 21.9
38 17.6 29.0
47.7
"1 hr at 1177:C. bl hr at 126OOC.
hr at 1177 C plus 10% prestrain.
for heats 104 and 273 indicates that the silicon addition did not lead to improved properties.
Alloys 146 and 147 contain 1% Zr in addition to small amounts of Re. The postirradiation properties of these alloys are quite good, and the improved behavior is probably due to the Zr since alloy 1 12 (1.2% Zr) also has good properties. However, since the Zr addition causes poor weldability, we plan no further develop ment of alloys with Zr additions.
Heat 67-504 (0.5% Hi) was found to have excellent properties following irradiation at 65OoC,6 but the results shown in Fig. 18.7 for this alloy after irradiation
at 76OoC are poor. Heat 232 with 1% Hf has improved properties, and heat 184 with 1% Ti and 1% Hf has even better properties.
Heat 237 contains 1% Nb and 0.2% Si, and the postirradiation properties are not very good. Heat 181 contains 2% Nb, 0.5% Ti, and no Si, and the properties are very attractive. The question of whether a sufficient quantity of Nb could be added to give good postirradia- tion properties is st i l l open.
a
t
*
* - 1
64 6H. E. McCoy, MSR ProgrCmz Semiann Rogr. Rept. Aug. 31, 1968,ORNL-4344, pp. 211-23.

ce)
8 L;; W a
239
Tabk 18.4. Nominal Compositions of Alloys Studied
Content (wt %)
AnoY Ni Mo Cr Fe Si Mn C Ti
StandardN Bal 16 7 4 0.5 0.5 0.05 0 5911 Bal 16 7 0 a . 1 0.2 0.05 0
66-548 Bal 12 7 0 0 0.2 0.05 0.5 21545 Bal 12 7 0 0 0.2 0.05 0.5 104 Bal 12 7 0 0 0.2 0.05 0.5
67-526 Bal 16 7 0 0 0.2 0.05 0.5 107 Bal 12 7 0 0 0.2 0.05 1.0 67-548 Bal 12 7 0 0 0.2 0.05 1.2 273 Bal 12 7 0 0.5 0.2 0.05 0.5 146 Bal 12 7 0 0 0.2 0.05 0 147 Bal 12 7 0 0 0.2 0.05 0 112 Bal 12 7 0 0 0.2 0.05 0 67-504 Bal 12 7 0 0 0.2 0.05 0 232 Bal 12 7 4 0.2 0.5 0.05 0 184 Bal 12 7 4 0.2 0.5 0.05 1.0 237 Bal 12 7 4 0.2 0.5 0.05 0 181 Bal 12 7 0 0 0.2 0.05 0.5 1-3 Bal 12 7 4 0.2 0.5 0.05 1
7320 Bal 12 7 0.1 0 0.2 0.05 0.5
0
Other
2 w
1 Zr, 0.1 Re l Z r , l R e 1.2 Zr 0.5 Hf 1 Hf 1 Hf 1Nb 2Nb 1 Y
70
60
STANDARD HASTELLOY N AIR MELTED.1 650 AND 760% VAC MELTED 1 6 5 0 - C
50
40
30
20
io
0 i 0’ 4 02
RUPTURE LIFE (hr)
ORNL- DWG 69--592R2
to3 io4
Id Fig. 18.7. Stress Rupture Roperties of Several Modified Hastelloy N Alloys Measured in Postirradiation Creep Tests at 650°C.

240
The postirradiation rupture life of heat 183 (l,% Ti and 1% Y) is not very good, but its fracture strains are attractive. Metallographic examination showed that the grain size was very small, and our previous experience leads us to believe that higher preirradiation anneals (to get a larger grain size) might improve the rupture life.
These observations show that several alloy combina- tions involving additions of Nb, Hf, Ti, and Y have promise for prolonged use at temperatures above 700°C.
18.4 ELECTRON MICROSCOPY STUDIES
R. E. Gehlbach S. W. Cook
We reported previously that carbide precipitation in Hastelloy N is sensitive to the chemical composition.' sa
In the air-melted heats of the standard alloy, containing 0.4 to 0.6% Si, only M6C-type precipitates form. They are enriched in silicon and are stabilized by its presence. Reduction of the silicon to trace levels, as is possible by vacuum melting practice, results in M2 C-type precipita- tion after exposure to intermediate aging temperatures. This M2C can be readily put into solid solution at normal solution-annealing temperatures, whereas the M6C type is not heat treatable.
Precipitation in the modified (12% Mo) versions of the alloy is sensitive to alloying additions of Ti, Nb, Zr, and Hf: and when these elements are present the precipitation processes are temperature dependent. Mechanical properties, particularly after irradiation, are also affected by composition and temperature." We are concentrating our studies on understanding the role of these alloying additions on the types and mor- phologies of precipitates and evaluating the effects they have in controlling the mechanical behavior of the material after irradiation. The precipitates being studied are those that result from aging at 650 and 760°C (an MSBR will operate at 704°C).
The various carbides have been identified using several techniques. The types and relative amounts of carbides present in a specimen were determined by dissolving the matrix and analyzing the remaining precipitates by x-ray diffraction. Selected-area electron diffraction and electron-microscope-microprobe analysis were used to
'MSR Progrrrm Semiann. &os Rept. Feb. 29, 1968,
'MSR Rogram Semiann Rogr. Rept. Aug. 31. 1968,
'Hereafter the alloying elements Ti, Zr, Nb, and Hf will be
'OH. E. McCoy, this report, sect. 18.3.
ORNL-4254, pp. 206-13.
ORNL4344, pp. 247-50.
referred to as the Ti-group elements.
W relate the crystal structure, morphology, and composi- tion of individual precipitates on extraction replicas. The distribution of precipitates was observed by elec- tron microscopy of thinned bulk specimens and extrac-
Since the silicon level in these modified alloys is low, the M6C formed in the standard material is not present. In the modified alloys without additions of the Ti- group elements, only M2C precipitates at aging temper- atures of 650 and 760°C. The addition of the Ti-group elements promotes the formation and stability of carbides of the MC type, having face-centered cubic structures with lattice parameters ranging from 4.21 to 4.68 A. Higher concentrations of the Ti-group elements are required to stabilize the MC types at 760°C than at 650°C. These trends are shown in Table 18.5.
The M2C carbides have the MRC structure but contain about 10 to 20% Cr and thus would be more appropriately designated (Mo,Cr),C. The compositions of the MC types depend on the amount of the particular elements from the Ti group contained in the material. At low Ti concentrations, (Mo,Cr)C is formed. Increasing the concentration of Ti in the alloy results in some Ti substituting for Cr in the carbides, with an increase in lattice parameter. Adding Nb, Hf, or Zr promotes the stability of the carbides of that group (e.g., HK). In general, the MC carbides are finer than the M2C type, and their distribution in the bulk material would appear to result in superior postirradia- tion mechanical properties than would that of the M2 C precipitate.
The distribution of MC, or (Mo,Cr)C, in heat 66-548 (a commercial alloy with 0.45% Ti) after aging at 650°C is shown in Fig. 18.8. Particular importance is given to the fact that many fine precipitates lie adjacent to the grain boundaries and extend into the matrix. In contrast, aging t h i s material at 760°C produces larger precipitates in both the matrix and grain boundaries. Some precipitate also exists in the form of very thin (probably <lo0 A) continuous films covering extensive areas in the grain boundaries. These thin films and the helium bubbles noted in this material after irradia- tion' ' would be expected to result in poor postirradia- tion mechanical properties.
The distributions of precipitates formed during irradi- ation and formed by aging in the absence of irradiation at similar temperatures are different. Figure 18.9 is a transmission electron micrograph of an unstressed specimen irradiated for 1128 hr at 635°C in the ORR.
tion replicas. ,b
S .
0
c
-
0
.
"MSR Program Semiam Bog. Rept. Aug. 31, 1968, ORNL4344, pp. 249-50.

241
Qs
L.
F
4
Table 185. Phases Resent in Various HasteUoy-N-llpe Alloys After Aging 0 1 0 0 0 hr) at the Indicated Temperature
AnOY 65OoC 76OoC
Standard Hastelloy N (0.5% Si ) Standard Hastelloy N(<0.1% Si) 198 (12% Mo) 66-535 (12% M0-0.12% Ti) 196 (12% M0-0.5% Ti) 66-548 (12% Mo-0.45% Ti) 107 (12% Mo-l.O% Ti) 67-548 (12% M0-1.2% Ti) 112 (12% Mo-1.0% Zr) 181 (12% Mo-0.5% Ti-2% Nb-0.2% Si ) 184 (12% Mo-l%Ti-l%Hf)
MC MC
(MC)' + M2C
MC
MC MC
"Phase present in minor amount .
Fig. 18.8. Distribution of MC Cubides in HasteUoy N (Heat 66-548,0.45% Ti) After Aging 1500 hr at 65OoC 10,OOOX.

242 *
Fig. 18.9. Distribution of Precipitates in Hastelloy N (Heat 66-548, 0.45% Ti) After Irradiating for 1128 hr at 635OC. 10,000x.
Although a considerable amount of precipitate is present in the grain boundaries, the distribution is considerably different from that obtained by aging in the absence of irradiation at 650°C (Fig. 18.8). Essen- tially no precipitates were present in a specimen irradiated for 1128 hr at 703°C; however, many bubbles were present on the grain boundaries, and fracture occurred in this material with essentially no strain:' Bubbles were observed at grain boundaries in the material after irradiation at 635"C, but the irregular precipitates in the grain boundaries probably strengthen the boundaries and prevent the propagation of grain boundary cracks.
It would appear that a structure similar to that shown in Fig. 18.8 would result in good postirradiation properties. The fine precipitates along grain boundaries seem characteristic of the MC-type carbides. As shown in Table 18.5, increasing the amounts of the Ti-group elements promotes the stability of these carbides. The alloys with the higher concentrations of these elements (heats 181, 184, 67-548) exhibit excellent postirradia- tion properties after irradiation at 760°C.'2 Although we have not examined the phases present in these alloys after irradiation, it appears likely that the MC carbides are present and occur in a favorable distribution.
~~
12H. E. McCoy, thisreport, sect. 18.3.
L) 18.5 MEASUREMENT OF RESIDUAL STRESSES IN HASTELLOY N WELDS
A. G. Cepolina D. A. Canonico We have been investigating the levels and distribution
of residual welding stresses in '/* -in.-thick Hastelloy N plate and the effects of various thermal treatments to . reduce or eliminate these stresses. The theory and t
experimental procedures were discussed pre- viously,' ' and more recently data were presented' s relating the as-welded residual stresses to variations in heat input and shielding gas. The effect of stress-relief treatments at 1 177,870, and 650°C on the distribution of the residual stresses was also discussed.'
* .
"MSR Rogmm Semiann. Prop. Rept. Aug. 31, 1967,
I4MSR Program Semiann. Rogr. Rept. Feb. 29, 1968.
"MSR Rogmm Semiann. Rope Rept. Aug. 31. 1968,
ORNL-4191, pp. 223-26.
ORNL-4254, pp. 215-17. .
ORNL-4344, pp. 256-57.
ORNL-DWG 69-5524 6
5
4
3
2
I .-. in a . 0 0
2 0 Y
ul
a - 4
- 2 t;
# .
2
4
0
- 4
-2 - . 2.0 2.5 3.0 3.5 4.0 4.5 5.0
RADIUS (in.) ,. Fig. 18.10. Tangential and Radial Residual Stresses in ?&in.-
thick Hastelloy N Plates. The welds were circular and had a radius (R) of 3 in. from the center of the plate. (a) As-welded plate, (b) annealed 6 hr at 76OoC after welding.
*

L A 243
Recently, we have investigated the effects of a treatment of 6 hr at 760'C on the residual stresses of weldments made at 15,000 j per inch of weld. The results of this treatment on the residual stresses are shown in Fig. 18.10. For comparison, we have included the distribution of the as-welded residual stresses. I t can be seen that the 760'C treatment is effective toward reducing the peak tangential and radial residual stresses. Undoubtedly, even lower values can be attained with a longer treatment at 760°C.
18.6 CORROSION STUDIES J. W. Koger A. P. Litman
We are continuing our study of the compatibility of fused fluoride sala with structural materials of interest to the MSRP. The studies currently are centered around the compatibility of the Hastelloy N alloys with salts appropriate for single-fluid breeder reactors, but some tests begun earlier with salts of interest for two-fluid systems have been continued. Eight natural circulation loops are presently in operation. Table 18.6 details the service parameters of these test units, and Table 18.7 gives the compositions of the standard and titanium- modified Hastelloy N.
18.6.1 Fuel Salts
Loop 1255, constructed of standard Hastelloy N and containing a simulated MSRE fuel salt plus 1 mole % ThF4, continues to operate without difficulty after 6.9 years.
Loop 1258, constructed of type 304L stainless steel and containing removable specimens in the hot leg, has operated about 5.6 years with the same salt as loop 1255. A plot of the weight change of the insert specimens at various temperatures is given in Fig. 18.1 1 as a function of operating time. The corrosion rates based on these weight changes range from 1 to 2 milslyear.
Loop NCL-16, constructed of standard Hastelloy N with removable specimens in each leg, has operated with the two-fluid MSBR fuel salt for over 9000 hr. A plot of the weight change of the specimens in the hottest and coldest positions as a function of operating time is given in Fig. 18.12. The average corrosion rate has been <0.05 mil/year in this loop. The hot-leg specimens show that the titanium-modified alloy spec- imens at 704'C (1300'F) and 676'C (1250'0 have smaller weight changes than the standard specimens at 660°C (1220'0. Figure 18.13 shows the changes in
concentration of chromium and iron in the salt as a function of operating time. The chromium has shown a steady increase (linear for the last 4000 hr), while the iron increased initially and now is slowly decreasing as the iron fluoride oxidizes the chromium in the Hastel- loy N.
18.6.2 Fertile-Fissile Salts
Loops NCL18 and NCL-19, constructed of standard Hastelloy N with removable specimens in each leg, have operated for 2900 and 3600 hr, respectively, with the fertile-fissile salt under identical temperature condi- tions. Loop NCL19 has a molybdenum hot finger containing bismuth at the bottom of the hot leg (Fig. 18.14). These loops are being operated to obtain data on the compatibility of the fertile-fissile salt with the Hastelloy alloys and to determine if contacting the salt with liquid bismuth will affect the corrosion rate.
The weight changes of specimens from loop NCL-18 were measured after 1465 hr exposure to the salt. The standard Hastelloy N specimen at 699°C lost 0.5 mglcm' , while the titanium-modified Hastelloy N specimen at the same temperature lost 0.3 mdcm'.
The weight changes of specimens from loop NCL-19 were measured after 2250 hr exposure to the salt. The standard Hastelloy N specimen at 699°C lost 0.6 mglcm' , while the titanium-modified Hastelloy N specimen at the same temperature lost 0.2 mg/cm2. Table 18.8 gives the bismuth concentration in the salt after various operating times.
We are investigating the reason for the large amount of bismuth in the 840-hr salt sample. The lower bismuth content in later salt samples indicates either that the analysis was in error or that bismuth was possibly entrapped in the salt. Work is under way to- establish the sensitivity of the bismuth chemical analysis procedure to salts of these types. A study of the analytical procedure for the determination of bismuth in the salt has indicated that at the 100-ppm level, one should not place much confidence in the numerical values. Additional evidence of analytical uncertainty was found in the reported bismuth analyses of the salt from loop NCL-18, <25 ppm at 0 hr, 60 ppm at 672 hr, <20 ppm at 18 17 hr (loop NCL-18 does not contain any intentional bismuth addition). In any case no effect of bismuth is apparent in the corrosion rates. Specimens in loops NCL-18 and NCL-19 do not show significantly different weight changes. In 1484 hr of operation the chromium content of the salt increased from <25 to 57 ppm in both loops. No changes in the concentrations of the other constituents have been noted.

Table 18.6. MSRP Natural Circulation Loop Operation Through February 28,1969
Specimens Maximum AT Operating Time
("0 (W Salt Type Salt Composition (mole %) Temperature ("0
Loop No. L?op Material
1255 Hastelloy N Hastelloy N + 2% Nbanb Fuel LiF-BeF2 -ZrF4-UF4 -ThF4 704 90 60,600 (70-23-5-1-1)
1258 Type 304L SS Type 304L stainless
Hastelloy $Od
Hastelloy N; Ti-modified ~astelloy N
Ti-modified Hastelloy gPd Ti-modified Hastelloy N;
Hastelloy N controlsced
Ti-modified Hastelloy N; Hastelloy N controlscpd
Ti-modified Hastelloy N; Hastelloy N controlsced
Ti-modified Hastelloy N; Hastelloy N controlscsd
steelb'c Fuel LiF-BeF2-ZrF4-UF4-ThF4
(70-23-5-1-1)
NaBF4-NaF (92-8)
NaBF4-NaF (92-8)
688 100 49,300
4,700e
3,100
NCL-13
NCGl3A
Hastelloy N
Hastelloy N
Coolant
Coolant
607
607
150
125
NCL-14
NCL-15
Hastelloy N
Hastelloy N
Coolant
Blanket
NaBF4-NaF (92-8)
LiF-BeFz-ThF4 (73-2-25)
607
677
150
55
11,600
2,ood
NCL-1SA Hastelloy N
Hastelloy N
Blanket LiF-BeFz-ThF4 (73-2-25) 677 55
170 .
4,700
LiF-BeF2-UF4 (65.5-34.04.5) 704 9,000 NCL-16 Fuel
Coolant
Fertile-fissile
Fertilefissile
NCL-17 Hastelloy N NaBF4-NaF (92-8) plus water vapor additions
607
704
704
150 Estimated startup 3-1-69
2,900 NCL-18 Hastelloy N Ti-modified Hastelloy N; Hastelloy N controlscsd
Ti-modified Hastelloy N; Hastelloy N controlsc'd
LiF-BeF2 -ThF4-UF4
LiFBeFz-ThF4-UF4 (68-20-
(68-20-1 24.3)
12-0.3) plus bismuth in molybdenum hot finger
170
170 3,600
Under construction
NCL-19 Hastelloy N
Ti-modified, Hastelloy N; Hastelloy N controlscsd
NCL-20 Hastelloy N Coolant NaBF4-NaF (92-8) 675 265
=Permanent specimens. . dHot and cold legs. b o t leg only. eReworked - _- operating . as NCG13A. CRemovable specimens. fRepaired - operating as NCL-1SA.
e . .I

245
Table 18.7. Composition of Hastelloy N 18.6.3 Blanket Salts
Chemical Content (wt %) Loop NCLlSA, formerly NCL-15 (ref. 16), con- Alloy ~i M~ cr F~ s i M~ ~i structed of standard Hastelloy N with removable
specimens in each leg, has operated for 4700 hr with the blanket salt. The chromium concentration in the salt has increased from 25 to only 110 ppm in 2100 hr,
“J. W. Koger and A. P. Litman, MSR Rogram Semiann
Standard
Titanium-modified 70 17-2 7.4 4S Hastelloy N
HastelloyN 78 13.6 7.3 <O.l <O.Ol 0.14 0.5
OeS4 Oeo2
h g r . Rept. Aug. 3I,1968,ORNL4344, p. 262.
ORN L- DWG 68- 6087AR 0
5
10
si- ’5
E 20
s
E
2
2 25
ln ln
P
‘ 3 0
35
4 0
4 5
50 0 1 2 3 4 5 6 7 8 9 (0 14 12 43 44 15 ‘6 47
SPECIMEN TIME IN SYSTEM (4000 hr)
Fig. 18.1 1. Weight Loss of Type 304L Stainless Steel Specimens as a Function of Operation Time at Various T e m ~ t U r e S in LiF-BeP2-ZrF4-ThF4-UF4 (70-23-5-1-1 Mole %) Salt.
ORNL- DWG 68- 44719R
A STANDARD HASTELLOY N
0 5 0 0 4000 1500 2000 2500 3000 3500 4000 4500 5000 5500 6ooo 6500 7000 TIME (hr)
P i . 18.12. Weight Change. vs Time for Standard and Ti-Modified Specimens in Loop NCL16 Exposed to Fuel Salt (LiF-BeF2- UF4, 655-34.0-0.05 Mole %) at Various Temperatures.

246
ORNL-DWG 69-4762
0 2000 4000 6000 8000 40.000 TIME (hr)
Fig. 18.13. Concentration of Iron and Chromium in the Fuel Salt in Loop NCL-16.
Table 18.8. Bismuth Concentration in LiF-BeF2-ThF4-UF4 (68-20-12-03 Mole %) Salt from NCL-19 as a Function
of Operating rime
Time Sample Weight Bismuth Concentration’ (W (d (PPm)
0 1 1
20 1 840 1
0.5 0.1
1485 1 1 1
1633 1 2499 1
<25 <SO
35 2200 1200 <60 100 140 73 60
<20
‘Polarographic method.
indicating that the specimens are quite compatible with the salt. The weight changes of the removable samples indicate that the average corrosion rate at the maximum temperature of 663°C is <0.05 mil/year.
18.6.4 Coolant salts
Loop NCL13A, formerly NCL-13 (ref. 1 3 , con- structed of standard Hastelloy N with removable specimens in each leg, has operated for 3100 hr with the fluoroborate coolant salt. I After new fluoroborate salt was added to loop NCL13A in August, circulation could not be achieved. Our analysis of the situation led us to conclude that
”J. W. Koger and A. P. Litman, MSR Rogram S e d n n Ron. Rept. Aug. 31,1968.0RNL4344, p. 264.
previous overheating of the loop had caused BF3 to evolve and had changed the composition of salt from NaBF4-NaF (92-8 mole 7%) to a composition much richer in NaF. This in turn would cause the higher- melting NaF to segregate in the loop. To bring the composition back to normal, we added BF3 gas through the surge tank until a slight overpressure built up over the salt. (No devices were available to measure the amount of BF3 gas added.) Circulation of the salt was then started. Only a small AT (55°C) was obtained at first. Further additions of BF3 lowered the temperature of the salt in the cold leg and increased the AT to about 125OC. Since more BF3 did not cause immediate changes, the additions of gas were stopped. The loop is now operating satisfactorily with a AT of 125°C and a maximum temperature of 607°C.
Figure 18.15 gives the weight changes of specimens at various temperatures as a function of operating time. These initial values are relatively high, with the average corrosion rate over the first 2200 hr being about 1 mil/year at the maximum temperature of 605°C. Analysis of the salt has shown evidence of a large amount of water, 900 ppm, which, because of HF formation, could contribute to a high rate of corrosion. However, these high rates may also be the result of inserting new specimens into a loop system which already had operated 5000 hr. Future measurements will better determine the true corrosion rate in this system. A “cold-finger” device, which will continuously remove corrosion products from the salt, is scheduled to be used on this loop.
Loop NCL-14, constructed of standard Hastelloy N with removable specimens in each leg, has operated for 11,600 hr with the fluoroborate coolant salt. The weight changes of the specimens at the various positions in the loop and at different times are given in Fig. 18.16. This loop operated about 3500 hr with the H20 content in the salt between 500 and lo00 ppm. During that period the weight changes were small and predict- able as a function of time. Wet air then came in contact with the salt through a defective gas line, and the water content and corrosion rate increased dramatically. During the last 5000 hr the H20 content of the salt has decreased, and the corrosion rate has again decreased as a function of time. The rate of maximum weight loss over the last 5000 hr has been -1.5 X lo-’ mg cm-? hr-’ (-0.65 mil/year). This corrosion rate is higher by a factor of 2 than that measured during the earlier operating period when the H 2 0 content was between 500 and 1000 ppm.
The concentration of impurities in the salt in loop NCL14 is given as a function of operating time in Fig.
L,
. c
3 .
*

I :
. 3 4 .
i *w
247
Fig. 18.14. Bismuth ”Hot Finger” Contained in Molybdenum with Hastelloy N Jacket on NCG19.

248
ORNL-DWG 69-4763R
I I I I
2 - N
E
s -2
\ - E O W
a
I - 4 (3
I 0 I-
s -6
I NCL43A I
I I I I 0 io00 2ooo 3000 4Ooo
TIME OF OPERATION (hr)
Fig. 18.15. Weight Change vs Time for Standard Hastelloy N Specimens in NCG13A Exposed to Fluomborate Salt at Various Temperatures.
18.17. It is obvious that the nickel and molybdenum concentration increased significantly during the time of water ingestion. Nickel and molybdenum are normally not oxidized by fluoride salts, and their increase in the salt is evidence of a generalized HF attack."
Four standard Hastelloy N capsules were operated with NaBF,-NaF (92-8 mole %) fluoroborate salt at 607°C with BF3 overpressures of 200 torrs, 50 psig, 100 psig, and 400 psig respectively. A typical capsule system is shown in Fig. 18.18. Examination after 6800 hr disclosed that the capsules and specimens were clean and that no corrosion products were visible in the salt. The largest weight loss, equivalent to a uniform loss of 0.02 mil/year, was seen on a specimen exposed to the 100-psig BF3 vapor in capsule 3. Of particular interest is the observation that all the specimens exposed to the salt gained weight. We believe that t h i s can be explained by the salt analyses, which show an increase of chromium in the salt from 20 to 75 ppm and a decrease in iron from 220 to 20 ppm. This implies that the iron fluoride initially in the salt oxidized chromium from the Hastelloy N to form chromium fluoride, and the reduced iron was deposited on the metal. The water content of the salt remained 400 ppm during the test, while the oxygen increased from 200 to 1400 ppm. Since the largest amount of oxygen was found in the salt of the capsule which had the largest BF3 pressure, we believe that the oxygen entered as an impurity in the BF3 gas. Equating the chromium loss from the alloy
"J. W. Koger and A. P. Litman, Compatibility of Hastelloy N and c rdoy 9M wirh N&F4-NaF-KBF4 (90-4-6 Mole %J Fluorohrate Salt, ORNL-TM (to be published).
1.i to the chromium gain by the salt gave a bulk diffusion coefficient for chromium in Hastelloy N of 1.0 X IO-" cm2/sec. This value is in reasonable agreement with previous diffusion measurements.' s2 The most significant result of this experiment is the relatively low . corrosion rate observed for Hastelloy N in sodium fluoroborate that contains <500 ppm HzO. This . emphasizes the importance of water vapor in flu- . oroborate salt corrosion.
Loop NCL-17 will be used to investigate the influence of water content on the corrosion rate of Hastelloy N in sodium fluoroborate. This loop will be constructed of standard Hastelloy N and will contain the fluoroborate salt at the conditions of loop NCL-14. Known amounts of wet helium will be added to the salt, and the resulting changes in the corrosion rate will be measured.
A new standard Hastelloy N loop, NCL-20, which will contain fluoroborate salt, is being constructed. This loop will operate at the temperature extremes of the salt-metal interfaces in a 1000 Mw (electrical) MSBR, namely, 675 to 410°C. The object of this experiment will be to determine whether these temperatures will lead to more unfavorable corrosion than that already observed in tests where we have simulated the bulk fluid temperatures of 605 and 460°C.
.
18.6.5 Comparison of the Kinetic Behavior of Nickel- and Iron-Based Alloys m
Molten Fluoride Salts
The above results allow us to examine the kinetics of the dissolution processes in iron- and nickel-base alloys exposed to fuel and coolant salts. The weight losses of type 304L stainless steel and of standard and titanium- modified Hastelloy N in fuel salt as a function of time at temperature between 660 and 704°C are presented in Fig. 18.19. The plots assume a time dependence of the form
c .
where W is the weight loss in milligrams per square centimeter of surface area, a and b are constants, and t is the time in hours. Terms for this equation are given for each material in Table 18.9.
Similar weight changes are plotted in Fig. 18.20 for stiandard and modified Hastelloy N at 555 and 604°C in
I9R. B. Evans, J. €I. DeVan, and G. M. Watson, SeltDg&ion of Chromium in Nickel-Base Alloys, ORNL-2982 (January 1961). 'OW. R. Grimes et al.. RaaYoisotopes in Physical Scienceand
Industty, vol. 3, pp. 559-14, IAEA, Vienna, Austria, 1962.
* .

' . i
5
4
3
2
4
0
-4
N- -2
e e - -3
a
E
W a z
-4 + r 12 5 -5
-6
-7
-8
-9
- 4 C
- 4 4
-42
-43
-44
249
ORNL- DWG 68-1$777R
LOOP 44-MODIFIED SPECIMENS 4065 1025 920 863856 945
-15 3 40 20 30 40 50 60 70 EO 90 400
DISTANCE FROM HOTTEST PORTION OF THE UPPER CROSSOVER ( in 1
t- I= i UPPER COLD LEG BEND LOWER BEN0 HOT LEG
CROSSOVER (VERTICAL) CROSSOVER (VERTICAL)
Fig. 18.16. Weight Change as Function of Position (Temperature) for Titanium-Modified Hastelloy N Exposed to Sodium Fluoroborate Salt in Loop NCL-14.

250
sodium fluoroborate. Again the values were plotted using Eq. (l), and the resultant parameters are shown in Table 18.10.
We next considered the temperature dependence of the weight changes by calculating an average corrosion rate for each test. Arrhenius plots of these average rates are presented in Fig. 18.21. Activation energies indi- cated by the average slopes of these plots are 36,000 cal/g-mole for the type 304L stainless steel systems and 27,000 cal/g-mole for standard and modified Hastelloy
ORNL-WYG 68-117684. 3000
2000
!ooo 0 - 450
B 400
t
E I
z 0 350
E300 w Y 250
200
(50
lo0
50
n
8
" 0 2OW 4000 6000 8000 !O,OCO
TIME (hr)
Fig. 18.17. Variation of Impurities with Time in NaBF4-NaF (92-8 Mole %) Thermal Convection Loop NCL14.
I N. It is interesting to compare these results with weight loss behavior based on the assumption of a solid-state diffusion-limited corrosion process. Assuming that the surface concentration of the diffusing species remains constant during test, the resultant weight change expression would be of the form
I . 8 .
(2) 2 w = -@7(C,Cs) , 6
1 00
50
20 - "E 40
5
G 2
E 5
9 v) v)
P 3 4 k-
0.5
W
0.2
0. I
ORNL-DWG 69-764 . - . . . . .
102 2 5 403 2 5 104 z 5 10: TIME (hr)
Fig. 18.19. Weight Loss for Type 304L Stainless Steel and Hastelloy N Alloys in Fuel Salts.
Fig. 18.18. One of Four Standard HasteUoy N Capsules Which Contained NaBF4-NaF (92-8 Mole 5%) Salt for 6800 hr at BF3 Pressures of 200 Tom, 50 psig, 100 psig, and 400 psig. Note the whiteness of the salt in the opened capsule.
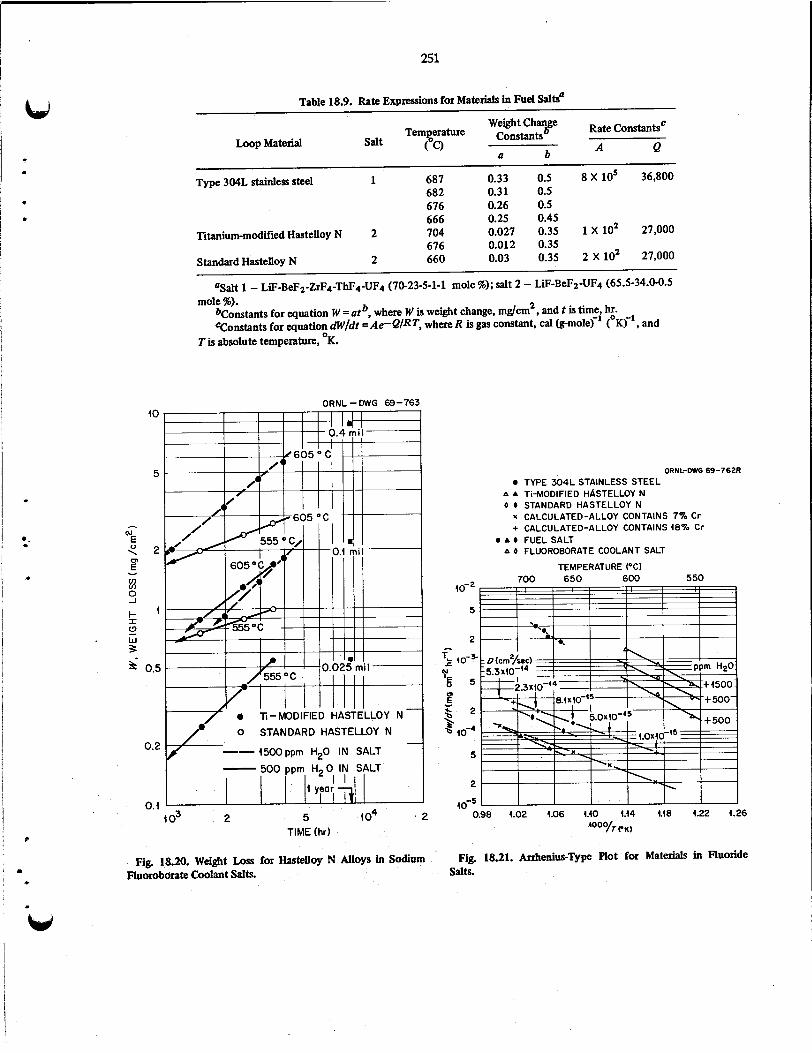
251
I I 1 year
I . : *
. . 1
a .
io
5
1
N
5 \ 2
w I - '
0 E v
0 -I
I
w '3 3
0.5
Table 18.9. Rate Expressions for Materials in Fuel salts"
Loop Material a3ge Rate ConstantsC Temgaature Constants
A Q a b (0 salt
Type 304L stainless steel 1 687 0.33 0.5 8 X lo5 36,800 682 0.31 0.5 676 0.26 0.5
0.25 0.45 666 Titanium-modified Hastelloy N 2 704 0.027 0.35 1 X 10' 27,000
676 0.012 0.35 Standard Hastelloy N 2 660 0.03 0.35 2 X 10' 27,000
"Salt 1 - LiF-BeF2-ZrF4-ThF4-UF4 (70-23-5-1-1 mole 96); salt 2 - LiF-BeF2-UF4 (65.5-34.0-0.5
bConstants for equation W = atb, where W is weight change, mgfcm2, and t is time, hr. cConstants for equation m/dt = Ae-Q/RT, where R is gas constant, cal (g-moler' (OK)-', and
mole %).
Tis absolute temperature, OK.
ORNL -DWG 69-763
0 STANDARD HASTELLOY N
i500ppm H20 IN SALT
TIME (hr)
Fig. 18.20. Weight Loss for HasteUoy N Alloys in Sodium Fluomborate Coolant Salts.
ORNL-MWG 69-762R
TYPE 304L STAINLESS STEEL A A TI-MODIFIED HASTELLOY N 0 STANDARD HASTELLOY N
x CALCULATED-ALLOY CONTAINS 7% Cr + CALCULATED-ALLOY CONTAINS 48% Cr
0 A FUEL SALT A 0 FLUOAOBORATE COOLANT SALT
TEMPERATURE PC) 700 650 600 550
I 5 -.. 2
I I I I I
' O V T CK) 0.98 4.02 i.06 4.40 4.44 4.48 4.22 4.26
Fig. 18.21. Arrhenius-Type Hot for Matexials in Fluoride SaltS.

252
where w = weight loss, rnglcrn' , D = diffusion coefficient, cm2 Isec, t =time, sec,
C, = initial uniform concentration, mg/cm3, C, = surface concentration, mg/cm3 (assumed to be
We assumed that all weight loss was due to the removal of chromium, and, using this expression and published
zero).
L, diffusivities for chromium in Hastelloy N, we calculated the weight losses of chromium that should have resulted if the chromium concentration at the surface had been reduced to zero. .
As shown in Fig. 18.21, corrosion rates calculated in t
this manner are in close agreement with results for the modified Hastelloy N-fuel-salt system. The calculations - are slightly lower than the observed rates in the standard Hastelloy N-fuel-salt system and very much lower than the observed rates for any of the flu- oroborate systems. Assuming that iron, as well as
Table 18.10. Rate Expressions for Materials in Coolant Salts"
Loop Materials Weight Change .,e*..-
Constantso Temgtaatur ( 0 salt
Rate ConstantsC A n
Ti-modified Hastelloy N 3 604 0.0036 0.7 8 X lo4 32,200 579 0.0025 0.7 555 0.00032 0.9
579 0.16 0.30 555 0.063 0.35
579 0.007 0.75 555 0.00015 0.1 5 24 0.000055 1.35
Standard Hastelloy N 3 604 0.15 0.37 3 X lo4 29,900
Ti-modified Hastelloy N 4 604 0.0085 0.75 1 X 10' 32,200
"Salt 3 - NaBF4-NaF (92-8 mole %), 500 ppm H2O; salt 4 - NaBF4-NaF (92-8 mole %), 1500
'Constants for equation W = at', where W is weight change, mg/cm2, and t is timei hr. cConstants for equation m / d r =Ae-Q/RT, where R is gas constant, cal @-mole)- (OK)-', and
PPm H2O.
Tis absolute tempexatwe, OK.
Table 18.11. Chemical Analyses of Salt Samples
Composition After Indicated Operating Time Element 0 191 hr 365hr 633hr 796hr 1519hr
Na" B" Fo Fe'
Cr'
Nib Mob H2O' 02'
21.8
67.9 9.14
407
66
53 41
<loo <SO
21.0
68.4 9.23
346 35 1 170 156 4
<lo 400
<SO
23.2 22.5
67.9 66.6 9.12 9.22
266 280 257 256 124 131 118 133 <20 <20 <15 <20 1100 600 0 0 0 0
20.9
67.8 9.22
222 219 114 117 <lo <lo 1400 660
22.8
68.3 9.25
314
272
<15 <6 820 390
D
L
aVdues given in weight percent. 'Values given in parts per million.

253
chromium, has diffused from the standard Hastelloy N alloy brings the calculations in much closer agreement with experimental results for the fuel salt. However, corrosion rates for the fluoroborate loops suggest that solid-state diffusion was not the controlling process in these experiments.
18.7 FORCED CONVECTION LOOP P. A. Gnadt W. R. Huntley
The MSR-FCLl forced convection loop is being operated to evaluate the compatibility of standard Hastelloy N with NaBFl-NaF (92-8 mole %) coolant salt at conditions similar to those which would exist with fluoroborate in the MSRE coolant circuit. During this report period the test loop ran for approximately 2000 hr at design conditions.
For most of the period the system operated at 588OC maximum bulk fluid temperature and 5 10°C minimum bulk fluid temperature. Figure 18.22 is a typical temperature profile of the system; this profile is based on a computer plot of the temperature information from the test loop and on heat transfer calculations which estimate the inner wall temperatures. Informa- tion for this and other computer plots is gathered by the Dextir data logging equipment in Building 9201-3.
! FIRST ; ! SECOND !
Salt samples were taken at the start of the test run and at periodic intervals. The results of the salt analyses are listed in Table 18.1 1. The salt charge used in this experiment contained more metallic impurities (Fe, Ni, Cr, Mo) than are usually found?' The changes in concentrations of impurities, especially Fe, Cr, and HzO, have been rather erratic as a function of operating time. Further operating time will be required to separate the true chemical changes from the random scatter of analyses.
The pump has been operated with a helium purge through the pump seal (oil) catch basin. The original intent" was to add BF3 to the pump bowl to make up any BF3 which diffused into the seal catch basin and was swept away by the helium purge. The BF3 losses, however, are so small that the BF3 addition system is not being used.
Measurements of the BF3 in the seal purge gas indicate that the helium (80 cm3/min) leaving the pump oil catch basin is contaminated with approxi- mately 0.01% BF3. Analytical results of oil samples for
"MSR Program Semiann Aogr. Rept. Aug. 31, 1968,
"MSR hogram SemiCmn Progr. Rept. Aug. 31, 1968, ORNL.4344, p. 265.
ORNL-4344, p. 268.
ORNL-DWG 69-2535
1300
(200
1 100
1000
900
000
700
600 0 10 20 30 40 50 60
LENGTH (ft)
TO PUMP
Fig. 18.22. Temperature profile of MdtenSalt Forcedconvection ConosiOn Loop, MSR-EL-1, at Typical Operating Conditions.

254
dissolved boron in the seal leakage oil also indicate an extremely small amount of boron dissolved in the oil. These preliminary results indicate that the BF3 losses from the salt will be insignificant for the scheduled 5000-hr operating period.
The low BF3 concentration in the helium purge has resulted in little acid accumulation at the gas purge line outlets. Inversion of the purge line and a bucket-type catch basin have also helped to reduce the plugging problem at the end of the purge line. Only a few cubic centimeters of the acid have accumulated in the bucket. No new accumulation of acid on the air exhaust ducts has been noted; however, acid reaction products are noted at the end of the purge line.
Heat transfer performance of the NaBF4-NaF (92-8 mole %) salt was observed in a resistance-heated section of the corrosion loop that was 0.410 in. in inside diameter and 105 in. long. Performance data were obtained at heater inlet temperatures from 521 to 571"C, heater exit temperatures from 566 to 632"C, over a Reynolds modulus range of 4750 to 47,000, and at heat fluxes from 15,750 to 160,000 Btu hr-' ft-2. The data obtained were correlated quite well by the DittusBoelter equation, as shown in Fig. 18.23. Although no statistical analysis has been made, we estimate that the error in the measurements on the test loop does not exceed 20%. The data of Fig. 18.23 were plotted using recent' physical property values, and it is significant that the use of available physical property
ORNL-DWG 68-13483
HEATED SECTION L/D RATIO=256
I I I I I I I I I I I I I I I l l 1
5 to4 2 5 $05 REYNOLDS NUMBER
Fig. 18.23. Heat Transfer Characteristics of NaBF4-NaF (92-8 Mole %) Flowing in O.QlWi.-ID Tube.
L; data results in agreement with a standard heat transfer correlation equation in our engineering system.
18.8 OXIDATION OF HASTELLOY N B. McNabb
- t
We are studying the oxidation and scaling resistance of Hastelloy N and various modified alloys. The main objective of this work is to determine the importance of various elements in controlling oxidation and scaling so that we can obtain a modified alloy with adequate oxidation resistance.
We found that commercial heats of Hastelloy N with only minor differences in composition can have large differences in scaling resistance. Heat 5065 had about 1% weight loss in tests where it was heated for 1000 hr at 982°C and cycled to room temperature every 25 hr, whereas heat 2477 had about 49% weight loss under the same conditions. The major differences in composition are in manganese and silicon, with heat 5065 having 0.55 and 0.57% and heat 2477 having 0.055 and 0.0475% respectively. Alloy No. 10, a laboratory remelt of heat 2477 with 0.5% silicon added, had negligible weight loss under the above conditions.
After determining the importance of silicon, we used the electron microprobe analyzer to determine the distribution of silicon in oxidized samples. An accel- erating voltage of 20 kv and a specimen current of 0.02 pa were used to determine the Si Ka x-ray intensities. Spot counts were made at various locations in the samples, and a silicon enrichment was noted at the oxide-metal interface and in some of the grain boundary penetrations. To graphically display this, we made a CRT (cathode ray tube) display of Si Ka x rays at the surface. Figure 18.24 shows such a display compared with an optical photomicrograph of the same area. By studying the two displays, one can see that silicon is concentrated at grain boundaries and along the interface between the metal and the oxide. We thought at first that the round voids in the optical photo- micrograph also had silicon, but the CRT display indicates that this is not true.
Heat 5065 had some large cracks that were filled with oxidation product, and some of these were scanned to see the distribution of the major alloying elements and silicon (Fig. 18.25).
The silicon and chromium were enriched at the oxide-metal interface, and molybdenum, nickel, and
.
23S. Cantor, Physical Properties of Molten-Salt Reactor Fuel, Coolant, undFlush Salts. ORNGTM-2316 (August 1968).
5

b . 0 .
. f 8
..
t
3 *
I
td
255
Fig. 18.24. Optical and X-Ray Display Showing the Emichment of Silicon at the Oxide-Metal Interface of a Hastelloy N (Heat
OPTICAL
2477 with 05% Si Added) Sample After Oxidation.
iron were depleted. Some areas in the oxide were enriched in nickel and iron, while others were enriched in molybdenum. The significance of this distribution of alloying elements is not known. Figure 18.26 shows the areas of major silicon concentration. The clear zone below the specimen surface is depleted in chromium, and this probably accounts for some of the subsurface voids that do not contain silicon.
The sample of heat 2477 with low silicon, which showed poor oxidation resistance, did not show any silicon enrichment. Figure 18.27 is a CRT display showing the distribution of silicon, chromium, molyb- denum, nickel, and iron. I t appears that molybdenum and chromium are concentrated at the surface and that nickel and iron are depleted in the same areas. The silicon-rich areas seen just off the surface are due to the silicon naturally occurring in the pelletized alumina used in mounting the metallographic sample.
Figure 18.28 shows the distribution of the major alloying elements in heat 2477 after 1000 hr cycling to 982OC in air with cycles of 15 min heating and 5 min cooling. There are no appreciable concentration dif- ferences of any of the elements. This is in contrast to the sample cycled on a frequency of 1 cycle per 25 hr, which showed marked concentration differences near the metal-oxide interface (Fig. 18.27).
Y-65767
Si Ka X - RAYS
Figure 18.29 shows the distribution of the major alloying elements in heat 5067 after cycling in air for 1000 hr at 982OC (15-5 cycle). Heat 5067 has interme- diate amounts of manganese and silicon, 0.48 and 0.42% respectively. In th is sample the molybdenum and silicon seem to be enriched together in the precipitates, and iron, nickel, and manganese are depleted in the same areas.
The reason for the different morphologies of the oxides is not understood, but may be related to the manganese and silicon content, which could affect the solubilities of other alloying elements. WasielewskiZ4 has shown that by adding 0.2% lanthanum to Hastelloy X, the surface oxide can be changed from pre- dominantly Cr203 to MnCr204, which gives increased oxidation resistance and spalling resistance. Gehlbach and McCoyZ5 have found that the silicon content affects the amount and form of precipitates found in Hastelloy N. The high silicon content favors the formation of M6C carbides; the low silicon content
a4G. E. Wasielewski, Nickel-Base SuperalZoy Oxiaktion,
25R. E. Gehlbach and H. E. McCoy, MSR Program Semiann AFML-TR-67-30 (January 1967).
hop. Rept. Feb. 29, I968, ORNL-4254, pp. 209-12.

t
. ... ._ .
.,- . . .. , ._ .- .
SAW-X *7 OYY SAW-X 01 J3 SAW-X D! !S
,
lV311d0
. I
ir9LE8 -A
P
9sz

favors M6C primary cipitates.
Table 18.12 shows
carbides and (Mo,Cr)2C pre-
the distribution of the major alloying elements in the matrix in the metal near the oxide-metal interface and in the oxide of heats 2477 and 5067. This shows some enrichment of silicon and some depletion of nickel in the oxide and increases near the oxide-metal interface of chromium and iron in heat 5067 and of chromium in heat 2477.
These results show that silicon plays an important role in the oxidation of Hastelloy N. The concentration
257
of th is element at the oxide-metal interface may be responsible for the lower oxidation and scaling rate of high4licon alloys. However, the lower silicon level may be necessary tp obtain the desired destruction of precipitates for optimum resistance to irradiation dam- age. The oxidation resistance at the design temperature of an MSBR of 704'C would be adequate at any silicon level, and the higher oxidation rate of the low-silicon alloy would only be important during unexpected transients.
Fig. 18.26. Optical Photomicrograph Showing the Area That Is Enriched in Silicon. The arrows show areas of silicon concentra- tion. Magnification: SOOX.
Table 18.12. Results of Semiquantitative Analyses on oxidized samples
Heat Location No. ofsample
Composition (%)
Ni Mo Fe Cr Mn Si
2477 Matrix Interface Oxide
5067 Matrix Interface Oxide
40-80 10-25 5-15 -5-10 <1 40-80 10-25 5-15 5-10 <1 20-50 10-25 5-15 10-30 40-80 10-25 5-15 5-10 0.2-2 40-80 10-25 5-15 5-10 0.2-2 10-30 10-30 10-30 10-30 0.2-2 0.2-2

258
OPTICAL
Si Ka X-RAYS Cr Ka X- RAYS
Ni Ka X-RAYS
Y- 85766
MO La X-RAYS
FeKa X-RAYS
Pig. 18.27. Optical and X-Ray Displays Showing the Distribution of Various Elements in HasteUoy N (Heat 2477) After Oxidation.
a
*
.
t .

SAW-X WnlWOHH3
SAW-X 3S3NV'DNWW
SAW -X N03lllS SAW -X 13M31N
SAW-x wnN3aaAion SAW-X NOHI
3Hn131d lV311d0
6LLSS-h
!
P
6SZ

?
260
Y-85778
ELECTRON BACKSCATTER OPTICAL PICTURE . . .
IRON X-RAYS
NICKEL X-RAYS SILICON X-RAYS
MANGANESE X-RAYS .
CHROMIUM X-RAYS
L-i
e
. Fig. 18.29. Optical and X-ray Displays Showing the Distxibution of Various Elements in HasteUoy N (Heat 5067) That Has
Been Oxidized at 982'C for 1000 hr with Cycles of Heating for 15 min and cooling to 25OC for 5 min. Note from Fig. 18.28.
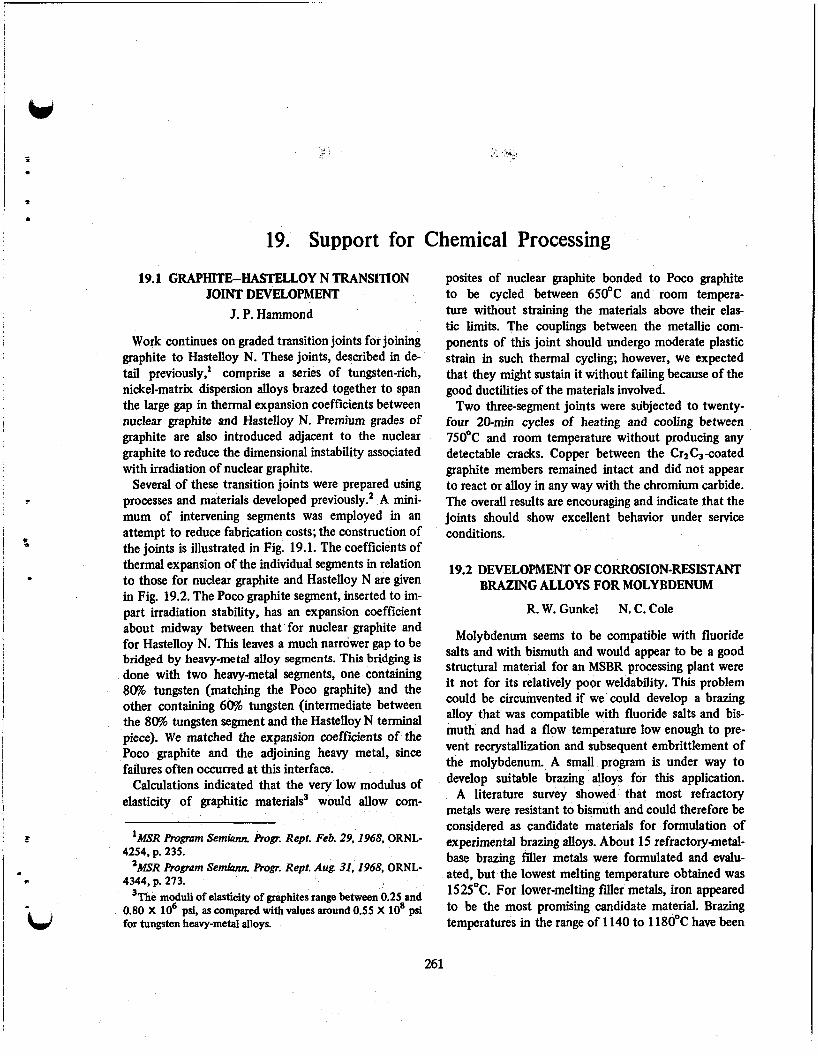
1 .
c.:
19. Support for Chemical Processing 19.1 GRAPHITE-HASTELLOY N TRANSITION
JOINT DEVELOPMENT J. P. Hammond
Work continues on graded transition joints for joining graphite to Hastelloy N. These joints, described in de- tail previously,' comprise a series of tungsten-rich, nickel-matrix dispersion alloys brazed together to span the large gap in thermal expansion coefficients between nuclear graphite and Hastelloy N. Premium grades of graphite are also introduced adjacent to the nuclear graphite to reduce the dimensional instability associated with irradiation of nuclear graphite.
Several of these transition joints were prepared using processes and materials developed previously? A mini- mum of intervening segments was employed in an attempt to reduce fabrication costs; the construction of the joints is illustrated in Fig. 19.1. The coefficients of thermal expansion of the individual segments in relation to those for nuclear graphite and Hastelloy N are given in Fig. 19.2. The Poco graphite segment, inserted to im- part irradiation stability, has an expansion coefficient about midway between that for nuclear graphite and for Hastelloy N. This leaves a much narrower gap to be bridged by heavy-metal alloy segments. This bridging is done with two heavy-metal segments, one containing 80% tungsten (matching the Poco graphite) and the other containing 6% tungsten (intermediate between the 80% tungsten segment and the Hastelloy N terminal piece). We matched the expansion coefficients of the Poco graphite and the adjoining heavy metal, since failures often occurred at this interface.
Calculations indicated that the very low modulus of elasticity of graphitic materials3 would allow com-
'MSR Program Serniuna €+OF. Rept. Feb. 29.1968. ORNL- 4254, p. 235.
'MSR Program SemiPnn Progr. Rept. Aug. 31,1968, ORNL- 4344, p. 213. 'The moduli of elasticity of graphites range between 0.25 and
0.80 X IO6 psi, as compared with values around 0.55 X 10' psi for tungsten heavy-metal alloys.
posites of nuclear graphite bonded to Poco graphite to be cycled between 65OoC and room tempera- ture without straining the materials above their elas- tic limits. The couplings between the metallic com- ponents of th is joint should undergo moderate plastic strain in such thermal cycling; however, we expected that they might sustain it without failing because of the good ductilities of the materials involved.
Two three-segment joints were subjected to twenty- four 20-min cycles of heating and cooling between 75OoC and room temperature without producing any detectable cracks. Copper between the Crz Cs coated graphite members remained intact and did not appear to react or alloy in any way with the chromium carbide. The overall results are encouraging and indicate that the joints should show excellent behavior under service conditions.
19.2 DEVELOPMENT OF CORROSION-RESISTANT BRAZING ALLOYS FOR MOLYBDENUM
R. W. Gunkel N. C. Cole
Molybdenum seems to be compatible with fluoride salts and with bismuth and would appear to be a good structural material for an MSBR processing plant were it not for its relatively poor weldability. This problem could be circumvented if we could develop a brazing alloy that was compatible with fluoride salts and bis- muth and had a flow temperature low enough to pre- vent recrystallization and subsequent embrittlement of the molybdenum. A small program is under way to develop suitable brazing alloys for this application.
A literature survey showed that most refractory metals were resistant to bismuth and could therefore be considered as candidate materials for formulation of experimental brazing alloys. About 15 refractory-metal- base brazing ffler metals were formulated and evalu- ated, but the lowest melting temperature obtained was 1525°C. For lower-melting filler metals, iron appeared to be the most promising candidate material. Brazing temperatures in the range of 1 140 to 118d"C have been
261

262
NUCLEAR GRAPHITE
ORNL-DWG 69-55t8
80% W-44% N i - 6 % Fe
u INCHES
c
80% W-14% Ni -6% Fe HASTELLOY N
Fig. 19.1. ThreeSegment Transition Joint Showing Microstructures in Bond Regions. As polished, oblique illumination. =OX. Reduced 46%.
obtained with three iron-base alloys, and they appear attractive as materials for brazing molybdenum-base alloys below their recrystallization temperatures. One disadvantage of the filler metals investigated to date is their low ductility; therefore one very important phase of our future work will be to obtain more-ductile alloys.
The excellent flowability of these iron-base filler metals on molybdenum has been demonstrated on T- joints. Figure 19.3 is a photomicrograph of a molyb- denum-TZM T-joint brazed with one of these alloys, and the excellent wetting properties of the brazing are apparent. Only minor reaction with the base ma- terial is evident. Figure 19.4 shows a higher-magnifica-
tion view of the microstructure of the brazed fillet and illustrates the heterogeneity of the structure. Tests will be run on these joints to determine their compatibility with bismuth and fluoride salts and their shear strengths by using Miller-Peaslee-type specimens.
19.3 EXAMINATION OF Mo-TZM CAPSULE
J. W. Koger A. P. Litman - The capsule test in support of MSR fuel processing by
vacuum distillation was completed. A capsule con- strutted of Mo-TZM (Mo-0.5 Ti-0.08 Zr) and con- taining Mo-TZM specimens was exposed to LiF-BeF2- ThF4-UF4 (68-20-12-0.3 mole %) salt at 1100°C
.

263
(201OOF) for 101 1 hr. The chemical composition of the salt before and after test is given in Table 19.1. Small increases m the titanium, zirconium, and chromium
W
t4 ORNL-DWG 68-41766132
8 110
6 100 0 PROPOSED CQEFFICIENT OF
c EXPANSION FOR THE SEGMENT L I z n 90 -b + n B o 80 $ 5 o a 0 v 70 Z L E & 8 60
50
40
z 3 I-
3 4 5 6 7 8 9 1 0 1 4 4 2 4 3 COEFFICIENT OF THERMAL EXPANSION
(in in-' 0c-1)
Fig. 19.2. Expansion Coefficients of ThreeSegment Joint Materials as a Function of Composition. Co$ficients are mean values between room temperature and 600 C and were deter- mined on an optical interferometer.
f
concentration in the salt were noted as the result of the test. All three of these elements were present initially in the Mo-TZM. Weight changes of the specimens were negligible (<0.03 mg/cm2).
Figure 19.k shows the typical cold-worked structure of the specimens and the capsule before test. This microstructure is also typical of the specimen exposed to the salt vapor where no microstructural change was noted. A specimen exposed to the salt shows no attack at the surface in the as-polished condition (Fig. 193). The same specimen etched (Fig. 19.5~) shows recrystal- lization for a maximum depth of about 4 mils. Examina- tion of this specimen at a lower magnification (Fig. 19.54 shows that both surfaces recrystallized as the result of the test. The capsule wall also recrystallized in the same manner. It is customary for Mo-TZM to be annealed 30 min at 154OOC to produce complete re- crystallization? An increase in annealing time from 30 min to 1000 hr should not lower the recrystalliza- tion temperature much over 100°C. However, it is
4R. L. Stephenson, private communication.
.)
hd fig, 19.3. photomicrograph of a Molybdenum-TZM T-Joint Brazed with an Iron-Base Alloy. Magnification: 60X.

264
Fig. 19.4. Microstructure of an Iron-Base Brazing AUoy Showing a Heterogeneous Fillet. Magnification: 200X.
Table 19.1. Chemical Analyses of Fertile-Fissile Salt Exposed to TZM Capsule for 1011 hr at 1lOO"C (2010°F)
Parts per Million Weight Percent Mo zr Ti Fe Cr 0 2 H2O Li Be Th U F
Beforetest . 0 37 74 40 20 58 40 6.71 2.65 43.1 1.75 455 After test <lo 134 151 38 97 <SO 70 7.01 2.55 42.6 1.93 45.7
I known that the presence of small concentrations of a foreign element in solid solution can raise the recrystal- lization temperature as much as several hundred de-
, I 1
grees.* Thus the enhanced recrystallization (lower recrystallization temperature) in the samples and cap- sule at 1100°C is very likely due to the removal of the titanium and zirconium from the alloy. This removal would have the effect of freeing the grains and allowing them to grow.
I
'R. E. Reed-Hill, Physical Metallurgy Principles. p. 198, Van Nostrand, Princeton, N.J., 1964.
This experiment has shown that zirconium, titanium, and chromium are selectively removed from Mo-TZM during exposure to fluoride salt at 1100°C. This removal results in a change in the microstructure near the sur- face, but the mechanical property changes should not be deleterious.
19.4 BISMUTH CORROSION STUDIES
J. W. Koger A. P. Litman B. Fleischer
In flowing bismuth, when even a small temperature difference exists (such as in the proposed MSBR re-
i
. 3 .
b

. + ’ . :
. . . . , . , ” ... ~
265
PHOTO 95549
i Fig. 19.5. Molybdenum-TZM Alloy Exposed to Fertile-Fissile Sdt, LiF-BeFz-ThF4-UF4 (68-20-12-0.3 Mole %), for 1011 hr at
llOO°C. (u) Microstructure typical of the cold-worked material before test and the specimen exposed to the vapor during test. SOOX. Etchant: H20, H202, H2SO4. (b) Typical of as-polished capsule and specimen exposed to salt. SOOX. (c) Typical of capsule and specimen surfaces exposed to salt. SOOX. Etchant: H20, H202, H2SO4. (d) Specimen exposed to salt. 1OOX. Etchant: H20, H202,
.I H2S04. u
266 .
, processing plant), excessive temperature-gradient mass transfer seriously limits the usefulness of container systems fabricated from nickel, iron, and chromium alloys: This rules out most conventional materials for long-term service in the processing plant. Relief in this situation is seen in the refractory alloys, especialIy molybdenum, that are much more compatible with liquid bismuth. The fabrication of these refractory metals in a large engineering system, however, poses many problems. A very desirable combination of ma- terials would be an iron-base alloy for the exterior and a thin coating or liner of molybdenum on the interior where it would be exposed to salt and bismuth.
The fust experiments in the program will consist of a study of the feasibility of exchanging molybdenum
6J. R. Weeks and D. H. Curinsky, “Solid Metal-Liquid Metal Reactions in Bismuth and Sodium,” pp. 106-61 in Liquid Metals and Solidification, American Society for Metals, Cleve- land, Ohio, 1958.
1 ,
1
from a molten fluoride salt with more active elements (viz., chromium and iron) of the container material by activity-gradient mass transfer. We plan to add a small amount of MoF6 (gas) to an LiF-BeF2 salt and pre- treat the iron-base loop before the bismuth is added. Equation (1) describes the reaction:
- . .
MoF6 + 3CI + 3CrF2 + Mo4 . ( 1) m
The CrF2 is soluble h the salt, and the molybdenum should be deposited on the metal wall.
Since molybdenum looks very promising from the standpoint of compatibility but very discouraging from a fabricability standpoint, a practical solution to the materials problem would be available if molybdenum could be applied to conventional materials in the man- ner described above. Such a treatment could be a p plied to the processing equipment after welding, and the equipment could be re-treated in place as required.
I
c
i
.

20. Support for Components Development Program 20.1 REMOTE WELDING DEVELOPMENT
L. C. Williams T. R. Housley R. W. Gunkel
Our efforts on this program have been on a coopera- tive basis with the Reactor Division and have consisted of work in two areas: (1) equipment procurement for general welding studies, and (2) consultation with Reac- tor Division personnel on actual remote welding appli- cations. In the first area, we have procured a digital- controlled automatic welding system and an MIG wire feeder and controller; purchase orders are out for a welding head positioner. In the second area of work, we are providing advice and assistance in the construc- tion of a remotecontrolled orbital carnage welding head, a device for producing circumferential tungsten- arc welds in large pipe (see Sect. 7.8).
When the general welding equipment is received and assembled, we will be in a position to do detailed welding studies to permit optimum welding process and parameter selection.
20.2 THERMAL CYCLING TESTS ON COATED BEARING SPECIMENS
W. H. Cook L. R. Trotter
The hard-surface coatings are of interest for bearing and valve applications because they are relatively easy to apply. Several coatings have been applied to Hastel- loy N cylinders for evaluation. The thermal cycling tests have been completed.
The coatings were applied to the sides of cylinders of Hastelloy N 1 in. in diameter by 1 in. long. Each cylin- der had a x-in.-diam by '4 -in.-long handling spindle on one end. The coatings were surface ground to produce the best surface obtainable and to make them 3 mils thick. These surfaces, as measured by Mechanical Tech- nology Inc. (MTI), were found to have surface rough- nesses of 0.6 to 9, 1.4 to 2.3,42 to 125, and 30 to 63 pin. for LW-I, LW-5, MTI, and Metco 81 NS respec- tively. The NDT fluorescent dye penetrant examina-
tions of them prior to the thermal cycling tests did not reveal any flaws in the coatings.
A thermal cycle nominally required 20 min to heat up from 100 to 7OO0C and 40 min to cool back down to 100°C. The cycling atmosphere was pure argon. An attempt was made to monitor the sounds during the cycles in order to determine the moment of failure during the 100 thermal cycles. This technique showed some promise, but it requires further development in an area other than a conventional laboratory area. Six specimens of each coating were thermal cycled.
The coatings evaluated were (1) Linde LW-5, 25% tungsten carbide and mixed W-Cr carbides plus 7% nickel, (2) Linde LW-I , tungsten carbide plus 7- 10% cobalt, (3) Metco 81 NS, 75% chromium carbide plus 25% nickelchromium alloy, and (4) MTI, 84% tungsten carbide-10% molybdenum plus 6% cobalt. They sur- vived 100 thermal cycles between 100 and 700OC in the order listed. None of the coatings spalled, but all showed some degree of failure in the fluorescent dye penetrant examinations made on them for us by the Nondestructive Testing Group.
One of the six specimens of the Linde LW-5 de- veloped very fine cracks and some pinholes. This may be because the coating was inferior and/or was thicker in the region of failure.
Two of the specimens of the Linde LW-1 developed pinholes as a result of the thermal cycling. This, I be- lieve, is the result of lack of quality control in fabrica- tion.
The Metco 81 NS and the MTI specimens had heavy backgrounds in the NDT posttest examinations, which suggests a fme network of cracks and/or porosity. This is probably a reflection of lower bonding strength be- .tween the carbide particles that make up part of these coatings.
It is interesting to note that we rated these in the order of decreasing resistance to the thermal cycling as Linde LW-5, Linde LW-1, Metco 81 NS, and MTI and that this parallels their bond strengths at room tempera- ture: 6330, 6060, 5400, and 4270 psi, respectively, as determined by MTI.
267

268
We shall examine the microstructures of the coatings to determine the nature and causes of the failures and to determine if there are hidden failures such as separa- tion of the coatings from the substrate, Hastelloy N, as a result of the thermal cycling tests.
The results are encouraging, but much work would be required to fully evaluate the potential of the coat- ings that survived the thermal cycling tests without
serious damage. For example, for heat-treating work and design, one should fmd what upper temperature will cause the coatings to fail; their corrosion resistance to molten salts should be determined; and bearing tests in molten salts involving boundary lubrication (rubbing) and hydrodynamic lubrication tests should be made.
- L,
*
. a
*

P . Part 6. Molten-Salt Processing and Preparation
M. E. Whatley Y
Part 6 deals with the work toward the development of processes for the isolation of protactinium and the removal of fission products from molten-salt reactors. The work is oriented around processing concepts which are gradually achieving maturity. Protactinium is to be isolated by a reductive extraction scheme which traps it in an extraction cascade between thorium, which is less noble, and uranium, which is more noble. The rare earths are to be removed by a reductive extraction operation on a salt stream from which the uranium and protactinium have already been removed. Our tech- nique for determining the distribution of materials between molten salt and bismuth as a function of the reducing power. of the bismuth have become quite good, and we can now present reliable distribution coefficients for all the interesting components including lithium, thorium, protactinium, plutonium, zirconium,
continue to look attractive, and those for the rare earths appear adequate. The major engineering prob- lems are associated with the development of an electro- lytic cell, which is necessary both to provide extractant and to oxidize the extracted uranium, and liquid-liquid contactors which must be effective in this system. We have operated small electrolytic cells made of quartz where, under static conditions, current densities of over 4000 amp/ft2 were easily achieved. We have yet to demonstrate that these cells can be operated at steady state with flowing fluids and that they can be con- structed of metal protected by dynamically cast frozen
%
. and uranium. The separation factors for protactinium
salt. A system has been installed to study contactors using salt and bismuth, and it is presently in the early stages of shakedown operation. Our work with mercury and water to simulate salt-bismuth systems is progress- ing well.
We have found that dissolved nickel in the bismuth phase reduces the solubility of thorium, which in turn affects the distribution coefficients in the system. Current versions of our flowsheet now show a bismuth cleanup operation which removes nickel, tin, a variety of seminoble fission products, and zirconium at a rate comparable to a 200-day reactor cycle.
We have gained more detailed information on the distribution coefficients of the rare earths in the salt system presently considered for the MSBR. Europium will be separated from thorium only slightly, but the rest of the rare earths show separation factors over 1.5. Our calculations indicate that this is a useful separation factor if high flow rate ratios can be tolerated. We have yet to undertake contactor studies at high flow rate ratios. Our work on alternative processes for rareearth separation is still an important part of the program.
The demonstration experiment to distill 48 liters of MSRE carrier salt is now ready to begin. The prepara- tion and installation of this experiment were delayed from various causes, but the experiment can be per- formed while the reactor is operating and should establish the feasibility of this important tool in moltenaalt technology.
w 269

u
c . 21. Flowsheet Analysis
21 .I PROPOSED REDUCTIVE EXTRACTION PROCESSING FLOWSHEET
FOR A SINGLLFLUID MSBR
M. E. Whatley L. E. McNeese
The process flowsheet envisioned for a single-fluid MSBR is based on reductive extraction and processes the reactor salt volume through the protactinium isolation system on a 3day cycle and through the rareearth removal system on a 30day cycle. The present version of the process flowsheet is shown in Fig. 21.1 and is scaled for a 1000 Mw (electrical) MSBR. The protactinium isolation system has been described earlier.' The rareearth removal system will be de- scribed in more detail in a later section.
The protactinium isolation system exploits the fact that protactinium is intermediate in nobility between uranium and thorium. A molten-salt stream is with- drawn from the reactor on a 3day cycle (2.5 gpm) and fed countercurrent to a 5.3-gpm liquid bismuth stream in a 12-stage contactor. If the reductant (thorium and lithium) flow in the bismuth stream entering the contactor is correct, the uranium in the salt will transfer to the downflowing bismuth stream in the lower part of the contactor. The protactinium, however, will concen- trate midway up the cascade, where most of the protactinium in the reactor system can be held by diverting the salt through a suitably large volume (200 ft3). At steady state the 233Pa decays to 233U at the same rate that it is brought into the tank from the reactor. Calculated concentration profiles in the extrac- tion column are discussed in a later section. The concentrations of both protactinium and uranium in the salt leaving the eolumn are negligible; however, the concentration of rare earths at this point is roughly the same as in the reactor. Approximately 10% (0.25 gpm) of the salt stream leaving the protactinium isolation column will be processed for removal of rare earths.
'L. E. McNeese and M. E. Whatley, MSR Program S e m h n Progr. Rept. Feb. 28,1968,ORNL4254, p. 248.
The remaining salt passes through an electrolytic oxidizer-reducer where lithium and thorium are reduced into a flowing bismuth cathode to provide the metal stream fed to the column. At the anode of the cell, bismuth is oxidized to BiF3, which will be soluble in the molten salt. The salt stream, containing BiF3, is countercurrently contacted with the bismuth stream leaving the extraction column in order to oxidize uranium, protactinium, and other materials, which then transfer to the salt stream and return to the regctor.
The concentration of uranium or protactinium must be known at a point in the column in order to control the reductant concentration in the bismuth stream fed to the column. The uranium concentration is deter- mined by fluorinating approximately 5% of the salt entering the protactinium decay tank and analyzing the resulting gas stream for u F 6 . Means for collecting the u F 6 from this operation as well as from other fluorination operations and for returning this material to the fuel salt are provided. The uF6 is simultaneously absorbed into the molten salt and reduced to UF, by a hydrogen sparge. A bismuth removal step will also be provided before salt returns to the reactor.
Approximately 1.5% (0.08 gpm) of the bismuth stream leaving the extraction column will be hydro- fluorinated in the presence of a salt stream for removal of the seminoble metals (Ga, Ge, Cd, In, Sn, and Sb), corrosion products (Fe, Ni, and Cr), and fission product Zr. The salt is recycled between the hydrofluorinator and a fluorinator, where uranium is removed. The principal components which build up in this salt are 'LiF and ZrF4, and the expected steady-state composi- tion is 47-53 mole 9% LiF-ZrF4, which has a liquidus of 520°C.
Salt which is free of uranium and protactinium but which contains rare earths is fed to the center of a 24-stage extraction column at a rate of about 0.25 gpm, sufficient to process a reactor volume in 30 days. The salt flows countercurrent to a bismuth stream contain- ing thorium and lithium. Typically, 60% of the rare earths are extracted from the salt stream in the upper
*
. I
. *
270

fU a **
3 STAGE CONTACTOR
L J SALT MAKE UP
0.49 ft3/dav Li = 0.72-
BeFz= 0.46 ThFA=0.12
i t WELECTRODE
-, 3 S T A ~
CONTACTOR He-HF
t 0.25gpm RE = 0.000046
c T h = 0.004 6 o.44 gPm Li = 0.0046
3 STAGE
I REACTOR 1464 f t3 BR=L06
I
0.
34.4 kw/ft3 U FUEL SALT REPROCESSING
PLANT FEED 5.3 aam B i 2.53 gpm TANK
(3 doy CYCLE) ' UF4 = 0.003 PaF4=4.54 x 1 ~ - 5
I
37.9 kw/ft3
U = i o 0 1 6 Po = 5.6 xfO-* Th= 2.0 x IO-' Li = 1.4 x w4
I t
0.25 gpm ( 3 0 day CYCLE)
RE= 0.000446
34.9 g moledday
HF-Hz
45gpmB1
L iF -Z rG TO WASTE
6.2 moles/day 0.53 ZrF, 0.47 L i F
RE=0.0069 0.49 gpm
c 0 0 3
ORNL-DWG 69-2333RA
3.6ft3SALT/OAY FOR 4 4 days
RARE EARTH ACCUMULATION AND Pa OECi
---- 1 ---- L ---- .L--A
7.2 ft3/day (SEMI -CONTINUOUS) 1
HF I
I I I - J
0.49 ft3 SALT/day TO WASTE RE=0*0069 c - - -- - -- Li = 0.72 BeF2=0.46 T h h = 0.443
ALL CONCENTRATIONS ARE GIVEN IN MOLE FRACTIONS
Pig. 21.1. Proposed Reductive Extraction Rocwing Flowsheet for a Single-Fluid MSBR All concentrations are in mole fraction.

272
column (making the effective removal time 50 days), and the rareearth concentration is increased to approxi- mately 0.69 mole % in the lower column. The bismuth flow rate through the column is 15 gpm. Part of the salt leaving the column returns to the reactor, and the remaining salt is fed to the electrolytic cell complex, the net effect of which is to put thorium and lithium into bismuth and to turn the extracted rare earths around as reflux from the bismuth phase to the returning salt. Both anode and cathode are flowing streams of bismuth. A Bi-Li stream generated at the cathode of the cell is fed to the 3-stage contactor, which effectively removes the ThF4 from the incoming salt. The salt then picks up BiF3 as it passes the anode. The salt stream containing BiF3 is passed counter- current to the bismuth stream entering the complex from the rareearth removal column to oxidize the rare earths, thorium, and lithium from the bismuth.
Salt containing rare earths at a concentration of 0.69 mole % is withdrawn from the system at a rate of 0.49 ft’/day. The active-metal fission products (Sr, Cs, Ba, Rb, and Eu) are also present in the stream at a concentration equal to that in the reactor and are removed on a 3000-day cycle. Salt withdrawal is through a set of tanks used sequentially and each having a volume of about 40 ft’ . This limits the rate at which rare earths could inadvertently return to the reactor. This salt will be fluorinated for uranium recovery when necessary.
21.2 PROTACTINIUM REMOVAL FROM A SINGLEFLUID MSBR
L. E. McNeese
A method for isolating protactinium from a single- fluid MSBR has been described earlier? Steady-state concentration profiles in the isolation column at the optimum operating conditions have been recalculated using current data on reduction potentials and thorium solubility. For the calculations, assumed values were: a fuel salt composition of 71.7-16-12-0.3 mole 7% LiF- BeF2-ThF4-UF4, a reactor volume of 1461 ft’, a processing rate of 2.5 gpm (three-day cycle), an operating temperature of 60O0C, a reactor power of 1000 Mw (electrical), and a protactinium decay tank volume of 200 ft’ . The thorium and lithium concentra- tions in the bismuth stream fed to the column were 0.0016 and 1.4 X 10- mole fraction respectively.
Lt A typical calculated profile is shown in Fig. 21.2. The uranium concentration in the salt decreases from the inlet value of 0.003 mole fraction to negligible values at the salt outlet. The concentration of protactinium in the salt increases from the inlet value of 1.39 X mole fraction to a maximum of 0.002 mole fraction, after which it drops to negligible values near the saIt outlet. The concentration of thorium in the bismuth stream drops from about 0.00132 mole fraction in the upper part of the column to 2 x io-’ mole fraction near the bismuth outlet. The concentration of lithium in the bismuth decreases from about 0.001 27 mole fraction in the upper part of the column to about 0.000142 mole fraction at the bottom of the column.
The concentrations of uranium and protactinium in the salt entering the decay tank are 3.69 X and 1.326 X lo-’ mole fraction respectively. The concen- trations of uranium and protactinium in the decay tank
- a
.
ORNL-DWG 69-2340RA ‘O0
j L i F
Po DECAY TANK
0 2 4 6 8 12 STAGE NUMBER
2L. E. McNeese and M. E. Whatley, MSR Program Semiann Progr. Rept. Feb. 28,1968,0RNL-4254, p. 248.
Fig. 21.2. Catculated Concentration Rofles in Protactinium Isolation Column.

273
W
L 0
s .
a
%
i
. *W
are 1.75 X IO-’ and 1.312 X mole fraction respectively. Under ideal steady-state operating condi- tions, approximately 93% of the protactinium present in the reactor system would be held in the decay tank. It is likely that the actual amount of protactinium isolated from the reactor will be somewhat below th is value, however, because of inability to maintain opti- mum operating conditions.
21.3 REMOVAL OF RARE EARTHS FROM A SINGLEFLUID MSBR
L. E. McNeese
The rareearth fission products are among the more important neutron absorbers in an MSBR, and opera- tion of t h i s system requires removal of these materials on a cycle of approximately 50 days. Removal of rare earths from a single-fluid MSBR is complicated by the need for separating the rare earths from thorium, which is a major component of the salt.
The proposed method for rare-earth removal is based on differences in the extent to which the rare earths and thorium distribute between molten salt and liquid bismuth containing a reductant. The removal system is shown in its simplest form in Fig. 21.3. A molten-salt stream consisting of fluorides of lithium, beryllium, and thorium and which also contains rare-earth fluorides is
ORNL-DWG 68-9443A
t ELECTROLYTIC OXIDIZER- REDUCER
EXTRACTION COLUMN
EXTRACTION COLUMN
Bi CONTAINING Ln
SALTCONTAINING LnF3
iALT CONTAINING .nF3T0 WASTE -
Fig. 21.3. Rare-brth Removal from a Single-Fluid Reactor by Reductive Extraction.
fed to the center of an extraction column. The salt flows countercurrent to a stream of liquid bismuth containing thorium and lithium. In the upper part of the column, a large fraction of the rare earths is reduced and transfers to the downflowing metal stream. Below the feed point, the concentration of rare earths is increased in the salt and metal streams in order to produce a concentration suitably high for disposal.
Molten salt leaving the top of the column contains rare earths at a low concentration. Part of this salt is returned to the reactor, and the rest is sent to an electrolytic cell complex, the net effect of which is to put thorium and lithium into bismuth for use as extractant and to return the extracted rare earths, entering the complex with bismuth from the bottom of the cascade, to the cascade as reflux, oxidizing them out of the bismuth and moving them to the returning salt stream. The complex consists of an electrolysis cell with contactors above and below it. Both the anode and the cathode of the cell are pools of flowing bismuth, and the electroIyte is salt containing neither larger amounts of rare earths nor thorium. The cathode puts lithium into the bismuth stream which flows into the lower contactor, extracting essentially all (about 99%) of the thorium out of the entering salt. The anode puts BiF3 into the salt which flows into the upper contactor and oxidizes essentially all of the rare earths out of the entering bismuth.
Rareearth removal efficiencies were calculated for a range of operating conditions to establish the impor- tance of number of stages, separation factor, metal-to- salt flow ratio, rare-earth concentration in the discard stream, location of the feed point, and the fraction of ThF4 which is reduced in the electrolytic cell. Assumed operating conditions included a reactor volume of 1461 ft3, a salt processing rate of 0.25 gpm (30-day cycle), an operating temperature of 6OO0C, and a reactor power of 1000 Mw (electrical). The thorium and lithium concentrations in the bismuth stream fed to the extraction column were both 0.0016 mole fraction.
It was found that the optimum feed location was at the center of the column for most operating conditions, and all results‘to be presented are based on this feed location. System performance is shown in Fig. 21.4 for a 24-stage column for a range of metal-to-salt flow ratios and for rareearth-thorium separation factors which range from 1.2 to 6. The fraction of the ThF4 which is reduced in the electrolytic cell is 99%. It should be noted that for the assumed operating conditions the metal-to-salt flow ratio in the lower part of the column is only dependent on the fraction of ThF4 reduced and is 85.4 for the present case. For the assumed operating conditions, a bismuth flow rate of

274
CRNL-DWG 69-24n~ FRACTION Th REDUCED-99 70 REF IN WITHDRAWAL STREAM-0.04 mole fraction UPPER COLUMN STAGES-I2 LOWER COLUMN STAGES12 FLOW RATIO IN LOWER COLUMN-78.3
METAL TO SALT VOLUMETRIC FLOW RATIO IN UPPER COLUMN
4.02 7.65 40.9 I 46.7 22.8 I 35.1 I 45.4 ~
13.9 27.5 40.7
f.0
0.8 > 0 z E 0.6
U W a z 0.4 5
0.2
0
30
35 - =.
40 5 50 E 60 +
>
W
80 g 100 E 150 200
t 2 5 IO 2 0 BISMUTH FLOW RATE (gpm)
Fig. 21.4. Metal-to-Salt Voiumetric Flow Ratio in Uppex COlUllUl.
15 gpm will result in a rareearth removal efficiency of 6% (44-day removal time) for a separation factor of 2 and a removal efficiency of 31% (95-day removal time) for a separation factor of 1.5. The metal-to-salt flow ratio in the upper column is about 34 for this bismuth flow rate.
System performance is shown in Fig. 21.5 for the same operating conditions except that a 12-stage extraction column is used. A bismuth flow rate of about 23 gpm is required for roughly the same removal efficiency for a separation factor of 2.
The effect of fraction of ThF4 reduced in the electrolytic cell is shown in Fig. 21.6 for a separation factor of 2 with a 24-stage column and a rareearth concentration in the withdrawal stream of 0.0069 mole fraction. It should be noted that this parameter is equal if not greater in importance than the other parameters considered. A significant decrease in removal efficiency results from the fraction of ThF4 reduced being decreased from 99 to go%, and the system becomes ineffective if less than 50% of the ThF4 is reduced. There is essentially no effect of the rareearth concen- tration in the withdrawal stream on removal efficiency in the range of interest.
The separation factors for several of the rare earths have been determined for bismuth saturated with thorium in contact with 72-16-12 mole % LiFBeFz- ThF, . The separation factors3 are 1.3 for Eu, 1.7 for
3Fig. 21.6, this report.
h, 1.8 for La, 2.0 for Sm, 3.0 for Nd, and 3.5 for Ce.
Table 21.1. The removal times range from about 225 days for europium to approximately 30 days for *
hj The removal times for these materials at the reference conditions (24 total stages and 15 gpm Bi) are given in
c
neodymium and cerium and are considered adequate. The rare earth which will set the operating conditions for the removal system is promethium (which has a separation factor of 1.7), since it is one of the more important rare earths. Lanthanum is less important, and the resulting removal time (-100 days) is satisfactory. The removal times for rare earths having separation factors greater than 2, such as neodymium and cerium, will be shorter than required.
8
a
t.0
8 0.8
B a k2 0.6 LL W C
0.4 5 a a (L
0.2
n
ORNL-DWG ~ - 2 4 0 6 a FRACTION Th REDUCED: 99% REF IN WITHDRAWAL STREAM:O.Ot mole fraction UPPER COLUMN STAGES: 6 LOWER COLUMN STAGES6 FLOW RATIO IN LOWER COLUMN:78.3
METAL TO SALT VOLUMETRIC FLOW RATIO IN UPPER COLUMN
- I 2 5 to 20
BISMUTH FLOW RATE (qprnl
Fig, 21.5. Metal-Walt Volumetric Flow Ratio in Upper Column.
ORNL-DWG 69-2405A I .o 0.9
8 0.8
p a7 k! 0.6
p 0.5
5 0.4 I= 2 03 a IL 02
0. 4
n - 4 2 5 40 20
BISMUTH FLOW RATE (gpm)
Fig. 21.6. Rare-Earth Removal System.Performance as a Function of Bismuth Phase Flow Rate and the Thorlum Re- moval in the Electrolytic cell Complex.

I
275 i
Table 21.1. Removal Tmes for Various Rare Earths at Refmnce Conditions"
~ ~~ ~
Rate Earth Separation Factor Removal Time (days)
Pm Nd Sm La Eu Ce
1.7 3.0 2.0 1.8 1.3 3.5
63.8 30.6 43.5 47.1
222.0 30.3
~~
"Reference conditions include a total of 24 stages and a bismuth flow rate of 15 jpm.
21.4 MATERIAL BALANCE CALCULATIONS
M. J. Bell L. E. McNeese
A computer code has been developed to perform steady-state material balance calculations which de- scribe in detail the nuclear, chemical, and physical processes taking place in the fuel stream of an MSBR. Such calculations are necessary to determine fission
. product inventories and heat generation rates, to specify flow rates of streams in the chemical processing plant, and to investigate the effects of changes in chemical processing on the nuclear performance of the MSBR. The code also takes into account the buildup of transuranium isotopes, the production of activation products by neutron capture in the carrier salt, and chain branching in the fission product decay schemes not included in earlier investigations?
3
* -
21.4.1 MSBR Nuclear Data Compilation
In order to perform these calculations, a library of nuclear data for MSBR applications has been compiled. This library contains half-lives and radioactive decay schemes, three-group neutron capture cross sections, and beta and gross gamma disintegration energies for 687 nuclides. Of these, 178 are isotopes of elements which comprise the carrier salt, graphite, and structural materials and their activation products, 461 are fission products and their daughters, and 48 are isotopes of the actinide elements and their daughters. The radioactive decay schemes include beta and positron emission to
consists of a thermal cross section, a resonance integral, and a fast cross section which was generated by averaging a cross section over an MSR spectrum given by Prince for E > 1 M e ~ . 6 * ~ Where possible, the thermal cross sections and resonance integrals have been corrected for non-l/v behavior, also using the data of Prince? s7 In addition to total neutron absorption cross section, the library also contains, for each group, the fraction of neutron captures which lead to fission and n-7, ne, n-p, and n-2n reactions. These data are based primarily on the compilations of Stehn et aL8 and Drake? The fission product library includes a compila- tion of direct fission yields from five fissile species, 233U, 235U, 238U, 232Th, and 23gPu, based on the data of Katcoff.' The beta plus gamma disintegration energies were calculated using the computer code SPECTRA written by E. D. Arnold to compute the average energy of a beta particle by integration of the Fermi beta-ray spectrum taking into account changes in spin and parity.' A computer code has been written which reads the data in this nuclear library from cards and prepares i n array of transition coefficients to be used in the material balance calculations to be described below.
21.4.2 MSBR Material Balance Calculations
For many purposes it is adequate to consider the recirculating fuel salt in a proposed MSBR to be a well-mixed fluid at steady state in which the average concentration of a nuclide i is given by the equation
Q =mi, + v C eii+Ni i
'C. M. Lederer, I. M. Hollander, and I. Perlman, Table of
%. E. Prince, MSR hogram Semiann hog. Rept. Feb. 28. Isotopes, 6th ed., Wdey, New York, 1967.
1967.0RNL-4119, pp. 79-83. isomeric states and ground states of daughter nuclides, . alpha emission, and isomeric transition. These decay schemes are based primarily on the compilation of Lederer et d S The three-group cross-section library
7B. E. prince, MSR horn,,, semiann. hog. Rept. 31,
8 ~ . R. Stehn et UZ., B N L - ~ z , ~ ~ ed., suppi. NO. 2, VOIS. 1-111 1967, oRNL-4191, pp. 50-58.
(1964). 'M. K. Drake, Nucleonics 24,108 (1966). 'OS. Katcoff,Nucleonz'cs 18,163 (1960). "E. D. Arnold, Handbook of Shielding Requirements, 4J. S. Watson, L. E. NcNeese, and W. L. Carter, MSR &ogram
Semiann. h o g . Rept. Aug 31,1967,ORNL-4191. ORNL-3576, pp. 21 ff. (1964).

276
where
Ni = concentration of species i, atomslcc, Njo = feed concentration of species i, atoms/cc, F = volumetric flow rate of fuel salt, cc/sec, 1
Y = fuel salt volume, cc, Yc = reactor core volume, cc, 4 = volume- and energy-averaged neutron flux,
Xi = radioactive disintegration constant of species
ui = total spectrum-averaged neutron cross section,
barns-' sec-' ,
i, sec-' ,
barns, ufi = fission cross section of species i, barns, eq= fraction of disintegrations by species j which
fik =fraction of neutron captures by species k
yim = fission yield of species i from fission of species
Pi = effective chemical processing rate for species i,
This equation is a generalization of that given in ref. 1 and is a statement of the fact that at steady state the rate of input of species i into the system by direct feed, radioactive decay of precursors, neutron capture, and fission must equal the rate of loss of species i by radioactive decay, neutron capture, flow out of the system, and chemical processing. In addition to the terms given in Eq. (1) the code also provides for loss of isotopes of xenon and krypton by diffusion into the graphite moderator followed by neutron capture or radioactive decay, and production of isotopes of xenon and krypton in the he1 salt by migration of gaseous neutron capture products out of the graphite, using a model developed by Kedl and Houtzeel.'? Provision is also made in the code for migration of noble gases and noble metals to recirculating bubbles in the fuel salt.' The bubbles are treated as a separate well-mixed region of fuced residence time in which radioactive decay may take place. Daughters which are not themselves noble gases or noble metals are assumed to return to the fuel salt.
lead to formation of species i,
which lead to formation of species i,
m.
cclsec.
"R. J. Ked and A. Houtzeel, Deuelopment of a Model for Computing 135Xe Migration in theMSRE, ORNL-4069 (1967).
I3F. N. Peebles, Removal of l j S X e @m circlrlating Fuel Salt of the MSBR by Mass nansfer to He Bubbles, ORNL-TM- 2245 (1968).
i The volume-averaged thermal flux and the ratio of the resonance flux per unit lethargy to the thermal flux, which are required to compute the spectrum-average cross sections for use in Eq. (l), are obtained from the output of the ROD reactor design code for a given reactor configuration and fuel processing scheme.I4 The ROD code is a multiregion, six-group neutron diffusion code used for the primary design and evalua- tion calculations for the MSBR. For these conditions Eq. (1) is a coupled system of N linear algebraic equations in N unknowns of the form
L
* .
N O = ai$k+bi,i=1,2 ,..., N.
k= 1
The steady-state code which has been developed to solve the system of equations (2) employs the Causs- Seidel 'interaction technique, a well-known numerical method which can be shown to converge provided the coefficients aik h l f i certain restrictions.'
The code requires as input the fuel salt volume, core volume, graphite volume, removal times of the elements by chemical processing, and solubility and mass transfer coefikients for migration of the noble gases to the graphite in addition to the nuclear library and the three-group weighting factors for the reactor spectrum described above. The code gives as output the composi- tion of the fuel stream in gram-moles per cubic centimeter and mole fraction of each isotope, the neutron poisoning, and the beta and gamma specific power for each nuclide in watts per cubic centimeter. The code also gives the flow rates, in grams per day, the compositions, and the power of the various streams of fssion products leaving the primary fuel-salt loop.
A synthesis of this material balance code with a version of the ROD reactor design code has been developed in order that calculations can be performed for a given reactor configuration over a range of processing conditions. This combihed code uses ROD to determine the absorption rates in thorium and uranium for an assumed lumped fission product poisoning. The converged absorption rates for the actinide elements from ROD are then used by the material balance code, which computes inventories and poisoning for the individual fission product nuclides and calculates a new lumped fission product poisoning which is then used by ROD. This process is repeated until the lumped fission m
"0. L. Smith, W. R. Cobb, and H. T. Ken, MSR Rogram
"L. Lapidus, Digital Computation for Chemical Engineers, Semiann Rogr. Rept. Aug. 31.1968.ORNL-4344, p. 68.
McGraw-Hill, New York, 1967.

277
W
S 0
0
0
E
i*
.
6
c
-w
product poisoning calculated by the two codes is satisfactorily close, at which point all concentrations, absorption rates, etc., are known for the assumed operating conditions.
21.4.3 MSBRP~OCS~I g Plant Design Calculations
Calculations were made for a 2250-Mw (thermal) single-fluid reactor containing 1460 ft3 of fuel salt of approximate composition 71.7-16-1 2-0.3 mole % LiF- BeF2 -ThF4 -UF4. The gases xenon, krypton, and tritium have low solubilities in the fuel salt and can be removed by sparging the salt with helium.’ The noble metals (As, Se, Nb, Mo, Tc, Ru, Rh, Pd, Ag, and Te) do not form fluorides in the salt environment but appear in the gas space of the fuel pump bowl and plate out on the graphite and vessel walls as free metals.17 A 50-sec residence time in the fuel salt was assumed for the noble gases and noble metals as they migrated to the helium bubbles. I t was assumed that these materials circulate in the gas space, which was treated as a
“R. J. Kedl, MSR Rogrm Semiunn Rog. Rept. Aug. 31,
7S. S. Kirslis and F. F. Blankenship, MSR Rogmm Semhnn 1968.ORNL-4344, pp. 72-75.
R O ~ Z R v t . A u ~ . 31,1968,ORNL-4344, pp. 115-42.
well-mixed volume which was stripped on a 110-sec cycle. Plating out of the noble metals on surfaces was not treated as a separate removal mechanism; that is, all noble metals removed from the fuel salt were assumed to be present in the stream resulting from stripping the gas space on a 110-sec cycle. A 2OOday removal time was assumed for zirconium and the seminoble metals (Ca, Ce, Cd, In, Sn, and Sb).
The rare-earth fission products with the exception of europium were removed on a 50-day cycle; europium was removed on a 225day cycle. The active metals (Rb, Cs, Sr, and Ba) were removed by salt discard on a 3000-day cycle. The halogens (I and Br) will be removed from the salt during fluorination on a SO-day cycle.
Table 21.2 gives the processing cycle times, flow rates, and heat generation rates of the principal groups of fmion products being withdrawn from the primary- salt loop of the MSBR. It is seen that these streams contain about 1.5% of the reactor power and that 90% of this power is generated in the noble gas and noble metal streams. Table 21.3 gives the chemical composi- tion of these streams of fission products, and the most important fission product poisons are listed in Table 21.4. Studies are now being performed which will give additional information on the effect of chemical pro- cessing rates on the nuclear performance of the MSBR.
Table 21.2. Processing Cycle Times, Flow Rates, and Power of Fission Product Streams in a 2250 Mw
(Thermal) MSBR
Chemical Group Processing Flow Rate Power
Cycle Time’ Grams per Day Moles per Day (Mw)
Noble gases 50 secb 496.3 4.337 11.37 Noble metals 50 secb 685.4 6.173 16.03
Rare earths 50 days 718.6 5.245 1.29 Zirconium and seminoble metals 200 days 299.5 3.193 0.43
0.94 Active metals 3000 days 79.9 0.740
Total 2281.6 19.70 30.08
Halogens 50 days 1.9 0.016 0.02
-
‘The removal times of aIl elements except europium are assumed to be equal to the processing time
bIn addition to a 5O-sec residence time in the salt, the noble gases and noble metals are assumed to for their chemical group. Europium is removed from the fuel salt on a 225-day cycle.
circulate in helium bubbles with 110 sec residence time.

278
Noble Gases Noble Metals Element Mole Fraction Element Mole Fraction
Xe 0.556 Te 0.391 Kr 0.443 Nb 0.317 T 0.001 Mo 0.174
othas 0.118
Halogens Element Mole Fraction
I 0.764 Br 0.236
Rare Earths
Element Mole Fraction
0.382 0.986 0.250 0.008 0.111 0.005
La 0.103 others 0.001 0.094 lr Others 0.060
Active Metals Zirconium and Seminoble Metals
Element Mole Fraction Element Mole Fraction
Sr 0.603 cs 0.242 Ba 0.141 Rb 0.014
Table 21 A. Fission Product Poisons in a 2250 Mw (Thermal) Single-Fluid MSBR
Nuclide Poisoning Concentration (absorptions per (mole fraction) fissile absorption)
x 10” x 10”
0.631 0.15 0.500 9.0 x 10” 0.160 9.1 0.150 3.0 0.146 0.43 0.044 1.2 0.044 608.0 0.039 0.050 0.037 0.81 0.035 8.0 0.025 3.8 0.025 0.038 0.024 64.0 0.022 0.26 0.013 46.0 0.013 1.6 0.012 6.6 X 0.01 1 7.2 0.010 0.1 1 0.006 12.0
OA 13’Xe poison fraction of 0.005 is a tixed design value.
L,
S
*
r .

b
r' 0
c
s
22. Measurement of Distribution CoeMicients in Molten-Salt-Metal Systems
L. M. Ferris
During this reporting period, chemical development of the reductive extraction method'-3 for the process- ing of single-fluid MSBR fuels was continued. The experimental work consisted mainly in the measure- ment of the equilibrium distribution of uranium, zirconium, protactinium, plutonium, and rare earths between LiF-BeF2 -ThC4 solutions and liquid bismuth solutions; the effect of nickel on the solubility of thorium in bismuth was also studied. The distribution coefficients,
DM =
mole fraction of component M in the metal phase ' mole fraction of component M in the salt phase '
at a given temperature can be expressed as
CLi is the lithium concentration in the metal phase (at. %), Z is a constant, and n is the valence of the species in the salt phase. This expression comes directly from the thermodynamic treatment4 of the equilibria involved in the two-phase systems. The ease with which two components can be separated is indicated by the separation factor = D A / D B . The higher the separation factor, the easier the separation.
In addition to the main effort on the reductive extraction process, preliminary results were obtained on a metal-transfer method for the separation of rare
'L. E. McNeese and M. E. Whatley, MSR hogram Semiann.
'L. M. Fenis, MSR R o p m Semiann. bog. Rept. Aug. 31.
3D. E. Faguson, Chem Technol. Div. Ann Rog. Rept. May
4J. H. Shaffer et aI.. Reactor Chem Div. Ann Rogr. Rept.
b o g . Rept. Feb. 29,1968,ORNL-4254, p. 248.
1968,ORNL-4344, p. 292.
31,1968,0RNL-4272, p. 14.
Dec. 31.1966.0RNL-4076, p. 34.
earths from thorium. If successful, this technique would provide an alternative to the reductive extraction method.
22.1 EXTRACTION OF URANIUM, ZIRCONIUM, PROTACTINIUM, AND PLUTONIUM FROM SINGLEFLUID MSBR FUELS
J. C. Mailen F. J. Smith J. F. Land
The equilibrium distribution of uranium, zirconium, protactinium, and plutonium between several typical LiFBeF2 -ThF4 single-fluid MSBR fuel salts and liquid bismuth solutions has been measured. The behavior of these elements is of primary interest in the protactin- ium isolation portion of the reference reductive extrac- tion flowsheet? Prior studies2 *3 utilizing LiF-BeF2 - ThF4 (69.2-19.4-11.4 mole %) as the salt phase established that the extractability of protactinium was between that of uranium and thorium and that the respective separation factors were high enough to allow isolation of the protactinium. Extraction of zirconium (a major fission product) from LiF-BeF2-ThF4 salts has received little, if any, attention. Preliminary work' with LiF-BeF2 (66-34 mole 7%) indicated that zirconium would behave like a rare-earth fission product. Data obtained in the present study using LiFBeF, -ThF4 (72-16-12 mole %) show that this is not the case. The possibility of using plutonium as a fuel in an MSBR (particularly during startup) has often been con- sidered? consequently its behavior in a reductive extraction process required study.
All experiments involving zirconium, and some of those with uranium, were conducted in mild steel
'D. M. Moulton et al., Reactor Chem Div. Ann. Bog. Rept.
6R. E. Thoma, Chemical FeasibiIiV of Fueling Mdten Sal1 Dec. 31,1967,0RNL-4229, p. 41.
Reactors with M3,ORNL-TM-2256 (June 20,1968).
279

apparatus using the procedure described previously? *3
The other experiments were conducted in a system in which the components that contacted the salt and bismuth (crucible, sparge tube, thermowell) were all fabricated of molybdenum. Use of molybdenum allowed simultaneous HF-H2 treatment of the salt and bismuth, making it possible to conduct several experi- ments in sequence in the same apparatus using only one initial charge of protactinium. In a typical experiment, 100 to 150 g of salt and about 200 g of bismuth were loaded into the molybdenum crucible. A few milligrams of ” ‘Pa contained in hydrofluoric acid solution was evaporated onto about 1 g of LiF and added to the system along with any uranium or plutonium desired. In several experiments in which uranium was present, the 233U isotope was used to facilitate accurate analysis. The salt and bismuth were sparged first with 50% HF-50% H2 for about 24 hr to remove oxide impurities and then for 3 to 4 hr with pure hydrogen to reduce noble-metal fluorides (Ni, Bi, Mo, etc.). The two phases were then sparged with purified argon to remove all residual hydrogen. Extraction of the various com- ponents (U, Pa, Pu, etc.) from the salt into the bismuth was effected by the incremental addition of crystal-bar thorium to the system. The first piece of thorium added usually had been irradiated to contain about 1 mc of
’Pa tracer in the system allowed immediate gamma counting of the samples, giving a rapid indication of the progress of the experiment. Filtered samples of each phase were taken at least 4 hr after each addition of thorium. Analyses of these samples provided the data necessary for the calculation of the distribution coefficients. In each experiment the system was equilibrated under an argon atmosphere. The argon was purified by passage through two traps filled with uranium turnings; the first trap was held at about 625°C and the second at 200 to 300°C.
In most of the previous studies2y3y5s7 the valence of the uranium species in the salt phase during extraction was taken to be 4. Thermodynamic considerations’ s9
using data for LiF-BeF2 systems indicate that at 600°C
3 ~ a ; the presence of the
7D. M. Moulton, W. R. Grimes, and J. H. Shaffer, MSR h g m m S e m h n Progr. Rept. Feb. 29, 1968, ORNL-4254, p. 152. %. M. Ferris, Some Aspects of the Thermodynamics of the
Exbuction of Uranium, Thopiurn, and Rare Earths from Molten LiF-BeF2 into Liquid Li-Bi Solutions, ORNGTM-2486 (in P=3.
9C. F. Baes, h., “The Chemistry and Thermodynamics of Molten Salt Reactor Fluoride Solutions,” in Thermodynamics, vol. 11, p. 409, IAEA, Vienna, 1966.
280
L1’ the valence of the uranium should be very close to 3 when the lithium concentration in the bismuth phase is greater than about 2 wt ppm (0.006 at. %). The results of our recent experiments using refined analytical
LiF-BeF2 -ThF4 solutions at 600°C. This is illustrated by the plot of log D, vs log DLi shown in Fig. 22.1; these data were obtained in two separate experiments at 600°C using LiF-BeF2-ThF4 (72-16-12 mole %). The line has a slope of 3. Similar data were obtained in experiments with other salt compositions. Further evidence for the trivalency of uranium in the salt phase is provided by plots of log D, vs either log D,, or log Dpa. Uranium and zirconium data from two experi- ments at 600OC using LiF-BeF2-ThF4 (72-16-12 mole %) are shown in Fig. 22.2. The slope of this plot of log D,, vs log D, is 1.33, as would be expected if the uranium existed as a trivalent species in the salt. More
1 methods show that this is generally true for uranium in .D
. .
.
io2
I- z w Y
to’ 0 V z
3 m a g 9 10° z 2
a a
io-’
10-2
c
s
Fig. 22.1. Equilibrium Ftribution of Uranium Between YF- BeF2-ThF4 (72-16-12 Mole 96) and Bismuth Solutions at 600 C.

281 ORNL-DWG 69-42460.
.” 2 5 2 5 to-’ 2 5 too 2 5 td
URANIUM DISTRIBUTION COEFFICIENT
Fig. 22.2. Equilibrium Distribution of Uranium and Zu- conium Between LiF-BeF2-ThF4 (72-16-12 Mole %) and Bis- muth Solutions at 600°C
importantly, these data show that uranium and zirco- nium will behave almost identically in the proposed reductive extraction process. Undoubtedly, special provision will have to be made to remove zirconium from the system at one point in the process.
The results of previous studies’ indicated that prot- actinium existed as a tetravalent species in the salt phase in a reductive extraction system. Additional experimentation has verified this conclusion. This is Bustrated by the plots of log D,, vs log D, and log D,, shown in Fig. 22.3. These data were obtained with LiF-BeF2-ThF4 (72-16-12 mole %) at 60O0C. The slope of the Pa-Th line is 1, as expected from two tetravalent species; the slope of the Pa-U plot is 1.33, which is consistent with the presence of tetravalent protactinium and trivalent uranium in the salt phase. Plutonium was expected to be trivalent ’in these systems. This expecta- tion was confirmed, as illustrated by the plots of log D,, and log D,, vs log D,, shown in Fig. 22.4; the slope of each line is 1.33.
Most of the distribution coefficient data obtained so far for uranium, protactinium, zirconium, plutonium, and thorium are compiled in Table 21.1 in the equation form: log D = n log CLi + log I. The data were not analyzed statistically; the equations were obtained by visually fitting what appeared to be the best line through the experimental data. Close inspection of
these equations reveals that the distribution coefficients vary as the composition of the salt is changed. The difference in Pa-Th behavior is most noticeable; for example, with the salts containing about 12 mole % ThF4, the Pa-Th separation factor increased from about 21 00 to 4400 as the “free fluoride” equivalence’ of the salt increased from -4 to +I3 (see also Fig. 22.6;Sect. 22.3). “Free fluoride” equivalence (FF) is defined by
FF = LiF (mole %) - 2BeF2 (mole %) - 3ThF4 (mole %) .
The fact that the Pa-Th separation factors obtained with LiFBeF2 (66-34 mole 5%) and LiF-ThF4 (73-27 mole %) do not correlate with those obtained with salts containing about 12 mole % ThF4 emphasizes that the “free fluoride” model is far from’ideal. The U-Pu separation factor was about 10 in the two systems in which plutonium was present. Both the U-Pa and Pu-Pa separation factors are variable since the valences of the
Fig. 22.3. Equilibrium Distribution of Protactinium, Thorium, and Uranium between LiF-BeF2-ThF4 (72-16-12 Mole %) and Bismuth Solutions at 6WoC

282
io’ 402 PLUTONIUM DISTRIBUTION COEFFICIENT
ORNL-OWG 69-t250A
I- E to‘ 8
0 LL II. W
2
co a z I
k
0
E t,
to’ * a
too
Fig. 22.4. Equilibrium Distribution of Thorium, Protactinium, and Plutonium Between LiPBeFz-ThF4 (72-16-12 Mole %) and Bismuth Solutions at 600°C.
species are different. When the bismuth phase was saturated with thorium (DTh = 0.0145 for salts in which the TM4 concentration is 12 mole %), the U-Pa separation factor was about 15 to 20 regardless of the salt composition. These data show that, for MSBR fuel salts containing about 12 mole % ThF4, separation of uranium from protactinium should be relatively easy, especially if the reductant concentration in the metal phase is kept low. The Pu-Pa separation is not so easy, but separation factors greater than 10 can probably be achieved by maintaining a very low reductant concen- tration in the metal phase.
In several experiments, distribution coefficients for the various components were determined as a function of temperature under conditions where the metal phase was saturated with thorium. The effect of temperature on the metal-thorium separation factors obtained with LiF-BeF2-ThF4 (72-16-12 mole %) is shown in Fig. 22.5. As seen, these separation factors increase regularly with decreasing temperature.
ORNL-DWG 69-5995
TEMPERATURE (“c) 700 600 500
LO 1.1 1.2 1.3 1.4
‘OoO/T (OK)
Fig. 22.5. Variation of Metal-Thorium Separation Factors with Temperature. Data obtained with LiF-BeFzThF4 (72-16-‘ 12 mole %). Bismuth phase was saturated with thorium at each temperature.
22.2 SOLUBILITY OF PROTACTINIUM IN BISMUTH
J. C. Mailen F. J. Smith
bj
I
I
C
In the last semiannual report? we gave preliminary results for an experiment (PE7) that was designed to demonstrate that protactinium was sufficiently soluble in bismuth solutions for the reductive extraction process to be practicable. Complete results are now available for this experiment and are presented in Table 22.2. During the present reporting period, we found that the original thorium analyses of the metal phase were in error and, because of the loss of the samples, could not be corrected. Also, distribution coeficients for protactinium and thorium were determined with LiF-BeF2 (66-34 mole %), the same salt used in experiment PE7. The thorium concentrations in the metal phase given in Table 22.2 were calculated using the measured equilibrium data (Table 22.1 ;Sect. 2 2 4 , the protactinium distribution coefficients obtained in experiment PE7, and the thorium analyses of the salt
results show that one objective of experiment PE7, the demonstration of the mutual solubility of protactinium and thorium at the 1000-ppm level, was not met. Since thorium and lithium were present in amounts much less than originally thought, the reported number of 1200
samples taken in experiment PE7. These corrected B
.)
b6
r . *
P

283
/ w Table 22.1. Equilibrium Distribution of Uranium, Protactinium, plutonium, Thorium, and Zirconium Between LiF-BeF2-ThF4 Salts and Bismuth Solutions
!
Salt Composition “ F M Temperature (“c, (mole %) Fluoride”
LiF BeF2 ThF4 ~ u ~ ~ e n ~ Equilibrium Expressiona
Pa-Th Separation Factor,
DPalDTh
69.2
66.0
72.0
75.0
73.0
19.4
34.0
16.0
13.0
0
“CLi is the lithium concentration in the metal phase in atom percent.
Table 22.2. Results of Experiment PE7, Demonstrating the High Solubility
of Protactinium and Uranium in Bismuth
Total Concentration in Metal Phase
(days) Pa Tha U Time (M ppm) Tem exature g
( 0 Sample
lb 600 2 600 3 600 4 650 5 560 6 500 7 550 8‘ 600
0.16 3.0 5.0 5.1 6.0 7.0 7.3 9.0
1124 1874 2078 60 2078 60 2078 1199 40 2059 60 668 17 1090
i d i
, . i
“These thorium concentrations were calculated from the measured protactinium distribution coefficient and the Pa-Th separation factor determined in a separate experiment with LiF-BeF2 (66-34 mole %) (Table 21.1, Sect. 21.1).
bA small amount of thorium was added to the metal phsse after thii sample was taken.
cA small amount of UF4 was added before this sample was taken.

284
ppm is probably very close to the true solubility of protactinium in bismuth at 500°C. Furthermore, the original conclusion that the solubility of protactinium in bismuth is high enough for process application is still valid.
Toward the end of experiment PE7, sufficient UF4 was added to the system to effect oxidation of some of the protactinium from the metal phase. Under the equilibrium condition established, the metal phase contained about 668 ppm Pa and 1090 ppm U, with corresponding uranium and protactinium material balances of nearly 100%. Thus the mutual solubility of uranium and protactinium in bismuth appears to be high.
22.3 EXTRACTION OF THOFUUM AND RARE EARTHS FROM SINGLEcFLUID MSBR FUELS
L. M. Ferris J. J. Lawrance J. F. Land
Distribution coefficients for thorium and several rare earths have been measured at 600 to 700°C using a variety of LiF-BeF2 -ThF4 solutions in which the ThF4 concentration was about 12 mole %. The experimental procedure used was described in a previous report? In each experiment the bismuth phase could be saturated with thorium without changing the composition of the salt detectably. The highest distribution coefficients for the respective components in the system are attained
Table 223. Distribution of Thorium, Rare Earths, and Lithium Between LiF-BeF2-ThF4 Wts and Thorium-Saturated Bismuth Solutions at 600 and 700°C
Salt Composition Dmax “Free Temperature Rare CY@
Rare Th Earth (“(3 Earth Li
(mole %) Fluoride” LiF BeF2 ThF4 Equivalence
69.2 19.4 11.4 -4 600
700
72.0 16.0 12.0 +4 600
t
700
75.0 13.0 12.0 +13 600
700
L;
a - 8
c
Eu* Eu* La* La* Nd* Nd* La* Nd* La*
Sm‘ Nd* Sm‘ Nd* Eum Eu” La* La* Nd* Eu” La* Nd*
x 10P x ioP x io* 1.45 1.35 1.3 0.96 1.59 1.30 1.5 1.2 1.61 1.51 2.0 1.3
2.1 1.5 1.49 1.44 1.65 1.53 4.2 2.7 1.62 1.49 3.8 2.5 4.60 4.0 6.0 15 4.23 4.94 13.9 2.8 1.88 1.45 2.3 1.6 1.88 1.54 3.2 2.1 2.16 1.40 4.2 3.0 5.02 4.55 9.7 2.1 5.29 4.41 8.6 1.9 2.28 1.49 2.8 1.9 2.33 1.50 2.6 1.7 2.43 1.40 3.5 2.5 2.40 1.36 3.3 2.4 2.40 1.50 5.6 3.7 6.19 3.92 6.7 1.7 6.48 4.35 7.6 1.8 6.95 4.11 14.0 3.4
‘The average valence of Sm in this experiment was 2.7, indicating that both Sm” and Sm* were present in the salt. hk
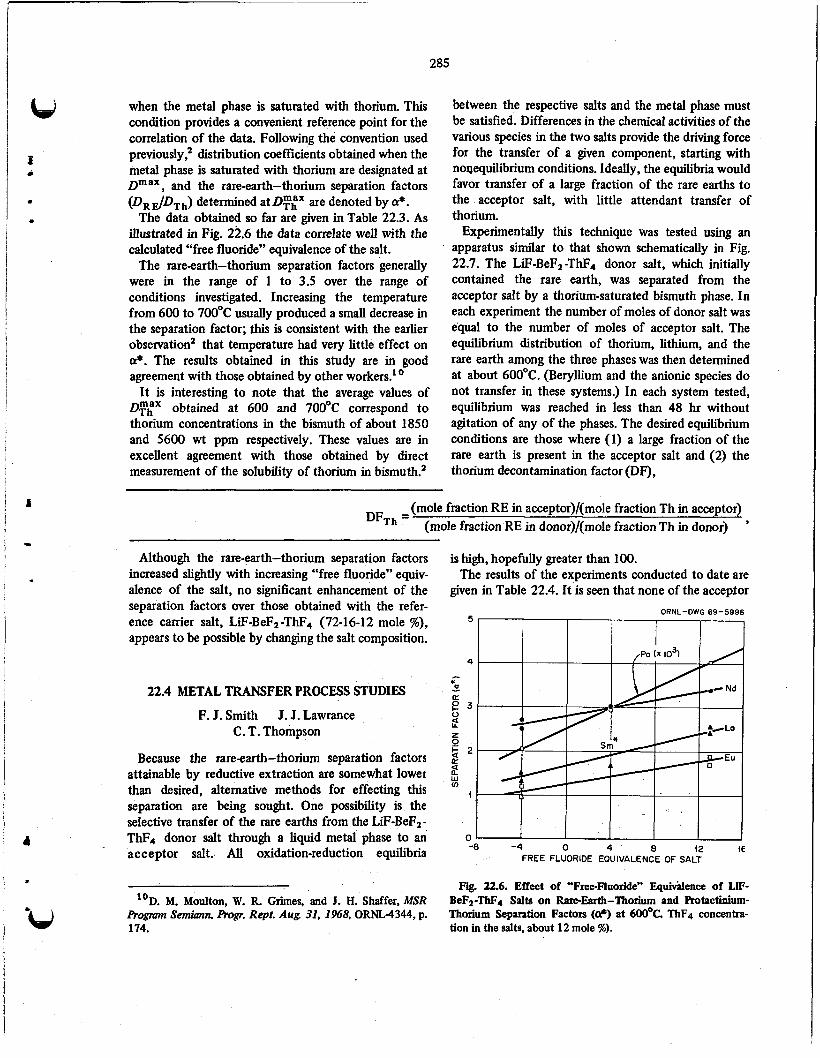
285
when the metal phase is saturated with thorium. This condition provides a convenient reference point for the correlation of the data. Following the convention used previously: distribution coefficients obtained when the metal phase is saturated with thorium are designated at Dm ”, and the rare-earth-thorium separation factors (DR#Th) determined at OF:” are denoted by a*.
The data obtained so far are given in Table 22.3. As illustrated in Fig. 22.6 the data correlate well with the calculated “free fluoride” equivalence of the salt.
The rareearth-thorium separation factors generally were in the range of 1 to 3.5 over the range of conditions investigated. Increasing the temperature from 600 to 700°C usually produced a small decrease in the separation factor; this is consistent with the earlier observation2 that temperature had very little effect on a*. The results obtained in this study are in good agreement with those obtained by other workers.’
It is interesting to note that the average values of DFF obtained at 600 and 7OO0C correspond to thorium concentrations in the bismuth of about 1850 and 5600 wt ppm respectively. These values are in excellent agreement with those obtained by direct measurement of the solubility of thorium in bismuth.2
between the respective salts and the metal phase must be satisfied. Differences in the chemical activities of the various species in the two salts provide the driving force for the transfer of a given component, starting with nopequilibrium conditions. Ideally, the equilibria would favor transfer of a large fraction of the rare earths to the acceptor salt, with little attendant transfer of thorium.
Experimentally this technique was tested using an apparatus similar to that shown schematically in Fig. 22.7. The LiF-BeF2-ThF4 donor salt, which initially contained the rare earth, was separated from the acceptor salt by a thorium-saturated bismuth phase. In each experiment the number of moles of donor salt was equal to the number of moles of acceptor salt. The equilibrium distribution of thorium, lithium, and the rare earth among the three phases was then determined at about 60OoC. (Beryllium and the anionic species do not transfer in these systems.) In each system tested, equilibrium was reached in less than 48 hr without agitation of any of the phases. The desired equilibrium conditions are those where (1) a large fraction of the rare earth is present in the acceptor salt and (2) the thorium decontamination factor (DF),
(mole fraction RE in acceptor)/(mole fraction Th in acceptor) (mole fraction RE in donor)/(mole fraction Th in donor)
DFTh = ’
Although the rare-earth-thorium separation factors increased slightly with increasing “free fluoride” equiv- alence of the salt, no significant enhancement of the separation factors over those obtained with the refer- ence carrier salt, LiFBeF2-ThF4 (72-16-12 mole %), appears to be possible by changing the salt composition.
22.4 METAL TRANSFER PROCESS STUDIES
F. J. Smith J. J. Lawrance C. T. Thompson
Because the rare-earth-thorium separation factors attainable by reductive extraction are somewhat lowei than desired, alternative methods for effecting t h i s separation are being sought. One possibility is the selective transfer of the rare earths from the LiF-BeF2- ThF4 donor salt through a liquid metal phase to an acceptor salt. All oxidation-reduction equilibria
‘OD. M. Moulton, W. R. Grimes, and J. H. Shaffer,MSR Rogram Semiann Rogr. Rept. Aug 31, 1968,ORNL4344, p. 174.
is high, hopefully greater than 100. The results of the experiments conducted to date are
given in Table 22.4. It is seen that none of the acceptor
I I I I I I ORNL-DWG 69-5996
5
4 I
L 0
cc
0
- t o 3
c z g 2 P
w rn L
i
0 -8 -4 0 4 8 (2 (E
FREE FLUORIDE EQUIVALENCE OF SALT
Fig. 22.6. Effect of “Free-Fluoride” Equidence of LF- BeF2-ThF4 Salts on Rare-Earth-Thorium and Protactinium- Thorium Separation Factors (@) at 6OO0C. ThF4 concentra- tion in the salts, about 12 mole %).

ORNL-DWG 69-5997 LI \ SAMPLE PORT
THERMoWELL 1 SAMPLE PORT
- ARGON O U T L E T
MILD STEEL CRUCIBLE
L i F - BeF2-ThF4 DONOR SALT
THORIUM-SATURATED BISMUTH - 1 - 1 - - I -
Fig. 22.7. Schematic Diagram of Reaction Vessel Used in Metal-Transfer Experiments.
Table 22.4. Rare-Earth-Thorium Separations in Metal Transfer Experiments
At equilibrium, with equal moles of donor and acceptor salts; bismuth phase saturated with thorium
Amount of Rare Earth Thorium
(c) Earth Transferred DF Acceptorsalt ' Terngemme Rare Donor Salt
(%I
LT-BeFz-ThF4 (75-13-12 mole %) LiF-BeF2 (66-34 mole 9%) 600 Eu(I1) 39.0 21.0
LiF-BeFz-ThF4 (75-1 3-12 mole %) LiF-BeFz-ThF4 (72-16-12 mole %) LiF-BeFz-ThF4 (72-16-12 mole %)
LiF-BeFz-ThF4 (72-16-12 mole %) LiF-BeFz-ThF4 (72-16-12 mole %) LiF-BeFz-ThFd (72-16-12 mole %) LiFBeF2-ThF4 (72-16-12 mole %) LiF-BeFz-ThF4, (72-16-12 mole %)
LiF-BeF2 (66-34 mole %) LiF-BeF2 (57-43 mole %) Licl
LiCl-LiF (90-10 mole %)
Licl-LiF (80-20 mole %) Licl-LiF (80-20 mole %) LiBr LiBr-LiF (90-10 mole %)
600 La(II1)
600 La(I1I) 640 La(II1)
640 La(II1)
640 La(II1) 600 La(II1)
600 W I I ) 600 La(II1)
6.4 3.5
5.00 3.00
4.1 b 20.0 23.0
35.0 12.0
34.0 10.0 1.4
9.0 20.0
aCalculated from distribution coefficient data from separate experiments with the respective salts. 'Contamination of the Licl with a trace of the LiF-BeFz-ThF4 salt precluded determination of this value. The thorium DF
should be greater than 300, based on the distriiution coefficient data obtained in other experiments.'
0 . s .
?
h

287
V
a 0
I
*
f
1 I
: -w
salts used fulfilled both of the desired criteria. Signifi- cant transfer of the trivalent rare earth lanthanum was achieved using LiCI-LiF solutions as the acceptor; however, the thorium decontamination factor was only in the range of 10 to 20. Other studies" with pure LiCl indicate that high thorium decontamination factors could be achieved but that only a small fraction of a trivalent rare earth such as lanthanum or neodymium would be transferred. The search for an acceptor salt that provides the desired results is continuing.
22.5 EFFECT OF OTHER COMPONENTS ON THE SOLUBILITY OF THORIUM
IN BISMUTH
F. J. Smith J. F. Land C. T. Thompson
Throughout our studies we have been constantly alert to solute interactions in the bismuth phase that could decrease the solubility of thorium and/or result in the formation of an insoluble intermetallic phase. The data obtained in this program show that the thorium solubility at 600°C (about 2000 wt ppm) is not affected by the presence of uranium and zirconium at concentrations of 2000 ppm, either singly or in combination. Similar results were obtained with ura- nium, plutonium, and thorium; solutions containing about 2000 ppm thorium and at least 2000 ppm uranium and plutonium have been produced. Lithium and lanthanum, in concentrations up to about 1000 ppm, had no detectable effect on the thorium solu- bility. Nickel was the only element encountered in t h i s work that had a marked effect.
The effect of nickel on the solubility of thorium in bismuth at 600°C was investigated in two experiments. The system was contained under an argon atmosphere in a mild steel crucible in experiment 5639 and in a molybdenum crucible in experiment LA-1. Initially, sufficient crystal-bar thorium was added to just saturate the bismuth at 600°C; lanthanum, at a concentration of about 1000 ppm, was also present in experiment LA-1. Then, small portions of nickel were added to the systems. After each addition, at least 4 hr was allowed for the attainment of equilibrium before a filtered sample of the liquid phase was taken for analysis. The results are shown in Fig. 22.8. The solid circles were obtained in experiment 5639 by back titration with
"F. J. Smith, Chemical Technology Division, unpublished data.
crystal-bar thorium. The data from these experiments can be expressed as a mole fraction solubility product,
K , ~ =xThxNi = 6.2 x io-' ,
over the range of concentrations investigated. This is the type of behavior expected if the Th/Ni atom ratio in the solid phase were 1. This appeared to be the case; by material balance calculations, the Th/Ni atom ratio in the solid phase was 0.90 to 0.99 throughout each experiment. No attempt was made to isolate and identify the solid phase. It could be ThNi (which would not be inconsistent with the reported12 Th-Ni phase diagram), or it could be a ternary bismuthide, ThNiBi,. The data indicate that a bismuth solution saturated with thorium at 600°C could accommodate up to about 100 ppm nickel before precipitation of a thorium- and nickel-containing solid would occur. It was also of interest to note that the lanthanum concentration in the liquid phase remained unchanged, even when the nickel concentration was 5000 ppm.
I'M. Hansen, Constitution of Binary Alloys, 2d ed, p. 1048, McGraw-Hill, New York, 1958.
ORNL-DWG 69-5998 NICKEL IN SOLUTION (ppm)
400 200 500 (000 5000 40-2
5
C
0
v EX? La-! (4000 pprn La - g 2
+ s!
E
2 5
r
- 2
E 5
J
a 2
3 t d 4 z
E
2
!o-~ I I I I I 1 1 1 1 1 I I I I I l l l l I I I111111 2 5 2 5 {o-~ 2 5 to-'
NICKEL IN SOLUTION (mole fraction)
Fig. 22.8. Mutual Solubility of Thorium and Nickel in Bismuth at 600°C.

* .
23. Engineering Development of Process Operations L. E. McNeese
23.1 ELECTROLYTIC CELL DEVELOPMENT
M. S. Lin L. E. McNeese
Electrolytic cells will be required for operation of reductive extraction systems in an MSBR fuel process- ing plant. The cell will be used to oxidize uranium or other materials in bismuth streams effluent from ex- traction contactors as well as for reducing lithium and thorium into flowing bismuth streams to prepare feed for the contactors. The concentrations of materials to be oxidized from the bismuth at the anode are low, so the current density would be limited by the rate at which these materials could be transported to the anode surface. The diffusion-limited current density for oxida- tion of uranium from bismuth at a uranium concentra- tion of 0.0016 mole fraction was estimated to be 0.15 amp/cm2 (based on uranium diffusivity in bismuth of 2.5 X lo-' cm2/sec,' diffusion layer thickness of 5 X lo-' cm, and bismuth volume of 21.3 cc/g-atom). A current density this low would require an anode area of 21.7 ft2 for the protactinium isolation system, an area much larger than desired. The area is decreased con- siderably by oxidizing bismuth, the major component present in the anode. Although this produces a corro- sive material, BiFj, it is more desirable than using very large anode areas. The BiF3 dissolves in the molten fluoride electrolyte, which is countercurrently con- tacted with the bismuth stream containing metals to be oxidized. The overall reaction thus is st i l l the oxidation of materials from the metal stream.
To date, two series of experiments have been carried out in two static cells made of quartz. another static cell made entirely of metal was also recently installed. Results of experiments with these cells will be dis- cussed.
'I. C. Hewn, H. E. Hootman, and L. Burris, Jr., Electm chem Technol. 3,240 (1965).
23.1.1 Quartz Static Cell Experiments
The quartz cell, shown in Fig. 23.1, consists of a flat- bottomed quartz tube (4 in. OD) with metal flanges. The bottom of the cell contains a quartz divider, which results in two compartments equal in size and about 3 in. deep. The compartments were filled with bismuth to within about 'I2 in. of the top of the divider to produce the electrodes with an exposed area of about 30 cm2 each. A 3.5-in. layer of molten salt (66-34 mole % LiF-BeF2) covered the electrodes and served as the electrolyte. Two molybdenum tubes contained within quartz sleeves were introduced from the top of the vessel through the molten salt and terminated near the bottom of the electrode compartments to serve as the electrode leads as well as gas sparge lines. Means for obtaining fdtered samples of salt or bismuth were pro- vided.
Prior to each series of experiments the bismuth was sparged with hydrogen at 70O0C for about 16 hr. About 1.8 kg of molten salt which had been previously puri- fied by hydrofluorination, hydrogen reduction, and fdtration was then introduced into the cell. Viewing slits were provided in the furnace to allow observation of the salt-bismuth interface in the vicinity of the quartz divider. Prior to transfer of molten salt to the cell, the bismuth surfaces were shiny, although a small amount of surface fdm on the bismuth was noted. After transfer of salt to the cell, the salt was colorless and quite transparent. A flow of argon cover gas was main- tained through the gas space above the salt, and a slight positive pressure was maintained in order to prevent air inleakage. The quartz cell is shown after installation in
had a maximum output of 250 amp. Both the cell cur- rent and the potential difference between the elec- trodes were recorded continuously.
During both series of experiments the voltage applied across the electrodes was increased incrementally from
Fig. 23.2. A 0 to 12 v dc power supply was used which s
(M;
s
288

U
682
i
I

290
Fig. 23.2. Experimental Electrolytic Installation.
t *
an initial value of 2.6 v in steps of about 0.6 v, and operation of the cell was observed. No gas sparging of the salt or the bismuth electrodes was used during the first series of experiments, but the cathode was sparged with argon during most of the second series of experi- ments, as will be discussed. The results can be sum- marized as follows:
1. The initial potential difference between the bis- muth electrodes was <0.05 v (below recorder sensi- tivity). The cell potential increased rapidly to 2 v after passage of 60 coulombs in 10 sec, to 2.1 v after 625 coulombs in 125 sec, and to 2.25 v after 9300 coulombs in 61 min. The cell potential remained at about 2.2 v thereafter. The potential was lowered by mixing the cathode by argon sparging; however, sparging the anode produced no change in cell potential.
2. The current-vs-voltage plot of the experiments (Fig. 23.3) suggests that there is essentially no limiting cur- rent in the range covered by the experiments. The slight decrease in cell resistance shown in one of the curves was due to the increase in cell temperature and is con-
sistent with values calculated from the published equa- tion' for specific conductivity of molten 2LiF-BeF2 as a function of temperature. The highest current density obtained was 4.5 amp/cm2 (4180 amp/ft2). Higher cur- rent densities would be expected as the applied potential is increased.
3. During both series of runs, formation of very finely divided dark material was noted at the anode. The ma- terial was observed to spread slowly throughout the salt during the first 10 min of operation with the first cell. Circulation of the salt during this period was slight and resulted from thermal convection. Although the salt re- mained opaque during the remaining cell operation, the salt was transparent after the cell had stood overnight, and only a small amount of dark material was noted at the salt-bismuth interface. During operation of the second cell, the salt immediately above the anode a p peared light brown after 10 sec of coulombs passed). At this point the
'J. W. Cooke, ORNGTM-2316, p. 14.
c
cell operation (60 anode and the salt
id*

291
5.0
4.0
3.0
2.5
0 I-
w (L
z 2.0
3 1.5
0.5
0
ORNL-DWG 69-6045
2 .
2 4 6 8 10 12 14 APPLIED VOLTAGE (V I
Fig. 23.3. Current-Voltage and Current-Density-Voltage Plot.
above it were stirred by an argon sparge; this resulted in dispersion of the material above the anode throughout the salt, which then appeared light brown. The forma- tion of black material at the anode continued for an additional 125 sec (625 additional coulombs). After standing overnight the salt was clear, with a small amount of black material in it. No further formation of black material was noted during several hours of cell operation which followed. During this time, salt circula- tion was promoted by an argon sparge in the cathode chamber.
4. Gas was evolved from the anode during the electro- lytic process, even at a current density as low as 0.15 amp/cm' . Mass spectrometric analysis of off-gas samples showed the gas to be SiF4. The SiF4 concentration in the samples increased as the cell current density was in- creased. The gas was produced on the anode side of the quartz divider which separated the bismuth anode and cathode and was produced only during or immediately after current passage. These observations strongly sug- gest that the gas evolution was the result of reaction of BiF3 produced at the anode with the quartz divider.
5. There was no evidence of fluorine evolution during most of the cell operation. Only after the cell had shorted internally (arcing was noted between the elec-
trodes) did the KI-starch solution (through which the cell off-gas gassed) become lightly tinted.
6. The bismuth concentrations in the salt (probably BiF3) increased with the number of coulombs passed through the cell, although the concentration was only 10 to 50% of that which would result if only BiF3 were produced and it all remained in the salt.
23.1.2 All-Metal Static Cell Experiment Although the initial experimental work on electrolytic
cell development utilized quartz as a convenient con- tainer material, this material will not be suitable for long-term usage. The most corrosive condition in a cell will be in the vicinity of anodic surfaces, where an oxidizing condition exists. Cathodic surfaces must resist attack by liquid bismuth, but the corrosion problem at this point is not considered severe. It is planned that all anodic surfaces other than liquid bismuth surfaces will be protected by a frozen salt layer. A small all-metal static cell has been installed for study of this method of operation.
The main body of the cells is a 6-in. sched 40 mild steel pipe 18 in. long with a flat, '4-in.-thick bottom. The cell body is the cathode container. The upper part of the cell is flanged, and the upper flange is electrically insulated from the cell body. The anode of the cell, shown in Fig. 23.4 before assembly, is a doublewalled fluid-cooled cup having an inside diameter of 1.75 in. (15.5 cm' gross electrode area) and an outside diameter of 2.75 in. The cup is suspended from the top flange by two '&-in. tubes, which serve as the coolant (nitrogen and water) inlet and outlet as well as the electrical con- nection to the anode. Provision was made for raising and lowering the anode cup. Viewing ports are provided on the top flange, and provision is made for sampling the salt or bismuth without introducing air into the sys- tem. The cell is shown after installation in Fig. 23.2.
The cell has been charged with 16.3 kg of bismuth treated with hydrogen at 70O0C for 16 hr and molten salt (4.5 kg of 66-34 mole % LiF-BeF2) which had been purified by hydrofluorination, hydrogen reduction, and filtration. The system will be tested initially for forma- tion of a frozen salt layer on the outer surfaces of the anode cup, and electrolysis experiments will follow.
23.2 REDUCTIVE EXTRACTION ENGINEERING STUDIES
B. A. Hannaford W. F. Schaffer, Jr.
L. E. McNeese H. D. Cochran, Jr.
E. L. Youngblood Equipment designed for semicontinuous engineering
experiments on reductive extraction was described in an

292
Fig. 23.4. Photograph of Anode Cup B s f m Assembly.
Fig. 23.5. Engineering Facility for Testing MoltenSalt-Molten-Metal Contactots.

earlier report? The contacting column is 0.82 in. ID by 2 ft long, packed with '& -in. right cifculair cylinders. The feed and catch tanks for the molten salt and bismuth hold about 20 liters each. The graphite crucible in the salt and metal treatment vessel holds about 50 liters. About 15 liters of each phase will be used during ex- perimentation. Installation of the equipment in Build- ing 3592 has been completed.
Figure 23.5, taken during installation, shows most of the major process components: A, salt and metal treat- ment vessel containing graphite crucible; B, concentric feed and catch tanks for the salt phase; C, concentric feed and catch tanks for the bismuth phase; D, head tank for monitoring salt phase feed pressure; E, salt and metal contacting column packed with '&-in. molybde- num cylinders; F. flowing stream samplers; and G, elec- trolytic cell connected in parallel to column. Also visible in the photograph are fNe tank samplers, salt and metal transfer lines, freeze valves, and one of the two fritted molybdenum filters. Except for the treatment vessel, which is of stainless steel, the equipment is constructed of mild steel.
Preliminary testing and degassing of the equipment has begun, charging of bismuth and salt (LiF-BeF2- ThF4, 7246- 12 mole %) will be completed shortly, and experiments should begin within six weeks. The fust ex- periments will be hydrodynamic studies in which the pressure drop across the column will be measured under various flow conditions. After we are confident in the operation of the system, about 0.3 mole % UF4 will be added to the salt phase. Mass transfer studies can then be performed by adding thorium as reductant to the metal phase. Mass transfer performance will be analyzed and correlated with hydrodynamic conditions in the column.
23.3 SIMULATED MOLTENSALT-LIQUID BISMUTH CONTACTOR STUDIES
J. S. Watson L. E. McNeese
Methods being considered for processing molten-salt breeder reactors require the use of devices for the con-
'tinuous countercurrent contact of molten salt with liquid bismuth. The hydrodynamic properties of such contactors are being studied at low temperatures in simulated systems using water and mercury rather than molten salt and liquid bismuth. Quantitative measure- ments have been made of flooding rates, pressure drop,
3MSR Program Semiann Rogr. Repf. dug 31.1968, ORNG 4344, p. 301.
293
L = length of column, V, = superficial slip velocity, X = holdup,
C, D = continuous- and dispersed-phase super- ficial velocities,
and dispersed phase (Hg) holdup. Quantitative informa- tion was also obtained on flow patterns and drop sizes (or interfacial area). Four different packing materials and one baffled cartridge have been studied in a 1-in.-ID column.
As noted in the previous semiannual report, drop be- havior and hence inter€acial area are dramatically af- fected by packing sizes. The '/8-in. Raschig rings caused the mercury to coalesce into streams with low interfacial area, while '&-in. solid cylindrical packing allowed the mercury to remain dispersed into small droplets with a large interfacial area. The more recent data continue to c o n f m this dependence of droplet behavior on packing size - mercury is dispersed into small drops by '&-in. Raschig rings but coalesced by '/s-in. solid cylindrical packing.
We have also observed a similar dependence of drop behavior upon total column throughput. With packed columns the effect of flow rate on drop size is rela- tively small and probably can be ignored in most cases. The effect, however, was dramatic with the baffled cartridge. Figure 23.6 shows a photograph of the baf- fled column with a mercury flow rate of 480 ml/min and a water rate of 200 ml/min. The mercury is well dispersed into small droplets. However, when the mer- cury rate was increased to 660 ml/min, the mercury coalesced essentially completely, as shown in Fig. 23.7.
Pressure drop and holdup data for a 2:ft length of the 1-in. column packed with '&-in. Raschig rings are shown in Figs. 23.8 and 23.9. These results are similar to all the data obtained with other packing materials. Pressure drop and holdup for larger packing sizes (where the mercury is well dispersed) may be related by the semiempirical equations
and
where
AP= pressure drop due to flow (e.g., total pressure drop across the column less the static head),

294
i
Fig. 23.6. Baffled Column with 480 4 m . h of Water.

295
Fig. 23.7. Baffled Column with 660 ml/min of Mercury and 200 ml/mh of Water.

296
- ORNL-OWG 69-5999 's 40
0,
5
d 2
S f
0 X
5 I
- 2 I 3
V v)
a a
0.5 W
3 v) v) W
a
a
u I
t 0.1
0.2
i 40 20 50 400 200 500 4000
C (ml/min)
Fig. 23.8. F'ressure Drop Across the 1-in. Mercury-Water Cdumn Packed with %-in. Roschig Rings.
ORNL-DWG69-6000 4
0.5
t E 0.2
2
0
LL a a a 0.1 7
0.05
0.02
0.04 ' I 40 20 50 400 200 500 4000
C (ml/min)
Fig. 23.9. Dispexsed Phase Holdup in the 1-in. Mercury-Water Cdumn Packed with ?&in. Raschig Ring.
Ap = density difference, k l , kz, k3 = constants.
Thus with three constants (kl , k2, and k3) the hydro- dynamic aspects (holdup, pressure drop, and, by impli- cation, flooding rates) of a dispersed-flow column can be .related. Unfortunately, only two of the four packing materials tested gave dispersed flow, and to adequately
evaluate any relationship between the hydrodynamic variables will require data from more packing materials. Since we are now also considering larger packing mate- rials for the processing system, a 2-in.-ID column and a larger mercury pump have been installed so that '/*-in. and possibly 'h-in. packing materials can be tested.
The equipment necessary to study back mixing in packed columns has been fabricated and assembled. Ordinary packed columns as well as special columns modified to reduce back mixing will be tested.
23.4 DESIGN OF A CONTINUOUS ELECTROLYTIC CELL TESTING SYSTEM
E. L. Nicholson M. S. Lin W. F. Schaffer '
L. E. McNeese
E. L. Youngblood
V
rn .
A system is being built to continuously circulate molten salt and bismuth through an electrolytic cell at 550 to 6OO0C (Fig. 23.10). The electrolytic cell con- tainment vessel will permit testing a variety of cell de- signs and has provisions for cooling, sampling, and visually observing the cell. Criteria for the cells are being developed based on tests of static cells that are under way. Tentatively, the cell will have anode and cathode areas of about 0.1 ft2 each and will be supplied with approximately 1500 amp at 10 to 20 v. Flows are to be up to 0.5 gpm of bismuth and 0.25 gpm of salt. The system external to the cell consists of a mixer- settler tank to equilibrate the salt and bismuth streams from the cell and gas lift pumps and gravity-head-type orifice flowmeters for return of the streams to the cell. Low-carbon steel will be used for most of the system in contact with salt or bismuth. The agitator shaft and impeller will be made of molybdenum, as will several of the transfer lines and the internal piping in the elec- trolytic cell containment vessel. Outlet nozzles on the mixer-settler vessel have been coated with vapor- deposited tungsten. Provisions have been made for inserting corrosion test coupons in the system.
Gas lifts were selected as the simplest method for pumping salt and bismuth. Gas lift performance data could not be found for high-density liquids such as bismuth, so tests were made on gas lift pumping of mercury. For a total lift height of 34 in., a lift tube diameter of 0.3 in., and a fractional submergence of 0.54, the maximum pumping rate was 0.26 gpm with a gas consumption of 4.0 std literdmin (1.3 std liters/min at operating temperature). Two lift tubes will be operated in parallel on the bismuth stream to get the desired capacity because a single large-diameter lift tube had excessive gas consumption. One small-
9
t
b,
t
t

ORNL-DWG 69-12981
297
SERVICES FOR ELECTROLYTIC CELL
Bi HEAD POT SALT HEAD POT
SAMPLER
ELECTROLYTIC C
ELECTROLYTIC CELL CONTAINMENT VESSEL
ARGON SUPPLY
GAS LIFT FOR Bi GAS LIFT FOR SALT
Fig. 23.10. Continuous Electrolytic cell Testing System.
diameter lift tube will be required for the salt stream. Flow regulation will be obtained by varying the gas flow to the lift. Entrainment and liquid surging was a problem in the gas lift disengagement head pot. A head pot with a baffled annulus was developed that elimi- nated the entrainment problem and dampened the surges in gas lift liquid discharge so that a quiet pool was maintained in the orifice meter compartment. Tests are under way to determine the required orifice sizes.
The vessels and equipment stand are being fabri- cated, and modifications to the: walk-in hood in Build- ing 3541, where the unit will be installed, are under way.
23.5 EXPERIMENTAL FACILITIES FOR REDUCTIVE EXTRACTION DEVELOPMENT WORK
E. L. Nicholson B. B. Klima E. L. Youngblood
A request for a directive is being prepared to obtain approval for modification of cell 2, Building 3019, so
that it can be used for engineering-scale reductive ex- traction experiments with protactinium or other alpha emitters. The cell is 19 X 20 X 27 f t high and will have three working levels which are independently ventilated and isolated from each other by air locks so that each level can function as an independent alpha laboratory. Alternatively, removable floor panels will permit instal- lation of large full-height experiments such as a demon- stration of reductive extraction using full-height packed columns. Conceptual engineering work is under way, so that the cost estimate can be prepared for the prelimi- nary project proposal that must accompany the direc- tive request.

24. Distillation of MSRE Fuel Carrier Salt J. R. Hightower B. A. Hannaford
The molten-salt still is presently being installed in the spare cell at the MSRE for demonstrating low-pressure, high-temperature distillation of the MSRE carrier salt. Tests with nonradioactive salt mixtures have shown' that the equipment is suitable for operation with the irradiated fuel carrier salt.
The nonradioactive tests suggested minor equipment chrtnges for operation at the -%RE. Since we had ex- perienced restrictions in the st i l l pot feed line and in the vacuum line from the receiver, we replaced all lines to ensure that no obstructions existed. Additional thermo- couples were installed on the feed line to the st i l l pot, on argon feed lines, and on off-gas lines to give better coverage of temperatures. Lines heated with Calrods were electrically insulated from the heater sheath to prevent the heated line from being accidentally placed in the electrical circuit in the event of a Calrod failure. The configuration of the feed line to the still pot was changed to minimize the length of line heated by the still pot heaters to temperatures near 1000°C. This change could reduce the rate of metal deposition below that seen in the nonradioactive experiments. Improved electrical insulation and shielding were added to the st i l l
' J. R. Hightower and L. E. McNeese, MSR Rogram Semiann Prop. Rept. Aug. 31,1968.0RNL-4344, p- 306.
H. D. Cochran L. E. McNeese
pot liquid level instrumentation to improve the perfor- mance of these instruments.
A new condensate sampler was designed and built. It is similar to equipment used to add 233U to the fuel drain tanks but has modifications to allow samples to be taken without disturbing operation of the still. The sampler is shown schematically in Fig. 24.1. Tfie sample capsules ( 10-g MSRE capsules) will be placed in holders on the turntable in the containment vessel prior to the experiment. At the end of the experiment the capsules will be withdrawn through the removal tube into a car- rier for analysis.
Presently, installation of the st i l l has been completed except for connecting the transfer line from the fuel storage tank to the feed tank and attaching the sampler to the sample line. A fdter will be installed in the trans- fer line to avoid the transfer of solid material. Before completing these items, we introduced about 16 liters of nonradioactive salt into the system to test the liquid probes in the st i l l pot and to ensure that all installed components were working properly. We heated the st i l l pot to 900°C, pumped the condenser down to 0.1-1 mm Hg, and distilled about 2 liters of the test salt. All parts of the system performed satisfactorily. The test salt was then discharged from the still. Connection of the transfer line and attachment of the sampler are under way.
a
B
c 8
298

299
SAMPLE
ORNL- DWG 69- 6004
n REMOVAL H
TUBE REEL ASSEMBLY K,,
CONTAINMENT VESSEL -
TURNTABLE FOR SAMPLE ,CAPSULES
-GRAPHITE SAMPLER
SHIELD
CONCRETE ROOF PLUG
ISOLATION VALVE
CONDENSER
Fig. 24.1. Condensate Sampler for MSRE Distillation Experiment.

e
c
6

/-'
301
OAK RIDGE NATIONAL LABORATORY
MOLTEN-SALT REACTOR PROGRAM
. c
I - l l
YLC YLC YLC MAC YLC
YLC YLC YLC
Y C YLC YLC
YLC I C YLC YLC
YLC YLC YLC mc
YLC Y C Y C Y C M C YLC YLC YLC
YLC YLC
YLC YLC WAC YLC
YLC Y C YLC YLC
YLC YIC YLC
YLC YLC Y IC YLC YLC YLC
-
-
C C C C C
E C
C C C
E c - - I
- C C
c C C C
C c C
c c c c c -
1. H. WIYW R 1. L. CROW-EY R 1. 1. tW7.REm R P. K W A M N R 1. L. MOSN R A I. KRMOWM R
1. ARNWNt I R t. M E 1 R J. ?.CUI I L J. DAWS R 1. H. OuXIom I A L W O I R E. ". Wlml R 1. G HILL R c c H u m R
K 1. YCLER R u. E. R u l y I R L WyM JR R 1. L. STEU R
1. E. l D L I E R
J. c m n w R
a 1. UES R
oc CT
c E. W m P 1. L U T E C C 1. COLLMS R 1. 1. fURLDlO R t c HlSP R K A y d U N R
R
CT n CT n n n
t. J. wm J. r.Lw
r. r. U Y M W I P E. c. SOKuLm. 1. E. nrY1"
n n n CT ET n CT CT n
n n n n CT
0
L L OYLNIER LLWEUP L A K E D L A K Y m
C ~ O I ~ ~ R O r. e. LYW J. L ENGU R
c K O A B W R A H M Z E U R L C S T E f f V R
A A WATTS R
Y RIa!ARmxl R L H. UEI11EC.. I
A t. OILLEU I L. *. P W I A L OWCART n
mwen tnoctssnc R L L INDUJEF CT
I n n I y u T l M m(TIOL1
L J. ITTO* 1.1
c a YARTlW IM U( Ut J.L. REDFORD
L 1. TUCKER A U B C L L Ut C t K l R F K O ut
uuma mlynm D t v t L o i
J emir Ac
R E S u m Y D DIVELOCUD(
A L YEYEI R f. UPCE
J. Y O L E 1. K HbNDLW. 0. L. Y U H l W 1. L W E L L E C A L TRAVAOLINP J. 1. YWNV
c n wvo
U U T I S
L. 1. CORBlN. 0 =DOEM. f. K. HAEaER C E. L Y V P. r. moyuDH.
Y A OREDIG. K 1. BRONSTElN* A L DWRKIN. G P. W T W
1

't
b
a
C
u

ORNL-4396 UC-80 - Reactor Technology
IN TERNA L DISTRIBUTION
I
~
i i * I
I
1. R.K.Adams 2. G. M. Adamson 3. H.I.Adler 4. R. G.Affel 5. J. L. Anderson 6. R. F. Apple 7. C. F. Baes 8. J.M.Baker 9. S. J. Ball
10. C. E. Bamberger 11. C. J. Barton 12. H. F. Bauman 13. S.E.Beall 14. R. L. Beatty 15. M. J. Bell 16. M.Bender 17. C. E. Bettis 18. E. S. Bettis 19. D. S. Billington 20. R. E. Blanco 21. F. F. Blankenship 22. J. 0. Blomeke 23. R. Blumberg 24. A.L.Boch 25. E. G. Bohlmann 26. C. J. Borkowski 27. G.E.Boyd 28. J. Braunstein 29. M. A. Bredig 30. E. J. Breeding
46. H. R. Bronstein 47. W. E. Browning
49. G. D. Brunton 50. G. H. Burger 51. D. A. Canonico 52. S.Cantor 53. D. W. Cardwell 54. W.H.Carr 55. W. L. Carter 56. G. I. Cathers 57. J. E. Caton 58. 0. B. Cavin 59. A. Cepolino
3 1-45. R. B. Briggs
48. F.R.BNCe
60. J. M. Chandler 61. F. H. Clark 62. W.R.Cobb 63. H. E. Cochran 64. C. W. Collins 65. E. L. Compere 66. J. A. Conlin 67. K.V.Cook 68. W.H.Cook 69. J. W. Cooke 70. L. T. Corbin 71. W. B. Cottrell 72. B.Cox 73. G. A. Cristy 74. S. J. Cromer (K-25) 75. J. L. Crowley 76. F. L. Culler 77. D. R. Cuneo 78. J. M. Dale 79. D. G. Davis 80. W.W.Davis 81. R. J. DeBakker 82. J. H. DeVan 83. S. J. Ditto 84. R. G. Donnelly 85. I. T. Dudley 86. N. E. Dunwoody
87-88. A. S. Dworkin 89. D. A. Dyslin
90-91. W. P. Eatherly 92. J. R. Engel 93. E. P. Epler 94. W. K. Ergen 95. D. E. Ferguson 96. L. M. Ferris 97. A. P. Fraas 98. J. K. Franzreb 99. H. A. Friedman
100. J. H Frye, Jr. 101. W. K. Furlong 102. C.H. Gabbard 103. W.R.Gal1 104. R. B. Gallaher 105. R. E. Gehlbach 106. J. H. Gibbons
303

304
107. R. G. GiUiland 108. L. 0. Gilpatrick 109. W. R. Grimes 110. A. G. Grindell 11 1. R. W. Gunkel 112. R. H. Guymon 113. J. P. Hammond 114. R. P. Hammond 115. B. A. Hannaford 116. P. H. Harley 117. D. G. Harman 118. W.O.Harms 119. C. S. H a r d 120. P. N. Haubenreich 121. F. A. Heddleson 122. R. E. Helms 123. P. G. Herndon 124. D.N.Hess 125. R. F. Hibbs 126. J. R. Hightower 127. M. R. Hill 128. E.C.Hise 129. H. W. Hoffman 130. D. K. Holmes 131. V. D. Holt 132. P.P.Holz 133. R. W. Horton 134. A. S. Householder 135. A. Houtzeel 136. T. L. Hudson 137. W. R. Huntley 138. H. Jnouye 139. W. H. Jordan 149. P. R. Kasten 14i. R. J. Ked 142. M. T. Kelley 14b. M. J. Kelly 144. C. R. Kennedy 145. T. W. Kerlin 146. H. T. Kerr 147. J. J. Keyes 148. D. V. Kiplinger 1451. S. S. Kirslis 15& D. J. KnovJles 151. J. W.Koger 152. R. B. Korsmeyer 153. A. I. Krakoviak 154. T. S. Kress 155. J. W. Krewson 156. C.E.Lamb
I 157. J. A. Lane 158. E. J. Lawrence 159. J. J. Lawrence 160. M.S.Lin 161. T. A. Lincoln 162. R. B. Lindauer 163. A. P. Litman 164. J. L. Liverman 165. R. S. Livingston 166. G. H. Llewellyn 167. E.L.Long 168. A. L. Lotts 169. M. I. Lundin 170. R. N. Lyon 171. R. L. Macklin 172. H. G. MacPherson 173. R. E. MacPherson 174. F. C. Maienschein 175. J. C. Mailen 176. D. L. Manning 177. C. D. Martin 178. W. R. Martin 179. H. V. Mateer 18Q. C. E. Mathews 181. T. H. Mauney 182. R. W. McClung 183. H. E. McCoy 184. D. L. McElroy 185. C. K. McClothIan 186. C. J. McHargue 187. H. A. McLain 188. L. E. McNeese 189. J. R. McWherter 190. H. J. Metz 191. A. S. Meyer 192. E. C. Miller 193. C. A. Mills 194. R. L. Minue 195. W. R. Mixon 196. R. L. Moore 197. K. 2. Morgan 198. D. M. Moulton 199. J. C. Moyers 200. T. R. Mueller 201. H. A. Nelms 202. H. H. Nichol 203. J. P. Nichols 204. E. L. Nicholson
J
u
c \ .
a
i

305
205. L. C. Oakes 206. W. R. Osborn
207-210. R. B. Parker 21 1. L. F. Parsly 212. P. Patriarca 213. H. R. Payne 214. A. M. Perry 215. T. W. Pickel 216. H. B. Piper 217. B. E. Prince 218. H. P. Raaen 219. G. L. Ragan 220. J. L. Redford 221. M. Richardson 222. G. D. Robbins 223. R. C. Robertson 224. W. C. Robinson 225. K. A. Romberger
226-400. M. W. Rosenthal 401. R. C. Ross 402. H. C. Savage 403. A. W. Savolainen 404. W. F. Schaffer 405. C. E. Schilling 406. Dunlap Scott 407. J. L. Scott 408. H. E. Seagren 409. C. E. Sessions 410. J. H. Shaffer 41 1. E. D. Shipley 412. W. H. Sides 413. M. J. Skinner 414. G. M. Slaughter 415. A.N.Smith 416. F. J. Smith 417. G.P.Smith 418. 0. L. Smith 419. P.G.Smith 420. A. H. Snell 421. W. F. Spencer 422. I. Spiewak
423. R. C. Steffy 424. C. E. Stevenson 425. W. C. Stoddart 426. H. H. Stone 427. R. A. Strehlow 428. D. A. Sundberg 429. J. R. Tallackson 430. E. H. Taylor 431. W. Terry
432-433. R. E. Thoma 434. P. F. Thomason 435. L. M. Toth 436. D. B. Trauger 437. R. W. Tucker 438. W. C. Ulrich 439. W. E. Unger 440. D.C.Watkin 441. G. M. Watson 442. J. S. Watson 443. H. L. Watts 444. C. F. Weaver 445. B. H. Webster 446. A. M. Weinberg 447. J. R. Weir 448. W. J. Werner 449. K. W. West 450. M. E. Whatley 451. J.C.White 452. R. P. Wichner 453. L. V. Wilson 454. G. J. Young 455. H. C. Young 456. J. P. Young 457. E. L. Youngblood 458. F. C. Zapp 459. Biology Library
460-462. ORNL - Y-12 Technical Library
463-464. Central Research Library 465-619. Laboratory Records Department
620. Laboratory Records, ORNL R.C.
Document Reference Section

306
EXTERNAL DISTRIBUTION bi
I I
I 1 648-
621. W. 0. Allen, Atomics International, P.O. Box 309, Canoga Park, California 91304 a
60439 1
622. A. Amorosi, LMFBR Program Office, Argonne National Laboratory, Argonne, Illinois
623. J. G. Asquith, Atomics International, P.O. Box 309, Canoga Park, California 91304
1
a 624. David Bendaniel, General Electric Co., R&D. Center, Schenectady, N.Y. 625. J. C. Bowman, Union Carbide Technical Center, 12900 Snow Road, Parma, Ohio 44130 626. G. D. Brady, Materials Systems Division, UCC, Kokomo, Indiana 46901 627. Paul Cohen, Westinghouse Electric Corp., P.O. Box 158, Madison, Pennsylvania 15663 628. D. F. Cope, Atomic Energy Commission, RDT Site Office (ORNL) 629. J. W. Crawford, Atomic Energy Commission, Washington 20545 630. M. W. Croft, Babcock and Wilcox Company, P.O. Box 1260, Lynchburg, Virginia 24505 631. D. A. Douglas, Materials Systems Division, UCC, Kokomo, Indiana 46901 632. H. L. Falkenberry, Tennessee Valley Authority, 303 Power Building, Chattanooga, Tenn. 37401 633. C. W. Fay, Wisconsin Michigan Power Company, 231 W. Michigan Street, Milwaukee,
634. A. Giambusso, Atomic Energy Commission, Washington 20545 635. Gerald Golden, Argonne National Laboratory, 9700 S. Cass Avenue, Argonne, Illinois 60439 636. W. W. Grigorieff, Assistant to the Executive Director, Oak Ridge Associated Universities 637. J. T. Kehoe, Bums and Roe, Inc., 700 Kinderkamach, Oradell, New Jersey 07649 638. E. E. Kintner, US. Atomic Energy Commission, Washington, D.C. 639. P. M. Krishner, Pioneer Service and Engineering, 400 W. Madison St. Chicago, Illinois 60606 640. J. Ladesich, Southern California Edison Co., P.O. Box 35 1, Los Angeles, California 90053 641. L. W. Lang, Douglas United Nuclear, 703 Bldg., Richland, Washington 99352 642. R. A. Langley, Bechtel Corp., 50 Beale St., San Francisco, California 941 19 643. W. J. Larkin, Atomic Energy Commission, O R 0 644. R. A. Lorenzini, Foster Wheeler, 110 S. Orange, Livingston, N.J. 07039 645. W. D. Manly, Material Systems Division, UCC, 270 Park Avenue, New York, New York 10017 646. J. P. Mays, Great Lakes Carbon Co., 299 Park Avenue, New York, New York 10017 647. W. B. McDonald, Battelle-Pacific Northwest Laboratory, Hanford, Washington 99352
650. W. J. Mordarski, Nuclear Development, Combustion Engineering, Windsor, Connecticut 65 1. Sidney Parry, Great Lakes Carbon, P.O. Box 667, Niagara Falls, New York 14302 652. G. J. Petretic, Atomic Energy Commission, Washington 20545 653. A. J. Pressesky, U.S. Atomic Energy Commission, Washington, D.C. 654. D. J. Rose, Department of Nuclear Engineering, Room 24-207, Massachusetts Institute
655. M. A. Rosen, Atomic Energy Commission, Washington 20545 656. H. M. Roth, Atomic Energy Commission, OR0 657. R. W. Schmitt, General Electric Co., Schenectady, New York 12301 658. R. N. Scroggins, US. Atomic Energy Commission, Washington, D.C. 659. M. Shaw, Atomic Energy Commission, Washington 20545 660. Rem0 Silvestrini, United Nuclear Corporation, Grasslands Road, Elmsford, New York
661. E. E. Sinclair, Atomic Energy Commission, Washington 20545 662. W. L. Smalley, Atomic Energy Commission, OR0 663. T. M. Snyder, General Electric Co., 175 Curtner Ave., San Jose, California 95103 664. L. D. Stoughton, UCC, P.O. Box 500, Lawrenceburg, Tennessee 38464 665. Philip T. Stroup, Alcoa, P.O. Box 772, New Kensington, Pennsylvania 666. J. A. Swartout, UCC, 270 Park Avenue, New York, New York 10017
Wisconsin 53201
-649. T. W. McIntosh, Atomic Energy commission, Washington 20542
of Technology, Cambridge, Massachusetts 02139
10523
,
e iL

307
667. Richard Tait, Poco Graphite, P.O. Box 1524, Garland, Texas 75040 668. D. R. Thomas, Commonwealth Associates, Inc., 209 E. Washington Ave., Jackson,
669. M. Tsou, General Motors, 12 Mile and Mound Roads, Warren, Michigan 48089 670. J. W. Ullmann, UCC, P.O. Box 278, Tarrytown, New York 10591 671. C. H. Waugaman, Tennessee Valley Authority, 303 Power Building, Chattanooga, Tenn.
672. D. B. Weaver, Tennessee Valley Authority, New Sprankle Building, Knoxville, Tennessee 673. G. 0. Wessenauer, Tennessee Valley Authority, Chattanooga, Tennessee 37401 674. M. J. Whitman, Atomic Energy Commission, Washington 20545 675. H. A. Wilber, Power Reactor Development Company, 191 1 First Street, Detroit Michigan 676. James H. Wright, Westinghouse Electric, P.O. Box 355, Pittsburgh, Pennsylvania 15230 677. A. Goldman, Union Carbide Corporation, New York, N.Y. 678. J. C. Robinson, Dept. of Nuclear Engineering, University of Tennessee Knoxville,
679. D. E. Erb, Battelle Memorial Institute, 505 King Ave., Columbus, Ohio 43201 680. W. H. Danker, Jr., Westinghouse Electric Corp. P.O. Box 19218, Tampa, Florida 33616
681-682. Laboratory and University Division, AEC, OR0 683-898. Given distribution as shown in TID-4500 under Reactor Technology category (25 copies -
Michigan 49201
37401
Tennessee
CFSTI)