original research atmospheric dry deposition to natural ... dry.pdf · atmospheric dry deposition...
TRANSCRIPT

Introduction
Particulate matter in the atmosphere may undergo many different aerodynamic processes, such as
atmospheric dispersion, dry deposition and wet deposition [1]. Dry deposition is an extremely important process via which atmospheric trace chemicals are transferred by motion to the earth’s surface [2]. In addition, it is an essential mechanism for removing pollutants from the atmosphere in the absence of precipitation [3]. In dry deposition, particulates are
Pol. J. Environ. Stud. Vol. 29, No. 2 (2020), 1399-1410
Original Research
Atmospheric Dry Deposition to Natural Water of Wetland in Suburban Beijing
Yu Wang1, Lichun Mo2, Ling Cong1, Jiexiu Zhai1, Wenmei Ma1, Zhenming Zhang1*
1School of Nature Conservation, Beijing Forestry University, Beijing 100083, China2School of Economies & Management, Beijing Forestry University
Received: 10 December 2018Accepted: 12 May 2019
Abstract
In recent years, with the development of industrialization and urbanization, ecological environment problems have been paid more attention in China, especially in atmospheric environments. Wetlands play a significant role in removing pollutants from the atmosphere via dry deposition. However, it is unrealistic for some places to carry out field collections. In order to seek a feasible and credible way to estimate the dry deposition of wetland, a particle dry deposition model for natural water was used to calculate the atmospheric dry deposition on the Cuihu Wetland of Beijing on the basis of the data of concentrations of particles, wind speed, temperature, and relative humidity. In addition, the atmospheric dry deposition fluxes and deposition velocities were simultaneously measured using a knife-edge surrogate surface, which has a sharp leading edge. The observed and modeled values were compared.
Results shows that SO42−, NO3
−, NH4+ and Cl− were the major components of water-soluble ions in
the atmosphere. The mass concentration ratio of NO3−/SO4
2− shows that stationary source emissions are more important than vehicle emissions because of the current industrial use of high-sulfur coal during daytime in suburban Beijing. The ratios of the modeled/observed fluxes during daytime and nighttime were 1.38 and 3.47, respectively. The corresponding values during the normal, dry, and wet periods were 1.93, 2.47, and 2.36. The average ratio of the modeled/observed fluxes was 2.32. Thus, it is crucial to further improve both the laboratory and field measurements and analytical methods for the particle deposition to narrow the current uncertainty in the estimates of atmospheric dry deposition. In addition, further studies should be carried out to modify the model to extend its use for the evaluation of dry deposition on the wetlands of Beijing.
Keywords: dry deposition, natural water, wetland, suburban Beijing
*e-mail: [email protected]
DOI: 10.15244/pjoes/109303 ONLINE PUBLICATION DATE: 2019-10-30

Wang Y., et al.1400
transferred to a terrestrial surface with no significant interaction with atmospheric moisture [4].
Wetlands considerably affect the improvement of air quality. A number of studies have reported the contribution of wetlands toward the reduction of air pollution. The results indicate that wetlands increase the relative humidity, thereby decreasing the concentration of particulates in the atmosphere [5]. Previously, the dry deposition of particulate matter on different surfaces in Beijing Olympic Park has been examined, and the modeled and measured values revealed that the lowest and highest particulate matter concentrations are observed during the wet and dry periods, respectively [6]. Despite the importance of dry deposition on wetlands, extremely few studies have reported the effect of the dry deposition fluxes of the major anions and cations in the atmospheric particles to natural water of wetlands in Beijing. It is crucial to examine the effects of the particulate matter deposition on wetlands. Hence, the accumulation of dry particulate matter deposited on wetlands should be thoroughly investigated. Cuihu wetlands play an important role in the ecologically beneficial environmental construction in Beijing. Therefore, Cuihu wetlands are selected, and the concentrations of water-soluble ions and dry deposition amounts of different ions during different periods within a year are measured.
Atmospheric particles constitute a mixture of small particles and liquid droplets suspended in the atmosphere, which can affect air quality and atmospheric visibility [7]. The dry deposition process involves a close interaction between the atmosphere and deposition
surface. Previous studies have reported that deposition may depend on particle size, shape, roughness, and collection surface [8-10]. In addition, meteorology plays an important role in dry deposition [11, 12]. A number of studies have investigated the process of dry deposition using various approaches, including the use of surrogate surfaces, plus micrometeorological, eddy accumulation, and gradient methods [13, 14]. The surrogate surface method can provide a relatively accurate value for the flux of dry-deposited atmospheric particles, and the direct measurement of dry deposition is becoming increasingly popular [15]. In this study, dry deposition samples were collected on a water surface using a smooth surface. Although the deposition rate has been measured by numerous methods, the measurement of the dry deposition of air pollution continues to be a challenge as it is unrealistic for some places to carry out field collection [16]. Thus far, parameter methods to laboratory chamber methods have been employed to measure the dry deposition flux of atmospheric particles [17]. Typically, dry deposition is characterized by a deposition velocity, which is defined as the flux of different species to the surface divided by the concentration at the reference height [18]. In addition, several dry deposition models have been reported in the past few years [2], and parameter methods have been developed and extensively verified. In this study, a crude model is used to estimate the dry deposition flux and deposition velocity for natural water [19]. The observed and modeled values were compared.
Fig. 1. Location of the experimental site.
Atmospheric Dry Deposition to Natural... 1401
Material and Methods
Study Area
The study was carried out at Cuihu Wetland Park (116°19′E, 40°10′N, an area of 1.57 km2, of which approximately 0.09 km2 is water surface), which is the only approved national urban wetland park in Beijing, located in Shangzhuang Reservoir in the Haidian District of Beijing. It is managed by the Beijing Municipal Bureau of Landscape and Forestry, and it is 30 km from the Beijing city center.
The park has a warm-temperate, semi-humid continental monsoon climate with four distinct seasons. It experiences dry, strong winds in addition to dust in spring (March-June). The climate is characterized by adequate rainfall, and a stable hot weather is observed in the summer (June-September). The autumn (September-December) is cool, and the weather is sunny, while it experiences a dry, cold winter. Fig. 1 shows the location of the park.
Sample Collection
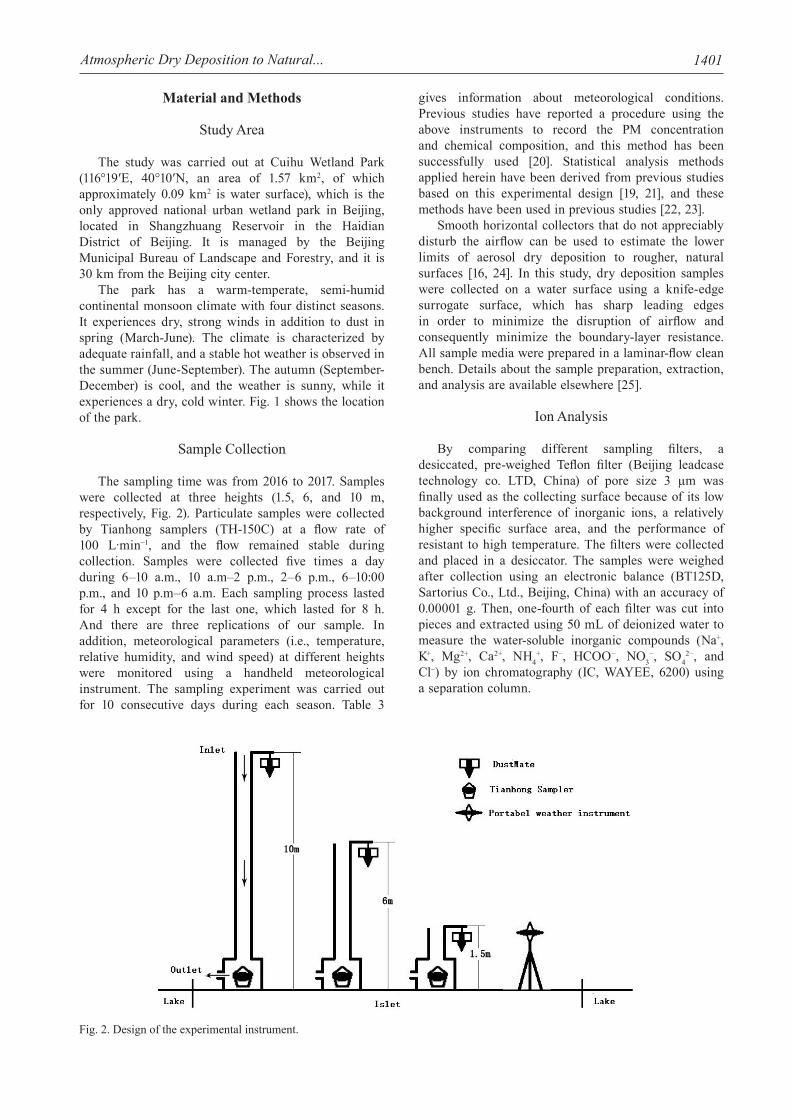
The sampling time was from 2016 to 2017. Samples were collected at three heights (1.5, 6, and 10 m, respectively, Fig. 2). Particulate samples were collected by Tianhong samplers (TH-150C) at a flow rate of 100 L·min−1, and the flow remained stable during collection. Samples were collected five times a day during 6–10 a.m., 10 a.m–2 p.m., 2–6 p.m., 6–10:00 p.m., and 10 p.m–6 a.m. Each sampling process lasted for 4 h except for the last one, which lasted for 8 h. And there are three replications of our sample. In addition, meteorological parameters (i.e., temperature, relative humidity, and wind speed) at different heights were monitored using a handheld meteorological instrument. The sampling experiment was carried out for 10 consecutive days during each season. Table 3
gives information about meteorological conditions. Previous studies have reported a procedure using the above instruments to record the PM concentration and chemical composition, and this method has been successfully used [20]. Statistical analysis methods applied herein have been derived from previous studies based on this experimental design [19, 21], and these methods have been used in previous studies [22, 23].
Smooth horizontal collectors that do not appreciably disturb the airflow can be used to estimate the lower limits of aerosol dry deposition to rougher, natural surfaces [16, 24]. In this study, dry deposition samples were collected on a water surface using a knife-edge surrogate surface, which has sharp leading edges in order to minimize the disruption of airflow and consequently minimize the boundary-layer resistance. All sample media were prepared in a laminar-flow clean bench. Details about the sample preparation, extraction, and analysis are available elsewhere [25].
Ion Analysis
By comparing different sampling filters, a desiccated, pre-weighed Teflon filter (Beijing leadcase technology co. LTD, China) of pore size 3 μm was finally used as the collecting surface because of its low background interference of inorganic ions, a relatively higher specific surface area, and the performance of resistant to high temperature. The filters were collected and placed in a desiccator. The samples were weighed after collection using an electronic balance (BT125D, Sartorius Co., Ltd., Beijing, China) with an accuracy of 0.00001 g. Then, one-fourth of each filter was cut into pieces and extracted using 50 mL of deionized water to measure the water-soluble inorganic compounds (Na+, K+, Mg2+, Ca2+, NH4
+, F−, HCOO−, NO3−, SO4
2−, and Cl−) by ion chromatography (IC, WAYEE, 6200) using a separation column.
Fig. 2. Design of the experimental instrument.

Wang Y., et al.1402
Data Analysis
In this study, a particle deposition model for particles deposited on natural water was used to calculate the deposition velocity Vx, which can be defined as follows [19, 21]:
(1)
…where Vg represents the gravitational settling velocity, VA represents the total transfer velocity in the turbulent layer, and VB represents the total transfer velocity in the deposition layer. These parameters can be calculated as follows:
(2)
(3)
(4)
…where Fc is the Cunningham correction factor, Pd is particulate matter density, dp is particulate matter diameter, and μα is the dynamic viscosity of air, which can be expressed as
(5)
…where μ0 is the reference coefficient of viscosity, T represents temperature and T0 is the reference temperature. Under normal circumstances, the μa at 0ºC is 17.1. VA’ is the transfer velocity without gravity in the turbulent layer, and VB’ is the deposition velocity without the effect of gravity in the deposition layer. These parameters can be expressed as follows:
(6)
(7)
(8)
…where λ is the mean free path of air (65 nm), k = 0.4, α is a constant (103cm·s−1/ (1 g·cm−2·s−1)), m is the water evaporation rate, Cd is the drag coefficient, Cd = [(1.3±0.3) × 10−3], Sc is the Schmidt number, and St is the Stokes number, which can be calculated as
(9)
(10)
(11)
…where P is the saturated vapor pressure, ρ is the liquid density, μ is the molar mass of water, R is a constant, and R = 8.31J (molK), dd represents the dimension of the vegetation element for wetlands; typically, (dd = 1) [26] and tp represent the particulate matter relaxation time, which can be expressed as
(12)
Results and Discussion
Atmospheric Concentrations of Water-Soluble Ions
According to changes in the water amount in the Cuihu wetlands, the entire year was divided into three periods: dry (winter), normal-water (spring and autumn), and wet (summer). Table 1 summarizes the average atmospheric concentrations of water-soluble ions during different periods in addition to those recorded during daytime and nighttime.
The concentration of SO42− is highest among all
of the water-soluble ions during different periods. Seasonally, the highest and lowest SO4
2− concentrations were observed during the dry and wet periods, respectively. This can be explained by the increasing concentration of sulfur dioxide in winter because of the burning of coal fuel. The mass concentration of NO3
− ranged from 3.19 to 8.11 μg/m3, and its highest value shows in the normal-water period. Table 3 shows the average meteorological data during sample period. Various studies have shown that temperature is one of the most important parameters determining ammonia concentration in Beijing. In this study, the main wind blew from SE and NE during the normal-water period, and there are large areas of farmland to the north and south of the study site. In addition, the normal-water period is the season for sowing and fertilizing. Therefore, the temperature-related emission from the fertilizer may be one of the main reasons [27, 28]. Cl− is another abundant ion in the atmosphere and shows obvious seasonal variation, whereas the concentrations during daytime and nighttime have no obvious changes. The highest value of Cl− shows in winter, which is due to the excessive discharge from coal burning for heating [29]. Fig. 3 shows the proportion of various water-soluble ions in the atmosphere. Different ionic species exhibited distinct characteristics during different periods. The total proportions of SO4
2−, NO3−, NH4
+, and Cl− during

Atmospheric Dry Deposition to Natural... 1403
different periods along with daytime and nighttime were 75.81%, 85.5%, 65.67%, 76.27%, and 79.3%, respectively. Previous research indicates that sulfate, nitrate and ammonium are the major components [30, 31], which is in good agreement with our results. In conclusion, SO4
2−, NO3−, NH4+, and Cl− were the major
components of water-soluble ions in the atmosphere of wetland in suburban Beijing.
The mass concentration ratio of NO3−/SO4
2− has been used as an indicator for the relative importance of mobile versus stationary sources of sulfur and nitrogen in the atmosphere [32, 33]. Researchers have
attributed high NO3−/SO4
2− mass concentration ratios to the predominance of the mobile source over the stationary source of pollutants. The seasonal variation of NO3
−/SO42− shown in Fig. 4 ranges from 0.02 to 2.11
(mean = 0.33, SD = 0.37), and this result is smaller than the value 0.6 to 4.3 in urban Beijing [27]. The highest value shows in normal-water period, also observed by Sun et al. [34]. This may be attributable to a higher concentration of nitrogen and meteorological factors. House heating starts in the middle of November in Beijing. Residential coal burning is the primary driver of overall Beijing emissions in winter [35]. Therefore,
Table 1. Average atmospheric concentrations of water-soluble ions during different period along with daytime and nighttime values in the wetland (μg/m3).
Species Normal-water period Dry period Wet periods Daytime Nighttime
F- 0.09±0.03 0.36±0.12 0.09±0.02 0.17±0.14 0.17±0.17
HCOO- 3.87±0.60 2.03±1.13 2.16±0.54 2.74±1.22 2.20±1.30
Cl- 4.01±0.44 9.24±2.88 2.50±0.26 5.06±3.39 5.32±3.73
NO3- 8.11±2.91 5.46±2.07 3.19±2.59 5.35±3.18 6.05±3.80
SO42- 21.91±7.13 26.18±2.58 14.18±5.08 20.74±7.15 18.67±8.64
Na+ 2.44±0.38 2.39±2.96 4.90±0.61 3.43±2.03 2.80±2.35
NH4+ 4.22±1.65 2.17±1.44 0.61±0.74 2.29±1.99 1.98±2.24
Mg2+ 0.62±0.13 0.28±0.11 0.30±0.07 0.40±0.19 0.35±0.18
Ca2+ 3.50±0.71 1.28±1.09 1.30±0.29 2.08±1.31 1.51±1.08
K+ 1.62±0.50 0.97±1.07 1.95±0.33 1.57±0.78 1.33±0.89
Fig. 3. Proportion of water-soluble ions in the atmosphere.

Wang Y., et al.1404
higher SO2 emissions because of the increase in coal
burning should be a major reason for the relatively low value of NO3
−/SO42− in a dry period. The annual report
on Beijing’s transportation development of 2017 (www.bjtrc.org.cn) shows that the daily traffic flow in Beijing’s sixth ring road is about 10000 and the average daily traffic flow of other ring roads in the city is about 25000. The Cuihu wetland is 30 km from the Beijing city center and is located near the sixth ring road of Beijing. In addition, there are only a few country highways around the study sites. Thus, a low number of vehicles may contribute to the low mass concentration ratio of NO3
−/SO42−. As for daytime and nighttime, the
difference may be due to photochemical oxidation [36, 37]. The low value during daytime suggests that stationary source emissions are more important than vehicle emissions in the area because of the current
industrial use of high-sulfur coal and relatively small number of cars in the suburban areas of Beijing. During daytime, relatively high temperature, relative humidity, and radiation were observed, which were favorable for the formation of SO4
2−. The increment of solar radiation and temperature lead to the increased oxidation rate of sulfur dioxide to sulfuric acid. Hence, the low value of ratio of NO3
−/SO42− observed during daytime is possibly
related to the above-mentioned reason [38].
Dry Deposition Fluxes and Deposition Velocities of Water-Soluble Ions in Wetlands
Variation between Daytime and Nighttime
Table 2 summarizes the observed and calculated average dry deposition fluxes of the major water-soluble
Fig. 4. Variations of NO3-/SO4
2- during different times (all the samples were divided into five different periods; average values are also shown in the figure).
Table 2. Observed and calculated average dry deposition fluxes of major water-soluble ions during daytime and nighttime.
PeriodFlux(mg·m-2d-1)
Daytime Nighttime
Species OV±SD CD OV±SD CD
F- 0.06±0.09 0.02 0.33±0.41 0.01
HCOO- 0.50±0.90 0.45 3.99±6.08 1.20
Cl- 1.09±1.15 1.12 4.26±3.76 10.34
NO3- 1.02±1.33 1.51 0.53±0.77 13.92
SO42- 5.21±8.74 19.82 9.98±8.22 32.97
Na+ 0.87±1.81 0.53 0.88±0.93 1.10
NH4+ 0.44±0.83 0.58 5.55±6.33 2.80
Mg2+ 0.12±0.13 0.04 0.18±0.24 0.05
Ca2+ 0.68±0.73 0.24 2.06±2.83 0.53
K+ 0.33±0.45 1.19 1.75±2.32 0.21
OV: observed value; SD: standard deviation; CD: calculated value.

Atmospheric Dry Deposition to Natural... 1405
ions during daytime and nighttime. Standard deviation (SD) indicates the measurement errors from the difference between replicate samplers. During nighttime, the dry deposition flux was greater than that during daytime, except for NO3
−. Table 3 gives information about meteorological conditions during the study period. Meteorological factors such as relative humidity have been thought to affect dry deposition [22, 39], so the higher relative humidity during nighttime may facilitate the deposition. A number of previous studies have concluded that wetlands can reduce particulate matter to some extent via the increase in relative humidity within a certain range [40, 41]. Previous studies have indicated that wind direction affects dry deposition [42, 43], while in this study, the main wind blew from SE during daytime and nighttime, and other wind directions were rarely recorded.
The observed dry deposition flux during daytime followed the order of SO4
2− > Cl− > NO3− > Na+ > Ca2+
> HCOO− > NH4+ > K+ > Mg2+ > F− and that during
nighttime followed the order of SO42− > NH4
+ >Cl− > HCOO− > Ca2+ > K+ > Na+ > NO3
− > F−> Mg2+. The sum of the major cations (Na+, Ca2+, NH4
+, K+, Mg2+) was 2.44 (mg·m−2d−1) and 10.42 (mg·m−2d−1) during daytime and nighttime, respectively, while the corresponding values for anions (SO4
2−, NO3−, Cl−, HCOO−, and F−)
were 7.88 (mg·m−2d−1) and 19.10 (mg·m−2d−1). For the modeled value, the dry deposition flux during nighttime was greater than that during daytime, except for F− and K+. The order of the modeled value during daytime followed the order of SO4
2− > NO3− > K+ > Cl− > NH4
+ > Na+ > HCOO− > Ca2+ > Mg2+ > F− and that during nighttime followed the order of SO4
2− > NO3− > Cl− >
NH4+ > HCOO− > Na+ > Ca2+ > K+ > Mg2+ > F−. The
sum of the major cations (Na+, Ca2+, NH4+, K+, and
Mg2+) was 2.59 and 4.68 mg·m−2d−1 during daytime and nighttime, respectively, while the corresponding values for the anions (SO4
2−, NO3−, NH4
+, Cl−, HCOO−, and F−) were 22.92 and 58.45 mg·m−2d−1. The observed value and calculated value of cations is similar, while there is a big difference between the value of anions. The highest flux for SO4
2− during the daytime and nighttime was observed. This could be due to the emission of coal burning which increased sulfur dioxide emissions according to previous research [44]. Odabasi et al. have reported the observed sulfate fluxes to be 49.25±2.42 mg·m−2d−1 using dry deposition plates. Hence, the flux in our study is generally less than those
previously reported for rural areas [45]. The modeled/observed flux ratio has been used to evaluate the accuracy of the model in the previous study [46]. The average ratios of the modeled/observed flux were 1.38. and 3.47 during daytime and nighttime, respectively. Hence, the modeled values of daytime are in good agreement with those observed to a certain extent. However, the value of nighttime shows a significant difference. This may be due to the model we used not taking sufficient account of the hygroscopic growth. In addition, the air-water temperature difference may change the water evaporation and this will also affect the accuracy of the model [47].
The observed value for the deposition velocity was calculated according to Vd = F/ [C]; in this equation, with F and [C] representing the deposition flux and pollution concentration at the study location, respectively. Deposition velocities were calculated by dividing the observed values of deposition fluxes for different species by the concentrations of those species in the atmosphere for their respective times. The calculated deposition velocity of anions, except for that of SO4
2− during nighttime was greater than that during daytime, while the value of cations except for Na+ was greater during daytime than that during nighttime (Fig. 5). The dry deposition velocities are in agreement with other experiment results [48], in which the deposition velocity of SO4
2− increased during daytime and was reduced during nighttime. On the other hand, the calculated value is smaller than the observed value during nighttime and it shows opposite results during daytime. The main reason could be that the model used in our study does not take phoretic effects and hygroscopic growth into consideration [47]. The observed deposition velocity for the major water-soluble ions (except for NO3
−) during nighttime was greater than that during daytime. Previously, particle dry deposition has been reported to be more efficient during daytime than during nighttime on average by a factor of 1.5-2.5; particle dry deposition is mainly governed by turbulence, which is strong during daytime and weak at night [49]. The spatiotemporal characteristics of particulate matter and dry deposition flux in the Cuihu wetland of Beijing have been reported, and the results indicate that relative humidity correlates positively with dry deposition [7]. Hence, a high relative humidity is possibly the main reason for the relatively high dry deposition velocity during nighttime.
Temperature (ºC) Relative humidity (%) Wind speed (m/s) Wind direction
Normal-water period 17.85±1.77 52.8±5.6 0.48±0.23 SE NE
Dry period -4.36±1.12 38.5±6.2 0.69±0.35 SE S
Wet period 31.22±2.31 66.7±4.5 0.54±0.46 SE
Daytime 16.98±2.26 40.32±3.2 0.49±0.23 SE
Nighttime 12.17±1.95 59.9±4.1 0.59±0.35 SE
Table 3. Average meteorological data during different periods along with daytime and nighttime values in the wetland.

Wang Y., et al.1406
Variation between Periods
Table 4 summarizes the average dry deposition fluxes of the major water-soluble ions during different periods. The observed dry deposition flux during the
normal-water period followed the order of SO42− > NH4
+ > Cl− > HCOO− > Ca2+ > NO3
− > K+ > Na+ > Mg2+ > F− and that during the dry period followed the order of SO4
2− > Cl− > Na+ > NH4+ > NO3
− > Ca2+ > HCOO− > K+ > F− > Mg2+, while that during the wet period following
PeriodFlux(mg·m-2d-1)
Normal-water period Dry period Wet period
Species OV±SD CD OV±SD CD OV±SD CD
F- 0.07±0.08 0.01 0.23±0.30 0.04 0.01±0.02 0.00
HCOO- 2.28±4.29 1.36 0.36±0.33 0.66 0.60±1.34 0.45
Cl- 2.36±2.47 1.22 2.19±2.12 15.02 0.42±0.94 0.96
NO3- 1.68±1.89 15.47 0.84±0.52 6.70 0.39±0.80 0.97
SO42- 12.19±12.42 35.68 5.79±5.32 36.11 0.78±0.75 7.40
Na+ 0.52±0.72 1.27 1.65±2.81 0.25 0.50±0.72 0.92
NH4+ 2.60±4.86 4.15 1.31±1.85 0.88 0.04±0.05 0.04
Mg2+ 0.22±0.15 0.09 0.11±0.11 0.02 0.06±0.14 0.02
Ca2+ 1.94±1.76 0.83 0.65±0.57 0.17 0.21±0.47 0.15
K+ 1.25±1.67 1.22 0.31±0.34 0.11 0.18±0.21 0.77
Fig. 5. Calculated dry deposition velocities and observed values of major water-soluble ions (F-, HCOO-, Cl-, NO3-, SO4
2, Na+, NH4+,
Mg2+, Ca2+, K+) during daytime and nighttime; error bars show the errors of measurement from the differences between the samples.
Table 4. Observed and calculated average dry deposition fluxes of major water-soluble ions during different periods.

Atmospheric Dry Deposition to Natural... 1407
the order SO42− > HCOO− > Na+ > Cl− > NO3
− > Ca2+ >
K+ > Mg2+ > NH4+ > F−. HCOO−, Cl−, NO3
−, SO42−, NH4
+, Mg2+, Ca2+, and K+ exhibited a similar trend in that the dry deposition flux was the highest during the normal-water period, followed by the dry and wet periods, while F− and Na+ exhibited a similar trend in that the dry deposition flux was the highest during the dry period, followed by the normal water and wet periods. In the dry and wet periods, the extreme temperature and strong wind can lead to an unstable and turbulent situation in the atmosphere. The dilution of pollution will reduce the flux of most of the particles [50]. The atmospheric dry deposition on natural surfaces in a semiarid region of north-central India was directly measured, and the results indicated that seasonally dry deposition fluxes are greater in monsoon or summer for cationic species, while fluxes are greater in winter or monsoon for anionic species [18]. While in this study, different trends were observed in this study. Previous studies have shown that the chemical composition of the dry deposition flux have geographic variations [36]. For the modeled value, the dry deposition flux of
three periods shows some different orders among three periods. The calculated value of flux of SO4
2− and NO3−
shows a considerable discrepancy between observed values. In some studies, the SO4
2− and NO3− were
assumed to be in the form of NH4NO3 and (NH4)2SO4, then the calculated and observed values will agree well [29]. On the other hand, the performance of surrogate surfaces in measurement of deposition of small particles and gas is uncertain [51], and thus the transformation of ionic forms will also affect the results. In addition, the average ratios of modeled/observed fluxes were 1.93, 2.47, and 2.36 during the normal, dry, and wet periods, respectively.
Fig. 6 shows the variation in the deposition velocity of different water-soluble ions observed herein and that calculated by parameterization during different periods. Error bars represent the measurement errors from the difference between the samplers. Deposition velocity vary between 0.05-1.14 cm·s-1, and the range of the modeled value was comparable to the observed value. Dry deposition velocity is highest for SO4
2− and lowest for F-. The variation may be due to the difference
Fig. 6. Variation of deposition velocity of different water-soluble ions observed in this study and calculated by parameterization during different periods.

Wang Y., et al.1408
in mass median diameter [51]. The highest calculated deposition velocity was observed for SO4
2− during the dry period. Previous studies have shown that the dry deposition velocity of submicron aerosol over the water is mainly influenced by turbulent diffusion [47]. Thus, the cause of difference of deposition velocity of different ions cannot be determined. And the meteorological factor plays an important role in the difference [52]. In addition, the observed deposition velocity during the wet period was relatively smaller than those during the other periods. This may be due to the water-air temperature difference. When the water-air temperature difference becomes lower than -3ºC, the thermophoresis will have a great influence on the dry deposition velocity [47].
Uncertainty Analysis
Dry deposition on the surface is known to result from the combination of certain processes such as gravitational settling, Brownian diffusion, impaction, interception, thermophoresis, and electrostatic attraction [42]. Dry deposition flux estimates are decided by the type of collection surfaces. Therefore, it is difficult to estimate the accurate flux of dry deposition. Furthermore, resuspension, which means re-entrainment and suspension of particles in the atmosphere, is an important process during and after dry deposition [53]. In this study, experimental and analytical uncertainties originate from the collection of samples and the non-ideal chemical or physical behavior of analytical systems. Therefore, field blanks, repeatability, instrument analytical precision, accuracy and detection limits have been carried out to ensure the quality of our result. The surfaces were exposed for long periods for each sample to achieve concentrations within the detection limits of the analysis method [9]. Hence, the increase in the collection time also leads to increased uncertainty. Surrogate surfaces provide accurate measurements for rapidly falling particles [54], but performance of these devices vary from each other. The petri dish and bucket inside and filter plate surfaces have been reported to represent the most precise devices to estimate dry deposition on smooth, complex, and rough artificial surfaces, respectively. However, so far there is still no totally acceptable way for sampling and calculating dry deposition flux [16]. The difference in the surrogate surface and the collector geometry considerably affect the amount of material collected. Thus, the model assessment may also be affected. In addition, as for the large number of particles collected on the sample, only a small percentage of each sample was analyzed and great error was associated with particle composition categories with a small portion of the total mass. And the uncertainty associated with deposition velocity was determined with the uncertainty in the flux and airborne concentration measurements. Different concentrations of atmospheric particulate matter have great influence on deposition velocity [22, 55]. In future studies we will take atmospheric concentration into
account and distinguish between the concentrations of particles when sampling. Analytical uncertainties originate from the empirical parameters and constants used in the model. The deposition velocities are strongly influenced by particle size and the variation was not linear [39], hence it difficult to accurately reflect the complicated mechanism.
Conclusions
This 2016-2017 study employed a particle deposition model for natural water and the surrogate surface method to calculate dry deposition on natural water. Atmospheric dry deposition fluxes and deposition velocities of water-soluble inorganic ions such as Na+, K+, Mg2+, Ca2+, NH4
+, F−, HCOO−, NO3−, SO4
2−, and Cl− were investigated at the Cuihu Wetland Park of Beijing. Based on the results, the following conclusions can be made: SO4
2−, NO3−, NH4
+ and Cl− were the major components of water-soluble ions in the atmosphere. The mass concentration ratio of NO3
−/SO42− shows that
stationary source emissions are more important than vehicle emissions because of the current industrial use of high-sulfur coal during daytime of suburban Beijing. The ratios of the modeled/observed fluxes were 1.38 and 3.47 during the daytime and nighttime, respectively. The corresponding values were 1.93, 2.47, and 2.36 during the normal, dry, and wet periods, respectively, and the average ratio of modeled/observed fluxes was 2.32. Hence, both laboratory and field measurements and analytical methods for particle deposition need to be improved further to narrow the current uncertainty related to the flux and velocity estimates for atmospheric dry deposition. In addition, further studies have to be carried out to modify the model so that it can be used to evaluate the dry deposition in the wetland.
Acknowledgements
This research was supported by the Natural Science Foundation of China (41877535) and Fundamental Research Funds for the Central Universities (2016JX05).
Conflict of Interest
The authors declare no conflict of interest.
References
1. PELLERIN G., MARO D., DAMAY P., GEHIN E., CONNAN O., LAGUIONIE P., HÉBERT D., SOLIER L., BOULAUD D., LAMAUD E. Aerosol particle dry deposition velocity above natural surfaces: quantification according to the particles diameter. Journal of Aerosol Science, 114, 107, 2017.

Atmospheric Dry Deposition to Natural... 1409
2. WESELY M.L. and HICKS B.B. A review of the current status of knowledge on dry deposition. Atmospheric Environment, 12 (34), 2261, 2000.
3. KNOTE C., HODZIC A., JIMENEZ J.L. The effect of dry and wet deposition of condensable vapors on secondary organic aerosols concentrations over the continental US. Atmospheric Chemistry and Physics, 1 (15), 1, 2015.
4. YI S.M., HOLSEN T.M., ZHU X., NOLL K.E. Sulfate dry deposition measured with a water surface sampler: A comparison to modeled results. Journal of Geophysical Research Atmospheres, 20 (36), 3267, 2002.
5. WU Y., LIU J., ZHAI J., CONG L., WANG Y., MA W., ZHANG Z., LI C. Comparison of dry and wet deposition of particulate matter in near-surface waters during summer. PLoS One, 6 (13), e199241, 2018.
6. QIU D., LIU J., ZHU L., MO L., ZHANG Z. Particulate matter assessment of a wetland in Beijing. Journal of Environmental Sciences, 10 (36), 93, 2015.
7. ZHU L., LIU J., CONG L., MA W., MA W., ZHANG Z. Spatiotemporal Characteristics of Particulate Matter and Dry Deposition Flux in the Cuihu Wetland of Beijing. PLoS One, 7 (11), e158616, 2016.
8. BYTNEROWICZ A., MILLER P.R., OLSZYK D.M. Dry deposition of nitrate, ammonium and sulfate to a Ceanothus crassifolius canopy and surrogate surfaces. Atmospheric Environment, 8 (21), 1749, 1987.
9. SAXENA A., KULSHRESHTA U.C., KUMAR N., KUMARI K.M., SRIVASTAVA S.S. Dry deposition of nitrate and sulphate on surrogate surfaces. Environment International, 5 (18), 509, 1992.
10. NOLL K.E., FANG K.Y.P., WATKINS L.A. Characterization of the deposition of particles from the atmosphere to a flat plate. Atmospheric Environment, 7 (22), 1461, 1988.
11. LUO X., PAN Y., GOULDING K., ZHANG L., LIU X., ZHANG F. Spatial and seasonal variations of atmospheric sulfur concentrations and dry deposition at 16 rural and suburban sites in China. Atmospheric Environment, 146, 79, 2016.
12. LEE S.E., PARK G.H., KIM T.W., KIM Y., Characteristics and seasonal variability of atmospheric deposition in Uljin, adjacent to the southwestern East Sea. AGU Fall Meeting Abstracts, 2016.
13. QI J., LI X., LI P., FENG L., ZHANG M. Estimation of dry deposition fluxes of particulate species to the water surface in the Qingdao area, using a model and surrogate surfaces. Atmospheric Environment, 11 (39), 2081, 2005.
14. RATTRAY G., SIEVERING H. Dry deposition of ammonia, nitric acid, ammonium, and nitrate to alpine tundra at Niwot Ridge, Colorado. Atmospheric Environment, 6 (35), 1105, 2001.
15. SHAHIN U.M., HOLSEN T.M., ODABASI M. Dry deposition measured with a water surface sampler: a comparison to modeled results. Atmospheric Environment, 20 (36), 3267, 2002.
16. MARIRAJ MOHAN S. An overview of particulate dry deposition: measuring methods, deposition velocity and controlling factors. International Journal of Environmental Science and Technology, 1 (13), 387, 2016.
17. TASDEMIR Y., GÜNEZ H. Ambient concentration, dry deposition flux and overall deposition velocities of particulate sulfate measured at two sites. Atmospheric Research, 3 (81), 250, 2006.
18. KUMAR R., RANI A., KUMARI K.M., SRIVASTAVA S.S. Direct measurement of atmospheric dry deposition to natural surfaces in a semiarid region of north central India.
Journal of Geophysical Research Atmospheres, D20 (108), 2003.
19. SLINN S.A., SLINN W.G.N. Predictions for particle deposition on natural waters. Atmospheric Environment, 9 (14), 1013, 1980.
20. NGUYEN T., YU X., ZHANG Z., LIU M., LIU X. Relationship between types of urban forest and PM2.5 capture at three growth stages of leaves. Journal of Environmental Sciences, 27, 33, 2015.
21. PETROFF A., MAILLIAT A., AMIELH M., ANSELMET F. Aerosol dry deposition on vegetative canopies. Part I: Review of present knowledge. Atmospheric Environment, 16 (42), 3625, 2008.
22. LIU J., ZHU L., WANG H., YANG Y., LIU J., QIU D., MA W., ZHANG Z., LIU J. Dry deposition of particulate matter at an urban forest, wetland and lake surface in Beijing. Atmospheric Environment, 125, 178, 2016.
23. YANG T., WANG Y., WU Y., ZHAI J., CONG L., YAN G., ZHANG Z., LI C. Effect of the wetland environment on particulate matter and dry deposition. Environmental Technology, 2018: 1–11. DOI:10.1080/09593330.2018.1520307
24. HOLSEN T.M., NOLL K.E. Dry deposition of atmospheric particles: application of current models to ambient data. Environmental Science & Technology, 9 (26), 1807, 2002.
25. USAMA M. SHAHIN, XIANG ZHU A., THOMAS M. HOLSEN Dry Deposition of Reduced and Reactive Nitrogen: A Surrogate Surfaces Approach. Environmental Science & Technology, 12 (33), 2113, 1999.
26. ZHANG L., GONG S., PADRO J., BARRIE L. A size-segregated particle dry deposition scheme for an atmospheric aerosol module. Atmospheric Environment, 3 (35), 549, 2001.
27. HUANG X., LIU Z., ZHANG J., WEN T., JI D., WANG Y. Seasonal variation and secondary formation of size-segregated aerosol water-soluble inorganic ions during pollution episodes in Beijing. Atmospheric Research, 168, 70, 2016.
28. MENG Z.Y., LIN W.L., JIANG X.M., YAN P., WANG Y., ZHANG Y.M., JIA X.F., YU X.L. Characteristics of atmospheric ammonia over Beijing, China. Atmospheric Chemistry and Physics, 12 (11), 6139, 2011.
29. ZHAO P.S., DONG F., HE D., ZHAO X.J., ZHANG X.L., ZHANG W.Z., YAO Q., LIU H.Y. Characteristics of concentrations and chemical compositions for PM2.5 in the region of Beijing, Tianjin, and Hebei, China. Atmospheric Chemistry and Physics, 9 (13), 4631, 2013.
30. KONG S., WEN B., CHEN K., YIN Y., LI L., LI Q., YUAN L., LI X., SUN X. Ion chemistry for atmospheric size-segregated aerosol and depositions at an offshore site of Yangtze River Delta region, China. Atmospheric Research, 147, 205, 2014.
31. ZHANG F., XU L., CHEN J., CHEN X., NIU Z., LEI T., LI C., ZHAO J. Chemical characteristics of PM2.5 during haze episodes in the urban of Fuzhou, China. Particuology, 3 (11), 264, 2013.
32. WANG P., CAO J., SHEN Z., HAN Y., LEE S., HUANG Y., ZHU C., WANG Q., XU H., HUANG R. Spatial and seasonal variations of PM 2.5 mass and species during 2010 in Xi’an, China. Science of the Total Environment, 508, 477, 2015.
33. XU L., CHEN X., CHEN J., ZHANG F., HE C., ZHAO J., YIN L. Seasonal variations and chemical compositions of PM2.5 aerosol in the urban area of Fuzhou, China. Atmospheric Research,104(105), 264, 2012.

Wang Y., et al.1410
34. SUN Z., MU Y., LIU Y., SHAO L. A comparison study on airborne particles during haze days and non-haze days in Beijing. Science of the Total Environment, 456, 1, 2013.
35. ZHANG Z., WANG W., CHENG M., LIU S., XU J., HE Y., FAN M. The contribution of residential coal combustion to PM2.5 pollution over China’s Beijing-Tianjin-Hebei region in winter. Atmospheric Environment, 159, 147, 2017.
36. JAVID M., BAHRAMIFAR N., YOUNESI H., TAGHAVI S.M., GIVEHCHI R. Dry deposition, seasonal variation and source interpretation of ionic species at Abali, Firouzkouh and Varamin, Tehran Province, Iran. Atmospheric Research, 157, 74, 2015.
37. TAN J., ZHANG L., ZHOU X., DUAN J., LI Y., HU J., HE K. Chemical characteristics and source apportionment of PM2.5 in Lanzhou, China. Science of the Total Environment, 601, 1743, 2017.
38. GALINDO N., YUBERO E., NICOLÁS J.F., CRESPO J., PASTOR C., CARRATALÁ A., SANTACATALINA M. Water-soluble ions measured in fine particulate matter next to cement works. Atmospheric Environment, 12 (45), 2043, 2011.
39. LIU J., ZHAI J., ZHU L., YANG Y., LIU J., ZHANG Z. Particle removal by vegetation: comparison in a forest and a wetland. Environmental Science and Pollution Research, 2 (24), 1597, 2017.
40. MARION L., BRIENT L. Wetland effects on water quality: input-output studies of suspended particulate matter, nitrogen (N) and phosphorus (P) in Grand-Lieu, a natural plain lake. Hydrobiologia, 373, 217, 1998.
41. LIU J., YAN G., WU Y., WANG Y., ZHANG Z., ZHANG M. Wetlands with greater degree of urbanization improve PM2.5 removal efficiency. Chemosphere, 207, 601, 2018.
42. MARO D., CONNAN O., FLORI J.P., HÉBERT D., MESTAYER P., OLIVE F., ROSANT J.M., ROZET M., SINI J.F., SOLIER L. Aerosol dry deposition in the urban environment: Assessment of deposition velocity on building facades. Journal of Aerosol Science, 69 (2), 113, 2014.
43. ŠÍP V., BENEŠ L. Dry deposition model for a microscale aerosol dispersion solver based on the moment method. Journal of Aerosol Science, 107, 107, 2017.
44. PAN Y.P., WANG Y.S., TANG G.Q., WU D. Spatial distribution and temporal variations of atmospheric sulfur deposition in Northern China: insights into the potential acidification risks. Atmospheric Chemistry & Physics, 3 (13), 1675, 2013.
45. ODABASI M., BAGIROZ H.O. Sulfate dry deposition fluxes and overall deposition velocities measured with a surrogate surface. Science of the Total Environment, 1-3 (297), 193, 2002.
46. LIN J.M., FANG G.C., HOLSEN T.M., NOLL K.E. A comparison of dry deposition modeled from size distribution data and measured with a smooth surface for total particle mass, lead and calcium in Chicago. Atmospheric Environment. part A. general Topics, 7 (27), 1131, 1993.
47. CALEC N., BOYER P., AMIELH M., BRANGER H., ANSELMET F., MAILLIAT A. Dry deposition velocities of submicron aerosols on water surfaces: laboratory experimental data and modelling approach. Journal of Aerosol Science, 105,179, 2016.
48. ZHAO L., LUN X., LI R., CAO Y., SUN F., YU X. Deposition of PM2.5 Sulfate in the Spring on Urban Forests in Beijing, China. Atmosphere, 1 (8), 3, 2017.
49. GIORGI F. Dry deposition velocities of atmospheric aerosols as inferred by applying a particle dry deposition parameterization to a general circulation model. Tellus, 1 (40B), 23, 2010.
50. FANG G., ZHENG Y., ZENG C., CHEN Y., LIN S.M. Comparisons of annual ambient air pollutant concentrations and dry deposition flux variations for day and nighttime in middle Taiwan. Environmental Earth Sciences, 11 (72), 4325, 2014.
51. KUMAR R. Direct measurement of atmospheric dry deposition to natural surfaces in a semiarid region of north central India. Journal of Geophysical Research, D20 (108), 4625, 2003.
52. LIU J., ZHAI J., ZHU L., YANG Y., LIU J., ZHANG Z. Particle removal by vegetation: comparison in a forest and a wetland. Environmental Science and Pollution Research, 2 (24), 1597, 2017.
53. CHENG M.T., HORNG C.L., LIN Y.C. Characteristics of atmospheric aerosol and acidic gases from urban and forest sites in central taiwan. Bulletin of Environmental Contamination & Toxicology, 6 (79), 674, 2007.
54. HALES J.M., HICKS B.B., MILLER J.M. The Role of Research Measurement Networks as Contributions to Federal Assessments of Acid Deposition. Bulletin of the American Meteorological Society, 3 (68:3), 216, 2010.
55. ZUFALL M.J., DAVIDSON C.I., CAFFREY P.F., ONDOV J.M. Airborne Concentrations and Dry Deposition Fluxes of Particulate Species to Surrogate Surfaces Deployed in Southern Lake Michigan. Environmental Science & Technology, 11 (32), 1623, 1998.