original citation - wrap: warwick research archive...
TRANSCRIPT

warwick.ac.uk/lib-publications
Original citation: Bloodworth, Alan G., Cao, J. and Xu, M.. (2012) Numerical modelling of shear behaviour of reinforced concrete pile caps. Journal of Structural Engineering, 138 (6). pp. 708-717. Permanent WRAP URL: http://wrap.warwick.ac.uk/80772 Copyright and reuse: The Warwick Research Archive Portal (WRAP) makes this work by researchers of the University of Warwick available open access under the following conditions. Copyright © and all moral rights to the version of the paper presented here belong to the individual author(s) and/or other copyright owners. To the extent reasonable and practicable the material made available in WRAP has been checked for eligibility before being made available. Copies of full items can be used for personal research or study, educational, or not-for-profit purposes without prior permission or charge. Provided that the authors, title and full bibliographic details are credited, a hyperlink and/or URL is given for the original metadata page and the content is not changed in any way. Publisher’s statement: © American Society of Civil Engineers Published version: http://dx.doi.org/10.1061/(ASCE)ST.1943-541X.0000499 A note on versions: The version presented here may differ from the published version or, version of record, if you wish to cite this item you are advised to consult the publisher’s version. Please see the ‘permanent WRAP URL’ above for details on accessing the published version and note that access may require a subscription. For more information, please contact the WRAP Team at: [email protected]

1
Numerical modelling of shear behaviour of reinforced concrete pile caps
by
Alan G. Bloodworth1, Jing Cao2 and Ming Xu3
Abstract
The application of bending theory based methods and strut-and-tie models for the
design of pile caps to resist shear is still a subject of debate, with the latest Eurocodes
permitting both methods but not giving much guidance as to their use. The former UK
design standards for concrete buildings and bridges, recently withdrawn, gave more
guidance and it is likely that these methods will continue to be used by designers.
However, there is considerable discrepancy between these standards, particularly with
regards to the width of cap over which shear enhancement at short spans may be
applied, and how much longitudinal reinforcement to take as a tie in the strut-and-tie
method. Both standards are also seen as conservative.
To gain a better understanding of the problem and assess the available design methods,
nonlinear finite element analysis has been performed to investigate the shear
behaviour of four-pile reinforced concrete pile caps, under full-width wall loading.
The models were validated against an experimental programme that included an
optical photogrammetric method for measuring full-field displacements. An extensive
parametric study was carried out, varying shear span, cap width and reinforcement
ratio over a practical range.
The conservatism of the UK design standards, and the real shear capacity of the pile
caps, were found to be a function of shear enhancement factor and the width of the

2
cap over which shear enhancement is applied. Strut-and-tie behaviour was observed in
the models, and a commonly used strut-and-tie method was found to give fairly good
predictions. A modified strut-and-tie method is suggested for this particular
configuration of a four-pile cap under full-width loading, which gives more accurate
predictions. This is especially so for samples with large transverse pile spacing where
a significant proportion of the longitudinal reinforcement over the width of the cap
can be assumed to participate in the yielding ties.
CE Database subject headings: Pile caps; Shear resistance; Reinforced concrete;
Finite element analysis
1. Lecturer, School of Civil Engineering and the Environment, University
of Southampton, SO17 1BJ, UK. Email: [email protected]
2. Structural engineer, BG&E Pty Limited, 484 Murray Street, Perth, WA
6000, Australia. Email: [email protected]
3. Lecturer, Department of Civil Engineering, Tsinghua University,
Beijing 100084, China. Email: [email protected]

3
Numerical modelling of shear behaviour of reinforced concrete pile caps
by
A. G. Bloodworth, J. Cao and M. Xu
Introduction
A reinforced concrete (RC) pile cap is an example of a short-span, relatively deep
beam which can also be wide relative to its depth if the transverse pile spacing is large,
such that two-dimensional spanning behaviour can become significant. The design
standards contain two main methods for their design to resist shear. The first is deep
beam theory, developed by Regan (1971) for one-way spanning beams, in which the
assumption is made of a critical opening inclined shear crack, above which is a
compression zone of concrete. Shear failure occurs when the concrete fails in
compression. The depth of the concrete compression zone is related to the relative
rotation of the two surfaces of the crack.
The second is the strut-and-tie method (STM) which is based on the concept of
longitudinal and transverse bottom reinforcement acting as ties with inclined
compressive struts joining the pile heads and the centre of application of the load
(Adebar and Zhou 1996).
There is discrepancy between the deep beam theory based design formulae in the UK
design standards BS 8110 (BSI 1997) and BS 5400 (BSI 1990) due to different
definitions of the width of the cap for which shear enhancement may be applied, that
lead to differences of a factor of two or three between predicted capacities. This

Bloodworth Cao & Xu
4
discrepancy has not been resolved in the Eurocodes (BSI, 2004; BSI, 2005). US and
Canadian standards (AASHTO 2007; ACI 2005; CSA 1994) favour STM, but there
has been uncertainty expressed about its applicability (Park et al 2008).
Fundamentally overall only a limited experimental data set is available to verify the
current design approaches (Bloodworth et al. 2003).
Tests of the shear capacity of a series of reduced-scale pile caps under full-width wall
loading (Fig. 1) with uniform bottom reinforcement in both directions have been
carried out (Cao and Bloodworth 2011). It was found that both UK code deep beam
theory based design formulae gave conservative predictions. The strut-and-tie method
in the standards gave better predictions, suggesting the shear behaviour of a pile cap
can be described physically in this way, but becomes conservative when transverse
pile spacing is large.
This paper describes the development of nonlinear finite element analysis (FEA)
models of the experimental samples and their verification against the experimental
results. The FEA has then been extended to cover a wider range of pile cap
dimensions by means of a parametric study of 88 further analyses. Two-way
behaviour of the caps under load was observed in the FEA, and it became apparent
that the STM indeed provides a reasonable physical description of the shear behaviour.
The results from the parametric study are used to suggest a modified STM which
gives improved predictions of capacity, especially for wide transverse pile spacing.
Design rules for shear enhancement in pile caps
Bloodworth Cao & Xu
5
UK standards BS 8110 and BS 5400 apply to pile caps design formulae originally
developed for one-way spanning RC beams. The formulae express the design concrete
shear stress vc in terms of the beam width b, effective depth d, concrete characteristic
cube strength fcu and longitudinal main reinforcement area As. Because pile caps are
relatively short span deep structures, enhancement of shear strength by the factor
2d/av is usually applicable, where av is the shear span. BS 8110 and BS 5400 have
different rules for the width of the cap over which shear enhancement may be
considered effective. BS 8110 allows it to be the sum of the widths of zones centred
on each pile head, where each zone may be up to three times the pile diameter in
width. In BS 5400 the corresponding zones are limited to only one pile diameter in
width over each pile head.
The Eurocode for concrete design (BSI 2004) has less specific guidance for pile caps
(Clause 9.8.1) than the UK Standards. It stipulates similar deep beam theory based
formulae, but with a different depth factor. However, specific guidance on the width
of the cap for which shear enhancement is effective is lacking. The main clauses for
shear design state that shear enhancement can only be applied provided ‘the
longitudinal reinforcement is fully anchored at the support’ (Clause 6.2.2). If the
‘support’ is taken as meaning strictly only the piles, then this is the same as the BS
5400 provision. However, a possible interpretation of the Eurocode is that the piles in
the transverse direction may provide a type of ‘line of support’, in which case
designers may opt for the BS 8110 approach or even take the enhancement as
effective across the entire cap width.
Pile cap experiments
Bloodworth Cao & Xu
6
A total of 17 reduced-scale pile cap samples in four batches were tested (Cao 2009).
Figure 2 shows the experimental setup used to achieve the configuration of loading
and supports shown in Figure 1. Results from the most successful final batch of nine
samples are reported in Cao and Bloodworth (2011) and are used for the verification
of the FEA described herein.
The depth h in Figure 1 was kept constant at 230 mm, the pile diameter hp at 130 mm,
the width hc of the loading spreader beam at 100 mm and the pile depth dp at 260 mm.
The remainder of the dimensions that were varied are given in Table 1 for the nine
samples, along with the reinforcement details and concrete strengths for each cap. The
parameter is the ratio between transverse pile spacing and pile diameter (p
y
hl
).
Reinforcement was uniformly distributed with equal percentages in both directions.
Mean reinforcement yield strength fy of 547 N/mm2 and mean ultimate strength of 646
N/mm2 were obtained by testing. Concrete cube strength fcu was the mean of three
results for each pile cap, on 100 mm cubes. Cylinder strengths are calculated in Table
1 from the cube strengths using the relationship in Table 3.1 of the Eurocode (BSI
2004).
The 150-tonne Instron column-testing machine at the University of Southampton was
used. The hydraulic actuator lifts the lower steel platen. Soft boards were placed
between the top platen, spreader beam and cap to avoid stress concentrations causing
local crushing. The pile cap was set on the lower platen temporarily supported on
wedges and self-levelling screed poured underneath the piles to ensure an even
contact area. Horizontal restraint at the pile bases was minimised by means of plastic

Bloodworth Cao & Xu
7
sheets under the piles between which oil was placed. The pile bases experienced a
combination of vertical and moment reactions, but because the pile bending stiffness
was much lower than the cap, analysis showed that the hogging moment applied to
the cap at the top of the piles was small.
The caps were instrumented to measure load, and displacements recorded by linear
potentiometers distributed over the soffit. Crack distribution and propagation were
highlighted by hand on the surfaces and photographed. In addition, a full-field
distribution of strain on the front surface of the cap was obtained using digital
photogrammetry (Cao et al 2007). Results from the experiments, including the
development of cracking with load, final crack patterns and typical load-displacement
date are given in Cao and Bloodworth (2011).
The ‘shear enhancement application factor’, A, is defined as:
A = benh/b (1)
Where benh is the width over which shear enhancement is considered effective
according to BS 8110 (i.e. sum of width of all relevant strips centred on pile heads),
and b is the overall cap width. The experimental samples consisted of two series. In
Series A, av/d was varied with A constant, by varying longitudinal pile spacing with
constant transverse pile spacing. Series B was designed vice versa to vary A under
constant av/d, by varying the transverse pile spacing with constant longitudinal pile
spacing. It had a lower reinforcement ratio than Series A so the effect of this quantity
could also be investigated.
Numerical model
Bloodworth Cao & Xu
8
The software used was the commercial FEA package DIANA, which has been shown
to give satisfactory results in the analysis of continuous RC beams without shear
reinforcement (Keown 2000).
Taking advantage of symmetry, only one quarter of the cap was modelled (Fig. 3),
with displacements constrained perpendicular to the cut surfaces. Nodes on the pile
base were supported vertically but released in the two horizontal directions, to mimic
the experimental setup (Cao and Bloodworth 2011). A downwards prescribed
displacement was applied over the area of the full-width wall loading.
20-node isoparametric solid brick elements with a quadratic interpolation function and
333 gauss integration scheme (DIANA 2002) were used. Ten mesh layers were
used in the cap body, with increased mesh density in the region under the wall loading.
Reinforcement was modelled as a thin sheet at the level of the axis of the reinforcing
bars in the experimental samples. Perfect bond between reinforcement and concrete
was assumed. Piles were modelled as unreinforced, as it was proved that negligible
contribution was given by the pile reinforcement to pile bending and compression
stiffness (Cao 2009).
Concrete is assumed to behave linearly before yield in both compression and tension,
with Young’s modulus of 28 GPa and Poisson’s ratio of 0.2. fcu was obtained from
cube tests, and concrete tensile strength ft taken as fcu/10. In the nonlinear stage for
concrete in tension, a smeared cracking model with fixed angle of cracks and constant
tension cut-off was used. Linear tension softening was assumed after peak tensile

Bloodworth Cao & Xu
9
strength is reached (Fig. 4), with ultimate crack strain cr
ult taken as 0.000311 (DIANA
2005).
For concrete in compression, the von Mises failure criterion was used, with ideal
plasticity without hardening or softening and infinite maximum compressive strain.
The yield stress was taken as fcu and shear retention factor as 0.2. For reinforcement,
Young’s modulus was taken as 210 GPa, and in the non-linear stage, the von Mises
failure criterion was used for both compression and tension, assuming again ideal
plasticity and infinite maximum strain. Yield stress fy was taken as 547 MPa.
A Newton-Raphson solver was used, with convergence criterion on the energy norm
ratio between two consecutive iterative steps (DIANA 2002). Prescribed displacement
step in the range 0.05 mm – 0.4 mm were applied.
Model validation
Validation was performed against load-deflection curves and crack distributions. A
primary parameter was ultimate crack strain cr
ult , for which the recommended control
value is 0.000311 (DIANA 2005). cr
ult can also be obtained from the energy absorbed
during maturing of a crack by calculating fG , the fracture energy consumed in the
formation and opening of all micro-cracks per unit area of plane ahead of the tip of
the advancing crack (Bazant et al. 1983). Calculated this way, cr
ult was around 0.003
for both reinforced concrete ( sy
cr Ef / ) and unreinforced concrete (crt
fcr
hf
G2 ,
where crh is the crack band width) (Cao 2009). Figure 5 shows load-displacement

Bloodworth Cao & Xu
10
curves for cr
ult from 0.000311 – 0.006 for cap B4A1. The larger cr
ult , the stiffer the
structure response. However, the actual failure load does not vary with cr
ult , so the
control value of 0.000311 was adopted for all the analyses.
Figure 6 shows an observed crack pattern on a cap front surface at the failure step
compared with that predicted from FEA. Both show large inclined shear cracks,
hogging cracks above the pile head and considerable central bending cracks.
Table 2 compares FEA failure loads with experiments. The ratio of FEA to
experimental failure load is close to 1.0 for B4A4, B4A5 and B4B4. Some of the
remaining caps did not fail completely across their whole width in the experiments
due to asymmetric loading (Cao and Bloodworth 2011), so their true failure load
should have been higher, hence explaining their ratio being above 1.0 (particularly
B4A2).
It was concluded from the validation that the FEA gave an adequate representation of
the experimental results (particularly failure load) with the parameters chosen, making
them suitable for use in the extended parametric study described later.
Model output
In the experiments, a full-field strain distribution on the cap front surface was
obtained by digital photogrammetry (Cao et al. 2007). Concrete strain at the level of
the main longitudinal reinforcement was observed in all cases to be greater than the
reinforcement yield strain of 0.0026 over the whole longitudinal span. Thus it is likely
the reinforcement was acting as a yielding tie at ultimate load. This observation is

Bloodworth Cao & Xu
11
supported by the FEA of most samples. For example, for B4B2 (Fig. 7) sx reaches
yield (547 MPa) over almost the whole longitudinal span, for the width of the pile
head and between the pile and the front surface. Between the piles, sx reaches yield
at mid longitudinal span but reduces significantly towards the line of pile support,
suggesting two-way spanning behaviour.
This two-way behaviour is confirmed by the stress in the transverse reinforcement
sy . Transverse ties under significant elastic stress are observed concentrated over the
pile head, with stress greater for larger transverse pile spacing. For example in B4A5
( = 2.3), sy peaks at 80 MPa, whereas for B4B3 ( = 4.23) (Fig. 8) sy peaks at
240 MPa. This implies potential for bending or shear cracking in the transverse
direction.
In all the FEA of the experimental samples, diagonal splitting cracks linking the wall
loading to the pile head are present at the onset of yield and mature at the failure step
e.g. B4A1 (Fig. 6).
The observations of a yielding main longitudinal reinforcement tie, a transverse tie at
elastic stress which depends on transverse pile spacing and diagonal compressive
splitting cracks point towards strut-and-tie behaviour.
Von Mises stress v and crack strain cr can be observed in the FEA output. Figure
9(a) shows a zone in compression between the pile head and the loaded area, idealised
as an equivalent strut linking the pile head with a point under the wall loading

Bloodworth Cao & Xu
12
between the centre of the cap top and the top front edge. Figure 9(b) shows the
distribution of cr , highlighting diagonal cracking at the onset of failure.
Parametric study
The FEA was extended with 88 further models under full-width wall loading, with the
range of key dimensions shown in Figure 10. Other dimensions indicated in Fig. 1
were consistent with the experimental samples. The range of av/d and for the
experimental samples is indicated by the bold dash lines.
The geometry idealisation, boundary conditions, element type and constitutive models
for concrete and reinforcement were as previously. The reinforcement in the cap was
12 mm bars at 50 mm spacing in both directions, and the piles were again
unreinforced but with an artificially high strength. Concrete Young’s modulus was
taken as 28 GPa, Poisson’s ratio as 0.2, cuf as 25 MPa and tf as 2.5 MPa. Ultimate
crack strain cr
ult was taken as 0.001 to improve convergence.
The Newton-Raphson solver was again used, with the threshold energy norm ratio
varied over a range 0.005 to 0.05, wider than the range 0.01 to 0.02 used previously to
cater for some brittle failures that occurred. Prescribed displacement step size was
from 0.2 mm to 2 mm.
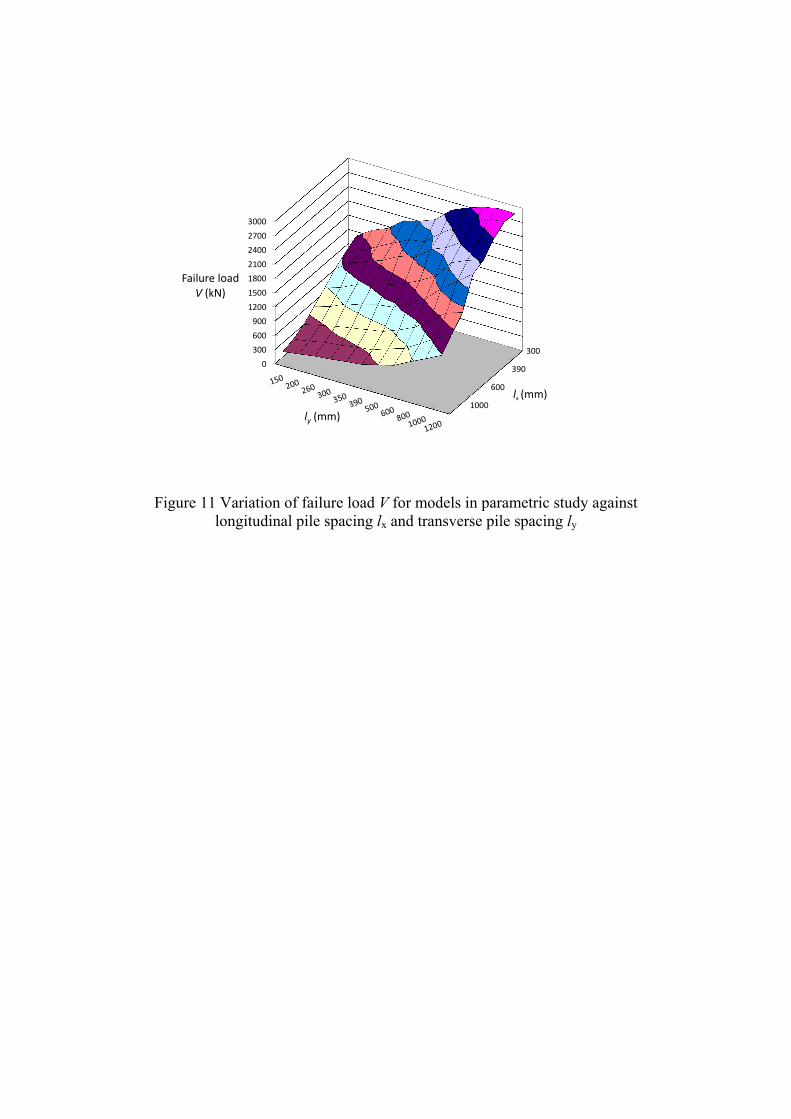
Predicted failure loads
Figure 11 plots the failure load of the cap V as a function of longitudinal and
transverse pile spacings lx and ly. V increases as expected with increasing ly and and
decreasing lx (decreasing av/d).

Bloodworth Cao & Xu
13
Figure 12 shows the relationship between average shear stress at failure v, av/d and A
(). At large , the cap becomes more two-way spanning and v becomes less
dependent on av/d, especially for av/d < 0.81; the proportion of cap width over which
shear enhancement is effective is decreasing. For smaller av/d, e.g. < 0.31, this trend
continues with v reducing noticeably once increases beyond 3.0.
Predicted failure mechanisms
Most parametric study models had ductile failures that were either in bending or shear
judged by the crack distribution on the front surface, and in the latter case by the
occurrence of a yielding reinforcement tie over the whole longitudinal span (Figure
10). Caps with large lx failed by bending with wide midspan cracks (e.g. Fig. 13) and
stress in the longitudinal reinforcement sx increasing towards midspan (Fig. 14).
Diagonal splitting cracks on the front surface become more apparent at smaller av/d,
as for B4A4 (Fig. 9).
For the majority of caps, the longitudinal reinforcement yielded across the whole
width of the cap at midspan, either in shear or bending failure. Figure 15 shows the
range with large ly ( > 4) and relatively small lx for which this was not the case and
in which yielding occurs on a strip over each pile head (e.g. Fig. 16). With larger lx,
the yielding strip can be wider than three times pile diameter when > 3, even
extending across the whole cap width (Fig. 17).

Bloodworth Cao & Xu
14
In the transverse direction, significant reinforcement stress sy >200 N/mm2 occurred
in caps with >= 2. As increases, sy increases and can reach yield (Fig. 18).
Normally the transverse tie concentrates on the pile head.
Comparison with current design formulae
In the following discussion, the ratio of failure load predicted by FEA to those from
deep beam theory based shear formula and STM in BS 8110 is denoted bBS8110
and SBS8110 respectively. In each case, the partial factor on material strength m =
1.0.
The variation of bBS8110 against av/d and A () proved to be in the range 2.03 to 3.10
(Cao 2009), showing consistent conservatism in BS 8110. A global multiplying factor
of 2.0 could be applied to the BS 8110 formula, although this would lack clear
physical meaning.
A strut-and-tie model is permitted as an alternative design method in the British
Standards, with the model comprising concrete struts transferring the load from the
centre of the loaded area to the centres of each pile head, reacted by reinforcement ties
in both directions (Bloodworth et al 2003; Clarke 1973). The standards differ in the
amount of longitudinal reinforcement assumed or permitted to participate in the
longitudinal tie. BS 8110 envisages the longitudinal reinforcement as uniformly
distributed across the cap width, with the longitudinal ties to be the reinforcement
within strips no wider than three times the pile diameter centred on the piles. In BS
5400, all longitudinal reinforcement can included in the ties, provided 80% of it is

Bloodworth Cao & Xu
15
placed in strips anchored directly over the pile heads. The BS 8110 approach is seen
as more practical, as concentrating the reinforcement over the pile heads in line with
BS 5400 can cause problems with punching shear, especially under concentrated
loads. Neither standard considers the strength of the concrete strut, although this is
addressed in the Eurocodes (BSI 2004) and in US and Canadian standards.
Eurocode detailing provisions state that the longitudinal reinforcement should be
concentrated in the ‘stress zones between the tops of the piles’ (BSI 2004; BSI 2005).
This may be taken by designers to mean entirely confined to over the pile heads, in
which case the implication is that all such reinforcement may be taken to participate
in the longitudinal tie. US Standards have a similar provision that longitudinal
reinforcement should be anchored in the nodal zones in the strut-and-tie model.
Figure 19 shows the variation of SBS8110 with av/d and A (). At small pile transverse
spacing (A = 1), the STM matches well with FEA, whilst for large transverse pile
spacing (A < 1 or > 3) the FEA failure load is higher than from the STM. This can
be explained by the longitudinal yielding tie being wider than the limit of three times
the pile diameter in BS 8110 and even extending over the whole cap width when >
3 (e.g. Fig. 17). A yielding tie can also form in the transverse direction (Fig. 18).
Improved strut-and-tie method
The experiments and FEA have shown that the longitudinal tie is usually wider than
the pile diameter, and at large transverse pile spacing it can exceed three times the pile
diameter. Additionally there can be significant stress in the transverse reinforcement.
A new STM formulation is thus proposed, based on the strut and tie arrangement
Bloodworth Cao & Xu
16
shown in Figure 20. 90% of the longitudinal reinforcement area As (assumed to be
uniformly distributed) is included in the ties, regardless of the transverse pile spacing
to diameter ratio. In addition, the top of the inclined concrete strut is relocated slightly
to link a point one quarter of the width of the loaded area ch from the transverse
centreline of the cap (and (1/4)hc.tan from the longitudinal centreline of the cap) to
the centre of the pile head, for all load patterns, thus accounting for the width of the
wall loading and pile. The total load capacity predicted by this new STM is:
2/
)9.0(4
cx
sy
hl
AzfF
(2)
Where z is the inner lever arm. The ratio nSTM of the shear capacity predicted by
FEA to that from the new STM is shown in Figure 21, where z has been taken as 0.9d.
Compared with SBS8110 (Fig. 17), nSTM is closer to 1.0 over a larger range of cap
sizes. The prediction is particularly good over the range of av/d and covered by the
experimental samples representing a practical range of pile cap dimensions, indicated
by the bold lines.
The triangular region in the corner of the curve plane in Figure 21 where nSTM drops
below 1.0, indicated by the dashed line has vertices = 4.0, av/d = 0.31 and = 9.2,
av/d = 1.0 approximately. In this region, it is becoming a poor assumption for the
longitudinal tie to be as wide as 90% of the cap width, e.g. as seen in Figure 16 ( =
9.2, av/d = 0.31). However, this region represents caps which have both large
transverse pile spacing (relative to pile diameter) and large shear enhancement factor
(i.e. short longitudinal pile spacing relative to cap effective depth). This geometry is
not a very practical range, and indeed under the Eurocodes, av/d is limited to be no
less than 0.5 in the calculation of shear enhancement.

Bloodworth Cao & Xu
17
Conclusions
Non-linear FEA has been carried out to investigate shear capacity and behaviour of
pile caps under full-width wall loading, verified against the results of a series of
reduced-scale experiments. The most important observation from the FEA, backed by
the experimental observations, is that a strut-and-tie model is a valid representation of
the shear behaviour of deep two-way pile caps.
Current deep beam theory based design formulae are conservative for pile caps, and
although the strut-and-tie method in UK standards BS 8110 gives a better prediction,
it fails to do so for caps with large transverse pile spacing. The FEA has shown that
transverse reinforcement plays an important role and the width of longitudinal
reinforcement participating in the yielding tie can be larger than three times the pile
diameter centred on each pile. A new strut-and-tie method is proposed, in which
longitudinal reinforcement across 90% of the cap width is included in the ties, and the
span of the longitudinal ties is slightly reduced to account for the pile diameter and
width of the wall loading. This method improves the prediction of capacity especially
for caps with large transverse pile spacing, provided that the longitudinal pile spacing
is not excessively short and the cap fails in a ductile manner with yielding of the main
longitudinal reinforcement.
Acknowledgement
The authors are grateful to the UK Engineering and Physical Sciences Research
Council (EPSRC) for the project funding under Grant Ref. GR/S17888/01.

Bloodworth Cao & Xu
18
Notation
av: Shear span
A : Shear enhancement application factor benh/b (evaluated to BS 8110
rules)
As: Total area of main reinforcement in cap longitudinal direction
b: Pile cap overall width
benh: Transverse width of cap on which shear enhancement applied
C : Compressive force in inclined strut in strut-and-tie model
d : Effective depth to main longitudinal reinforcement
dp : Height of pile in experimental test and numerical model
fcu : Concrete cube compressive strength
fck: Concrete cylinder compressive strength
ft: Concrete tensile strength
fy: Reinforcement yield strength
F : Load capacity of pile cap calculated from revised strut-and-tie method
h : Overall depth of pile cap
hc: Width of wall loading
hp: Pile diameter
L : Overall length of pile cap
lx : Longitudinal pile spacing
ly : Transverse pile spacing
v : Average shear stress on a vertical cross-section through a pile cap
V : Shear capacity of pile cap
z : Inner lever arm
, : Space angles in strut-and-tie model

Bloodworth Cao & Xu
19
bBS8110 : Ratio of experimental failure load to BS 8110 bending theory based
prediction
SBS8110 : Ratio of experimental failure load to BS 8110 strut-and-tie method
prediction
nSTM : Ratio of experimental failure load to revised strut-and-tie method
prediction
m : Partial factor on material strength in British Standards
cr : Crack strain
cr
ult : Ultimate crack strain
: Ratio of transverse pile spacing to pile diameter ( = ly/hp)
sx : Reinforcement stress in longitudinal (x) direction
sy : Reinforcement stress in transverse (y) direction
v : von Mises stress
References
AASHTO (2007). LRFT Bridge Design Specifications, 4th Ed. in SI units, American
Association of State and Highway Transportation Officials, Washington, D.C.,
USA.
ACI (2005). Building Code Requirements for Structural Concrete (ACI 318-05) and
Commentary to the Building Code Requirements (ACI 318R-05), American
Concrete Institute, Farmington Hills, Michigan, USA.
Adebar, P. and Zhou, L. (1996). “Design of Deep Pile Caps by Strut-and-Tie
Models.” ACI Structural Journal 93(4), 437-448.
Bloodworth Cao & Xu
20
Bazant, Z. P., and Oh B.H. (1983). “Crack Band Theory for Fracture of Concrete.”
Materials et Constructions, 16, 155-177.
Bloodworth, A. G., Jackson, P. A., and Lee, M. M. K. (2003). “The Strength of
Reinforced Concrete Pile Caps.” ICE Proceedings Structures and Buildings
156(4), 347-358.
BSI (1997). BS 8110: Structural use of concrete: Part 1: Code of practice for design
and construction. British Standards Institution, Milton Keynes.
BSI (1990). BS 5400: Steel, concrete and composite bridges: Part 4: Code of practice
for design of concrete bridges. British Standards Institution, Milton Keynes.
BSI (2004). BS EN 1992-1-1: Design of concrete structures — Part 1-1: General
rules and rules for buildings. British Standards Institution, Milton Keynes.
BSI (2005). BS EN 1992-2: Eurocode 2 — Design of concrete structures — Part 2:
Concrete bridges — Design and detailing rules. British Standards Institution,
Milton Keynes.
Cao, J. (2009). “The shear behaviour of the reinforced concrete four-pile caps.” PhD
Thesis, University of Southampton, UK.
Cao, J. and Bloodworth, A.G. (2011). “Shear behaviour of reinforced concrete pile
caps under full-width wall loading.” Accepted for publication in Proceedings
of the Institution of Civil Engineers, Structures and Buildings.
Cao, J., Bloodworth, A.G. and Xu, M. (2007). “Observations of truss action in
reinforced concrete pile caps.” Proc. 3rd Int. Conf. on Structural Engineering,
Mechanics and Computation, Cape Town, South Africa.
Clarke, J. L. (1973). Behaviour and Design of Pile Caps with Four Piles, Cement and
Concrete Association, Technical Report, 124-136.

Bloodworth Cao & Xu
21
CSA (1994). Canadian Standard for the Design of Concrete Structures (A23.3-94),
Canadian Standards Association, Mississauga, Ontario, Canada.
DIANA (2002). DIANA finite element analysis user's manual release 8.1. TNO
DIANA BV, Delft, The Netherlands.
DIANA (2005). Standard DIANA course tutorials and exercises. TNO DIANA BV,
Delft, The Netherlands.
Keown, P. G. (2000). “Investigation of the shear characteristics of reinforced concrete
continuous beams.” PhD Thesis, Queen's University, Belfast, UK.
Park, J., Kuchma, D. and Souza, R. (2008). “Strength predictions of pile caps by a
strut-and-tie model approach.” Canadian Journal of Civil Engineering, 35(12),
1399-1413.
Regan, P. E. (1971). Shear in Reinforced Concrete – an Analytical Study.
Construction Industry Research and Information Association, Imperial College,
London.

Bloodworth Cao & Xu
22
Table 1 Batch 4 experimental sample details
Pile cap
Ref.
Cap length
L (mm)
Cap width
b (mm)
Longitudinal
pile spacing
lx (mm)
Transverse
pile
spacing
ly (mm)
Ratio
transverse pile
spacing to
pile diameter
p
y
hl
Ratio of
shear span to
effective
depth
Shear
enhancement
application
factor A
(BS8110)
Reinforcement
diameter
(mm) /
ratio (%)
Concrete
cylinder
strength fck/
cube strength
fcu (N/mm2)
B4A1 1100 500 800 300 2.31 1.56 1 12 /1.137% 16.2/20.3
B4A2 950 500 650 300 2.31 1.18 1 12 /1.137% 17.4/21.8
B4A3 850 500 550 300 2.31 0.93 1 12 /1.137% 19.4/24.3
B4A4 800 500 500 300 2.31 0.81 1 12 /1.137% 19.5/24.4
B4A5 700 500 400 300 2.31 0.56 1 12 /1.137% 18.4/23.0
B4B1 950 500 650 300 2.31 1.18 1 10 /0.786% 15.6/19.5
B4B2 950 650 650 450 3.46 1.18 0.908 10 /0.786% 20.5/25.6

Bloodworth Cao & Xu
23
B4B3 950 750 650 550 4.23 1.18 0.787 10 /0.786% 19.8/24.7
B4B4 950 900 650 700 5.38 1.18 0.67 10 /0.786% 16.8/21.0

Bloodworth Cao & Xu
24
Table 2 Comparison of the failure loads between experiments and FEA
Pile cap Ref.
Failure load in experiments
V (kN)
Prediction by
FEA
(kN)
Ratio failure load in
FEA to experiments
B4A1 592 632 1.07
B4A2 548 820 1.50
B4A3 919 1008 1.10
B4A4 1052 1064 1.01
B4A5 1244 1244 1.00
B4B1 622 605 0.97
B4B2 713 812 1.14
B4B3 769 924 1.20
B4B4 1048 1040 0.99

Figure 1 RC four-pile cap under a full-width wall loading
d hc
av
Wall loading
h
b
L
ly hp
0.2hp
lx
ho
dp
Longitudinal
Transverse
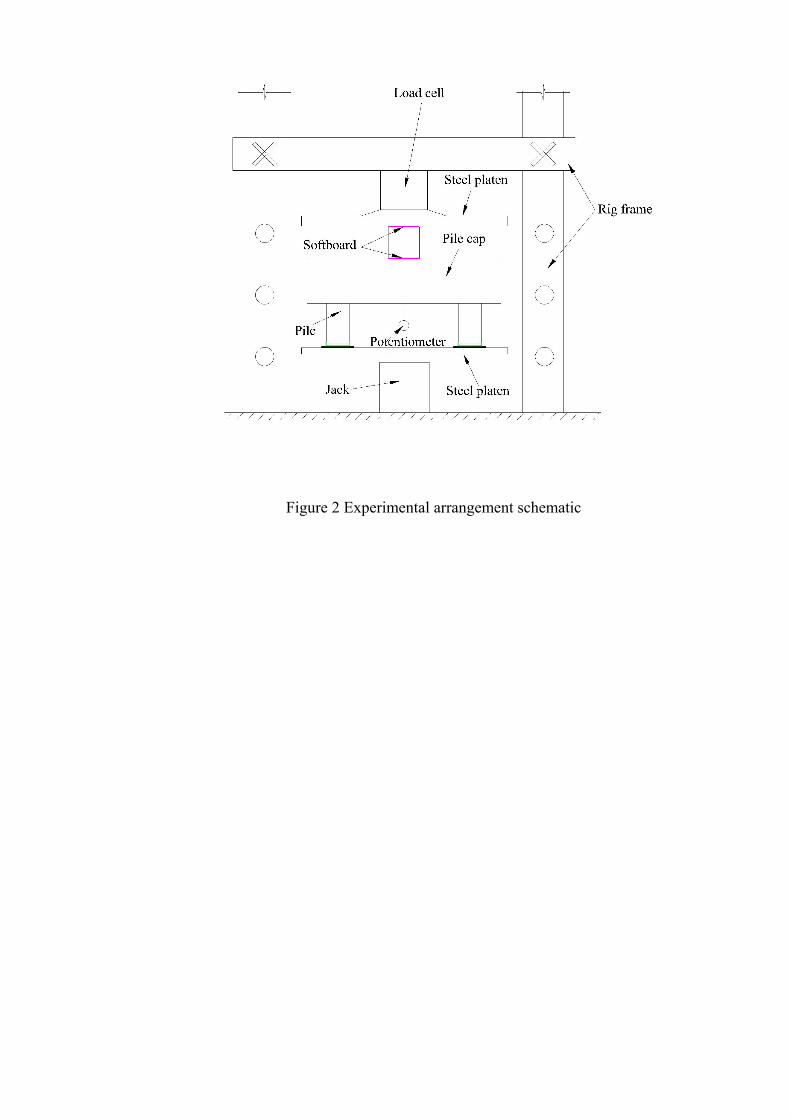
Figure 2 Experimental arrangement schematic

Figure 3 Geometry and mesh division of FEA model of a quarter pile cap
Reinforcement layer
Prescribed displacement
Vertical support
Cut surface
Cut surface

Figure 4 Constitutive relation of concrete in tension

0
100
200
300
400
500
600
700
800
0.0 0.5 1.0 1.5 2.0 2.5 3.0 3.5
Deflection of the soffit centre (mm)
Ext
erna
l loa
d (k
N)
0.000311 0.0007 0.001 0.003 (energy based)0.006 Experimental load-displacement curve
Figure 5 Sensitivity of load-displacement curve to values of ultimate crack strain cr
ultε for cap B4A1

Considerable Bending Crack
Diagonal tensile shear failure
Hogging cracks above pile head
Tail of shear crack sweeping across pile
head
(a) Crack pattern on front surface observed in experiment
(b) Crack distribution on front surface in FEA
Figure 6 Comparison of crack patterns from experiment and FEA with basic parameters at failure for cap B4A1 (av/d = 1.56)
CL
CL
Crack strain εcr

Figure 7 Longitudinal reinforcement stress sxσ at failure for cap B4B2 (μ = 3.4, av/d = 1.18)
N/mm2
Cap front surface
Longitudinal
Transverse

Figure 8 Transverse reinforcement stress syσ at failure for cap B4B3
(μ = 4.2, av/d = 1.18)
N/mm2

(a) contour of von Mises stress vσ
(b) contour of cracking strain crε on front surface
Figure 9 Strut-and-tie behaviour at the onset of yield for cap B4A4
(μ = 2.3, av/d = 0.81)
Equivalent compressive strut
N/mm2
CL
CL

Range of experimental samples
Longitudinal
pile spacing
lx (mm)
)(dav
Transverse pile spacing ly (mm)
(μ)
150
(1.15)
200
(1.54)
260
(2.00)
300
(2.31)
350
(2.69)
390
(3.00)
500
(3.84)
600
(4.62)
800
(6.15)
1000
(7.69)
1200
(9.23)
300 (0.31)
350 (0.43)
390 (0.53)
500 (0.81)
600 (1.06)
800 (1.56)
1000 (2.06)
1200 (2.56)
Figure 10 Occurrence of shear or bending failure as indicated by cracking on cap front
surface for models in parametric study (All dimensions in mm)
Shear failure
Bending failure
300
390
600
1000
0300600900
1200150018002100240027003000
lx (mm)
Failure load V (kN)
ly (mm)
Figure 11 Variation of failure load V for models in parametric study against longitudinal pile spacing lx and transverse pile spacing ly

0
2
4
6
8
10
12
av/d
v (N/mm2)
A (β)
Figure 12 Variation of average shear stress v with A and av/d for models in parametric study

Figure 13 Bending failure shown by crack strain crε on front surface of cap with
μ = 9.23, av/d = 2.56

Figure 14 Longitudinal reinforcement stress sxσ at failure for cap with μ = 9.23, av/d = 2.56
N/mm2

Longitudinal
pile spacing
lx (mm)
)(dav
Transverse pile spacing ly (mm)
(μ)
500
(3.84)
600
(4.62)
800
(6.15)
1000
(7.69)
1200
(9.23)
300 (0.31)
350 (0.43)
390 (0.53)
500 (0.81)
600 (1.06)
800 (1.56)
1000 (2.06)
Longitudinal reinforcement not
yielded on whole cap width
Figure 15 Occurrence of yielding longitudinal reinforcement on the whole cap width
at midspan for models in parametric study (All dimensions in mm)
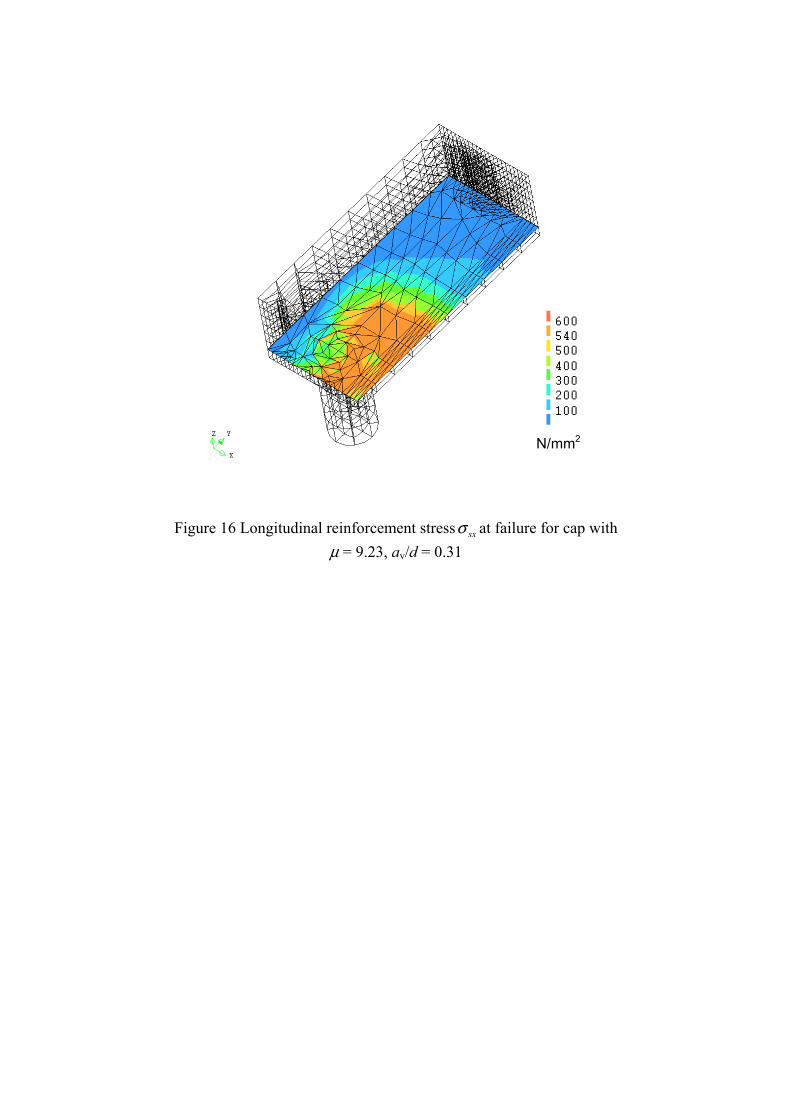
Figure 16 Longitudinal reinforcement stress sxσ at failure for cap with μ = 9.23, av/d = 0.31
N/mm2

Figure 17 Longitudinal reinforcement stress sxσ at failure for cap with μ = 4.62, av/d = 0.43
N/mm2

Figure 18 Transverse reinforcement stress syσ at failure for cap with μ = 6.15, av/d = 0.43
N/mm2

00.30.60.91.21.51.82.12.42.7
av/d
βBS8110S
A (μ)
Figure 19 Variation of SBS8110β with A and av/d for 88 models in parametric study ( 1=mγ )

Figure 20 Proposed modified strut-and-tie model shown for a ¼ pile cap
d
)9.0(21
sy Af 2b
F41
Reinforcement level cx hl41
21 −
A
C
Fs
F41
z
α
γ

0.00.10.20.30.40.50.60.70.80.91.01.11.21.3
av/d
βnSTM
A (μ)
Range of experimental samples
Region of βnSTM < 1.0
Figure 21 Variation of nSTMβ with A and av/d for 88 models in parametric study ( 1=mγ )