original article a systematic approach to therapeutic ... · original article a systematic approach...
TRANSCRIPT

ORIGINAL ARTICLE
A systematic approach to therapeutic targetselection in oesophago-gastric cancerAnna L Paterson,1 Nicholas B Shannon,1 Pierre Lao-Sirieix,1 Chin-Ann J Ong,1
Christopher J Peters,1 Maria O’Donovan,1,2 Rebecca C Fitzgerald1
▸ Additional materials arepublished online only. To viewthese files please visit thejournal online (http://dx.doi.org/10.1136/gutjnl-2012-302039).1MRC Cancer Cell Unit,Hutchison-MRC ResearchCentre, Cambridge, UK2Department of Pathology,Addenbrooke’s Hospital,Cambridge, CB2 0QQ, UK
Correspondence toDr Rebecca C Fitzgerald, MRCCancer Cell Unit, Hutchison/MRC Research Centre, HillsRoad, Cambridge CB2 0XZ,UK; [email protected]
Revised 7 June 2012Accepted 9 June 2012Published Online First6 July 2012
To cite: Paterson AL,Shannon NB, Lao-Sirieix P,et al. Gut 2013;62:1415–1424.
ABSTRACTObjective The success of personalised therapy dependson identification and inhibition of the oncogene(s) onwhich that tumour is dependent. We aimed to determinewhether a receptor tyrosine kinase (RTK) array could beused to select the most effective therapeutic strategies inmolecularly heterogeneous oesophago-gastricadenocarcinomas.Design Gene expression profiling from oesophago-gastric tumours (n=75) and preinvasive stages (n=57)identified the active signalling pathways, which wasconfirmed using immunohistochemistry (n=434). RTKarrays on a cell line panel (n=14) determined therapeutictargets for in vitro cytotoxic testing. Feasibility of thispersonalised approach was tested in tumour samples(n=46).Results MAPK was the most frequently activatedpathway (32/75 samples (42.7%)) with progressiveenrichment in preinvasive disease stages (p<0.05) andERK phosphorylation in 148/434 (34.3%) independentsamples. Cell lines displayed a range of RTK activationprofiles. When no RTKs were activated, tyrosine kinaseinhibitors (TKIs) and a Mek inhibitor were not useful(MKN1). In lines with a dominant phosphorylated RTK(OE19, MKN45 and KATOIII), selection of this TKI orMek in nM concentrations induced cytotoxicity andinhibited Erk and Akt phosphorylation. In cells lines withcomplex activation profiles (HSC39 and OE33), acombination of TKIs or Mek inhibition (in nMconcentrations) was necessary for cytotoxicity andinhibition of Erk and Akt phosphorylation. Humantumours demonstrated diverse activation profiles and65% of cases had two or more active RTKs.Conclusions The MAPK pathway is commonlyactivated in oesophago-gastric cancer followingactivation of a variety of RTKs. Molecular phenotypingcan inform a rational choice of targeted therapy.
INTRODUCTIONOesophageal and gastric cancers, combined, are theleading causes of cancer worldwide, with over 1390 000 diagnoses per annum.1 By 2030, gastriccancer is predicted to be the 10th leading cause ofglobal mortality.2 In the Westernised world, theincidence of oesophageal carcinoma has increasedover fivefold in 30 years.3 4 The late presentationof tumours together with their chemo-resistantnature contribute to the dismal 15% 5-year sur-vival.5 New therapeutic strategies are thereforerequired.
Recent trials of combinations of cytotoxic ther-apies have at best resulted in modest incrementalimprovements in survival; 6–9however, the addition
Editor’s choiceScan to access more
free content
Significance of this study
What is already known on this subject?▸ Molecularly targeted therapies are improving
outcomes in some cancers.▸ For most cancer types, only a small proportion
of patients will benefit from any given antibodyor small molecular inhibitor.
▸ Selection of the appropriate drug for anindividual patient is challenging given themolecularly heterogeneous nature of manyepithelial cancers.
▸ Oesophago-gastric adenocarcinomas have pooroutcomes and the application of molecularlytargeted therapy lags behind that of othercancers.
What are the new findings?▸ The MAPK pathways is frequently activated in
oesophago-gastric adenocarcinoma andconstitutively active receptor tyrosine kinases(RTKs) can be identified on a per patient basisusing RTK arrays.
▸ Application of specific targeted therapy(s)based on individualised RTK profiling iseffective in vitro.
▸ Targeting the downstream inhibitor Mek forcases with MAPK activation may be analternative strategy to targeting the RTK in thisdisease.
How might it impact on clinical practice inthe foreseeable future?▸ For molecularly heterogeneous cancers, target
selection could be individualised usingapplications such as receptor tyrosine kinase(RTK) arrays.
▸ In oesophago-gastric cancers, RTK and MAPKpathway inhibitors warrant furtherinvestigation.
▸ Innovative clinical trial designs in which one ofa panel of drugs can be selected depending onthe individual molecular phenotype are neededto advance the concept of personalisedmedicine.
Paterson AL, et al. Gut 2013;62:1415–1424. doi:10.1136/gutjnl-2012-302039 1415
Upper GI cancer
on March 23, 2020 by guest. P
rotected by copyright.http://gut.bm
j.com/
Gut: first published as 10.1136/gutjnl-2012-302039 on 6 July 2012. D
ownloaded from

of a targeted agent inhibiting a defined molecular abnormalitymay result in dramatic improvements.10 11 The rationale forthese individualised regimens is centred on the theory of onco-gene dependence which proposes that a single or small numberof abnormalities are key drivers of cancer cell growth and main-tenance;12 if identified and silenced, a period of oncogenicshock ensues resulting in tumour regression.13 14 Despite theirconsiderable promise, this approach has not been broadlyadopted in the management of epithelial malignancies becauseof considerable inter-patient heterogeneity despite the activationof common signalling pathways.15
The identification in each cancer for the presence of a single,specific molecular abnormality prevalent in a given tumour typefor which an inhibitor is available would improve the efficacy oftargeted therapy. The identification of ErbB2 is used clinically inpatients with breast or gastric tumours16 and EGFR mutationsin specific situations in lung tumours.17 18 However, focusingon a single target significantly limits the therapy to the 15%–
20% of patients with this abnormality; furthermore, it fails toidentify those with additional molecular abnormalities whichwould confer resistance to therapy.19 For personalised therapyto benefit a greater proportion of patients and to overcomeresistance mechanisms, a broader panel of targets could be char-acterised at initial presentation. Such a panel would evolve fromsystematic approaches to screen a range of candidates for identi-fication of therapeutic target(s) such as the mutation profiling of12 genes in lung cancer.20 For many cancers, includingoesophago-gastric cancer, the comprehensive list of mutations isnot yet clear. Furthermore, the constitutive activation of recep-tor tyrosine kinases (RTKs) can result from a translocation and/or amplification event at the genomic level as well as from muta-tion requiring more than one type of assay for analysis.Determining RTK activation status by assaying phosphorylationmight be an alternative way to determine the optimal thera-peutic approach.
The aims of this study were therefore to: (1) determine themost frequently active cell signalling pathways, (2) evaluatewhether an RTK array measuring phosphorylation status couldbe used to select the most effective and broadly applicable thera-peutic strategies in a panel of disease specific cell lines and (3)apply this approach to human tissue samples as proof ofprinciple.
METHODSHuman samplesThe work using human tissue was covered by relevant institu-tion ethics approvals (MREC number 07/H0305/52) andinformed consent was obtained in all cases.
Tissue microarrays (TMAs) of oesophageal and gastricsamples (n=434) were generated21 (demographics in table S1for samples in the TMA). An expert gastrointestinal pathologistselected three separate cores for each case. All other human spe-cimens were collected prospectively at Addenbrooke’s Hospital,Cambridge, UK (see table S1 for demographics).
Gene expression datasetsCancer cohortThe methods for expression array analysis for oesophago-gastricadenocarcinoma samples (n=75) have been described elsewhere(demographics in table S1).21
Progression cohortFor mRNA isolation and gene expression profiling, a section wastaken from each frozen specimen for consensus histopathological
diagnosis from two expert gastrointestinal pathologists. Sampleswith a minimum of 50% of the asserted diagnosis were used(normal oesophagus (n=6), Barrett’s oesophagus (n=21), dysplas-tic Barrett’s oesophagus (n=30 including high-grade and lowgrade dysplasia) and oesophageal cancer (n=8)). The methods forexpression array analysis for oesophago-gastric adenocarcinomasamples (n=75) have been described elsewhere.22
Cell lines and reagentsOur cell line panel was derived from primary tissues and con-sisted of the Barrett’s oesophagus lines ChTert and QhTert (giftfrom P Rabinovicth);23the oesophageal adenocarcinoma lines,Flo (gift from D Beer24), OACp4, OACM5.1 and OC3 (giftfrom W Dinjens25), OE33, OE19 (ECACC), PT1590 (gift fromC Klein26) and Jh-Eso-Ad1 (gift from A Maitra27); as well as thegastric adenocarcinoma lines KatoIII, MKN45, MKN1 (giftsfrom A Kistimaki28) and HSC39 (gift from K Yanagihara29)(table S2). The identity of Flo, OACp4, OACM5.1, OE33,OE19 and Jh-Eso-Ad1 has been previously verified.30 All celllines were cultured in RPMI medium (Sigma-Aldrich,Gillingham, UK) with 10% fetal calf serum (PAA, Yeovil, UK)except for KatoIII which required 20% fetal calf serum andOC3 and Flo which were grown in DMEM (Gibco, Invitrogen,Paisley, UK).
The EGFR/ErbB2 inhibitor (Lapatinib, Tykerb) and the Mekinhibitor (compound GSK1120212B) were provided byGlaxoSmithKline while other tyrosine kinase inhibitors (TKIs)were purchased: EGFR TKI (Erlotinib, Xing ChengChempharm, Taizhou, China), Met TKI (PD0325901;Biovision, Cambridge, UK), FGFR TKI (PD173074;Sigma-Aldrich) and Ret TKI (SU5416; Calbiochem, Merck,Nottingham, UK). TKIs were diluted to working concentrationsin DMSO (Sigma-Aldrich, Cat n#D8418) and all treatmentassays were carried out using serum supplemented medium toreduce the background stress on the cells.
GSEA and HOPACH clusteringGene set enrichment analysis (GSEA) determines whether adefined set of genes correlates with a particular phenotypewithin microarray data. GSEA was performed using the GSEAsoftware (http://www.broad.mit.edu/gsea/index.jsp) using thenormalised score from the cancer and the progression cohorts.The KEGG and Biocarta signalling pathways selected from themolecular signatures database (MSigDB; http://www.broadinstitute.org/gsea/msigdb/index.jsp) were used as gene sets.A statistical significance of p<0.05 based on normalised enrich-ment score was required for a sample to be considered asenriched for a particular pathway. The normalised enrichmentscore is the primary statistic for examining gene set enrichmentresults. By normalising the enrichment score, GSEA accountsfor differences in gene set size and in correlations between genesets and the expression dataset; therefore, the normalisedenrichment scores can be used to compare analysis results acrossgene sets.
The hierarchical ordered partitioning and collapsing hybrid(HOPACH) package31 implemented in bioconductor (http://bioconductor.org) was used to cluster samples using pathwayenrichment scores. A similarity matrix for samples was gener-ated from the distance matrix used to cluster samples. Theresult of clustering was visualised in the Maple Tree program(http://mapletree.sourceforge.net/).
1416 Paterson AL, et al. Gut 2013;62:1415–1424. doi:10.1136/gutjnl-2012-302039
Upper GI cancer
on March 23, 2020 by guest. P
rotected by copyright.http://gut.bm
j.com/
Gut: first published as 10.1136/gutjnl-2012-302039 on 6 July 2012. D
ownloaded from

Immunohistochemistry for P-ERKImmunohistochemistry was performed on a BondMax autostainer(Leica, Milton Keynes, UK) using an antibody against P-Erk (CellSignalling, Hitchin, UK).21 Each of the triplicate TMAs was scoredfor nuclear P-Erk based on intensity (1+ for weak, 2+ formedium and 3+ for strong) of staining. Data are presented as afinal binary score where Erk was considered inactive for scores of0 and 1+ and active for scores of 2+ and 3+.
RTK phosphorylation profilingRTK membrane arrays (R&D systems, Abingdon, UK) covering42 of the 58 human RTKs were used to profile individualtumours and cell lines (complete array map in figure 3B). Snapfrozen tumour samples were homogenised in ice cold lysisbuffer (50 mM tris-HCl, 1% triton X-100, 10% glycerol, 1 mMphenylmethylsulfluoride, 100 mM sodium fluoride, sodiumpyrophosphate, protease and phosphatase inhibitor tablets(Roche, Welwyn Garden City, UK)). Cell lines were washed inphosphate buffered saline (PBS) and grown in serum-freemedium for 24 h before harvest. In all, 250 μg of cell lineprotein or 1–2 mg of protein were incubated with the mem-brane array (R&D Systems) following the manufacturer’sinstructions.
Proliferation assaysA total of 1000 cells (in 96 well-plate) were grown for 24 h incomplete media and then treated with a TKI at a range of con-centrations for 72 h. Cell proliferation was assessed using theCellTitreGlo assay (Promega, Southampton, UK). When combi-nations of TKIs were used, the concentration of the TKI inhibit-ing the most active RTK was used across a broad concentrationrange while the concentration of TKI(s) against the remainingRTKs was held constant at 1 μM.
Apoptosis assaysCleaved caspase 3/7 assay and flow cytometry were run for allsingle drug targets with IC50 in the nm range and using TKIcombinations if they had been significantly better at suppressingcell proliferation than single TKI treatment.
Cells were seeded as described for proliferation assays. TheCaspase 3/7 Glo assay (Promega) was used.
For cell cycle analysis, cells were grown for 24 h in completemedia, treated with a specific TKI in complete medium for 24,48 and 72 h, harvested by trypsinisation, washed in PBS, fixedin ice cold 70% ethanol and stored at −20°C. Cells were thenwashed in PBS and incubated with 4 μg/ml RNase at 37°C for1 h before addition of 10 mM propidium iodide and processedusing an LSR II instrument with FACSDiva software (BDBiosciences, Oxford, UK).
Protein phosphorylation statusAntibodies for EGFR, P-EGFR, ErbB2, P-ErbB3, Met, P-Met, Ret,P-Ret, Akt, P-Akt, ERK, P-ERK and β-actin were purchased fromCell Signalling. The P-ErbB2 antibody was from Thermo FisherScientific; FGFR2 and P-FGFR antibodies were from R&DSystems; and the ErbB3 antibody was from DAKO, Ely, Surrey,UK.
Cells were cultured for at least 24 h and then treated with aspecific TKI or TKI combination for 8 h in serum supplementedmedium. Cells were harvested in ice cold lysis buffer as outlinedabove. In all, 40 μg of protein was used for western blotting fol-lowing standard procedures. Separate blots from a single proteinextraction were run for each protein species.
Figure 1 MAPK pathway is the most overenriched pathway inoesophago-gastric cancers. Hierarchical ordered partitioning andcollapsing hybrid clustering (A) was applied to the enrichment scoresfor the KEGG signalling pathway in the cohort of 75 cancer samples.The distance matrix allows visualisation of the similarity of geneexpression: red represents close proximity and white a large distance.Clusters with similar expression appear as blocks on the diagonal axis;solid lines indicate a stable cluster of samples enriched foroverexpression of signalling pathway genes (n=38/75, indicated in thehighlighted box). The signalling pathways on the KEGG database whichwere statistically enriched in the cancer dataset are shown in order offrequency (B). Pathways signalling through the MAPK pathway (hashedbars), including ErbB2 and Toll-like receptor which the KEGG databaseannotates separately, represent the most enriched pathways inoesophago-gastric cancers. The dashed line shows those pathwaysenriched in >25% cases. The six pathways enriched in more than 25%of the samples from the cancer cohort (above dashed line in panel B)were then examined in a progression cohort (C) consisting of samplesfrom normal oesophagus (NE) (n=6), Barrett’s oesophagus (BE) (n=21),dysplastic Barrett’s (DYS) (n=30) and adenocarcinoma (AC) (n=8).
Paterson AL, et al. Gut 2013;62:1415–1424. doi:10.1136/gutjnl-2012-302039 1417
Upper GI cancer
on March 23, 2020 by guest. P
rotected by copyright.http://gut.bm
j.com/
Gut: first published as 10.1136/gutjnl-2012-302039 on 6 July 2012. D
ownloaded from

Statistical analysisCell proliferation, caspase activation and cell cycle analyses wereperformed using GraphPad Prism statistical software (version 3;La Jolla, California, USA). In all cases, the mean of three bio-logical replicates, each with at least three technical replicates,was calculated with the corresponding SD. Where appropriate,curves of best fit were used to calculate an inhibitory concentra-tion 50 (IC50) value for TKI treatment. The effects of differenttreatments were determined using ANOVA with Bonferronicorrection.
RESULTSThe mitogen activated protein kinase (MAPK) pathway is anenriched pathway in oesophageal and gastricadenocarcinomasHOPACH clustering was performed to visualise groups withsimilar GSEA enrichment scores in a cohort of 75 largelychemo-naive patients with oesophago-gastric junction (GOJ)malignancies (demographics in table S1)21 for signalling path-ways denoted in the Kyoto Encyclopedia of Genes andGenomes (KEGG) and Biocarta databases (figure 1A). A largegroup (38/75, 50.7%) of samples enriched for overexpression ofsignalling pathway genes was identified (p<0.001), and wasmore stable than the non-overenriched groups using non-parametric bootstrap resampling (n=10 000) (figure 1A).
The signalling pathways from KEGG displaying statisticallysignificant enrichment in the case cohort (p<0.05) are displayedin figure 1B. The MAPK pathway was statistically enriched inthe highest number of samples (32/75 samples, 42.7%). ThreeMAPK related pathways (MAPK, ErbB2 and Toll-like receptor),out of the 21 statistically enriched pathways, were relevant in80% of samples. The same analysis was performed using path-ways from the Biocarta database and six out of the top 20(30%) statistically enriched pathways (MAPK, EGF, PDGF, p38,Erk and Akt) were found to contribute to the MAPK pathway(data not shown). If oesophageal and gastric cancers were con-sidered separately, the MAPK related pathways remained themost commonly enriched pathway suggesting that tumours from
adjacent anatomical sites, including around the GOJ, havesimilar pathway dependence.
Signalling pathways are not independent and therefore somecaution must be exercised in determining the importance ofindividual pathways from these analyses. However, if pathwaysare biologically important, the frequency of their enrichmentshould increase progressively over the pathogenesis of thedisease. To examine this, enrichment of KEGG pathways,known to be relevant in more than 25% of cancer cases in themicroarray analysis (MAPK, GNRH, ErbB2, insulin, Wnt, phos-phatidyl inositol and calcium which are displayed above thedotted line in figure 1B), were assessed in samples representativeof the pathogenic stages of oesophageal and GOJ adenocarcin-oma (normal squamous oesophagus, Barrett’s metaplasia,Barrett’s with dysplasia and adenocarcinoma). MAPK and Wntwere the only pathways with progressive enrichment over theprogression continuum (p<0.05, figure 1C). While the Wntpathway is interesting in itself and has a known role in coloniccarcinogenesis,32 it is not easily targetable by drugs at present.We therefore focused our efforts on the MAPK pathway.
Phospho-Erk status confirms MAPK as a key pathwayThe importance of the activation status of the MAPK pathway,measured by phospho-Erk immunostaining, was confirmed in alarge independent cohort of 434 cases of oesophageal andgastric adenocarcinomas (figure 2A, demographics in tableS1).21 In all, 148/434 (34.3%) of cases expressed high levels ofphosphorylated Erk (2+, 3+) (figure 2B). This is in the samerange of the samples displaying MAPK pathway enrichment(42.7%) from our expression profiling data.
Constitutive phosphorylation of Erk may also be a conse-quence of a single base substitution in codon 12 or 13 of RAS;however, no mutations were identified in a subset of 67 samplesfrom the cancer cohort (data not shown).
Selective inhibition of activated RTKs inhibits MAPKsignalling, cell growth and results in a loss of cell viabilityWe next profiled a panel of 14 oesophageal and gastric cell linesusing an RTK array (table S2 and examples of arrays are shown
Figure 2 MAPK pathway activationis driven by multiple active receptortyrosine kinases (RTKs). MAPKactivation was confirmed by examiningP-Erk status in 434 samples on a tissuemicroarray (A). Two representativecases, one with P-Erk and one lackingP-Erk are shown. Percentage of the434 cases with and without P-Erk (B).
1418 Paterson AL, et al. Gut 2013;62:1415–1424. doi:10.1136/gutjnl-2012-302039
Upper GI cancer
on March 23, 2020 by guest. P
rotected by copyright.http://gut.bm
j.com/
Gut: first published as 10.1136/gutjnl-2012-302039 on 6 July 2012. D
ownloaded from

in figures 3–5). To determine whether RTK profiling could beused to infer therapeutic decisions, relevant TKIs were selectedbased on the RTK profile. Inhibition of the downstream MAPKcomponent Mek was also performed since resistance to RTKinhibition develops clinically and so alternative approaches needto be pursued. A range of RTK profiles were seen in the celllines and varied from no RTK activation, MKN1 (figure 3A), toone dominant active RTK in OE19, MKN45 and KATOIII(figure 4A–C) and highly complex profiles with multiple activeRTKs in HSC39 and OE33 (figure 5A,B).
For each cell line, TKIs were used singly or in combinationon the basis of the RTK activity profile to establish whetherRTK(s) could be predicted to be critical for cell proliferationand survival on a case by case basis. The complete experimentaldata are shown in table 1.
In MKN1, with no active RTKs, TKIs or Mek inhibition didnot inhibit proliferation until the μM range (figure 3C).
A single TKI targeting the most highly phosphorylated RTK(EGFR/ErbB2 for OE19, Met for MKN45 and FGFR for KatoIII;figure 4A–C) in cells with a simple RTK profile inhibited prolifer-ation with IC50 of 100 nM (95% CI 39 to 120) for OE19, 5.6 nm(95% CI 4.0 to 7.7) for MKN45 and 4.8 nM (95% CI 3.4 to 6.7)for KatoIII (figure 4D–F). This was accompanied by a cytotoxic
effect with an increased subG0 fraction in OE19 and a cytostaticeffect with an increased G0/G1 fraction in MKN45 and KatoIIItogether with a fourfold increase in caspase 3/7 activity in OE19and a twofold increase in MKN45 and KatoIII at 24 h (figure 4G–Iand table 2). Alternatively, the use of a Mek inhibitor was also suffi-cient to inhibit proliferation with IC50 values of 95 nM (95% CI34 to 263) for OE19, 14 nM (95% CI 0.4 to 46) for MKN45 and5.8 nM (95% CI 3.9 to 8.4) (figure 4D–F). Apoptosis was alsoinduced with a cytotoxic effect in OE19 and cytostatic effect inMKN45 and KatoIII by 24 h (figure 4G–I). These effects corre-lated with the abrogation of Erk phosphorylation at a TKI or Mekinhibitor concentration comparable with the IC50 (figure 4J–L).However, loss of Akt phosphorylation was only seen for the TKIand but not for Mek inhibition (figure 4J–L). The addition offurther TKIs to inhibit RTKs coactivated at a lower level had nocumulative effect; and when used alone had little efficacy (table 1).This finding was in keeping with the failure of these additionalTKIs to suppress downstream pathway activity, especially phos-phorylation of ERK and Akt (table 1).
HSC39, with constitutive activation of four RTKs (EGFR,ErbB3, FGFR2 and Met), demonstrated a different response toRTK inhibition (figure 5A). First, HSC39 was sensitive to asingle TKI targeting the most highly active RTK alone, FGFR2.
Figure 3 Receptor tyrosine kinase(RTK) inhibition is ineffective ininducing cell death in a cell linewithout RTK activation. MKN1 RTKactivation profile (A) and full RTK arraymap (B). Each RTK is represented induplicate on the array and each dot inthe four corners is a loading control. Anumber of negative controls areincluded: IgG1, IgG2A and IgG2B aremouse-IgG controls, IgG is a goatcontrol and a PBS control. Theproliferation dose–response of MKN1to tyrosine kinase inhibitors is shownin (C). Data are presented as median(±95% CIs) as a percentage of DMSOtreated cells.
Paterson AL, et al. Gut 2013;62:1415–1424. doi:10.1136/gutjnl-2012-302039 1419
Upper GI cancer
on March 23, 2020 by guest. P
rotected by copyright.http://gut.bm
j.com/
Gut: first published as 10.1136/gutjnl-2012-302039 on 6 July 2012. D
ownloaded from

The FGFR2 inhibitor resulted in a dramatic reduction in prolif-eration with an IC50 of 5.9 nM (95% CI 4.8–7.3 nM, figure5C, table 1); a cytotoxic effect (figure 5E) and a fivefoldincrease in caspase 3/7 activation within 24 h (table 2); and sup-pressed phosphorylation of ERK and Akt (figure 5G, table 1). Asimilar effect was seen with Mek inhibition although 72 h incu-bation was necessary to have the cytotoxic effect (data notshown). Treatment with single TKIs targeting the other coacti-vated RTKs had negligible effects (figure 5C,E, table 1).However, in contrast to the previous cell lines, a combination of
TKIs to target FGFR2, EGFR, ErbB2 and Met, which were allconstitutively active in HSC39, was significantly better thanFGFR2 inhibition alone, though the absolute benefit was small(figure 5C,E and table 1).
OE33 displayed a complex activation map with six constitu-tively active RTKs: EGFR, ErbB2, ErbB3, FGFR3, Met and Ret(figure 5B). Treatment with a single TKI against any of theseRTKs failed to inhibit proliferation unless doses in the μMrange were used (figure 5D) and none fully abrogated ERK orAkt phosphorylation (table 1, figure 5H). However, the
Figure 4 Single tyrosine kinase inhibitors (TKIs) or Mek inhibition, identified from receptor tyrosine kinase (RTK) array, are sufficient to induce celldeath and downstream targets loss of phosphorylation in OE19, MKN45 and KatoIII. RTK activation profile (A–C), proliferation dose–response toTKIs (D–F), cell cycle profile in response to TKIs (G–I) and western blotting for downstream MAPK components Atk and ERK ( J–L) for OE19, MKN45and KatoIII. Each active RTK is numbered with the corresponding name indicated below the membranes and each pair of dots in the four corners isloading controls. Proliferation and cell cycle profiles were performed following treatment with a variable concentration of TKIs (alone or incombination). Data are presented as median (±95% CIs) as a percentage of DMSO treated cells. Only the single inhibitors and the bestcombinations are presented; a full summary of all is given in table 1.
1420 Paterson AL, et al. Gut 2013;62:1415–1424. doi:10.1136/gutjnl-2012-302039
Upper GI cancer
on March 23, 2020 by guest. P
rotected by copyright.http://gut.bm
j.com/
Gut: first published as 10.1136/gutjnl-2012-302039 on 6 July 2012. D
ownloaded from
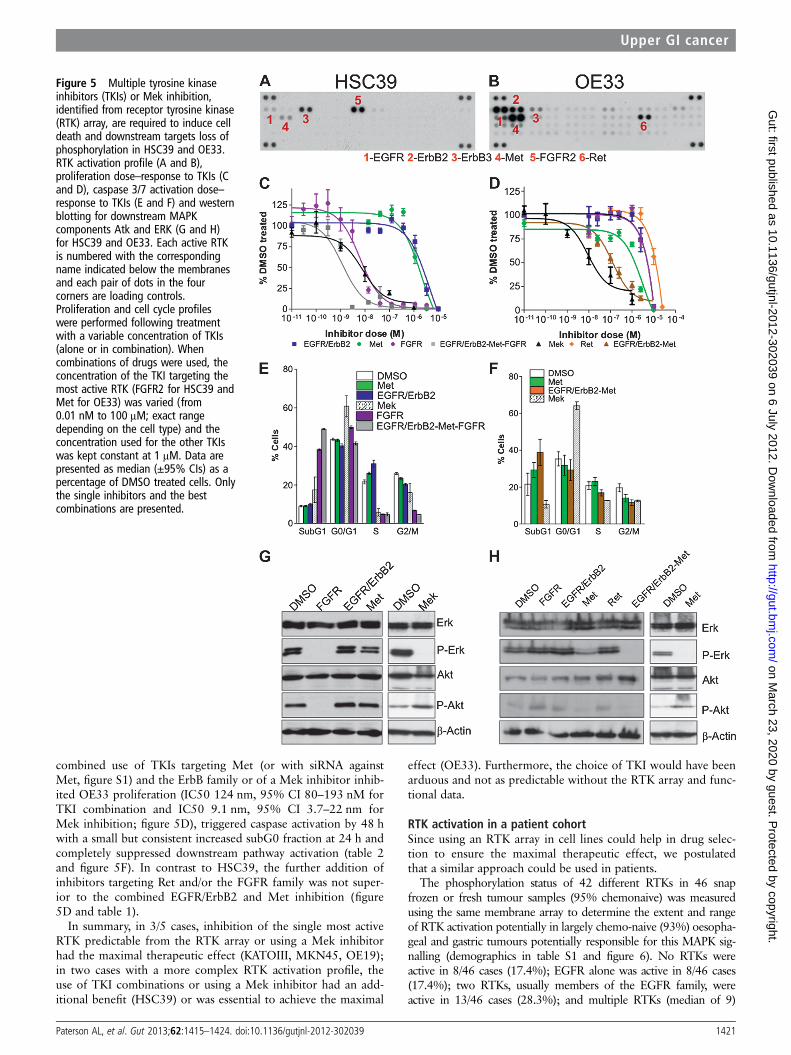
combined use of TKIs targeting Met (or with siRNA againstMet, figure S1) and the ErbB family or of a Mek inhibitor inhib-ited OE33 proliferation (IC50 124 nm, 95% CI 80–193 nM forTKI combination and IC50 9.1 nm, 95% CI 3.7–22 nm forMek inhibition; figure 5D), triggered caspase activation by 48 hwith a small but consistent increased subG0 fraction at 24 h andcompletely suppressed downstream pathway activation (table 2and figure 5F). In contrast to HSC39, the further addition ofinhibitors targeting Ret and/or the FGFR family was not super-ior to the combined EGFR/ErbB2 and Met inhibition (figure5D and table 1).
In summary, in 3/5 cases, inhibition of the single most activeRTK predictable from the RTK array or using a Mek inhibitorhad the maximal therapeutic effect (KATOIII, MKN45, OE19);in two cases with a more complex RTK activation profile, theuse of TKI combinations or using a Mek inhibitor had an add-itional benefit (HSC39) or was essential to achieve the maximal
effect (OE33). Furthermore, the choice of TKI would have beenarduous and not as predictable without the RTK array and func-tional data.
RTK activation in a patient cohortSince using an RTK array in cell lines could help in drug selec-tion to ensure the maximal therapeutic effect, we postulatedthat a similar approach could be used in patients.
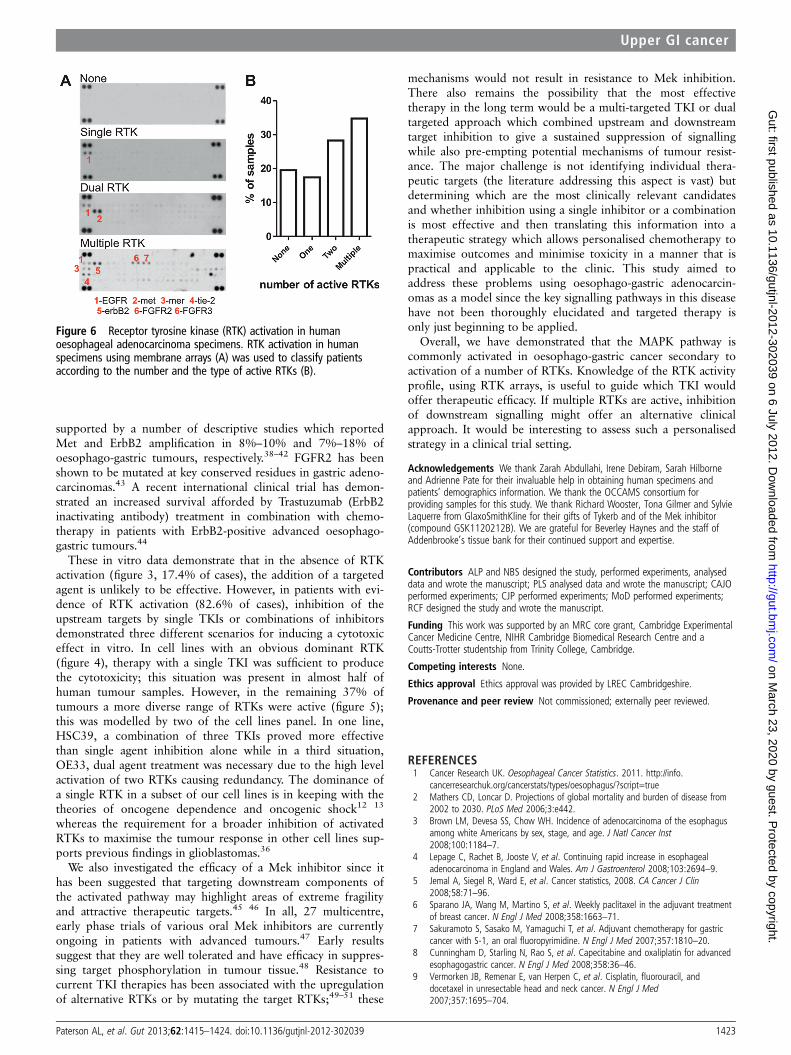
The phosphorylation status of 42 different RTKs in 46 snapfrozen or fresh tumour samples (95% chemonaive) was measuredusing the same membrane array to determine the extent and rangeof RTK activation potentially in largely chemo-naive (93%) oesopha-geal and gastric tumours potentially responsible for this MAPK sig-nalling (demographics in table S1 and figure 6). No RTKs wereactive in 8/46 cases (17.4%); EGFR alone was active in 8/46 cases(17.4%); two RTKs, usually members of the EGFR family, wereactive in 13/46 cases (28.3%); and multiple RTKs (median of 9)
Figure 5 Multiple tyrosine kinaseinhibitors (TKIs) or Mek inhibition,identified from receptor tyrosine kinase(RTK) array, are required to induce celldeath and downstream targets loss ofphosphorylation in HSC39 and OE33.RTK activation profile (A and B),proliferation dose–response to TKIs (Cand D), caspase 3/7 activation dose–response to TKIs (E and F) and westernblotting for downstream MAPKcomponents Atk and ERK (G and H)for HSC39 and OE33. Each active RTKis numbered with the correspondingname indicated below the membranesand each pair of dots in the fourcorners are loading controls.Proliferation and cell cycle profileswere performed following treatmentwith a variable concentration of TKIs(alone or in combination). Whencombinations of drugs were used, theconcentration of the TKI targeting themost active RTK (FGFR2 for HSC39 andMet for OE33) was varied (from0.01 nM to 100 μM; exact rangedepending on the cell type) and theconcentration used for the other TKIswas kept constant at 1 μM. Data arepresented as median (±95% CIs) as apercentage of DMSO treated cells. Onlythe single inhibitors and the bestcombinations are presented.
Paterson AL, et al. Gut 2013;62:1415–1424. doi:10.1136/gutjnl-2012-302039 1421
Upper GI cancer
on March 23, 2020 by guest. P
rotected by copyright.http://gut.bm
j.com/
Gut: first published as 10.1136/gutjnl-2012-302039 on 6 July 2012. D
ownloaded from

were active in 17/46 cases (37.0%) (figure 6A,B). The range of acti-vated RTKs was extremely diverse with 38 different receptors, repre-senting 13 distinct families, showing phosphorylation in at least onetumour case (table S3). These data confirm that MAPK activationcan be driven by a range of upstream receptors and that individualtumours need to be profiled to maximise the therapeutic benefit.
DISCUSSIONWe have used a comprehensive and systematic approach entail-ing human tumour samples of oesophago-gastric adenocarcin-oma and in vitro inhibition studies of human cell lines tocharacterise the key signalling pathways driving oesophago-
gastric carcinogenesis. We have demonstrated that the choice oftherapy can be enhanced by knowledge of the activation profilesof the RTKs and in keeping with other studies shown that tar-geting a downstream target, such as Mek, may also represent anefficacious strategy.
The strengths of this study lie in the direct assessment ofhuman material from large clinical cohorts and the attempt todirectly compare the efficacy of a number of small molecularinhibitors informed by a detailed knowledge of the RTK activa-tion status of a given cell line. Limitations include the lack of invivo data for the inhibitors and although a number of drugswere used in our study this could have been extended further,for logistical reasons, the number of already large experimentshad to be kept manageable.
MAPK was identified as a putative dominant signallingpathway in oesophago-gastric adenocarcinomas and subsequentcharacterisation of potential upstream drivers demonstrated thediversity of RTKs which can be activated in these tumours. Incontrast, RAS mutations were not identified in our cohort of 67cases; in keeping with the literature.33–35 The incidence of RTKactivation in our profiled cases is similar to that observed in pre-vious studies of glioblastomas and non-small cell lungcancers.36 37 The leading RTKs identified from the cell line andhuman tumour screen were the EGFR family (EGFR, ErbB2,ErbB3 and ErbB4), the FGFR family (FGFR1–4) and Met. Thepotential role of the identified targets in this tumour type is
Table 1 Summary of the effect of tyrosine kinase inhibitor (TKI) and combinations on proliferation, cleaved caspase 3/7, cell cycle profile andphosphorylated status of receptor tyrosine kinase (RTK) and downstream targets in a panel of oesophago-gastric cell lines
Cell line Active RTK(s) Drug target(s) IC50 (95% CI) (nM)Loss of phosphorylation status(for 1 μM drug concentration)
OE19 EGFR, ErbB2, ErbB3 Mek 95 (34 to 263) ErkErbB2/EGFR 100 (39 to 120) EGFR, ErbB2, Erk, AktEGFR 6.6×10³ (2.3×10³ to 19.1×10³) No loss
MKN45 EGFR, ErbB3, Met, Ret Met 5.58 (4.05 to 7.68) EGFR, Met, ErbB2, Ret, Erk, AktMek 14 (0.4 to 46) ErkErbB2/EGFR 2.95×10³ (1.74 to 4.99×10³) No lossErbB2/EGFR-Met 9.7×10³ (too wide) EGFR, ErbB2, FGFR2, Met, Erk, AktRet Insensitive EGFR, ErbB2, Met, Ret, Erk, AktErbB2/EGFR-Met-Ret Unclear EGFR, ErbB2, Met, Ret, Erk, Akt
KATOIII EGFR, ErbB3, FGFR2 FGFR 4.8 (3.4 to 6.7) FGFR2, ErbB2, EGFR, Erk, AktErbB2/EGFR-FGFR 5.8 (3.9 to 8.4) FGFR2, ErbB2, EGFR, Erk, AktMek 175 (89 to 342) ErkErbB2/EGFR 4.5×10³ (2.2×10³ to 9.4×10³) No loss
HSC39 EGFR, ErbB3, Met, FGFR2 ErbB2/EGFR -Met-FGFR 2.4 (1.1 to 4.1) FGFR2, Met, ErbB2, Erk, AktErbB2/EGFR -FGFR 2.9 (1.4 to 5.9) FGFR2, Met, ErbB2, Erk, AktFGFR-Met 3.2 (2.8 to 3.7) FGFR2, Met, ErbB3, Erk, AktFGFR 5.9 (4.8 to 7.3) FGFR2, Met, ErbB2, Erk, AktMek 7.9 (2.1 to 2.9) ErkMet 1.1×10³ (0.1×10³ to 10×103) MetErbB2/EGFR-Met 1.6×10³ (1.2×10³ to 2.0×10³) EGFR, Met, ErbB2ErbB2/EGFR 2.1×10³(1.7×10³ to 2.7×10³) No loss
OE33 EGFR, ErbB2, ErbB3, Ret, Met Mek 9.1 (3.7 to 22) ErkErbB2/EGFR -Met-FGFR-Ret 93 (70 to 124) Akt, Erk, EGFR, Met, ErbB2/3, retErbB2/EGFR-Met 124 (80 to 193) Akt, EGFR, P-Met, ErbB3, retErbB2/EGFR-FGFR 2.4×10³(1.6×10³ to 7.1×10³) None lostMet 3.0×10³(1.9×10³ to 4.8×10³) Akt, EGFR, Met, ErbB2, retErbB2/EGFR-FGFR-Met 10.1×10³(7.4×10³ to 13.8×10⁶) Akt, EGFR, Met, ErbB2, retEGFR 89.8×10³(1.4×10³ to 5.6×10⁶) EGFRRet 117×103(10.0×10³ to 137×103) No lossErbB2/EGFR 126×103(2.5×10³ to 6.3×10³) No lossFGFR 280×103(very wide) No loss
Western blots were probed for total EGFR, ErbB2, ErbB3, Ret, Met, FGFR, Erk and Akt as well for their phosphorylated species. Only species where loss of phosphorylation was notedare indicated in the loss of phosphorylation status column. The most efficacious combination of TKIs is indicated in bold. Proliferation assays were run for all single drug targets orcombinations. Cleaved caspase 3/7 assay and flow cytometry were run for all single drug targets with IC50 in the nm range and on drug combinations if they improved significantlyon single drug targets. For assays on combinations we selected the minimum number of drugs that were effective.
Table 2 Summary of caspase 3/7 activity following treatment withthe best drug combination
Cell line Drug target(s) Time (h)
Cleaved caspase 3/7(% of control for 1 Mdrug concentration)
OE19 ErbB2/EGFR 24 400MKN45 Met 24 200
KatoIII FGFR 24 200HSC39 ErbB2/EGFR-Met-FGFR 24 500OE33 ErbB2/EGFR-Met 48 400
1422 Paterson AL, et al. Gut 2013;62:1415–1424. doi:10.1136/gutjnl-2012-302039
Upper GI cancer
on March 23, 2020 by guest. P
rotected by copyright.http://gut.bm
j.com/
Gut: first published as 10.1136/gutjnl-2012-302039 on 6 July 2012. D
ownloaded from
supported by a number of descriptive studies which reportedMet and ErbB2 amplification in 8%–10% and 7%–18% ofoesophago-gastric tumours, respectively.38–42 FGFR2 has beenshown to be mutated at key conserved residues in gastric adeno-carcinomas.43 A recent international clinical trial has demon-strated an increased survival afforded by Trastuzumab (ErbB2inactivating antibody) treatment in combination with chemo-therapy in patients with ErbB2-positive advanced oesophago-gastric tumours.44
These in vitro data demonstrate that in the absence of RTKactivation (figure 3, 17.4% of cases), the addition of a targetedagent is unlikely to be effective. However, in patients with evi-dence of RTK activation (82.6% of cases), inhibition of theupstream targets by single TKIs or combinations of inhibitorsdemonstrated three different scenarios for inducing a cytotoxiceffect in vitro. In cell lines with an obvious dominant RTK(figure 4), therapy with a single TKI was sufficient to producethe cytotoxicity; this situation was present in almost half ofhuman tumour samples. However, in the remaining 37% oftumours a more diverse range of RTKs were active (figure 5);this was modelled by two of the cell lines panel. In one line,HSC39, a combination of three TKIs proved more effectivethan single agent inhibition alone while in a third situation,OE33, dual agent treatment was necessary due to the high levelactivation of two RTKs causing redundancy. The dominance ofa single RTK in a subset of our cell lines is in keeping with thetheories of oncogene dependence and oncogenic shock12 13
whereas the requirement for a broader inhibition of activatedRTKs to maximise the tumour response in other cell lines sup-ports previous findings in glioblastomas.36
We also investigated the efficacy of a Mek inhibitor since ithas been suggested that targeting downstream components ofthe activated pathway may highlight areas of extreme fragilityand attractive therapeutic targets.45 46 In all, 27 multicentre,early phase trials of various oral Mek inhibitors are currentlyongoing in patients with advanced tumours.47 Early resultssuggest that they are well tolerated and have efficacy in suppres-sing target phosphorylation in tumour tissue.48 Resistance tocurrent TKI therapies has been associated with the upregulationof alternative RTKs or by mutating the target RTKs;49–51 these
mechanisms would not result in resistance to Mek inhibition.There also remains the possibility that the most effectivetherapy in the long term would be a multi-targeted TKI or dualtargeted approach which combined upstream and downstreamtarget inhibition to give a sustained suppression of signallingwhile also pre-empting potential mechanisms of tumour resist-ance. The major challenge is not identifying individual thera-peutic targets (the literature addressing this aspect is vast) butdetermining which are the most clinically relevant candidatesand whether inhibition using a single inhibitor or a combinationis most effective and then translating this information into atherapeutic strategy which allows personalised chemotherapy tomaximise outcomes and minimise toxicity in a manner that ispractical and applicable to the clinic. This study aimed toaddress these problems using oesophago-gastric adenocarcin-omas as a model since the key signalling pathways in this diseasehave not been thoroughly elucidated and targeted therapy isonly just beginning to be applied.
Overall, we have demonstrated that the MAPK pathway iscommonly activated in oesophago-gastric cancer secondary toactivation of a number of RTKs. Knowledge of the RTK activityprofile, using RTK arrays, is useful to guide which TKI wouldoffer therapeutic efficacy. If multiple RTKs are active, inhibitionof downstream signalling might offer an alternative clinicalapproach. It would be interesting to assess such a personalisedstrategy in a clinical trial setting.
Acknowledgements We thank Zarah Abdullahi, Irene Debiram, Sarah Hilborneand Adrienne Pate for their invaluable help in obtaining human specimens andpatients’ demographics information. We thank the OCCAMS consortium forproviding samples for this study. We thank Richard Wooster, Tona Gilmer and SylvieLaquerre from GlaxoSmithKline for their gifts of Tykerb and of the Mek inhibitor(compound GSK1120212B). We are grateful for Beverley Haynes and the staff ofAddenbrooke’s tissue bank for their continued support and expertise.
Contributors ALP and NBS designed the study, performed experiments, analyseddata and wrote the manuscript; PLS analysed data and wrote the manuscript; CAJOperformed experiments; CJP performed experiments; MoD performed experiments;RCF designed the study and wrote the manuscript.
Funding This work was supported by an MRC core grant, Cambridge ExperimentalCancer Medicine Centre, NIHR Cambridge Biomedical Research Centre and aCoutts-Trotter studentship from Trinity College, Cambridge.
Competing interests None.
Ethics approval Ethics approval was provided by LREC Cambridgeshire.
Provenance and peer review Not commissioned; externally peer reviewed.
REFERENCES1 Cancer Research UK. Oesophageal Cancer Statistics. 2011. http://info.
cancerresearchuk.org/cancerstats/types/oesophagus/?script=true2 Mathers CD, Loncar D. Projections of global mortality and burden of disease from
2002 to 2030. PLoS Med 2006;3:e442.3 Brown LM, Devesa SS, Chow WH. Incidence of adenocarcinoma of the esophagus
among white Americans by sex, stage, and age. J Natl Cancer Inst2008;100:1184–7.
4 Lepage C, Rachet B, Jooste V, et al. Continuing rapid increase in esophagealadenocarcinoma in England and Wales. Am J Gastroenterol 2008;103:2694–9.
5 Jemal A, Siegel R, Ward E, et al. Cancer statistics, 2008. CA Cancer J Clin2008;58:71–96.
6 Sparano JA, Wang M, Martino S, et al. Weekly paclitaxel in the adjuvant treatmentof breast cancer. N Engl J Med 2008;358:1663–71.
7 Sakuramoto S, Sasako M, Yamaguchi T, et al. Adjuvant chemotherapy for gastriccancer with S-1, an oral fluoropyrimidine. N Engl J Med 2007;357:1810–20.
8 Cunningham D, Starling N, Rao S, et al. Capecitabine and oxaliplatin for advancedesophagogastric cancer. N Engl J Med 2008;358:36–46.
9 Vermorken JB, Remenar E, van Herpen C, et al. Cisplatin, fluorouracil, anddocetaxel in unresectable head and neck cancer. N Engl J Med2007;357:1695–704.
Figure 6 Receptor tyrosine kinase (RTK) activation in humanoesophageal adenocarcinoma specimens. RTK activation in humanspecimens using membrane arrays (A) was used to classify patientsaccording to the number and the type of active RTKs (B).
Paterson AL, et al. Gut 2013;62:1415–1424. doi:10.1136/gutjnl-2012-302039 1423
Upper GI cancer
on March 23, 2020 by guest. P
rotected by copyright.http://gut.bm
j.com/
Gut: first published as 10.1136/gutjnl-2012-302039 on 6 July 2012. D
ownloaded from

10 Sequist LV, Joshi VA, Janne PA, et al. Response to treatment and survival ofpatients with non-small cell lung cancer undergoing somatic EGFR mutation testing.Oncologist 2007;12:90–8.
11 Flaherty KT, Puzanov I, Kim KB, et al. Inhibition of mutated, activated BRAF inmetastatic melanoma. N Engl J Med 2010;363:809–19.
12 Weinstein IB. Cancer. Addiction to oncogenes—the Achilles heal of cancer. Science2002;297:63–4.
13 Sharma SV, Fischbach MA, Haber DA, et al. “Oncogenic shock”: explainingoncogene addiction through differential signal attenuation. Clin Cancer Res2006;12:4392s–5s.
14 Sharma SV, Gajowniczek P, Way IP, et al. A common signaling cascade mayunderlie “addiction” to the Src, BCR-ABL, and EGF receptor oncogenes. Cancer Cell2006;10:425–35.
15 Jones S, Zhang X, Parsons DW, et al. Core signaling pathways in human pancreaticcancers revealed by global genomic analyses. Science 2008;321:1801–6.
16 Bartlett JM, Starczynski J, Atkey N, et al. HER2 testing in the UK: recommendationsfor breast and gastric in-situ hybridisation methods. J Clin Pathol 2011;64:649–53.
17 Ishibe N, Carlson J, Ramsey SD, et al. Use of epidermal growth factor receptormutation analysis in patients with advanced non-small-cell lung cancer to determineerlotinib use as first-line therapy. PLoS Curr 2011;3:RRN1245.
18 Keedy VL, Temin S, Somerfield MR, et al. American Society of Clinical Oncologyprovisional clinical opinion: epidermal growth factor receptor (EGFR) Mutationtesting for patients with advanced non-small-cell lung cancer considering first-lineEGFR tyrosine kinase inhibitor therapy. J Clin Oncol 2011;29:2121–7.
19 Hammerman PS, Janne PA, Johnson BE. Resistance to epidermal growth factorreceptor tyrosine kinase inhibitors in non-small cell lung cancer. Clin Cancer Res2009;15:7502–9.
20 Dias-Santagata D, Akhavanfard S, David SS, et al. Rapid targeted mutationalanalysis of human tumours: a clinical platform to guide personalized cancermedicine. EMBO Mol Med 2010;2:146–58.
21 Peters CJ, Rees JR, Hardwick RH, et al. A 4-gene signature predicts survival ofpatients with resected adenocarcinoma of the esophagus, junction, and gastriccardia. Gastroenterology 2010;139:1995–2004.e15.
22 Saadi A, Shannon NB, Lao-Sirieix P, et al. Stromal genes discriminate preinvasivefrom invasive disease, predict outcome, and highlight inflammatory pathways indigestive cancers. Proc Natl Acad Sci U S A 2010;107:2177–82.
23 Palanca-Wessels MC, Klingelhutz A, Reid BJ, et al. Extended lifespan of Barrett’sesophagus epithelium transduced with the human telomerase catalytic subunit: auseful in vitro model. Carcinogenesis 2003;24:1183–90.
24 Soldes OS, Kuick RD, Thompson IA 2nd, et al. Differential expression of Hsp27 innormal oesophagus, Barrett’s metaplasia and oesophageal adenocarcinomas. Br JCancer 1999;79:595–603.
25 de Both NJ, Wijnhoven BP, Sleddens HF, et al. Establishment of cell lines fromadenocarcinomas of the esophagus and gastric cardia growing in vivo and in vitro.Virchows Arch 2001;438:451–6.
26 Stoecklein NH, Hosch SB, Bezler M, et al. Direct genetic analysis of singledisseminated cancer cells for prediction of outcome and therapy selection inesophageal cancer. Cancer Cell 2008;13:441–53.
27 Alvarez H, Koorstra JB, Hong SM, et al. Establishment and characterization of a bona fideBarrett esophagus-associated adenocarcinoma cell line. Cancer Biol Ther 2008;7:1753–5.
28 Motoyama T, Hojo H, Watanabe H. Comparison of seven cell lines derived fromhuman gastric carcinomas. Acta Pathol Jpn 1986;36:65–83.
29 Yanagihara K, Seyama T, Tsumuraya M, et al. Establishment and characterization ofhuman signet ring cell gastric carcinoma cell lines with amplification of the c-myconcogene. Cancer Res 1991;51:381–6.
30 Boonstra JJ, van Marion R, Beer DG, et al. Verification and unmasking of widely usedhuman esophageal adenocarcinoma cell lines. J Natl Cancer Inst 2010;102:271–4.
31 Van der Laan MJ, Pollard KS. A new algorithm for hybrid hierarchicalclustering with visualization and the bootstrap. J Stat Plan Infer 2003;117:275–303.
32 Schneikert J, Behrens J. The canonical Wnt signalling pathway and its APC partnerin colon cancer development. Gut 2007;56:417–25.
33 Nadir A, Itzhak S, Jaccob R, et al. Activation of c-K-ras mutations in humangastrointestinal tumors. Gastroenterology 2000;118:1045–50.
34 Lord RV, O’Grady R, Sheehan C, et al. K-ras codon 12 mutations in Barrett’soesophagus and adenocarcinomas of the oesophagus and oesophagogastricjunction. J Gastroenterol Hepatol 2000;15:730–6.
35 Lagorce C, Flejou LF, Muzeau F, et al. Absence of c-Ki-ras gene mutation inmalignant and premalignant Barrett’s oesophagus. Clin Mol Pathol 1995;48:M198–9.
36 Stommel JM, Kimmelman AC, Ying H, et al. Coactivation of receptor tyrosinekinases affects the response of tumor cells to targeted therapies. Science2007;318:287–90.
37 Rikova K, Guo A, Zeng Q, et al. Global survey of phosphotyrosine signalingidentifies oncogenic kinases in lung cancer. Cell 2007;131:1190–203.
38 Miller CT, Moy JR, Lin L, et al. Gene amplification in esophagealadenocarcinomas and Barrett’s with high-grade dysplasia. Clin Cancer Res 2003;9:4819–25.
39 Nakajima M, Sawada H, Yamada Y, et al. The prognostic significance ofamplification and overexpression of c-met and c-erb B-2 in human gastriccarcinomas. Cancer 1999;85:1894–902.
40 Mitsui F, Dobashi Y, Imoto I, et al. Non-incidental coamplification of Myc andERBB2, and Myc and EGFR, in gastric adenocarcinomas. Mod Pathol2007;20:622–31.
41 Ishikawa T, Kobayashi M, Mai M, et al. Amplification of the c-erbB-2 (HER-2/neu)gene in gastric cancer cells. Detection by fluorescence in situ hybridization. Am JPathol 1997;151:761–8.
42 Barros-Silva JD, Leitao D, Afonso L, et al. Association of ERBB2 gene status withhistopathological parameters and disease-specific survival in gastric carcinomapatients. Br J Cancer 2009;100:487–93.
43 Jang JH, Shin KH, Park JG. Mutations in fibroblast growth factor receptor 2 andfibroblast growth factor receptor 3 genes associated with human gastric andcolorectal cancers. Cancer Res 2001;61:3541–3.
44 Bang YJ, Van Cutsem E, Feyereislova A, et al. Trastuzumab in combination withchemotherapy versus chemotherapy alone for treatment of HER2-positive advancedgastric or gastro-oesophageal junction cancer (ToGA): a phase 3, open-label,randomised controlled trial. Lancet 2010;376:687–97.
45 Albert R, Jeong H, Barabasi AL. Error and attack tolerance of complex networks.Nature 2000;406:378–82.
46 Amit I, Wides R, Yarden Y. Evolvable signaling networks of receptor tyrosinekinases: relevance of robustness to malignancy and to cancer therapy. Mol Syst Biol2007;3:151.
47 Clinicaltrial.gov. http://clinicaltrials.gov/ct2/results?term=mek. 2010.48 Duffy A, Kummar S. Targeting mitogen-activated protein kinase kinase (MEK) in
solid tumors. Target Oncol 2009;4:267–73.49 Engelman JA, Zejnullahu K, Mitsudomi T, et al. MET amplification leads to gefitinib
resistance in lung cancer by activating ERBB3 signaling. Science2007;316:1039–43.
50 Bean J, Brennan C, Shih JY, et al. MET amplification occurs with or without T790Mmutations in EGFR mutant lung tumors with acquired resistance to gefitinib orerlotinib. Proc Natl Acad Sci U S A 2007;104:20932–7.
51 Debiec-Rychter M, Cools J, Dumez H, et al. Mechanisms of resistance to imatinibmesylate in gastrointestinal stromal tumors and activity of the PKC412 inhibitoragainst imatinib-resistant mutants. Gastroenterology 2005;128:270–9.
1424 Paterson AL, et al. Gut 2013;62:1415–1424. doi:10.1136/gutjnl-2012-302039
Upper GI cancer
on March 23, 2020 by guest. P
rotected by copyright.http://gut.bm
j.com/
Gut: first published as 10.1136/gutjnl-2012-302039 on 6 July 2012. D
ownloaded from