organizing for success: building a qi foundation · 2018-03-03 · organizing for success: building...
TRANSCRIPT

Organizing for Success: Building a QI Foundation
November 2017
Michele Stanek, MHSIn Partnership with Alliant Quality
South Carolina Office of Rural HealthCenter for Practice Transformation

Transformation
• “…value is defined as the health outcomes achieved that matter to patients relative to the cost of achieving those outcomes”
• Transformation requires a fundamental departure from the past:– Changes in Healthcare Delivery System– Changes in Payment Systems– Changes in Culture
• “Transition will not be linear or swift and will require organizations to operate under varying payment models for a prolonged period of time”
Source: Porter ME, Lee TH. The Strategy That Will Fix Healthcare. Harv Bus Rev. 2013. Accessed at https://hbr.org/2013/10/the-strategy-that-will-fix-health-care

Transformation Triple Aim
• Changes in Healthcare Delivery System
• Changes in Payment Systems
• Changes in Culture

Triple Aim for Healthcare ImprovementGoals for Transformation
Improve the experience of care, improve the health of populations, and lower the per-capita cost of care.
Source: http://www.ihi.org/engage/initiatives/TripleAim/Pages/default.aspx

Source: Bodenheimer T, Sinsky C. From Triple to Quadruple Aim: Care of the Patient Requires Car of the Provider. Ann FamMed November/December 2014 12(6):573-576.
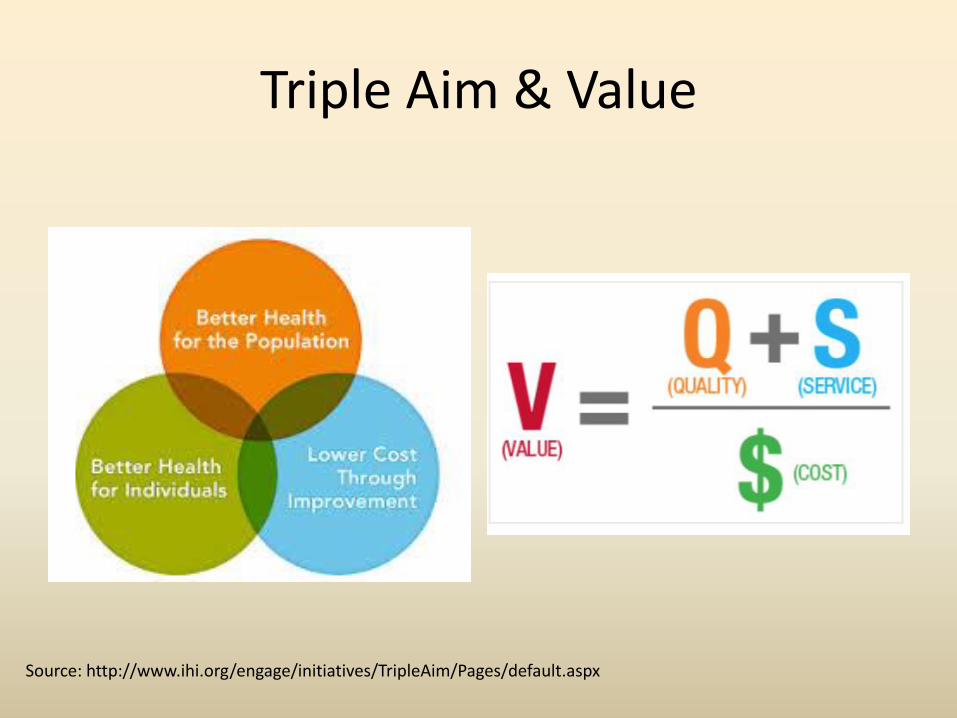
Triple Aim & Value
Source: http://www.ihi.org/engage/initiatives/TripleAim/Pages/default.aspx

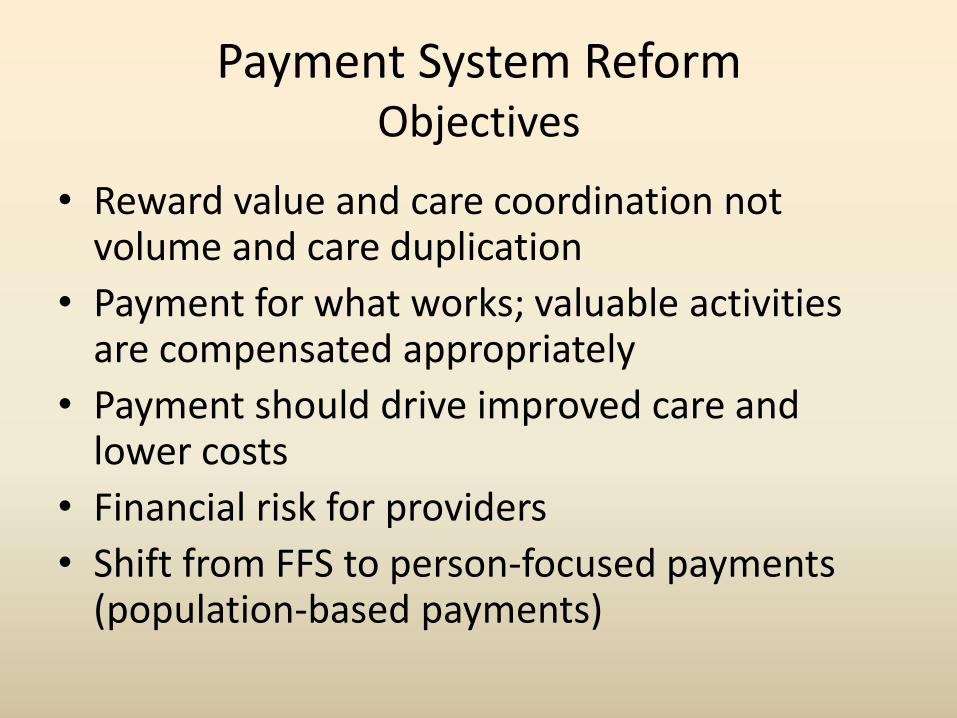
Payment System ReformObjectives
• Reward value and care coordination not volume and care duplication
• Payment for what works; valuable activities are compensated appropriately
• Payment should drive improved care and lower costs
• Financial risk for providers
• Shift from FFS to person-focused payments (population-based payments)

Value-Based Reimbursement
APM FRAMEWORK
Source: http://hcp-lan.org/workproducts/apm-refresh-whitepaper-final.pdf

Moving to Value
Source: HCP LAN. (October 2016) Measuring Progress: Adoption of Alternative Payment Models in Commercial, Medicare Advantage, and State Medicaid Programs. Accessed at https://hcp-lan.org/groups/apm-fpt/apm-report/

Organizational Change
• Transformation is not a single step but an overarching strategy
• Restructuring of how healthcare delivery is organized, measured and delivered
• Move from a system focused on what physicians do towards a system on what patients need
Source: Porter ME, Lee TH. The Strategy That Will Fix Healthcare. Harv Bus Rev. 2013. Accessed at https://hbr.org/2013/10/the-strategy-that-will-fix-health-care

Transformation Capacity
1. Improvement is a Team Sport
2. Know thy Practice
3. Improvement is a Science
4. Data drives Improvement
5. “This is Not a Project” - Alignment across programs & systems
6. R&D: Rip-off & Duplicate
7. A rising tide lifts all boats (Collaboration & Sharing of Best Practices)

Team Sport

QI Team
• Improvement involves work across multiple processes, roles/disciplines & functions in a practice
• QI team is the group that leads and manages practice’s quality improvement efforts
• Must be multi-disciplinary (consider adding a patient/family member to the team)
• Meets regularly to – Review performance data– Identify areas in need of improvement (Improvement
Priorities/Plan)– Develop, implements & monitors tests of change
• Uses variety of QI methods (i.e., PDSAs, process mapping…)• Team needs champions!!!

QI Team• IHI recommends the following roles on a QI team
– Clinical Leader(s)• Is a practicing provider (MD, DO, NP, PA) who is an opinion leader and is well
respected by peers • Understands the processes of care• Has a good working relationship with colleagues • Wants to drive improvements in the practice
– Day-to-Day Leadership• Drives Quality Improvement priorities and strategies are implemented• Coordinates communication & meetings• Works effectively with the clinical champion
– Technical experts• Process• IT• Patient
– “Consultants”– Sponsor(s)


QI Team
• Size: 5-8 for large practice; 3-4 for small practice
• Regular meeting (2x per month)
– Action-oriented
– Huddles…

Teams and Meetings
Quality Team
Clinical Teams
Rapid Cycle Teams
• Weekly meeting of Quality Team
• Practice-wide meeting
– 1x per month during lunch
– Quarterly clinical team mtg
– RCT as needed
• ED Utilization
• Access
• Training, team development, performance feedback
FMC QI Infrastructure

Team Charter
• Before work starts – team should draft a team charter
• Charter should outline initial direction of the team
• Should be developed in conjunction with sponsorto ensure appropriate support and resources
• Delineates strategic objectives & measures of success
• Updated routinely


Tuckman’s Stages of Team Development
Source: http://wheatoncollege.edu/sail/files/2011/12/groupDevelopment.jpg

Team Performance
• Teams need regular checkups
• Catch and address performance issues
• Team performance often suffers when disconnect between team goals and organizational reality
• Perfect is the enemy of good – We “P” too much
• QI ADHD
Source: Public Health Foundation. http://www.phf.org/resourcestools/Documents/Applications_and_Tools_for_Creating_and_Sustaining_Healthy_Teams.pdf

Team Meetings
• Regular & necessary• Action-driven meetings (Agenda)• Start on time/End on time• Designate time-keeper & recorder (should
rotate)• Solve problems as a group• Record action steps, owners• Celebrate your succeses• Pre-work, Meeting, Post-work• Do not cover “newsletter” items

Source: www.mc.vanderbilt.edu/.../Sample_Meeting_Agenda.doc


“Some is not a numberSoon is not a time”
- Don Berwick, IHI

Practice Assessment
• Effective improvement starts with understanding practice’s current performance– Creates buy-in – Identifies areas in need of improvement and strengths– Compares current performance with others– Assists in setting improvement goals– Tracks progress
• What is your area of focus? Population of focus?• What are the assessment topics?
– Clinical Performance– Care Model– Finance– Patient Experience
• Assessment should provide actionable information & facilitate discussion

Assessment
• Who are you?
• Who are you caring for?
• What are you doing?
• How are your doing?

Practice Assessment
Assessment Topic Assessment
Clinical Performance Chart ReviewsEHR QueryHEDIS Reports (Gaps in Care Reports)
Care Model Survey InventoryProcess MapInterviews/Direct ObservationDocument Review
Finance Billing/CodingRelated RevenueExpenditures
Patient Experience Patient Satisfaction SurveyPatient Engagement

Practice Assessment
• Darthmouth Clinical Microsystems -https://clinicalmicrosystem.org/workbooks/
• Comprehensive assessment tool
• 5 Ps– Purpose
– Patients
– Professionals
– Processes
– Patterns
Practice Assessment
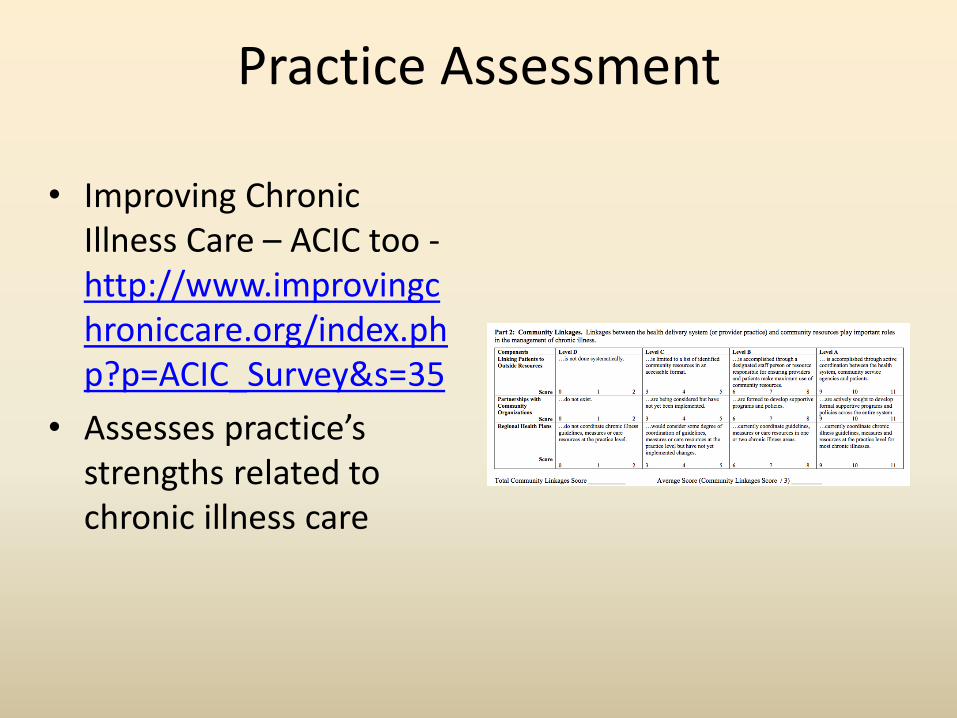
• Improving Chronic Illness Care – ACIC too -http://www.improvingchroniccare.org/index.php?p=ACIC_Survey&s=35
• Assesses practice’s strengths related to chronic illness care

Practice AssessmentPCMH Tool
• PCMH-A -http://www.safetynetmedicalhome.org/sites/default/files/PCMH-A.pdf

Building Blocks
^California Healthcare Foundation. The Building Blocks of High Performing Primary Care. Accessed at www.chcf.org

Practice Assessment
• Building Blocks for High Performing Primary Care -https://cepc.ucsf.edu/sites/cepc.ucsf.edu/files/Building%20Blocks%20Assessment.pdf

Practice Assessment
• Improving Primary Care -http://www.improvingprimarycare.org/work/communication-management?take=1
• Short assessment of team-based care competencies

Mini-Z

Workflow/Processes
• Workflow are the steps frequently taken to complete a task
• Often involves several staff members (hand-offs)• Represents how work actually gets done• Important primary care workflows (processes)
– Making appointments– Coordinating referrals– Preparing for a visit….– Providing anticipatory guidance

Workflow/Processes• Processes:
– Perceived process (What we think is happening)– Reality process (What is really happening)– Ideal process (efficient, effective and reliable process)
• To have to an efficient, effective & reliableworkflow/process you must first understand the reality process and understand the characteristics of an ideal process (intentional design)
Source: AHRQ. Practice Facilitation Handbook.http://www.ahrq.gov/professionals/prevention-chronic-care/improve/system/pfhandbook/mod5.html

Workflow/Process Mapping
• Makes invisible processes visible so you can understand both perceived processes and reality process to start designing ideal process
• Visual representation of actions, steps to achieve a certain result
• Quick and easy way to visualize an entire process• Shows who performs each part of process• Who does what when!• About the system not the person
**Source: UCLA-First 5 LA Oral Health Program QI Learning Collaborative

Process Map

Presenting Assessment
• Questioning data should be expected; be proactive
• Use Appreciative Inquiry to drive positive discussion

“Everyone in health care should have two jobs: to do the work and to improve how
the work is done.”
- Maureen Bisognano, IHI

Quality Improvement
• Quality Improvement –formal approach to the analysis of performance and systematic efforts to improve it– Ensures changes are for
the better/positive
• Improvement Science– Model for Improvement
– Lean/Six Sigma…
Performance

Measuring Quality:“Continuous Quality Improvement”
Nu
mb
er o
f E
pis
od
es o
f C
are
low avg high
QUALITY
ALL do better-not just
“bad apples”
the goal of CQI

Science of Improvement
• Utilize a method for performance improvement based on science of improvement:
–Model for Improvement (IHI)
– Six Sigma (GE)
– Lean (Toyota)
–Balanced Scorecard…


Model for Improvement
• 3 “Powerful” Questions– What are we trying to
accomplish – Set Goal/Aim– How will we know that a
change is an improvement – Select Measures
– What changes can we make that will result in improvement –Improvement Strategies
• Test the change/Implement improvement strategy using PDSA cycle

If you cannot measure it, you cannot improve itLord Kelvin
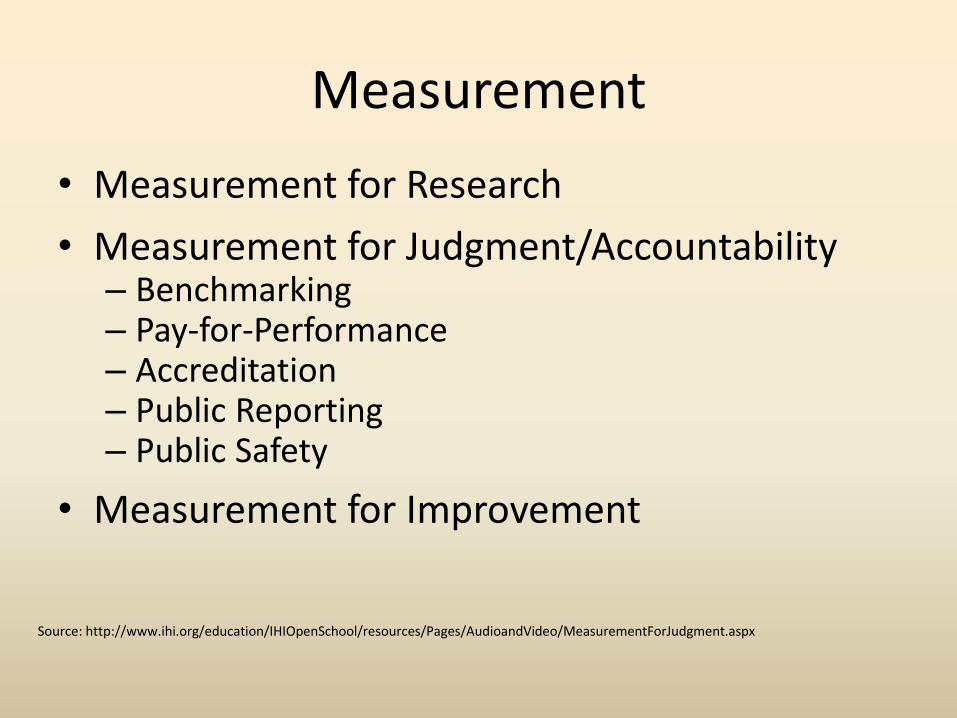
Measurement
• Measurement for Research
• Measurement for Judgment/Accountability– Benchmarking– Pay-for-Performance– Accreditation– Public Reporting– Public Safety
• Measurement for Improvement
Source: http://www.ihi.org/education/IHIOpenSchool/resources/Pages/AudioandVideo/MeasurementForJudgment.aspx

Merit-Based Incentive ProgramJUDGEMENT
Each physician or eligible professional or group will receive a composite performance score: 0-100; score will determine reimbursement
Quality
60%
Improvement
Activities
15%
Cost
0%
Advancing
Clinical
Information
25%
Final Score
(0-100)
Source: https://www.cms.gov/Medicare/Quality-Initiatives-Patient-Assessment-Instruments/Value-Based-Programs/MACRA-MIPS-and-APMs/MACRA-LAN-PPT.pdf

Diabetes Quality MeasuresImprovement
Measure Center-WideMay 2013
Center-Wide June 2013
Center-wideAugust 2013
A1c test 83% 87% 87.5%
A1c<8.0% 58% 61% 70%
BP measurement 94% 96% 97%
BP <130/80 48% 48% 53%
LDL test 64% 68% 68%
LDL<100 35% 38% 52%

Measuring for Judgment & ImprovementNCQA PCMH 2014 Standards
Measure Performance
Standard 3 & 6 2 immunization measures
Standard 3 & 6 2 preventive measures
Standard 3 & 6 3 chronic or acute care measures
Standard 3 1 measure related to patient due for services
Standard 3 1 measure related to medication
Standard 6 1 vulnerable population measure
Standard 6 2 utilization measures
Standard 6 2 measures related to care coordination
Standard 6 4 Measures related to PtEx domains
Standard 1 2 access measures – TNA , no shows
Standard 2 1 Continuity Measure
21 Performance Measures

Data-Driven Improvement
• Where do you get data?– EMR– PM System– Billing System– Chart Reviews– Survey Results– Patient Feedback
• Utilize full functionality of EMR• Identify & prioritize meaningful measures
– Payer-driven; System-driven– Biggest need; biggest bang – What you can get from EMR or other data systems
• Measure frequently• Publicize measurement frequently & quickly

Data-Driven Improvement
• View data, share data, discuss data• Provide data by practice, team & individual provider
– Use run charts to display data for practice– Data dashboards– “Quick and dirty” data works – 10 charts
• Snapshot – reliable & accurate• Validate data• Analyze variation
Source: California Healthcare Foundation (2012) The Building Blocks of High Performing Primary Care Practices. Accessed on March 13, 2016 at http://www.chcf.org/~/media/MEDIA%20LIBRARY%20Files/PDF/PDF%20B/PDF%20BuildingBlocksPrimaryCare.pdf

Performance Dashboard

Chart Audit

EMR ReportMammography
0%
20%
40%
60%
80%
100%
120%
Provider A
Provider B
Provider C
Provider D
Provider E
Provider F

Practice Management Report
-
5
10
15
20
25
JAN FEB MAR APR MAY JUN JUL AUG SEP OCT NOV DEC JAN FEB MAR APR MAY JUN JUL AUG SEP
2016 2017
TCM Volume by Month
58

EHR Report
59

QRUR Report

Alignment

AlignmentMerit-Based Incentive Program
Each physician or eligible professional or group will receive a composite performance score: 0-100; score will determine reimbursement
Quality
60%
Improvement
Activities
15%
Cost
0%
Advancing
Clinical
Information
25%
Final Score
(0-100)
Source: https://www.cms.gov/Medicare/Quality-Initiatives-Patient-Assessment-Instruments/Value-Based-Programs/MACRA-MIPS-and-APMs/MACRA-LAN-PPT.pdf
Recognized PCMH
receives maximum
points

R&D
Rip-Off & Duplicate


R&DChange Packages/Tools…
http://www.safetynetmedicalhome.org/change-concepts/empanelment


Resources: Patient Self-Management Implementation Guide: http://cepc.ucsf.edu/sites/cepc.ucsf.edu/files/Action_Plans_14-0602.pdf
Self-Management Support: http://www.improvingchroniccare.org/downloads/selfmanagement_support_toolkit_for_clinicians_2012_update.pdf

Improvement - Clinical Care
• Setting: Large Internal Medicine Practice
• Goal: Improve lipid screening for patients with diabetes
– 55% of patients had total cholesterol tested annually
– Approximately 68% were prescribed statins
– Average total cholesterol = 185 mg/dl
– Average LDL = 99 mg/dl

PDSACycle 1
Plan: Front Desk will identify all patients with diabetes and check diabetes flowsheet for date of last LDL test
Do: Eastside front desk examined problem list for all scheduled patients with diabetes and flowsheet for date of last LDL test; date of test noted on schedule; Week of October 4th
Study: 22/30 patients had LDL test listed on schedule; 17/30 received needed LDL test
Act: Provide daily feedback to front desk staff; implement incentive program
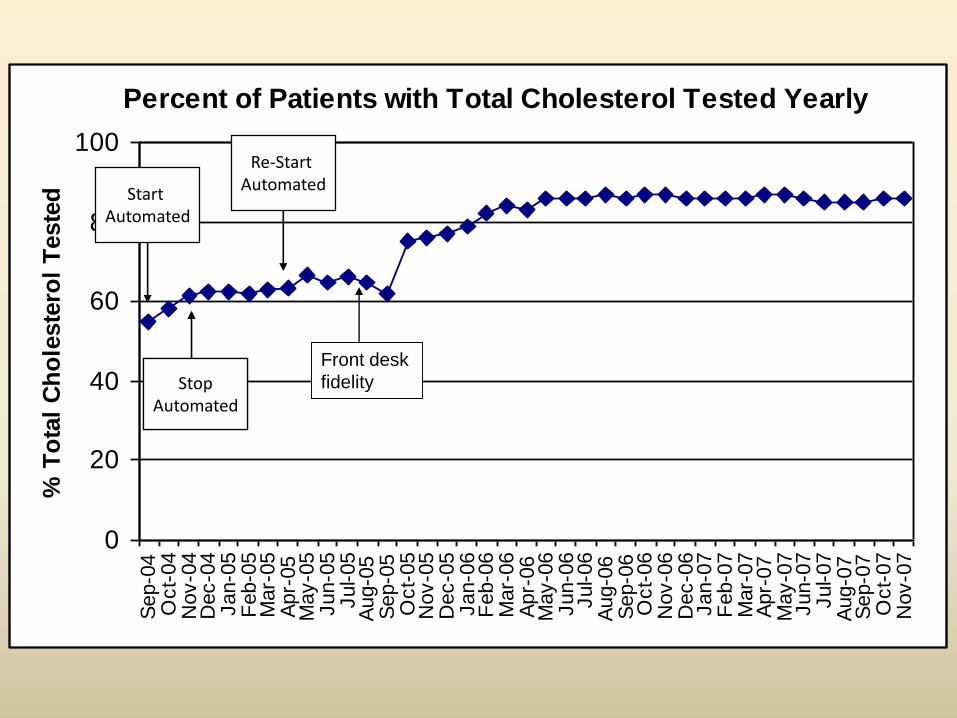
Percent of Patients with Total Cholesterol Tested Yearly
0
20
40
60
80
100S
ep-0
4O
ct-
04
Nov-0
4D
ec-0
4Jan-0
5F
eb-0
5M
ar-
05
Apr-
05
May-0
5Jun-0
5Jul-05
Aug-0
5S
ep-0
5O
ct-
05
Nov-0
5D
ec-0
5Jan-0
6F
eb-0
6M
ar-
06
Apr-
06
May-0
6Jun-0
6Jul-06
Aug-0
6S
ep-0
6O
ct-
06
Nov-0
6D
ec-0
6Jan-0
7F
eb-0
7M
ar-
07
Apr-
07
May-0
7Jun-0
7Jul-07
Aug-0
7S
ep-0
7O
ct-
07
Nov-0
7
% T
ota
l C
ho
leste
rol
Teste
d Start Automated
StopAutomated
StopAutomated
Re-Start Automated
Front desk
fidelity

Average Lipid Results
75
100
125
150
175
200Ju
l-0
5A
ug
-05
Se
p-0
5O
ct-
05
No
v-0
5
De
c-0
5Ja
n-0
6F
eb
-06
Ma
r-0
6A
pr-
06
Ma
y-0
6Ju
n-0
6Ju
l-0
6A
ug
-06
Se
p-0
6O
ct-
06
No
v-0
6D
ec-0
6Ja
n-0
7F
eb
-07
Ma
r-0
7A
pr-
07
Ma
y-0
7Ju
n-0
7
Ju
l-0
7A
ug
-07
Se
p-0
7O
ct-
07
No
v-0
7
Re
su
lts
(m
g/d
l)
Total Chol
LDL

Improvement - Cost
Frequent
Flyers
Control
Group
E.D. Visits 7.98 0.63
Hospitalizations 1.5 0.63
Clinic Visits 9.6 4.0
Comorbidities 2.1 0.85
Medications 11 5.4
Continuity with
PCP30% 50%
Improvement Strategies:– Red Chart Rounds – multi-disciplinary
group discussions of high-risk patients– Scheduling
• Instruct schedulers to highly prioritize continuity with PCP
• Residents scheduling visits 24-7 (from inpatient or ER)
– Resident run house calls– Create formula to identify potential
high-utilizers:1.) # of medications2.) # of problems3.) comorbidities
Setting: Medium-size, Family Medicine Practice
Goal: Reduce inappropriate ED utilization
Outcome: Reduced ED utilization by 22% in 10 months; reduced ED utilization in high-
risk patients by 26%

Improvement - Experience
• Setting: Large, Pediatric Practice
• Goal: Reduce Cycle Time for patients
• Improvement Strategies:
– Reduce paperwork at check-in
– Trained staff on use of EMR notification
– Air Traffic Control Board
– Patient Check-In
Measure Derivation Mean Median
Wait time -
Arrival time
to call back
(In Room)
– (Arrival
Time)
0:35 0:29
Wait Time-
Check in to
call back
(In Room) –
(Check In)0:17 0:13
Wait Time -
Arrival time to
check in
(Check in) -
(Arrival Time)0:17 0:12
In room to
nurse out
(Nurse Out) –
(Nurse In)0:10 0:09
Nurse out to
Doctor in
(Doctor In) –
(Nurse Out)0:11 0:06
Doc In Room(Doc Out) –
(Doc In)0:21 0:17
Lab in Room(Lab In) – (Lab
Out)0:15 0:03
Total Cycle
Time
(Leave
Checkout) –
Check In Time)
1:20 1:09
No Show Rate(Total Appts) /
(No Shows) 12.50%

QUESTIONS?

Contact Information107 Saluda Pointe Dr
Lexington, SC 29072
Phone: 803-454-3850
Fax: 803-454-3860
http://www.scorh.nethttp://twitter.com/scruralhealthhttp://www.facebook.com/SCORHhttp://www.youtube.com/user/scruralhealth