organizational behavioural obstructions between...
TRANSCRIPT

Organizational Behavioural Obstructions between Planners and
Implementing the Development Permit System
MRP Research Report
Submitted to
The Local Government Program
Department of Political Science
The University of Western Ontario
Joe Nethery
August 2, 2011
Confidentiality Level: Public
Organizational Behaviour, Planners, and DPS i
Organizational Behavioural Obstructions between Planners and
Implementing the Development Permit System
Abstract
The Development Permit System (DPS) is a new and alternative mechanism in Ontario
for granting approvals to land use planning development applications. Since the Province
extended the use of DPS to all municipalities effective January 1, 2007, only three municipalities
have adopted a Development Permit By-law. Given the initial excitement and lobbying efforts of
land use planners for its powers, the lack of uptake is interesting and warrants investigation. A
survey of 303 senior planning administrators in Ontario was undertaken to evaluate eight
organizational behavioural hypotheses that could explain this occurrence – the natural
conservatism of Ontarians; Council desire to maintain power; a catalyst event having or not
having occurred; activist theory criticisms on curtailed public comment; lack of knowledge of
DPS; satisfaction with a current framework for approvals; and time or cost concerns; plus certain
demographic or municipal structural concerns – and whether or not DPS was seriously considered
by the municipality. A total of 131 usable responses were received. The survey found that 26.0%
of respondents (34) had considered DPS, and of those approximately half (17) gave it more than
personal consideration.
A case study of Ontario’s first DPS municipality (Carleton Place) shows that a
municipality can achieve some benefits by switching to DPS, primarily from a time savings
perspective but also, to an extent, in improving the quality of development and associated
amenities obtained. Implementation appears to be hindered by a lack of knowledge and
awareness among land use planners of the system, the lack of a widespread number of
challenging development proposals and contexts, and the high number of municipalities with a
small population and small planning function is limiting its spread.

Organizational Behaviour, Planners, and DPS ii
Acknowledgements
It is my pleasure to thank those who made this Major Research Project possible. At the
University of Western Ontario, I am indebted to my supervisor, Dr. Tim Cobban, who supported
my vision and plans to complete this project. He encouraged me to be ambitious in my goals
while keeping the scope of this project within a reasonable and attainable range. This project was
piloted in two classes during the 2010-2011 academic year. Dr. Martin Horak (organizational
behaviour) and Dr. Robert Young (research methods) provided evaluations that shaped how this
project unfolded. Without these three individuals, this study would have become far less
impactful a paper.
A number of professionals in the field have been valuable contributors to this project.
First among those is Lisa Young, MCIP RPP, of the Town of Carleton Place. She allowed me to
spend a week in their municipal offices to research five years’ worth of development application
files, to learn and evaluate how the Development Permit System works in her municipality. She
also introduced me to my two anonymous interview subjects, who each provided an honest
assessment of their experience navigating Carleton Place’s approval process. For the
questionnaire, I would like to thank my 131 survey respondents for their contribution, as well as
the 8 pre-test questionnaire respondents in November 2010.
Lastly, this project could never have been completed without my support network of
friends, be they here in London or elsewhere, as well my family: my father, Tom, and my mother,
Carrie, in Guelph, and my brother, Paul, currently completing his Master’s degree in Gold Coast,
Australia. Their insights and moral support helped carry me through this year-long adventure.

Organizational Behaviour, Planners, and DPS iii
Table of Contents
Abstract ............................................................................................................................................. i
Acknowledgements .......................................................................................................................... ii
Table of Contents ............................................................................................................................ iii
List of Appendices .......................................................................................................................... iv
List of Figures ................................................................................................................................. iv
List of Tables .................................................................................................................................. iv
1.0 About the Development Permit System ............................................................................... 2
1.1 Powers and procedures .................................................................................................... 2
1.2 Timeline and discussion of DPS in Ontario ..................................................................... 3
1.3 About Carleton Place ....................................................................................................... 6
1.4 Advantages of DPS over traditional zoning ..................................................................... 8
1.5 Disadvantages of DPS over traditional zoning ................................................................ 9
2.0 Hypotheses to be Tested ...................................................................................................... 9
2.1 The natural conservatism of land use planners .............................................................. 10
2.2 Council desire to maintain power .................................................................................. 11
2.3 Presence of a catalyst event ........................................................................................... 12
2.4 Criticism from activist planning theory ......................................................................... 12
2.5 Institutional lack of knowledge about DPS .................................................................... 13
2.6 Satisfaction with current approvals framework ............................................................. 13
2.7 Time or cost concerns .................................................................................................... 14
2.8 Various demographic or municipal structural factors .................................................... 14
3.0 Project Methodology .......................................................................................................... 15
3.1 Survey pre-test; .............................................................................................................. 15
3.2 Full survey ..................................................................................................................... 16
3.3 Program evaluation ........................................................................................................ 19
3.4 Study validity ................................................................................................................. 22
4.0 Analysis ............................................................................................................................. 23
4.1 Overall consideration of DPS ........................................................................................ 23
4.2 Various demographic or municipal structural factors .................................................... 24
4.3 The natural conservatism of land use planners .............................................................. 30
4.4 Council desire to maintain power .................................................................................. 31
4.5 Presence of a catalyst event ........................................................................................... 32
4.6 Criticism from activist planning theory ......................................................................... 34
4.7 Institutional lack of knowledge about DPS .................................................................... 36
4.8 Satisfaction with current approvals framework ............................................................. 37

Organizational Behaviour, Planners, and DPS iv
4.9 Time or cost concerns .................................................................................................... 37
5.0 The Carleton Place Experience .......................................................................................... 39
5.1 Number of applications approved .................................................................................. 40
5.2 Application review time ................................................................................................. 41
5.3 Applications proceeding to Council ............................................................................... 42
5.4 Community amenities obtained ..................................................................................... 44
5.5 Appeals to the Ontario Municipal Board ....................................................................... 45
6.0 Conclusions ........................................................................................................................ 46
References ...................................................................................................................................... 49
List of Appendices
Appendix ‘A’: Survey to Planning Professionals
Appendix ‘B’: Carleton Place Evaluation Data
Appendix ‘C’: Carleton Place Developer Interview Questions
List of Figures
Figure 1. Respondents who had Considered DPS to Any Degree (n = 131) ................................ 23
Figure 2. Degree to which DPS was Considered (n = 34) ............................................................ 24
List of Tables
Table 1. Mechanisms and Timing for Various Planning Applications ........................................... 2
Table 2. Indicators Proposed for the Demographic Hypothesis ................................................... 15
Table 3. Indicators Evaluated in Carleton Place ........................................................................... 20
Table 4. Hypothesis Testing Results for Gender .......................................................................... 25
Table 5. Hypothesis Testing Results for Age ............................................................................... 25
Table 6. Hypothesis Testing Results for Respondent Level of Education .................................... 26
Table 7. Hypothesis Testing Results for Respondent Tenure ....................................................... 26
Table 8. Hypothesis Testing Results for Respondent’s Last Year in Formal Education .............. 27
Table 9. Hypothesis Testing Results for Size of Municipality ..................................................... 28
Table 10. Hypothesis Testing Results for Number of Planning Applications .............................. 29
Table 11. Hypothesis Testing Results for Number of Registered Professional Planners ............. 30
Table 12. Hypothesis Testing Results for the Naturally Conservative Hypothesis ...................... 30
Table 13. Hypothesis Testing Results for the Council Control Hypothesis ................................. 31
Table 14. Hypothesis Testing Results for the Catalyst Event (General) Hypothesis .................... 32

Organizational Behaviour, Planners, and DPS v
Table 15. Hypothesis Testing Results for the 2011 General Election Sub-hypothesis ................. 34
Table 16. Hypothesis Testing Results, “Controversial Applications Appealed to the OMB” ...... 34
Table 17. Hypothesis Testing Results, “Removal of Appeal Rights” ........................................... 35
Table 18. Hypothesis Testing Results, “We Engage in More than Minimal Consultation” ......... 35
Table 19. Hypothesis Testing Results for the Lack of Institutional Knowledge Hypothesis ....... 36
Table 20. Hypothesis Testing Results for the Satisfied with Current Framework Hypothesis ..... 37
Table 21. Hypothesis Testing Results for the Time and Cost Concerns Hypothesis .................... 39
Table 22. Comparison of Number of Applications Approved ...................................................... 40
Table 23. Comparison of Application Review Time .................................................................... 41
Table 24. Comparison of Number of Applications Proceeding to Council .................................. 42
Table 25. Comparison of Number of Community Amenities Obtained ....................................... 44
Table 26. Comparison of the Number of Ontario Municipal Board Appeals ............................... 45
Table 27. Summary Table of Hypothesis Testing Results ............................................................ 46

Organizational Behaviour, Planners, and DPS 1
Organizational Behavioural Obstructions between Planners and
Implementing the Development Permit System
For the municipal corporation to grow and prosper, measured and appropriate change is
necessary. Programs need to be updated, staff trained or replaced, and infrastructure maintained
as the community grows and matures. It is accepted that culture change is difficult in local
government. A number of authors have opined as to why it is difficult for a government
organization to take such larger steps toward culture change. Goss (2001) concludes that the
multiple sources of power in public sector organizations complicate where the source of change is
coming from, and in what direction it is supposed to occur. Mills and Helms Mills (2007, 434-
437) detail how it took a Royal Commission (the Abella Commission) to begin to break down
barriers for women in the Federal civil service. Change requires empowerment of both
organizations and individuals.
Many Ontario municipalities have claimed that they lack the powers and tools to
adequately respond to new challenges. This situation was partially remedied between 2003 and
2007, when municipal reform lobbying efforts resulted in significant legislative reforms first for
the City of Toronto and quickly extended province-wide (Horak, 2008). One tool extended is the
Development Permit System (DPS), an alternative regulatory mechanism for planning approvals.
The Province enabled the use of DPS in all municipalities effective January 1, 2007. In those
four years, only three municipalities have implemented a DPS: the Township of Lake of Bays in
Ontario's cottage country; the Town of Carleton Place, west of Ottawa; and the Town of
Gananoque, on the St. Lawrence River. With the benefits offered, the lack of uptake of DPS by
municipalities over the past three years requires investigation. This study examines the reasons
why municipalities in Ontario are not implementing DPS. This shall be measured by a survey of
senior planning administrators investigating these hypotheses and changing municipal practices,
as well as an investigation of the system’s performance in the Province’s first DPS-only
municipality: the Town of Carleton Place.
Organizational Behaviour, Planners, and DPS 2
1.0 About the Development Permit System
1.1 Powers and procedures
DPS is an alternative regulatory mechanism for the approval of development applications
in land use planning. The design of Ontario’s DPS is a variant on programs used elsewhere in
North America. DPS combines the three traditional, decades-old development planning
applications – Zoning By-law Amendments, Minor Variances, and Site Plan Approval – into one
application (Township of Lake of Bays 2006; Ministry of Municipal Affairs and Housing
[MMAH] 2008) by replacing the applicable Zoning By-law with a Development Permit By-law.
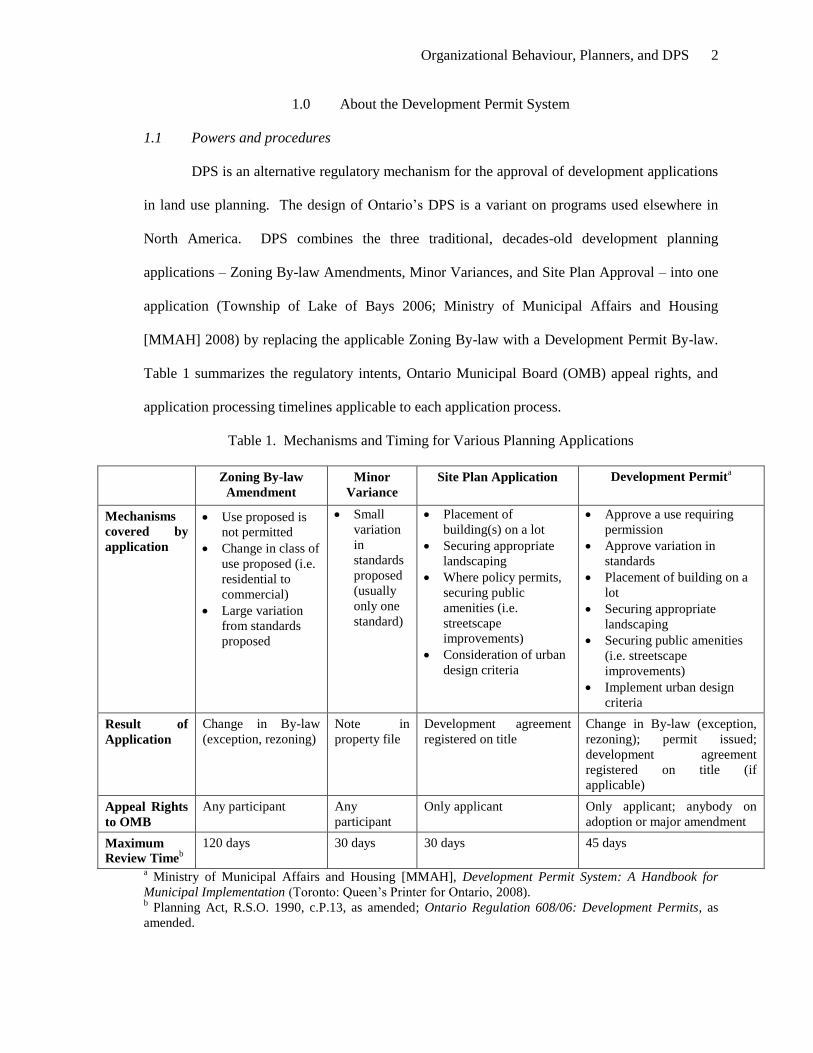
Table 1 summarizes the regulatory intents, Ontario Municipal Board (OMB) appeal rights, and
application processing timelines applicable to each application process.
Table 1. Mechanisms and Timing for Various Planning Applications
Zoning By-law
Amendment
Minor
Variance
Site Plan Application Development Permita
Mechanisms
covered by
application
Use proposed is
not permitted
Change in class of
use proposed (i.e.
residential to
commercial)
Large variation
from standards
proposed
Small
variation
in
standards
proposed
(usually
only one
standard)
Placement of
building(s) on a lot
Securing appropriate
landscaping
Where policy permits,
securing public
amenities (i.e.
streetscape
improvements)
Consideration of urban
design criteria
Approve a use requiring
permission
Approve variation in
standards
Placement of building on a
lot
Securing appropriate
landscaping
Securing public amenities
(i.e. streetscape
improvements)
Implement urban design
criteria
Result of
Application
Change in By-law
(exception, rezoning)
Note in
property file
Development agreement
registered on title
Change in By-law (exception,
rezoning); permit issued;
development agreement
registered on title (if
applicable)
Appeal Rights
to OMB
Any participant Any
participant
Only applicant Only applicant; anybody on
adoption or major amendment
Maximum
Review Timeb
120 days 30 days 30 days 45 days
a Ministry of Municipal Affairs and Housing [MMAH], Development Permit System: A Handbook for
Municipal Implementation (Toronto: Queen’s Printer for Ontario, 2008). b Planning Act, R.S.O. 1990, c.P.13, as amended; Ontario Regulation 608/06: Development Permits, as
amended.

Organizational Behaviour, Planners, and DPS 3
A Development Permit By-law is, in structural and content terms, similar to a Zoning By-
law. It contains use permissions and building and structure location, and size standards while
using maps to indicate the land use designation applying to each property in the By-law area.
However, a Development Permit By-law is allowed to contain or regulate beyond the scope of a
Zoning By-law. Specifically:
Use permissions can be conditional, allowing for their establishment without first
obtaining a planning approval provided certain criteria are satisfactorily met;
Building and structural locations can allow for flexibility on location or size as-of-right,
again provided certain criteria are satisfactorily met;
Environmental performance standards can be built into the By-law, better allowing for
minimum planting requirements, energy production or consumption, and ecological
monitoring standards to be applied; and,
Likewise, urban design standards and requirements can be included governing all types
construction and built heritage conservation (MMAH, 2008).
The four DPS By-laws prepared in Ontario have used DPS for three different purposes.
In Lake of Bays, DPS is used to protect and enhance the natural environment of its shoreline
residential areas and waterways (Township of Lake of Bays, 2006, p. 2). In Brampton, DPS will
be used to preserve and enhance the historic nature of a particular neighbourhood (City of
Brampton, 2011). In Carleton Place and Gananoque, DPS is used in the place of traditional
zoning to enable Staff to more strictly enforce the Official Plan, offering the streamlined approval
process as an incentive to outside developers (Young, 2011; Developer Interview #1, 2011).
1.2 Timeline and discussion of DPS in Ontario
DPS was launched as a pilot project in 2001, when the Province of Ontario adopted
Regulation 246/01 (O.Reg 608/06, §17). The regulation outlined four important issues: how the
Development Permit By-law would be structured, the matters the By-law could regulate, five

Organizational Behaviour, Planners, and DPS 4
municipalities authorized to pilot the system, and the process those municipalities were expected
to follow in creating and administering the By-law. It received cautious endorsement from the
organization representing land use planners in Ontario (Ontario Professional Planners Institute,
2004). The Township of Lake of Bays, the first – and ultimately only -- pilot municipality to take
advantage of the tool, adopted their Development Permit By-law, in 2004 (Township of Lake of
Bays, 2006).
As planners began to study the system, it quickly became a much discussed item in
professional literature. Much of that content was generated by Staff from the District of Muskoka
and the Township of Lake of Bays, detailing their experiences with preparing DPS. Another
large contribution came from Paul Bedford, the former Director of Planning for the City of
Toronto. In multiple articles, he recommended DPS as a solution to various civic design issues.
He described zoning as, “A cumbersome vehicle to encourage city-building, as it is actually
designed to do the opposite” (Bedford, 2005a). At its outset, industry practitioners were sold on
the potential for DPS to alleviate many policy implementation concerns. In a search of the online
archives of the Ontario Planning Journal, seven articles detailing DPS have been published since
2004. The November/December edition of the Journal featured two articles promoting DPS. The
first, written by Robert Lehman, FCIP1, RPP, promoted DPS as a mechanism for implementing
the qualitative policy requirements of the Province’s Greenbelt Plan (Lehman, 2004). The
second was written by Samantha Hastings, MCIP, RPP. It was a response pieve to an earlier
article on creative application of zoning to solve planning issues. She recommended the DPS
approach (at the time, the Lake of Bays By-law was being written) as the solution for such
challenging problems, and recognized the need for education and training to make the system
successful (Hastings, 2004). In 2005, two articles were published in consecutive issues by the
1 Acronyms used in this Section are as follows: FCIP: Fellow, Canadian Institute of Planners (recipients of
the Institute’s highest honour). MCIP: Member, Canadian Institute of Planners. RPP: Registered
Professional Planner (Ontario).
Organizational Behaviour, Planners, and DPS 5
former Director of Planning for the City of Toronto, Paul Bedford, FCIP, RPP. The first article
defined DPS as a tool for city building, with zoning having the opposite effect. “Why must we
rely on the baggage of yesterday to solve the problems of tomorrow?” he challenged readers to
consider (Bedford, 2005a). He followed up this piece with a case study of planning in
Vancouver, where Council has effectively delegated the “management” of development
approvals to Staff through the use of DPS (Bedford, 2005b). From there, however, discussion of
DPS disappears for four years. A 2009 article summarizing an urban design practitioner
workshop mentions DPS as an option for implementing design goals into regulations (Bell,
2009). In Spring 2010, Bedford published another case study. In summarizing program advances
in Miami, Florida, Bedford again recommends DPS as a mechanism providing the “fine tuning”
of development that implements the detailed vision spelled out in policy documents (Bedford,
2010). Lastly, the summary of the pre-test for this study was published in Spring 2011 (Nethery,
2011). This is summarized in detail in Chapter 3.1. Four additional articles simply mention the
existence of DPS, without providing any editorial commentary on the tool. A similar review of
other academic and professional literature turned up no articles on the topic of DPS in Ontario.
There was considerable chatter in the months leading up to the official launch of DPS in
Ontario. The volume of articles clearly slowed down as time progressed. The topic has also been
discussed three times at annual conferences of land use planners in Ontario: the 2004 joint
Provincial/National conference in Toronto, the 2006 Provincial conference in Alliston, and the
2011 Provincial conference in Ottawa2. Lake of Bays’ Director of Planning, Stefan Szczerbak,
was involved in the 2006 and 2011 presentations. The 2004 presentation was delivered by the
then-Co-Director of Planning for the City of Vancouver, Larry Beasley (Young, 2011). There, he
discussed the importance of their DPS in attracting and securing private sector interest in
redeveloping their waterfront (Young, 2011). The regulatory incentive provided to developers, as
2 At the time of writing, this was an upcoming conference. It was held October 12-14, 2011 in Ottawa.

Organizational Behaviour, Planners, and DPS 6
well as the innate streamlining their tool created, inspired planners to lobby the Province to
extend DPS to all municipalities (Young, 2011).
After a review of the Lake of Bays DPS, the Province did just that, enabling the use of
DPS in all municipalities effective January 1, 2007. To date, only three municipalities have
implemented a DPS: Lake of Bays, the Town of Carleton Place (2008) west of Ottawa, and the
Town of Gananoque (2010), on the St. Lawrence River. In reviewing the ages of Zoning By-laws
in 121 municipalities in Ontario, it was found that 30 of those had completed a Zoning By-law
Review between 2008 and the end of 2010. Of those 30, only Carleton Place and Gananoque
made the switch to DPS.
1.3 About Carleton Place
Carleton Place is a historic milling town, located approximately 50 kilometres and a 40
minute drive west of Ottawa in eastern Ontario. It has experienced similar challenges to other
small, industry-reliant communities across the country. The mills and other old factories have
largely closed, leaving a legacy of stately buildings with few to no tenants. Some buildings have
been demolished, leaving contaminated lands (“brownfields” in planning terminology) with
limited redevelopment potential. The historic main street, lined with three- and four-storey brick
buildings, is experiencing a stressful period of high vacancies. The retail heart of the community
has shifted to a new format retail centre (“power centre” or “big box stores”) to the south, along
the Highway 7 Bypass. Despite these challenges, the Town continued to grow at a rate of 0.8%
per year between 2001 and 2006, reaching a population today of approximately 9,500 (Statistics
Canada, 2007). While below the Ontario average, it is not a sign of stagnation, as new homes
continue to be built within the Town’s boundaries – and the adjacent rural municipalities
attempting to generate adjacent spin-off development (Young, 2011). Carleton Place is in the
midst of a transition toward a new raison d'être, with a complementary and appropriate service
sector to support its population.

Organizational Behaviour, Planners, and DPS 7
In June 2008, the Town of Carleton Place adopted Development Permit By-law 2008-50.
In doing so, they became the first municipality to completely do away with a Zoning By-law in
favour of DPS. The decision to make the switch to DPS came out of a crisis of sorts. A
controversial development – replacement of a heritage building on the Town’s main street with a
conventional format, single storey restaurant – was permitted under the zoning framework with
limited controls over architecture and design considerations (Young, 2011). Council was
unsatisfied with the process and its outcome, and sought out alternatives to prevent
uncharacteristic development from occurring again (Young, 2011). At first, a zoning update was
considered, but it could not possibly address issues of urban design to their satisfaction (Young,
2011). Ultimately, Staff recommended a Development Permit By-law for the historic main street,
but soon decided to extend it Town-wide as the structure of the DPS was quickly taking the form
of a Zoning By-law (Young, 2011). After an extensive consultation exercise, the Town of
Carleton Place adopted its Development Permit By-law.
Carleton Place defined five objectives their DPS should achieve:
Streamlining development approvals, and including built-in flexibility for variation from
permitted uses and performance standards;
Preservation of small-town design character including built heritage;
Improved commercial and employment opportunities;
Provision of recreational facilities; and,
Preservation of a “healthy Mississippi River” (Town of Carleton Place, 2008, §1.0).
To date, no comprehensive evaluation of Carleton Place is DPS has been undertaken.
Other municipalities and development professionals are watching Carleton Place to see how the
system works, with an eye toward considering the Development Permit System (DPS) as an ideal
tool for implementing a community's design agenda.

Organizational Behaviour, Planners, and DPS 8
1.4 Advantages of DPS over traditional zoning
Theoretically, DPS offers five main benefits to all stakeholders: Council, Staff, the
development industry, and the public. First, the DPS provides more up-front regulatory certainty
on development issues to applicants and residents, with most relevant information being
contained in one document constituting applicable law -- the Development Permit By-law --
rather than in multiple documents or policy “guidelines.” The enabling regulation allows for
more fields of influence to be regulated in a Development Permit By-law than under a Zoning
By-law. These include vegetation retention, stricter urban design guidelines, and conditional use
permissions subject to meeting specified criteria (Township of Lake of Bays 2006; MMAH 2008;
Almond 2009). Having specific standards leaves less room for ad hoc interpretation of generally
generic policies. Second, development approvals tend to be completed quicker, as mandated by
the Planning Act and created by the inherent structure of the system (MMAH 2008). The relative
speed of the development permit process -- maximum legislated review time of 45 days -- versus
a zoning-based framework -- maximum legislated review time of 120 days for zoning, plus 30
days for a Minor Variance and 30 days for Site Plan Approval -- offers significant, quantifiable
time advantages to developers and growth-sensitive municipalities (MMAH 2008; Szczerbak
2010). Third, only one application is required to obtain all planning approvals. Up to three
applications (but more commonly, two) are required to satisfy planning concerns under a zoning-
based framework. Fourth, the enabling regulation allows as-of-right approvals where the
development proposed varies from the maximum permitted or minimum required standards to be
delegated to a staff level approval. Both Carleton Place (2008) and Lake of Bays (2010) have
delegated some approvals in this fasion. Finally, DPS limits OMB appeal rights on applications
within the permitted variances in the By-law to the applicant(s) only (MMAH 2008; Almond
2009). The significance of this innovation is that if a development application falls within the
range of flexiblity permitted in the Development Permit By-law, only the applicant can appeal a
refusal of or non-decision on the application, or the conditions attached to an approval (O.Reg

Organizational Behaviour, Planners, and DPS 9
608/06, §12). Significant applications, including amendments to land use designations or
proposals having variations larger than the maximum range contemplated would still maintain a
public right to appeal.
1.5 Disadvantages of DPS over traditional zoning
There are no written sources discussing the disadvantages of DPS in the Ontario context.
During the pre-test of the survey component of this study, one respondent commented that DPS
was insufficiently flexible, requiring “regulations that make the process more nimble (comparable
to the Niagara Escarpment Commission)” and supporting resources to make it “worth the effort”
(Pre-test Respondent #4, 2010). Given the dearth of literature on DPS, this constitutes the most
comprehensive dissention available. Other disadvantages further detailed in Chapter 2 are:
Appeal rights on development permit applications where the proposal meets some
standard built into the By-law are limited to the applicant only (2.4);
The learning curve associated with a new approvals process (2.5); and,
Cost concerns, as the visioning component of the planning policy review may need to be
more detailed than in other projects (2.7).
2.0 Hypotheses to be Tested
While a DPS planning framework appears similar in nature to a zoning-based framework,
it represents a significant change in the operational culture of a planning department. Three main
DPS-instigated changes illustrating this shift include the delegation of decisions to staff from the
Council level, the introduction of discretionary or conditional permissions, and the removal of
appeal rights from non-applicant parties. DPS could be of much benefit to governments, the
development industry, and the civic minded, but may be greeted with skepticism by other
members of the public.3 That municipalities clamoured for additional legislative capability to
3 Interviews with staff in both Lake of Bays and Carleton Place suggest otherwise, that the public is
supportive of DPS where they apply. A more comprehensive investigation of the public would be required
to confirm these claims.

Organizational Behaviour, Planners, and DPS 10
tackle problems such as urban design and environmental regulation in the development process
but have not turned to a DPS-based approach to planning approvals is of interest to researchers.
If reasons behind this hesitance can be obtained, an appropriate response can be tailored to
encourage more uptake of DPS.
Given the relative newness of DPS in Ontario, there is virtually no literature available on
the system and the experiences of the two municipalities in adopting and maintaining these By-
laws. Therefore, it falls to theories of organizational behaviour, framed within the context of
public administration, to explain any issues or obstacles related to the lack of DPS uptake. It is
accepted that western-style liberal democratic government is not normally a venue for
revolutionary programming. The necessity of considering multiple inputs in decision-making
leads decision-makers to the most agreeable policy, not necessarily the best policy (Lindblom,
2001). Conversely, the push toward New Public Management (NPM) philosophy in Ontario
municipalities sought to inject “innovation” and “risk” in the pursuit of “efficiency.” The Harris
government were major champions of NPM, trying to reform the structure and purpose of
government to encourage autonomy and service delivery in municipalities (Siegel, 2004; Pal,
2010, pp. 85-87). In an overall sense, the rhetoric of the past few years indicates a desire for
change in how municipalities conduct business. DPS is such a tool that represents a fundamental
change in how development approvals are granted, but with an operating framework based upon
three existing planning tools. It could represent the perfect blend of incrementalism and service
improvement. So why aren’t municipalities adopting DPS By-laws with the same clamour used
in the past decade to pursue these powers? This study considers the following eight hypotheses
as reasons why planners are not promoting DPS as a policy alternative.
2.1 The natural conservatism of land use planners
The first hypothesis is that relevant stakeholders (staff, Council, and the development
industry) are naturally conservative and averse to change, and not as ready to accept risk as their
language suggests. This classical view of risk aversion is an inherent part of the political culture

Organizational Behaviour, Planners, and DPS 11
of Ontario. Evidence of this can be found extending back 100 years in academic literature
(Wickett, 1900; Crawford, 1940; Curtis, 1942; MacDonald, 1994). The economic post-war boom
in industrial Ontario was governed by an effectively unbroken Progressive Conservative dynasty.
The nine majority governments won by the party are indicative of and reinforce Ontario's history
of minimal intervention, consensus governance, and equitable development across Ontario
(MacDermid & Albo, 2001). Municipal Act reform, extensions of grants and infrastructure
funding from senior governments, and other related policy amendments are all part of a neoliberal
shift toward municipal autonomy within the small sphere of influence under municipal control
(Siegel, 2009). On the issue of land use planning, however, this is not translating into effective
action by municipalities. Perhaps talk on autonomy is actually trumped by the historically
cautious nature of politics in Ontario, and that there is little actual appetite for change in the area
of land use planning.
2.2 Council desire to maintain power
The second hypothesis is that municipal Councils are reluctant to delegate power to staff.
The accepted framework for Council-staff relations is that Council forms the policy and makes
decisions on matters, while administrators provide advice to Council on the development and
implementation of policy (Tindal & Tindal, 2009). Legislation and custom normally, in fact,
ensure that elected officials are the ones making the decisions (Gildenhuys, 2004). There is a
special sensitivity to this in the Greater Toronto Area. Policies such as the Growth Plan for the
Greater Golden Horseshoe and the Greenbelt Plan reinforce the Province's ability to control
planning matters (Pond, 2009). Many municipalities have not appreciated what, from their
perspective, is “officious” treatment of their interests. While the DPS regulation under the
Planning Act allows for delegation of authority, it may be that Council is unwilling to release
some of its powers to staff for any number of reasons. Kernagahan, Marson and Borins (2005,
pp. 175-177) note that such delegation of decision-making on discretionary matters may run

Organizational Behaviour, Planners, and DPS 12
counter to the notion of accountability of politicians. DPS could alter this power dynamic greatly
in favour of planning staff.
2.3 Presence of a catalyst event
The third hypothesis is that the municipality has experienced some sort of event that has
resulted in a review of process options. As noted, Carleton Place began to consider DPS when an
undesirable development triggered a review of their existing zoning framework (Young, 2011).
Organizational difficulty can manifest itself in many different ways (Anderson & Ackerman
Anderson, 2001, pp. 39-42). It is acknowledge that public administrators are excellent at
implementing incremental change (Lindblom, 2001). However, DPS does not represent
incremental change. It is highly transformative, responding to environmental threats to the
operating environment of the municipality (Anderson & Ackerman Anderson, 2001, pp. 39-42).
The logic follows that if the approvals process is broken, it would not provide the quality of
development desired by the municipality. Once manifested and observed by political forces, staff
would be shocked into action. It should be investigated if there is a link between consideration of
DPS and one of these wake-up calls occurring, in the form of a political or development incident.
As a subset of this question, the 2010 municipal election should be investigated as one such
event.
2.4 Criticism from activist planning theory
The fourth hypothesis rests on activist planning theory and a critique of the removal of
public input on certain development applications in a DPS. A DPS can be structured to limit
public input on certain approvals delegated to the staff level (Township of Lake of Bays, 2006;
Town of Carleton Place, 2008), and appeals by the public are available only at the point of
adoption of, or an amendment to, the Development Permit By-law (MMAH, 2008) or major
applications such as a redesignation. The history of public involvement in contemporary
planning exercises stems from the planning exercises of the post-war period. Many decisions
about growth between the 1950s and 1970s were technocratically driven. This ‘scientific’

Organizational Behaviour, Planners, and DPS 13
approach to planning extended inordinate influence to non-elected officials, whose plans were
‘rubber-stamped’ by the Councils of the day: expressway plans, downtown redevelopment plans,
suburban master plans, and more (Sewell, 1995; Bocking, 2006). Best personified by the struggle
over the Spadina Expressway, planning proposals from the public sector have long been
distrusted as unrepresentative of the communities they are to represent (Sewell, 1995). The chief
concern in activist planning, to this day, is that Staff and Council are too cozy with the interests of
the development industry (McAllister, 2004). The activist response was to ensure a public say on
any such decision, and to minimize the influence of technocratic elements in municipalities. The
public expect the opportunity to comment on development projects, and appreciate that an appeal
route to the OMB exists if they believe good planning practice has not occurred.4
2.5 Institutional lack of knowledge about DPS
Fifth, it cannot be discounted that there is a lack of awareness of how DPS works, given
its newness. Planners may not understand how it works – or even if they can use it, given the
original launch of DPS in 2001 was limited to five municipalities in a pilot project (MMAH,
2008) and quietly extended to all municipalities six years later. Survey pre-testing suggested that
individuals were curious in knowing the experiences of Lake of Bays and Carleton Place with
DPS, but were unable to locate information on their own.
2.6 Satisfaction with current approvals framework
The sixth hypothesis proposed is of the persuasive variety. As identified in the
November 2010 pre-test, it may be that the municipality is not convinced of the benefits of DPS,
or that traditional zoning is a fundamentally better approach than DPS. For example, the
adoption and application approval processes may be viewed as more cumbersome than existing
processes. Simply put, the respondent may believe that ‘if it ain't broke, don't fix it.’ This is
4 A municipality can, if it so chooses, structure its DPS to require public comment on any Development
Permit application. Based on the Lake of Bays and Carleton Place experiences, it is assumed that any DPS
would incorporate some Staff-level decision-making.

Organizational Behaviour, Planners, and DPS 14
valid, given that the most significant literature on DPS prepared by the Province provides only
descriptive paragraphs and flow charts to indicate how the system works, not evidence of how the
system works (MMAH, 2008). If this hypothesis proves to be significant, it would suggest that
an issue exists in how DPS functions that limits its usefulness outside of very site-specific
contexts. As an aside, individuals who considered DPS but decided against it are of particular
research interest from a qualitative perspective. They will offer critical insight into suggesting
improvements to the DPS framework that would make it a more desirable option than zoning.
2.7 Time or cost concerns
The seventh hypothesis is that implementing a DPS is too time consuming or too cost-
prohibitive a project to be undertaken. Preparing a new Zoning By-law is an expensive
undertaking, routinely exceeding $100,000 even in small municipalities -- and up to $400,000 in
larger municipalities (Town of Oakville, 2008). Workload forecasting is done using a ten-year
timeframe, in order to justify the development charges collected in support of these projects.
Oakville forecasts their zoning money being spent over three years: 2009 to 2011. In Lake of
Bays, the DPS process initiated in 2001 was completed in 2004 (Township of Lake of Bays,
2006). Other zoning projects often take two years to complete, and are complicated undertakings
in their own right. These are expensive projects, and a municipalitiy may deem it impossible to
accommodate a DPS implementation project outside of its forecasted work program.
2.8 Various demographic or municipal structural factors
The last hypothesis involves demographic realities of planning departments and
respondent municipalities. There are any number of structural factors that can influence the
structure of decision making. For example, it may be that larger departments are more opposed to
change – personified by DPS – than smaller departments, if Lindblom’s branch theory is applied
(Lindblom, 2001). Likewise, it may be that more recent graduates from an academic program are
more likely to consider the ambitious DPS program as opposed to those longer out of school. It is

Organizational Behaviour, Planners, and DPS 15
proposed to use information about the municipalities surveyed to identify any potential links
between the following factors, listed in Table 2, and how seriously DPS was considered:
Table 2. Indicators Proposed for the Demographic Hypothesis
Variable Indicator Reason for Measuring
Education level
attained by
respondent
Highest schooling
achieved, from a list
To investigate if further or additional schooling affects the
hypotheses
Last year spent in
school
To investigate if more recent schooling affects the
hypotheses; can be grouped for analysis
Gender of
respondent Male/female To investigate if gender affects the hypotheses
Age of respondent Age, in years To investigate if age affects the hypotheses; to be grouped
Length of
respondent’s
career
Tenure as Director, in
years
To investigate if the length of time a Director has been in
the position affects the hypotheses; can be grouped for
analysis
Total career, in years
To investigate if the length of time a planner has been in
the profession affects the hypotheses; can be grouped for
analysis
Size of planning
department
Number of Registered
Professional Planners
(RPPs) on staff
To investigate if the size of a planning department affects
the hypotheses; can be grouped for analysis
Municipal
population Population in 2006
To investigate if the size of a municipality affects the
hypotheses; can be grouped for analysis
3.0 Project Methodology
This Study was undertaken in three parts: a survey pre-test, the full survey, and a
program evaluation from the case municipality, Carleton Place.
3.1 Survey pre-test;
The first version of this study proposed to test six hypotheses. A two-question survey
was circulated to one senior planning administrator in each of 15 municipalities across Ontario.
One administrator’s e-mail server would not accept the invitation to participate, and a
replacement municipality was selected to maintain a sample of 15 administrators. The sample
was composed of mostly medium-sized municipalities5 in the hope that smaller departments
5 The smallest municipality surveyed has a population of 16,390, according to the 2006 Census of Canada.
The largest has a population of 504,559. The median population in the sample was 82,184. The mean was
144,888.

Organizational Behaviour, Planners, and DPS 16
would be more likely to complete the survey. A reminder e-mail was sent one week later. The
survey asked respondents to complete two parts:
1. Respondents were told that their municipality had been selected for this survey based
upon the author’s knowledge of recent policy approvals of new development lands
(residential, employment, or both), significant redevelopment-supportive land use plans
(such as a Secondary Plan) or community reinvestment schemes. The reason for
choosing such municipalities is that regulatory implementation of these policies has
either recently finished or will be occurring shortly. In discussions on implementation,
had they considered using a Development Permit By-law?
2. A list of 64 phrases was then presented to respondents, capturing some first impressions
around implementing and administering a Development Permit By-law, or planning work
in general. Respondents were asked to select as many of those phrases that, in their
opinion, applied to their municipality.
The 64 phrases developed flow from and address one of the six hypotheses outlined
above. Each hypothesis had 12 phrases (except for one, which had only four negative phrases
produced), phrased positively or negatively and randomized to mitigate against design bias and
trending. The number of times each phrase was selected produced an absolute count of each time
an administrator has considered an aspect of DPS. By tallying one positive point per positive
phrase mentioned and subtracting one negative point per negative phrase mentioned, an inventory
of positive and negative indexes was created. These findings tested the magnitude of each
hypothesis being polarizing. The study concluded that implementation of DPS appeared to be
hindered by cost and timing concerns, Council desiring control over planning decisions, and a
need for training and education opportunities specific to DPS (Nethery, 2011).
3.2 Full survey
A revised survey was prepared and circulated in June and July 2011. All municipalities
in Ontario are required to have a development planning framework, which makes all

Organizational Behaviour, Planners, and DPS 17
municipalities relevant for this study. However, not all municipalities have a dedicated staff
person assigned to planning matters. In many small municipalities, it is the Clerk who handles
this role. Given that there are 415 single- or lower-tier municipalities in Ontario (MMAH, 2011),
only municipalities having over 1400 permanent residents were first chosen to participate – a total
of 315 municipalities, or a cull of 100 municipalities. To ensure that municipalities with a
significant recreation-based component were included in the survey6, municipalities also having
over 1000 residences were also included, adding 8 municipalities to the sample. In total, 323
municipalities were selected to participate in the survey. The survey would be sent to one Staff
member in each municipality, selected in the following preferential order:
A sub-manager in the Planning Department, such as the Manager/Director of Policy
Planning or Manager/Director of Development Planning;
The Director of Planning, the one individual solely in charge of land use planning;
The Manager of Planning/Building/Development Services, the individual in charge of
growth-related matters;
A planning consultant identified as the chief land use planner for the municipality;
The Planning Administrator, being the Staff member named as the primary contact for
land use planning inquiries; or finally,
The Clerk, CAO, Treasurer, or Deputy Clerk in small municipalities without an identified
planning function.
Some invited municipalities share planning services with other municipalities. There are
three circumstances where this occurs: a consultant works in multiple municipalities, the
municipality is part of a Planning Board covering several municipalities, or the upper-tier
municipality provides planning services and assigns a planner to multiple municipalities. After
eliminating these duplicates, the survey distribution list was set at 303 recipients. In order to
6 Statistics Canada does not recognize individuals owning recreational properties in the population of that
municipality, but does include those households in the total count.
Organizational Behaviour, Planners, and DPS 18
obtain sufficient cases to ensure that the study results are statistically significant to within 5%, 19
times out of 20, a total of 169 responses would be required to generalize to the survey population,
and 200 responses to generalize across Ontario (O'Sullivan, Rassel, & Berner, 2008, pp. 156-157,
170). This difficult, 50% standard could not be achieved. However, 131 usable responses were
received, representing a response rate of 43.2%7.
The survey started by asking respondents if they had considered DPS as a mechanism for
planning approvals. Those answering “yes” were asked how seriously, on a scale of 1 –
representing personal consideration – to 10 – representing a Council-level discussion – DPS was
considered by the municipality. The survey followed with a number of demographic-related
questions about the municipality and its planning activities:
Of the municipality: its size;
Of the respondent: gender, age, length of tenure in the position, highest level of education
attained, and last year in formal education; and,
Of the planning department or function: number of Registered Professional Planners
(RPPs), and an estimate of the number of applications of all types processed in a typical
month.
Demographic statistics, all consisting of categorical or numerical options, are collapsed
into nominal categories based upon like values to facilitate statistical analysis. The categories are
explained within Chapter 4.8. All respondents completed this portion of the survey.
After gathering this data, the survey asked respondents to evaluate 22 phrases, based
upon how strongly they agree or disagree with the phrase. The phrases are grouped into one of
the seven organizational behavioural hypotheses (one phrase for the lack of institutional
knowledge hypothesis; six phrases being part of the catalyst event hypothesis, three being generic
7 This figure includes 126 complete surveys (96.2% of all responses), and 5 partial responses (3.8%) with
sufficient information for analysis. Seven additional responses were discarded due to insufficient number
of questions answered to be useful for analysis.

Organizational Behaviour, Planners, and DPS 19
and three being specific to electoral politics; and three for all others). The majority of phrases are
framed in the same direction regarding support for, or resistance against, DPS. These hypotheses
include Council maintenance of power (Chapter 4.4); both catalyst event questions (Chapter 4.5);
and satisfaction with the current framework (Chapter 4.8). The time or cost concerns hypothesis
(Chapter 4.9) has one phrase whose direction is reversed for testing purposes in order to align
direction. Upon review, one phrase under the conservatism of planners hypothesis (Chapter 4.3)
was determined to be not prima facie related to the hypothesis, and was not included in the
relationship testing. For the same reason, only one phrase was created and used for the
institutional lack of knowledge hypothesis (Chapter 4.7). The criticism of activist planning
theory (Chapter 4.6) contains three diverse phrases, with each being tested independently. This
portion of the survey was completed by 126 respondents (96.2% of total respondents).
A nine-tier, Likert-type scale is used for responses, ranked from strongly disagree (1)
through neutral (5) to strongly agree (9). For ease of analysis, these responses are grouped to
create three equally weighted categories of responses: disagree (1-3), neutral (4-6), and agree (7-
9). The total number of responses is averaged to create a grouped number of responses per
category, with decimals rounded up or down to the nearest whole number. These categories
support hypothesis testing to evaluate the level of statistical significance between each proposed
organizational behavioural hypothesis and a respondent’s consideration of DPS – the ultimate
purpose of this study. By using cross-tabulation, the chi-square test establishes if the relationship
between the two variables is statistically significant (Meier, Brudney, & Bohte, 2009, pp. 261-
266). If so, the second step calculates the strength of that relationship, primarily using Cramér’s
V (Meier, Brudney, & Bohte, 2009, pp. 278-279). A copy of the survey and all responses
received is attached as Appendix ‘A’ to this study.
3.3 Program evaluation
The survey approach leaves program performance, a key aspect of the staff-policy
dynamic, unexplored. Program performance adds additional weight and commentary to the

Organizational Behaviour, Planners, and DPS 20
hypothesis testing by evaluating just how well – or how poorly – DPS works. One week was
spent working alongside Town Staff in Carleton Place. A review of five years of development
application files was undertaken, to quantify a number of indicators about how DPS is performing
in Carleton Place. The five-year timeframe was bisected by the adoption date of Carleton Place’s
DPS in June 2008. From the objectives mentioned in Chapter 1.3 – streamlined development
approval including built-in flexibility for variation from permitted uses and performance
standards, preservation of small-town design character including built heritage, improved
commercial and employment opportunities, provision of recreational facilities, and preservation
of a “healthy Mississippi River” (Town of Carleton Place, 2008, §1.0) – a series of indicators can
be derived to answer whether or not the DPS-based planning program is performing better than
the previous zoning-based framework. A tally of each indicator was created around both sides of
June 2008 to calculate pre- and post-DPS statistics. These are summarized in Table 3:
Table 3. Indicators Evaluated in Carleton Place
Indicator and Value Question to be
Answered Unit of Measurement
Number of applications
approved
(Development application
review a core function of
planning departments)
Has the number
of applications
approved
changed since
the adoption of
DPS?
Number of applications received within review
timeframe (classified by Type I, II or III per By-
law), less refusals
Compare against number of applications for ZBAb,
MVb, Site Plan Control pre-DPS
Observations likely influenced by the economic
downturn
Length of time of review
(Identified intent in both
Lake of Bays and Carleton
Place DPS)
Are
applications
being reviewed
faster?
Average number of days per application spent
in review
In Carleton Place, time period is defined as
between the date of the application being accepted
as complete and the date of the final decision OR
adoption of a site-specific Site Plan Control By-law
(pre-2007) OR the date of execution of a
development agreement
Number of applications
needing Council approval
(Carleton Place DPS
delegates Type I and II
applications to Staff – with
‘bump-up’ option for
Council review of Type II)
How many
applications
were filed,
sorted by Type,
as defined in
§2.17 of By-law
2008-50?
Number of DPS applications proceeding to
Council or the Committee of Adjustment for a
decision, versus remaining with Staff
Compare against pre-DPS number of applications
requiring Council or Committee of Adjustment
approval

Organizational Behaviour, Planners, and DPS 21
Indicator and Value Question to be
Answered Unit of Measurement
Number of “Community
Amenities” obtained
(DPS theoretically enables
municipality to secure better
amenities than zoning
process) a
How many
community
amenities were
secured through
approvals?
Number of community amenities obtained
through planning approvals (to be defined with
Town Staff)
Compare against pre-2008 count of such amenities
contained in development agreements (Site Plan
process)
Amenities could include benches, improved
architecture or street plantings
Number of appeals of
planning applications to
Ontario Municipal Board
(Streamlined process includes
spending less time and
money on legal matters)
How many
applications
were appealed
to the OMB?
Number of applications appealed to the OMBb
Compare pre- and post-2008 counts of appeals to
the OMB
a The number of applications and their nature did not allow for a more diverse range of amenity criteria to
be investigated. This shall be discussed in Chapter 4. b MV: Minor variance. ZBA: Zoning By-law Amendment. OMB: Ontario Municipal Board.
A quick comparison of the data allows for general conclusions about the performance of
DPS. It does not, however, attempt to account for external influences or broader trends at play in
Carleton Place. For example, the economic recession of 2008-2010 falls within the evaluation
period, and entirely during the period where DPS applied. This slowed development activity in
Carleton Place. Likewise, the beginning of the evaluation period captures the tail end of a large
commercial centre development in the Town, increasing the number of development applications.
No statistical analysis was undertaken with the data, meaning that it should only provide
contextual applicability to the reader. A summary copy of all data collected, with biographical
identifiers removed, is attached as Appendix ‘B’ to this study.
Three interviews were conducted with development industry stakeholders in order to
capture their experiences in obtaining development approvals in Carleton Place that may not
otherwise be reflected in the data. Town Staff provided contact information for a number of
private sector developers who had applied for a Development Permit. In the end, two developers
(Developer Interview #1, 2011; Developer Interview #2, 2011) agreed to be interviewed, on the
condition of anonymity in this report. The interviews lasted a half hour each and started with one
question: “What was your experience obtaining a planning approval in Carleton Place?” Any

Organizational Behaviour, Planners, and DPS 22
subsequent questions asked sought clarification on points raised in the first question. The content
of the interviews has been used for adding context or elaboration to the survey results and
evaluation findings. A copy of the question list is attached as Appendix ‘C’ to this report.
3.4 Study validity
To ensure that events outside of the study hypotheses are not influencing a municipality’s
consideration of DPS, this study has broadened the range hypotheses (and associated variables)
for investigation, resulting in a robust data set suitable for hypothesis testing and basic statistical
analysis. Positive and negative phrases are used to try and even out any stimuli generated by the
implicit use of those opposite opinions. The questionnaire and sample design (surveying all
municipalities in Ontario) is designed to create group mean scores analyzing barriers to
organizational behaviour. The balanced, ordinal scale for evaluating responses to phrases (1 to 9)
eliminates the potential for outlier cases. Experimental mortality and instrumentation issues are
considered to be low, as 96.2% of respondents completed the entire survey. While respondents
may consult with other respondents (land use planning being a small fraternity), the discussion
would in fact be beneficial as the intent of this study is to further discussion on DPS. There is
potential for respondents to delegate or forward the survey to another member of the department.
The survey was addressed to the identified respondent, but was otherwise structured so that any
individual competent with a municipality’s planning process could respond. Indeed, some
respondents advised they had forwarded the invitation to another individual who dealt more
closely with planning approvals. The emailed survey was hard coded to only allow for one
response per email invitation, ensuring no duplicate responses. The lessons learned from this
study can potentially be applied to municipal programs in general, given the wide range of
hypotheses being considered.

Organizational Behaviour, Planners, and DPS 23
4.0 Analysis
In trying to identify what relationships exist between organizational behaviours and the
consideration of DPS, this study shall undertake a number of relationship tests. The strong
response rate allows for considerable hypothesis testing. The analysis is sorted by each
hypothesis, with an introductory section summarizing the overall findings of the survey.
4.1 Overall consideration of DPS
The first survey question collected information on the survey’s most critical question: did
the respondent ever, at any time, consider DPS for planning approvals in their municipality?
One-quarter of respondents answered in the affirmative, as summarized in Figure 1.
Figure 1. Respondents who had Considered DPS to Any Degree (n = 131)
Respondents who answered in the affirmative were given a second question. Each was
asked to state, on a scale of 1 (being personal consideration only) to 10 (Council-level
discussion), how seriously they or their municipality had considered DPS. The number of
responses is shown in Figure 2.
97
34
No
Yes

Organizational Behaviour, Planners, and DPS 24
Figure 2. Degree to which DPS was Considered (n = 34)
If the midpoint of this scale is deemed to be the division between “serious” and
“informal” consideration, this survey suggests that less than 40% of respondents (13, or 38.2%)
considered DPS at a serious level. That figure increases to exactly 50% (17 responses) if the
midpoint is set between 4 and 5. At the outset of this study, it was assumed that more planning
administrators would have considered DPS than this survey suggests. DPS has been documented
in professional literature, is promoted by the Ministry of Municipal Affairs and Housing, and has
been presented at three professional conferences in Ontario. Splitting “yes” responses into
degrees of seriousness for analysis may limit the analytical potential of the data. Accordingly, the
remainder of the analysis for this study considers all “yes” responses as equal in importance.
4.2 Various demographic or municipal structural factors
Gender. The first demographic consideration for this study is whether or not gender had
an impact on the consideration of DPS. Table 4 summarizes the relationship testing undertaken
on this variable.
0
1
2
3
4
5
6
7
8
1 2 3 4 5 6 7 8 9 10
Nu
mb
er
of
Re
spo
nd
en
ts
Degree of Consideration Personal
Consideration
Council
Level

Organizational Behaviour, Planners, and DPS 25
Table 4. Hypothesis Testing Results for Gender
N=131 Male Female Total Observed
Yes to DPS 25 9 34
No to DPS 49 48 97
Total Observed 74 57 131
Chi-square (χ2), at 1 degree of freedom 5.425
p value 0.020
Cramér’s V 0.203
Gender dynamics are often ignored in research studies, yet represent a key component of
organizational culture and communications (Mills & Helms Mills, 2007, pp. 334-340). The
testing confirms that the null hypothesis (the relationship being purely coincidental) can be
rejected at a 98% confidence level. The association between the respondent’s gender and their
own consideration of DPS is statistically significant. However, the relationship is only somewhat
strong (magnitude of relationship equalling 20.3%) according to Cramér’s V.
Age. The second demographic consideration for this study is the age of the respondent.
Table 5 summarizes the relationship testing undertaken on this variable.
Table 5. Hypothesis Testing Results for Age
N=130 <40 40-44 45-49 50-54 ≥55 Total Observations
Yes 5 7 9 6 7 34
No 28 7 22 17 22 96
Total Observations 33 14 31 23 29 130
Chi-square (χ2), at 4 degrees of freedom 6.384
p value 0.172
Cramér’s V 0.222
It was thought that with multiple generations of individuals potentially working in the
same organization, age could be a source of conflict (Lancaster & Stillman, 2002, p. 4; Espinoza,
Ukleja, & Rusch, 2010). However, the testing cannot support the rejection of the null hypothesis
(the relationship being purely coincidental). The association between the respondent’s age and
their own consideration of DPS does not appear to be of any statistical significance. Any

Organizational Behaviour, Planners, and DPS 26
relationship that does exist is somewhat strong (magnitude of relationship equalling 22.2%)
according to Cramér’s V.
Respondent level of education. The third demographic consideration for this study is the
respondent’s level of formal education. Table 6 summarizes the relationship testing undertaken
on this variable.
Table 6. Hypothesis Testing Results for Respondent Level of Education
N=131 College
Diploma
Bachelor’s
Degree Master’s
All Other
Scenariosa Total Observations
Yes 2 17 10 5 34
No 14 35 30 18 97
Total Observations 16 52 40 23 131
Chi-square (χ2), at 3 degrees of freedom 2.967
p value 0.397
Cramér’s V 0.150 a Some college, some undergraduate, some graduate or post-graduate schooling, doctorates, and five
other miscellaneous responses.
The testing cannot support the rejection of the null hypothesis (the relationship being
purely coincidental). It was thought that there may be a link between formal education and the
consideration of alternative approval mechanisms. The association does not appear to be of any
statistical significance.
Respondent length of tenure in current position. The fourth demographic consideration
for this study is the respondent’s length of time in his or her current position. Categories are
structured so that respondents identifying with one of the boundary years – two years, five years,
ten years, or twenty years – are included in the lower category. Table 7 summarizes the
relationship testing undertaken on this variable.
Table 7. Hypothesis Testing Results for Respondent Tenure
N=130 <2 2-5 5-10 10-20 >20 Total Observations
Yes 4 8 9 8 5 34
No 13 31 21 18 13 96
Total Observations 17 39 30 26 18 130
Organizational Behaviour, Planners, and DPS 27
Chi-square (χ2), at 4 degrees of freedom 1.240
p value 0.872
Cramér’s V 0.097
It was thought that there may be a correlation between how long a respondent was in their
current position and the consideration of DPS. Perhaps people new to the senior position would
bring new ideas and perspectives to planning, and are limited in their ability to promote new ideas
(Bratton & Grant, 2007, p. 185). It turns out that this was the weakest performing demographic
variable in the study. Tenure in a single position can overlook that the respondent likely has
worked as a land use planner for their entire career. The testing cannot support the rejection of
the null hypothesis (the relationship being purely coincidental), and that tenure is likely
completely unrelated to the consideration of DPS.
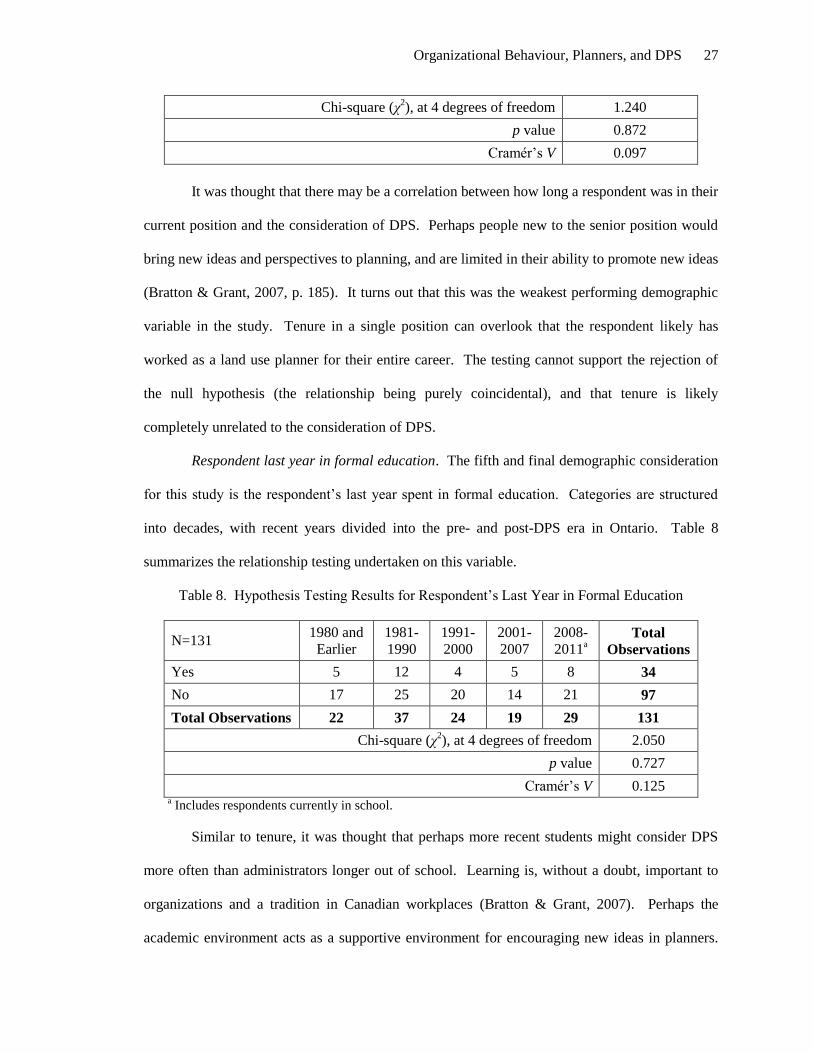
Respondent last year in formal education. The fifth and final demographic consideration
for this study is the respondent’s last year spent in formal education. Categories are structured
into decades, with recent years divided into the pre- and post-DPS era in Ontario. Table 8
summarizes the relationship testing undertaken on this variable.
Table 8. Hypothesis Testing Results for Respondent’s Last Year in Formal Education
N=131 1980 and
Earlier
1981-
1990
1991-
2000
2001-
2007
2008-
2011a
Total
Observations
Yes 5 12 4 5 8 34
No 17 25 20 14 21 97
Total Observations 22 37 24 19 29 131
Chi-square (χ2), at 4 degrees of freedom 2.050
p value 0.727
Cramér’s V 0.125 a Includes respondents currently in school.
Similar to tenure, it was thought that perhaps more recent students might consider DPS
more often than administrators longer out of school. Learning is, without a doubt, important to
organizations and a tradition in Canadian workplaces (Bratton & Grant, 2007). Perhaps the
academic environment acts as a supportive environment for encouraging new ideas in planners.

Organizational Behaviour, Planners, and DPS 28
This hypothesis performed no better and likely for similar reasons. Planners can drop out of the
workforce and return to school, or complete degrees part-time, or undertake other forms of
continuing education. The testing cannot support the rejection of the null hypothesis (the
relationship being purely coincidental), and that tenure is likely completely unrelated to the
consideration of DPS.
Size of municipality. After investigating demographic variables, the survey asked
respondents to provide background information on their municipalities and planning departments.
Each respondent was first asked to indicate the population of their municipality. Table 9
summarizes the relationship testing undertaken on this variable.
Table 9. Hypothesis Testing Results for Size of Municipality
N=131 ≥40,000 10,000 -
39,999 >10,000 Total Observations
Yes 10 16 8 34
No 14 35 48 97
Total Observations 24 51 56 131
Chi-square (χ2), at 2 degrees of freedom 7.830
p value 0.020
Cramér’s V 0.244
The testing confirms that the null hypothesis (the relationship being purely coincidental)
can be rejected at a 98% confidence level. The association between municipal population and the
respondent’s own consideration of DPS is statistically significant. However, the relationship is
somewhat to moderately strong (magnitude of relationship equalling 20.3%) according to
Cramér’s V. Larger municipalities typically possess more detailed rules and skill specialization
than in smaller municipalities (Bratton & Chiaramonte, 2007, p. 474), likely increasing the
number of conversations held around advanced policy solutions. Meanwhile, the Province
promotes DPS as a tool for many different contexts (MMAH, 2008). Originally, the survey
contained a separate category for municipalities over 100,000. The respondent sizes made chi-
square analysis unreliable, while the survey size was too large for reliable Fisher’s exact

Organizational Behaviour, Planners, and DPS 29
probability testing. With the over 100,000 category restored, this relationship is more significant
and more strongly positive. This distinction may be of some importance.
Number of planning applications. Another measure of municipal structure is the number
of planning applications processed in a typical month. The survey asked about “all types of
applications” to reduce the need for respondents in larger municipalities to segment out
application types, if only one figure was available. Further, all planning applications are
normally reviewed by a Registered Professional Planner (RPP) prior to their approval. Table 10
summarizes the relationship testing undertaken on this variable.
Table 10. Hypothesis Testing Results for Number of Planning Applications
N=131 >5 5-9 10-15 16-29 ≥30 Total Observations
Yes 7 9 7 6 5 34
No 34 30 18 9 6 97
Total Observations 41 39 25 15 11 131
Chi-square (χ2), at 4 degrees of freedom 5.620
p value 0.229
Cramér’s V 0.207
The testing cannot support the rejection of the null hypothesis (the relationship being
purely coincidental). The association between the average number of planning applications
processed per month and the respondent’s own consideration of DPS does not appear to be of any
statistical significance. Any relationship that does exist is only somewhat strong (magnitude of
relationship equalling 20.7%) according to Cramér’s V. An observable pattern in the data above
suggests that busier municipalities are more likely to have considered DPS as a solution.
However, the analysis suggests that this variable is not a satisfactory indicator.
Number of Registered Professional Planners. The third, and final, municipal structural
variable measured is the number of RPPs employed by the municipality. This is the third and
final municipality-oriented variable to be tested by this study. Table 11 summarizes the
relationship testing undertaken on this variable.

Organizational Behaviour, Planners, and DPS 30
Table 11. Hypothesis Testing Results for Number of Registered Professional Planners
N=131 0 1 2-4 5-10 ≥11 Total
Observations
Yes 5 15 5 4 5 34
No 35 27 26 7 2 97
Total Observations 40 42 31 11 7 131
Chi-square (χ2), at 4 degrees of freedom 15.559
p value 0.004
Cramér’s V 0.345
The testing confirms that the null hypothesis (the relationship being purely coincidental)
can be rejected with over 99.5% confidence. The association between the number of professional
planners in a municipality and the respondent’s own consideration of DPS is statistically
significant. The relationship is moderately strong (magnitude of relationship equalling 34.5%)
according to Cramér’s V. These findings are not surprising. Departments with a larger staff
complement are more likely to be specialized and searching multiple avenues for policy solutions
(Bratton & Chiaramonte, 2007, p. 474).
4.3 The natural conservatism of land use planners
The first organizational behavioural hypothesis to be tested is an evaluation of the
conservatism of planners. Respondents slightly disagreed both with Council not being interested
in DPS, and also with the notion that other professionals would push back against DPS. Table 12
summarizes the relationship testing undertaken on this variable.
Table 12. Hypothesis Testing Results for the Naturally Conservative Hypothesis
Disagree Neutral Agree Total Observed
Yes to DPS 13 13 4 30
No to DPS 21 56 11 88
Total Observed 34 69 15 118
Chi-square (χ2), at 2 degrees of freedom 4.530
p value 0.104
Cramér’s V 0.196

Organizational Behaviour, Planners, and DPS 31
The testing cannot support the rejection of the null hypothesis (relationship is
coincidental). The association between the evaluated conservatism of planners and their own
consideration of DPS does not appear to be of any statistical significance. Any hesitance in the
consideration of DPS must stem from other underlying causes. Any relationship that does exist is
only somewhat strong (magnitude of relationship equalling 19.6%) according to Cramér’s V.
4.4 Council desire to maintain power
The second hypothesis tested is the Council maintenance of power. Respondents
generally agreed with statements that members of Council want to be involved in planning
matters, but did not agree with the notion that they are micromanagers. Table 13 summarizes the
relationship testing undertaken on this variable.
Table 13. Hypothesis Testing Results for the Council Control Hypothesis
Disagree Neutral Agree Total
Observed
Yes to DPS 5 8 20 33
No to DPS 18 22 52 92
Total Observed 23 30 72 125
Chi-square (χ2), at 2 degrees of freedom 0.330
P value 0.848
Cramér’s V 0.051
The testing cannot support the rejection of the null hypothesis (relationship is
coincidental). It was thought that planners might self-censor their thoughts on policy if it was
perceived that Council would not consider alternatives in the first place. Developers came in on
the Council side of this equation, supporting the maintenance of checks and balances in planning
decisions. “It’s really bad in rural townships where staff holds a lot of power,” said one
interviewee (Developer Interview #2, 2011). “They don’t care about voters, and...people are
scared of the bureaucracy.” The data suggests quite the opposite. The association between the
evaluated perception of Council control and their own consideration of DPS does not appear to be
of any statistical significance.

Organizational Behaviour, Planners, and DPS 32
4.5 Presence of a catalyst event
Any particular event. The first half of this hypothesis is consideration of a general,
unspecified catalytic event initiating a conversation about DPS. Table 14 summarizes the
relationship testing undertaken on this variable.
Table 14. Hypothesis Testing Results for the Catalyst Event (General) Hypothesis
Disagree Neutral Agree Total Observed
Yes to DPS 11 8 10 29
No to DPS 43 21 20 84
Total Observed 54 29 30 113
Chi-square (χ2), at 2 degrees of freedom 1.770
p value 0.413
Cramér’s V 0.125
The testing cannot support the rejection of the null hypothesis (relationship is
coincidental). The association between catalyst-type events and the respondent’s own
consideration of DPS does not appear to be of any statistical significance. Staff in Lake of Bays
(Szczerbak, 2010) and Carleton Place (Young, 2011) both reported their consideration of DPS
were the result of particular local challenges: environmental issues in Lake of Bays, and a
controversial development in Carleton Place. Most respondents disagreed with the premise of
the survey that planners and planning projects are receiving negative attention from elected
officials and the media. This survey result was surprising.
The 2010 municipal election. This study also considered if the 2010 municipal election
caused any effect in the consideration of DPS. In a limited search of campaign literature, only
one mention of DPS could be found.8
8 Christine Leadman, an incumbent Councillor in Ottawa who ultimately lost her seat in the 2010 election.

Organizational Behaviour, Planners, and DPS 33
Table 15 summarizes the relationship testing undertaken on this variable.

Organizational Behaviour, Planners, and DPS 34
Table 15. Hypothesis Testing Results for the 2011 General Election Sub-hypothesis
Disagree Neutral or Agree Total Observed
Yes to DPS 24 8 32
No to DPS 69 13 82
Total Observed 93 21 114
Chi-square (χ2), at 1 degree of freedom 0.740
p value 0.390
Cramér’s V 0.106
The testing cannot support the rejection of the null hypothesis (relationship is
coincidental). The association between the reports regarding political events and the respondent’s
own consideration of DPS does not appear to be of any statistical significance. This is not
surprising, given that so few respondents identified political figures discussing DPS.
4.6 Criticism from activist planning theory
With DPS able to be structured to delegate decisions entirely to the staff level, it was
anticipated to see some statistically significant concerns from planners in this regard.
Developers, too, recognize that the need for public input is a strong concern. “The public wants
input all the time. DPS doesn’t change that,” (Developer Interview #1, 2011). Due to the phrases
chosen, these phrases were evaluated separately. Table 16 evaluates the first activist planning
phrase.
Table 16. Hypothesis Testing Results, “Controversial Applications Appealed to the OMB”
Disagree Neutral Agree Total Observed
Yes to DPS 12 11 9 32
No to DPS 60 18 13 91
Total Observed 72 29 22 123
Chi-square (χ2), at 2 degrees of freedom 7.94
p value 0.019
Cramér’s V 0.254
The testing confirms that the null hypothesis (relationship is coincidental) can be rejected
at a 98% confidence level. The association between the respondent’s assessment of controversial

Organizational Behaviour, Planners, and DPS 35
application appeals to the OMB and their own consideration of DPS is statistically significant.
The distribution is notable for its tilt toward the large number of respondents who did not report a
large number of OMB appeals and also did not consider DPS. This is the first behavioural
indicator to suggest a problem where DPS has been considered as a solution. The relationship is
moderately strong (magnitude of relationship equalling 25.4%) according to Cramér’s V. Table
17 summarizes the results of relationship testing for the second phrase.
Table 17. Hypothesis Testing Results, “Removal of Appeal Rights”
Disagree Neutral Agree Total Observed
Yes to DPS 10 13 10 33
No to DPS 18 42 32 92
Total Observed 28 55 42 125
Chi-square (χ2), at 2 degrees of freedom 1.61
p value 0.447
Cramér’s V 0.113
The testing cannot support the rejection of the null hypothesis (relationship is
coincidental). The association between the respondent’s level of concern over the removal of
appeal rights on certain planning applications and their own consideration of DPS does not appear
to be of any statistical significance. The data does appear to suggest that concerns over appeal
rights are greater amongst planners who had not considered DPS. These concerns may be address
ed in other behaviours, such as the lack of institutional knowledge about DPS. Table 18
summarizes the results of relationship testing for the third phrase.
Table 18. Hypothesis Testing Results, “We Engage in More than Minimal Consultation”
Disagree Neutral Agree Total Observed
Yes to DPS 3 5 24 32
No to DPS 20 21 51 92
Total Observed 23 26 75 124
Chi-square (χ2), at 2 degrees of freedom 4.05
p value 0.132
Cramér’s V 0.181
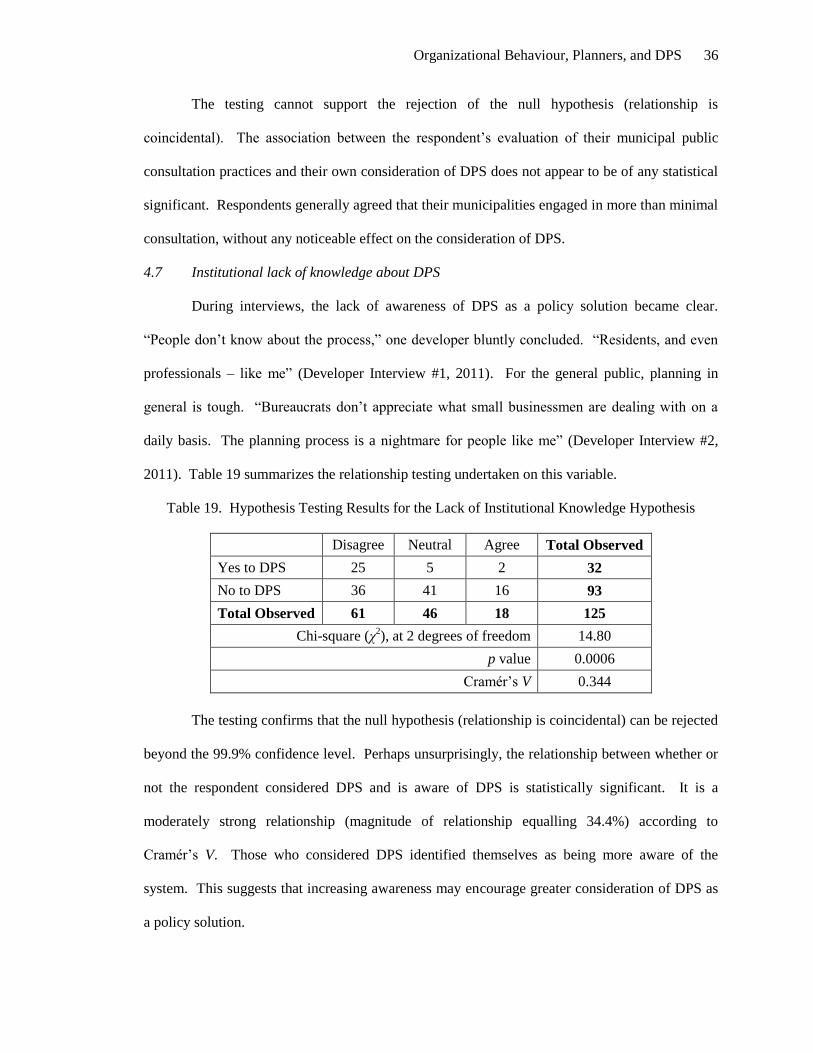
Organizational Behaviour, Planners, and DPS 36
The testing cannot support the rejection of the null hypothesis (relationship is
coincidental). The association between the respondent’s evaluation of their municipal public
consultation practices and their own consideration of DPS does not appear to be of any statistical
significant. Respondents generally agreed that their municipalities engaged in more than minimal
consultation, without any noticeable effect on the consideration of DPS.
4.7 Institutional lack of knowledge about DPS
During interviews, the lack of awareness of DPS as a policy solution became clear.
“People don’t know about the process,” one developer bluntly concluded. “Residents, and even
professionals – like me” (Developer Interview #1, 2011). For the general public, planning in
general is tough. “Bureaucrats don’t appreciate what small businessmen are dealing with on a
daily basis. The planning process is a nightmare for people like me” (Developer Interview #2,
2011). Table 19 summarizes the relationship testing undertaken on this variable.
Table 19. Hypothesis Testing Results for the Lack of Institutional Knowledge Hypothesis
Disagree Neutral Agree Total Observed
Yes to DPS 25 5 2 32
No to DPS 36 41 16 93
Total Observed 61 46 18 125
Chi-square (χ2), at 2 degrees of freedom 14.80
p value 0.0006
Cramér’s V 0.344
The testing confirms that the null hypothesis (relationship is coincidental) can be rejected
beyond the 99.9% confidence level. Perhaps unsurprisingly, the relationship between whether or
not the respondent considered DPS and is aware of DPS is statistically significant. It is a
moderately strong relationship (magnitude of relationship equalling 34.4%) according to
Cramér’s V. Those who considered DPS identified themselves as being more aware of the
system. This suggests that increasing awareness may encourage greater consideration of DPS as
a policy solution.

Organizational Behaviour, Planners, and DPS 37
4.8 Satisfaction with current approvals framework
The sixth behavioural hypothesis tested is the assumption that respondents are satisfied
with their current approvals framework. Many planners, including survey respondents, have
wondered how well DPS performs as an approval framework versus traditional zoning. While
more detail on the performance of DPS in Carleton Place is found in Chapter 5.0, Table 20
summarizes the relationship testing undertaken on this variable.
Table 20. Hypothesis Testing Results for the Satisfied with Current Framework Hypothesis
Disagree Neutral Agree Total Observed
Yes to DPS 9 9 14 32
No to DPS 26 24 40 90
Total Observed 35 33 54 122
Chi-square (χ2), at 2 degrees of freedom 0.03
p value 0.985
Cramér’s V 0.016
The testing reveals that there is almost no statistical association between the respondent’s
level of satisfaction with the current zoning framework and whether or not DPS was considered.
The observed outcomes almost perfectly mirror the expected outcomes, based on absolute
consideration of DPS.
4.9 Time or cost concerns
The last behavioural hypothesis tested is time or cost concerns.

Organizational Behaviour, Planners, and DPS 38
Table 21 summarizes the relationship testing undertaken on this variable. Note that the direction
of responses for the third phrase in this hypothesis (“Budgeting for DPS would be no more
difficult than budgeting for a Zoning By-law project”) was reversed to facilitate hypothesis
testing.
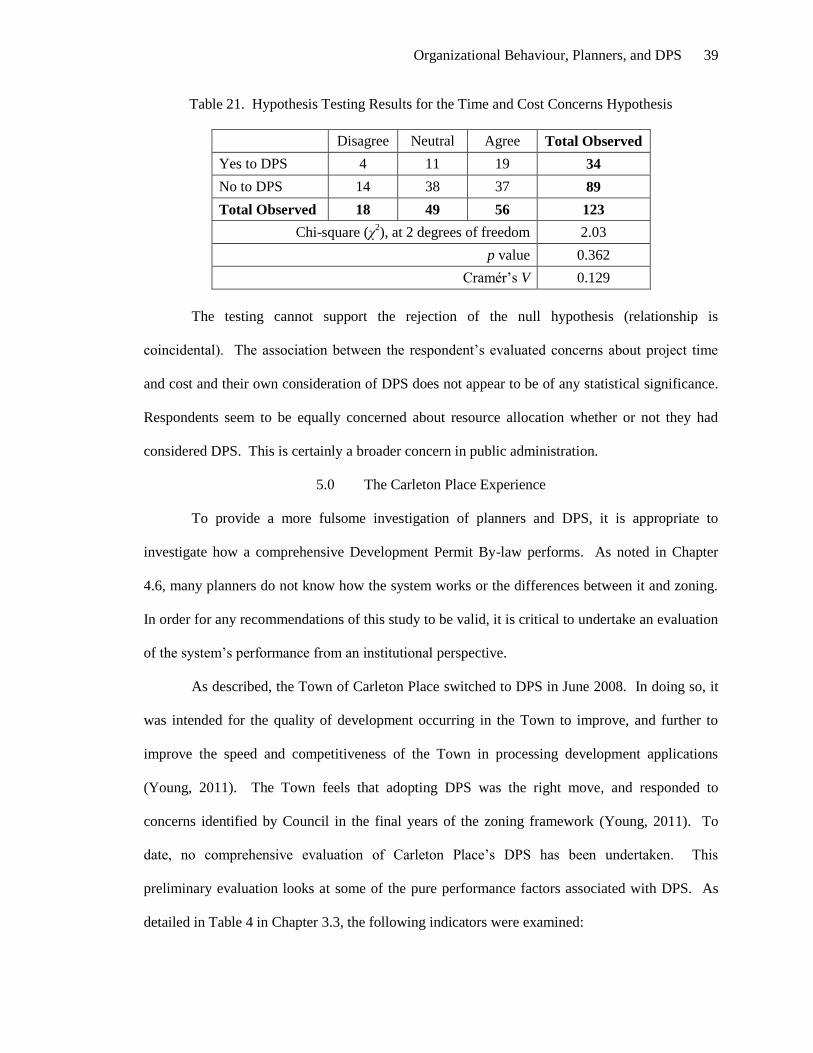
Organizational Behaviour, Planners, and DPS 39
Table 21. Hypothesis Testing Results for the Time and Cost Concerns Hypothesis
Disagree Neutral Agree Total Observed
Yes to DPS 4 11 19 34
No to DPS 14 38 37 89
Total Observed 18 49 56 123
Chi-square (χ2), at 2 degrees of freedom 2.03
p value 0.362
Cramér’s V 0.129
The testing cannot support the rejection of the null hypothesis (relationship is
coincidental). The association between the respondent’s evaluated concerns about project time
and cost and their own consideration of DPS does not appear to be of any statistical significance.
Respondents seem to be equally concerned about resource allocation whether or not they had
considered DPS. This is certainly a broader concern in public administration.
5.0 The Carleton Place Experience
To provide a more fulsome investigation of planners and DPS, it is appropriate to
investigate how a comprehensive Development Permit By-law performs. As noted in Chapter
4.6, many planners do not know how the system works or the differences between it and zoning.
In order for any recommendations of this study to be valid, it is critical to undertake an evaluation
of the system’s performance from an institutional perspective.
As described, the Town of Carleton Place switched to DPS in June 2008. In doing so, it
was intended for the quality of development occurring in the Town to improve, and further to
improve the speed and competitiveness of the Town in processing development applications
(Young, 2011). The Town feels that adopting DPS was the right move, and responded to
concerns identified by Council in the final years of the zoning framework (Young, 2011). To
date, no comprehensive evaluation of Carleton Place’s DPS has been undertaken. This
preliminary evaluation looks at some of the pure performance factors associated with DPS. As
detailed in Table 4 in Chapter 3.3, the following indicators were examined:

Organizational Behaviour, Planners, and DPS 40
Number of applications approved;
Length of time of application review;
Number of applications needing Council approval;
Number of “community amenities” obtained, being developments judged to have
exceeded minimum expectations for desirable characteristics; and,
Number of appeals of applications to the Ontario Municipal Board (OMB).
5.1 Number of applications approved
Table 22. Comparison of Number of Applications Approved
Indicator and
Value Unit of Measurement
Observation under
Zoning
Observation under
DPS
Number of
applications
received
Number of applications
received within review
timeframe (classified by Type
I, II or III per By-law)
Site Plan: 36
MV: 24
ZBA: 16
Total: 76
Type I: 27
Type II: 19
Type III: 7
Total: 53
There is no clear translation between the zoning-based applications and Development
Permit applications. Type I applications are generally new in Carleton Place, but also include
“simpler” Minor Variance-type applications with minimal issues (Young, 2011). Type II
applications captured more complex Minor Variance-type applications, perhaps requiring agency
review or a larger building, as well as easier Site Plan applications and more routine Zoning By-
law Amendments (Young, 2011). Type III applications include complicated Site Plans and larger
building-specific Zoning By-law Amendments – although, with impacts that have been
contemplated and accepted by Council (Young, 2011).
The baseline comparison for this study is the number of applications received. Since
switching to DPS, the Town is actually processing fewer planning applications than under zoning.
This is surprising, given that under DPS more forms of development in Carleton Place require a
planning approval. Two factors may explain this: older zoning by-laws tend to be amended more
often than new by-laws, and the Town was completing its approvals of a comprehensive

Organizational Behaviour, Planners, and DPS 41
commercial development at the beginning of the sampling period (2006). Likewise, permissions
and applicability are often updated when new by-laws are adopted, to reflect policy and political
changes. No comparison between the land use designations and standards applying both pre- and
post-DPS was undertaken as a part of this review, due to the extent of work required.
Given the context for development in Carleton Place, it is not possible to make any
definitive conclusion about DPS and its effect on the number or type of applications received. It
must also be noted that the Zoning By-law Amendments reviewed above include changes in land
use and site-specific building standards. The change in land use would not qualify for a
Development Permit application under this regime.
5.2 Application review time
Table 23. Comparison of Application Review Time
Indicator and
Value Unit of Measurement
Observation under
Zoning
Observation under
DPS
Length of time
of review
Average number of days
per application spent in
review
Site Plan: 164*
MV: 35
ZBA: 67
Overall average: 107
Type I: 19
Type II: 77
Type III: 108
Overall average: 50
The Province has promoted DPS as adept in reducing development approval times
(MMAH, 2008). While the same logic described above regarding parallel applications between
the two systems applies, a general average shows that the Carleton Place is issuing the typical
development approval in less than half the time.
A major component of the decrease for Type I applications is the lack of a public notice
period (Young, 2011). Minor Variances and Zoning By-law Amendments each require a three-
week period where an application is circulated for public comment. By removing twenty-one
days from the count, it is observed that a Type I application is generally taking five days longer to
review than a Minor Variance (35 days, less a 21 day notice period, equals 14 days for pre-DPS
review). However, the difference for Type II and III applications is very significant. Using Site
Plan Approvals as the standard, applications are being processed months sooner under DPS: three

Organizational Behaviour, Planners, and DPS 42
months for a Type II application, and two months for a Type III application. The process itself
posed no real challenge for the experienced developers. “There were matters left to
interpretation, there was some picking and choosing as to what rules applied. It was pretty
standard” (Developer Interview #1, 2011).
Carleton Place considers their Site Plan approvals and Type III DPS applications
complete on the date the Site Plan Agreement is executed. Files can idle for weeks while the
applicant finalizes components of the agreement, extending the length of the approval. Refining
the evaluation to use an earlier, more accurate date – when the agreement is sent to the applicant,
or all planning concerns are satisfied – would reduce the approval times in both systems. It must
again be noted that the Zoning By-law Amendments reviewed above include changes in land use
and site-specific building standards, and would not qualify for a Development Permit application.
This evaluation also did not investigate the use of Staff time, which was not tracked in
Carleton Place on a per application basis. Any attempt to quantify a Staff time savings would
require time estimates of the review of applications three years ago, unless review times from a
comparable municipality are used. Both developer interviews raised issues about the availability
of Staff in Carleton Place for meetings, suggesting that hiring additional planning staff could
decrease these times further (Developer Interview #1, 2011).
5.3 Applications proceeding to Council
Table 24. Comparison of Number of Applications Proceeding to Council
Indicator and
Value Unit of Measurement
Observation under
Zoning
Observation under
DPS
Number of
applications
needing Council
approval
Number of DPS
applications proceeding to
Council/Committee of
Adjustment for a decision
MV: 24
ZBA: 16
Total: 40
Type I: 0
Type II: 0
Type III: 7
Total: 7
The main distinction between zoning and DPS is that decisions on Development Permit
applications can be delegated to the Staff level (MMAH, 2008). All Type III applications in
Carleton Place are approved by Council (Town of Carleton Place, 2008, § 2.17.1). Type II

Organizational Behaviour, Planners, and DPS 43
applications do not, but can be bumped up to a Council approval if requested by a member of the
public, or the Director of Planning (Town of Carleton Place, 2008, § 2.17.4).
From 2006 to June 2008 under the zoning framework, 40 planning applications were
reviewed by Council or the Committee of Adjustment. Since moving to DPS, only 7 applications
made it to Council review, with no Type II applications bumped up to the Council level. This
decrease is proportionally greater than that observed in the overall number of applications.
Clearly, DPS can be designed to lighten the workload of Council and planning-oriented
committees. Councillors continue to be circulated for comment on planning applications in
Carleton Place, which would reduce any total reduction of the workload.
There remains confusion as to how the public process works. The Town’s planner noted
that the public took issue when the first controversial development came forward under DPS, a
commercial development within the existing urban area. The traditional “public meeting” is
replaced by a “public information session” where comment on the proposal could be given, but
with the news that use as proposed was permitted. A public used to seeing projects not having as-
of-right permission were not impressed to be told the proposal already had approval (Young,
2011). The developer behind this project was also frustrated by this turn. “It became a public site
planning process,” he believed. “I’m hired to navigate the process, and identify road blocks to
approval. We worked with Staff to create our final proposal, but at the Public Meeting people
reacted negatively and Council directed Staff to go back and revise the plan. Yes, it was a good
development in the end, but the process did not serve us well” (Developer Interview #1, 2011).
While Council’s workload does decrease, there is definitely a learning curve associated with
administering the DPS process.

Organizational Behaviour, Planners, and DPS 44
5.4 Community amenities obtained
Table 25. Comparison of Number of Community Amenities Obtained
Indicator and Value Unit of Measurement Observation under
Zoning
Observation under
DPS
Number of
“Community
Amenities” obtained
Number of community
amenities obtained
through planning
approvals
7 applications (7/76 =
9.2% of applications)
with amenities):
o 4 landscaping
o 3 urban design
6 applications (6/53 =
11.3% of applications)
with amenities):
o 7 landscaping
o 3 urban design
DPS has been promoted by the Province as a mechanism for more strictly regulating the
final form of development, ensuring that urban design amenities are obtained (MMAH, 2008).
Carleton Place has adopted this similar position (Town of Carleton Place, 2008, § 1.2). To
evaluate this position, the development applications were reviewed to estimate the number of
“plus amenities” obtained through a planning approval. Amenities sought include landscaping,
urban design, and environmental lands protected. Admittedly, this component of the evaluation is
highly subjective. One person’s good practice is another person’s benchmark, or perhaps
insufficient. To identify a “plus amenity,” this evaluation only counted projects that reflected
good planning practice – for example, street-oriented buildings, landscaped buffers where none
currently existed, vegetation preservation – that noticeably caught the attention of the evaluator.
Of the 76 planning applications approved under the zoning framework, 7 included a plus
amenity, representing 9.2% of all applications. There were four landscaping improvements and
three urban design elements in those applications. Of the 53 planning applications approved
under DPS, 6 included a plus amenity, representing 11.3% of all applications. There were seven
landscaping improvements and three urban design elements in those applications.
The evaluation suggests that DPS, in fact, produces better development. “There is a
trade-off for its benefits,” according to one developer interviewed. “Much more will be expected
from the development industry in a system like DPS” (Developer Interview #1, 2011). Of course,
the same could be said for any updated policy, as updates provide an opportunity to change

Organizational Behaviour, Planners, and DPS 45
development standards. Carleton Place used this opportunity to increase landscaping and design
requirements, for example (Young, 2011). In the Town’s opinion, the benchmark for
development has been raised. There is likely more at play with this indicator than the mere
switch to DPS – the type of applications received, the location and use associated with those
applications, Staff persistence, market factors, the general availability of land, and so forth. Staff
skill and assistance is an important factor in Carleton Place. One developer observed, “If it
wasn’t for Lisa (Young, the Director of Planning in Carleton Place), I’d have abandoned my
project” (Developer Interview #2, 2011). While a concrete statement cannot be made, it is fair to
say that the Town is achieving more amenities through private development as a result of DPS.
5.5 Appeals to the Ontario Municipal Board
Table 26. Comparison of the Number of Ontario Municipal Board Appeals
Indicator and Value Unit of Measurement Observation under
Zoning
Observation under
DPS
Number of appeals to
the OMB Number of
applications appealed
to the OMB
2 (combined rezoning
and Site Plan, by a
third party)
No appeals on
applications
DPS removes the right of appeal from third parties on Development Permit applications.
This would likely reduce the number of development applications being appealed to the OMB.
Sure enough, Carleton Place has not witnessed an appeal to the OMB since the adoption of the
Development Permit By-law. From 2006 to 2008, two appeals were received, which were
combined into a single hearing. A downtown merchants association appealed the development of
a commercial plaza in the Town’s commercial centre, adjacent to the Highway 7 by-pass. “[DPS]
is a plus to developers,” noted one interviewee, “Since here or anywhere controversial, we likely
would have had an appeal. [Developers] are often asked by staff to file applications in order to
get the building they want. Even if it is staff-supported, there is no guarantee it will be an easy
process. Those applications can be appealed, and opposing parties will look for any route to stop
development” (Developer Interview #1, 2011). In a municipality where facilitating growth is a

Organizational Behaviour, Planners, and DPS 46
priority, the move to DPS provides a significant vote of confidence in favour of development to
builders.
6.0 Conclusions
Some general conclusions about the lack of DPS uptake can be drawn from the survey
results. In total, three hypotheses emerge as statistically significant and least moderately strongly
correlated to the respondent's consideration of DPS. Two additional hypotheses also show
interesting characteristics. Table 27 summarizes the results of all hypothesis testing.
Table 27. Summary Table of Hypothesis Testing Results
Hypothesis Tested χ2 Significance? (p) V
Dem
ogra
phic
or
Munic
ipal
Str
uct
ura
l F
acto
rs
Gender Yes (0.020) 0.203
Age No (0.172) 0.222
Respondent level of education No (0.397) 0.150
Respondent length of tenure in current position No (0.872) 0.097
Respondent last year in formal education No (0.727) 0.125
Size of municipality Yes (0.020) 0.244
Number of planning applications No (0.229) 0.207
Number of Registered Professional Planners Yes (0.004) 0.345
Org
aniz
atio
nal
Beh
avio
urs
Natural conservatism of land use planners No (0.104) 0.196
Council desire to maintain power No (0.848) 0.051
Presence of a catalyst event (General) No (0.413) 0.125
Presence of a catalyst event (2011 municipal election) No (0.390) 0.106
Criticism from activist
planning theory
OMB appeals Yes (0.019) 0.254
Removal of appeal rights No (0.447) 0.113
Consultation No (0.132) 0.181
Institutional lack of knowledge about DPS Yes (0.0006) 0.344
Satisfaction with current approvals framework No (0.985) 0.016
Time or cost concerns No (0.362) 0.129
With respect to the size of municipality and the number of Registered Professional
Planners employed, it appears larger municipalities tend to consider DPS more often than smaller
municipalities. Given the Province’s promotion of DPS as a specialist tool (MMAH, 2008), this
trend may have been anticipated. It is interesting to note that one existing DPS is in a rural area

Organizational Behaviour, Planners, and DPS 47
and two are in smaller urban areas. Each of these municipalities has only a small planning
function. Only one large urban municipality has adopted DPS. Recent history in Ontario does
not follow this trend. One developer suggested that until a larger municipality made the switch,
there would be no incentive for the private sector to learn about that framework (Developer
Interview #1, 2011). Further research into why municipalities who considered DPS but did not
ultimately adopt it would provide more insight into how DPS can become a more attractive tool.
From an organizational behaviour perspective, the only hypothesis to show any strong
relationship was the lack of knowledge about the system. Aside from the strong data relationship,
this theme emerged strongly throughout the interviews and also noted by survey respondents in
their additional comments. It appears that the promotion of DPS has largely been abdicated to
individual, interested planners. Survey commenters expressed an interest in seeing system
performance statistics, as well as legal decisions providing evidentiary support for DPS. Multiple
respondents requested education or training specific to DPS, alongside a general interest in
learning more about the subject.
The only indicator of statistical significance from activist planning theory was the high
number of respondents who did not consider DPS and also did not agree that controversial
development applications in their municipality often going before the OMB. Respondents who
have considered DPS also tended to note a higher number of controversial development projects
in their municipality. It appears that challenging projects may be a factor in creating
consideration of DPS – or, perhaps a validation that respondents are satisfied with how current
frameworks solve these problems. There is comfort with the traditional zoning framework in
both the public and the development industry. “If I had to do it again,” according to one
interviewee, “I would choose the Site Plan approval process. It is more linear and better
understood. Maybe if a Toronto or an Ottawa took up this process, people in the development
sector would be forced to learn” (Developer Interview #1, 2011).

Organizational Behaviour, Planners, and DPS 48
A statistically significant relationship was found to exist between gender and
consideration of DPS. Male planners were much more likely to have considered DPS than female
planners. There could be institutional reasons behind this. However, it may be more
representative of who municipalities employ as directors of planning. Only nine invitees (15%)
from the 60 largest municipalities in Ontario were female, with larger municipalities reporting to
be more likely to consider DPS. With a high concentration of female respondents being in
smaller municipalities that are less likely to consider DPS, is inherently more likely that this
results is tied to population-related issues and not DPS itself.
Meanwhile, Carleton place appears to be achieving positive results from their switch to
DPS. While no definitive statement can be made about the number of applications between the
two systems, it can be said that review times are considerably shorter, that the number of
applications requiring Council approval is both absolutely and proportionally lower, and that the
number of appeals to the OMB are lower than in the previous zoning-based framework. It is also
likely that the amenities obtained through private development are more and of higher quality
under DPS. The policy appears to of made a difference, although must be knowledge that
implementation is entirely a credit to Town Staff. “Lisa is smart, and good at her job,” observed
one interviewee. “To really implement this system, she needs support to do her work. Maybe it’s
money or perhaps hiring more people to deal with applicants” (Developer Interview #1, 2011).
Potential appears to exist for even greater results in the eyes of stakeholders in Carleton Place.
This study has demonstrated that municipalities should expect benefits by switching to
DPS from a zoning-based planning approvals framework. It appears a lack of knowledge and
awareness among land use planners of DPS, the lack of a widespread number of challenging
development proposals and contexts, and the high number of municipalities with a small
population and small planning department limits its spread. This study does not profess to make
any such determination as to suitable contexts for applying DPS. However, these areas may be
where the Province – or an enterprising consultant – can promote DPS and increase uptake.
Organizational Behaviour, Planners, and DPS 49
References
Almond, J. (2009). Development Permit System: 2009 Central Ontario Municipal Symposium,
Strategies for the Future. Retrieved November 7, 2010, from
http://www.mah.gov.on.ca/AssetFactory.aspx?did=6714
Anderson, D., & Ackerman Anderson, L. S. (2001). Beyond Change Management: Advanced
Strategies for Today's Transformational Leaders. San Francisco: Jossey-Bass/Pfeiffer.
Bedford, P. (2005a). Brownfields is [sic] Hamilton's "Ace in the Hole". Ontario Planning
Journal, 20(5).
Bedford, P. (2005b). Reconsidering the Ward System of Governance. Ontario Planning Journal,
20(6).
Bedford, P. (2010). CSI Miami - Creative, Simple and Innovative. Ontario Planning Journal,
25(2).
Bell, S. (2009). Municipal Urban Designers' Roundtable. Ontario Planning Journal, 24(4).
Bocking, S. (2006, November). Constructing Urban Expertise. Journal of Urban History, 33(1),
51-76.
Bratton, J., & Chiaramonte, P. (2007). Organizational Structure and Design. In J. Helms Mills, A.
J. Mills, J. Bratton, & C. Forshaw, Organizational Behaviour in a Global Context (pp.
455-481). Peterborough, ON: Broadview Press.
Bratton, J., & Grant, J. D. (2007). Learning in Organizations. In J. Helms Mills, A. J. Mills, J.
Bratton, & C. Forshaw, Organizational Behaviour in a Global Context (pp. 167-204).
Peterborough, ON: Broadview Press.
City of Brampton. (2011). Development Permit System. Retrieved July 3, 2011, from Main Street
North Revitalization: http://www.brampton.ca/en/Business/planning-
development/projects-studies/Pages/main-street-north.aspx
Crawford, K. G. (1940). The Independence of Municipal Councils in Ontario. Canadian Journal
of Economics and Political Science, 6(4), 543-554.
Curtis, C. A. (1942). Municipal Government in Ontario. Canadian Journal of Economics and
Political Science, 8(3), 416-426.
Developer Interview #1. (2011, May 26). Experience with the Carleton Place DPS. (J. Nethery,
Interviewer)
Developer Interview #2. (2011, June 6). Experience with the Carleton Place DPS. (J. Nethery,
Interviewer)
Espinoza, C., Ukleja, M., & Rusch, C. (2010). Managing the Millennials: Discover the Core
Competencies for Managing Today's Workforce. Hoboken, NJ: John Wiley & Sons, Inc.
Gildenhuys, J. (2004). Public Value Systems. In J. Gildenhuys, The Philosophy of Public
Administration: An Introduction for Undergraduate Students (pp. 94-102). Stellenbosch,
South Africa: Sun Press.
Goss, S. (2001). Why is Change So Hard? In S. Goss, Making Local Governance Work (pp. 138-
158). New York: Palgrave.
Hastings, S. (2004). Where are Development Permits when you Need Them? Ontario Planning
Journal, 19(6).

Organizational Behaviour, Planners, and DPS 50
Horak, M. (2008). Governance Reform from Below: Multilevel Politics and the 'New Deal'
Campaign in Toronto, Canada. Nairobi, Kenya: United Nations Human Settlements
Programme.
Kernaghan, K., Marson, B., & Borins, S. (2005). Empowering and Being Empowered. In K.
Kernaghan, B. Marson, & S. Borins, The New Public Administration (pp. 157-178).
Toronto: Institute of Public Administration of Canada.
Lancaster, L. C., & Stillman, D. (2002). When Generations Collide. New York: HarperCollins
Publishers, Inc.
Lehman, R. (2004). Time for Real Planning in Ontario? Ontario Planning Journal, 19(6).
Lindblom, C. (2001). The Science of Muddling Through. In J. S. Ott, & E. W. Russell,
Introduction to Public Administration: A Book of Readings (pp. 71-82). Toronto:
Addison-Wesley Longman Inc.
MacDermid, R., & Albo, G. (2001). Divided Province, Growing Protests: Ontario Moves Right.
In K. Brownsey, & M. Howlett, The Provincial State in Canada: Politics in the
Provinces and Territories (pp. 163-202). Peterborough, ON: Broadview Press.
MacDonald, D. C. (1994). Ontario's Political Culture: Conservatism with a Progressive
Component. Ontario History, 86(4), 297-315.
McAllister, M. L. (2004). Governing ourselves?: The politics of Canadian communities.
Vancouver: UBC Press.
Meier, K. J., Brudney, J. L., & Bohte, J. (2009). Applied Statistics for Public & Nonprofit
Administration (7 ed.). Belmont, CA: Thomson Wadsworth.
Mills, A. J., & Helms Mills, J. (2007). Organizational Culture. In A. J. Mills, J. Helms Mills, J.
Bratton, & C. Forshaw, Organizational Behaviour in a Global Context (pp. 423-453).
Peterborough, ON: Broadview Press.
Mills, A. J., & Helms Mills, J. (2007). Sex at Work. In A. J. Mills, J. Helms Mills, J. Bratton, &
C. Forshaw, Organizational Behaviour in a Global Context (pp. 321-357). Peterborough,
ON: Broadview Press.
Ministry of Municipal Affairs and Housing (Ontario). (2008). Development Permit System: A
Handbook for Municipal Implementation. Toronto: Queen's Printer for Ontario.
Ministry of Municipal Affairs and Housing. (2011, January 6). List of Ontario Municipalities.
Retrieved January 13, 2011, from Local Government:
http://www.mah.gov.on.ca/Page1591.aspx
Nethery, J. (2011). Ontario's Development Permit System: Hypothesizing its Absence. Ontario
Planning Journal, 26(2), 9-10.
Ontario Professional Planners Institute. (2004, September 24). Comments on Discussion Paper:
Places to Grow - Better Choices, Bright Future. Retrieved May 27, 2011, from
http://www.ontarioplanners.on.ca/%5Cpdf%5Cwatchingbriefs%5C0904_places_to_grow
_submission.pdf
Ontario Regulation 608/06: Development Permits, as amended. Retrieved October 26, 2010 from
http://www.e-laws.gov.on.ca/html/regs/english/elaws_regs_060608_e.htm#Top.
O'Sullivan, E., Rassel, G. R., & Berner, M. (2008). Research Methods for Public Administrators
(5th ed.). New York: Pearson Longman.
Pal, L. A. (2010). Beyond Policy Analysis: Public Issue Management in Turbulent Times (Vol. 4).
Toronto: Nelson Education.

Organizational Behaviour, Planners, and DPS 51
Planning Act, R.S.O. 1990, c.P.13, as amended. Retrieved October 16, 2010 from http://www.e-
laws.gov.on.ca/html/statutes/english/elaws_statutes_90p13_e.htm.
Pond, D. (2009, March). Institutions, political economy and land-use policy: greenbelt politics in
Ontario. Environmental Politics, 18(2), 238-256.
Pre-test Respondent #4. (2010). Observations on DPS. Author.
Sewell, J. (1995). Creating an Alternative to Modernism. In J. Sewell, The Shape of the City:
Toronto Struggles with Modern Planning (pp. 173-198). Toronto: University of Toronto
Press.
Siegel, D. (2004). Recent Changes in Provincial-Municipal Relations in Ontario. In R. Young, &
C. Leuprecht, Municipal-Federal-Provincial Relations in Canada (pp. 181-200).
Kingston, ON: McGill-Queen's University Press.
Siegel, D. (2009). Ontario. In A. Sancton, & R. Young, Foundations of Governance: Municipal
Government in Canada's Provinces (pp. 20-69). Toronto: University of Toronto Press.
Statistics Canada. (2007). Carleton Place, Ontario (Code3509028) (table). 2006 Community
Profiles. Retrieved November 2, 2010, from 2006 Community Profiles:
http://www12.statcan.gc.ca/census-recensement/2006/dp-pd/prof/92-
591/details/Page.cfm?Lang=E&Geo1=CSD&Code1=3509028&Geo2=PR&Code2=35&
Data=Count&SearchText=carleton%20place&SearchType=Begins&SearchPR=01&B1=
All&Custom=
Szczerbak, S. (2010, October 5). Development Permit System Statistics. (J. Nethery, Interviewer)
Tindal, R., & Tindal, S. N. (2009). Municipal Governing Structures. In R. Tindal, & S. N. Tindal,
Local Government in Canada (7 ed., pp. 245-282). Toronto: Nelson Education.
Town of Carleton Place. (2008). Development Permit By-law 2008-050. Carleton Place, ON:
Town of Carleton Place.
Town of Oakville. (2008). 2008 Capital Budget and 2009-2017 Forecast Summary. Retrieved
December 2, 2010, from
http://www.oakville.ca/Media_Files/General/2008ForecastPlanningServices.pdf
Township of Lake of Bays. (2006). Development Permit System (For Waterfront Areas). Dwight,
ON: Township of Lake of Bays.
Township of Lake of Bays. (2006). Development Permit System (For Waterfront Areas)
Handbook. Dwight, ON: Township of Lake of Bays.
Wickett, S. (1900, June 240-259). City Government in Canada. Political Science Quarterly,
15(2).
Young, L. (2011, May 2-4). Carleton Place's Experience with the Development Permit System.
(J. Nethery, Interviewer)

Organizational Behaviour, Planners, and DPS
Appendix ‘A’: Survey to Planning Professionals

Organizational Behaviour, Planners, and DPS
Appendix ‘B’: Carleton Place Evaluation Data

Organizational Behaviour, Planners, and DPS
Appendix ‘C’: Carleton Place Developer Interview Questions