organic liquid distribution neshap: industry profile · organic liquid distribution neshap:...
TRANSCRIPT

Organic Liquid DistributionNESHAP: Industry Profile
Draft Report
Prepared for
John L. SorrelsU.S. Environmental Protection Agency
Office of Air Quality Planning and StandardsInnovative Strategies and Economics Group (ISEG)
(MD-15)Research Triangle Park, NC 27711
Prepared byKatherine HellerVirginia A. PerryBrooks M. Depro
Research Triangle InstituteCenter for Economics Research
Research Triangle Park, NC 27709
EPA Contract Number 68-D-99-024RTI Project Number 7647-001-008
June 2000

EPA Contract Number RTI Project Number68-D-99-024 7647-001-008
Organic Liquid Distribution NESHAP: Industry Profile
Draft Report
June 2000
Prepared for
John L. SorrelsU.S. Environmental Protection Agency
Office of Air Quality Planning and StandardsInnovative Strategies and Economics Group (ISEG)
(MD-15)Research Triangle Park, NC 27711
Prepared by
Katherine HellerVirginia A. PerryBrooks M. Depro
Research Triangle InstituteCenter for Economics Research
Research Triangle Park, NC 27709

iii
CONTENTS
Section Page
1 Introduction to the Organic Liquids Distribution (OLD) Source Category . . . . 1-1
1.1 Brief Description of Source Category . . . . . . . . . . . . . . . . . . . . . . . . . . 1-1
1.2 Current Economic Conditions and Trends . . . . . . . . . . . . . . . . . . . . . . . 1-31.2.1 Chemical Production . . . . . . . . . . . . . . . . . . . . . . . . . . . . . . . . . 1-31.2.2 Petroleum Refineries . . . . . . . . . . . . . . . . . . . . . . . . . . . . . . . . . 1-31.2.3 Liquid and Petroleum Terminals . . . . . . . . . . . . . . . . . . . . . . . . 1-31.2.4 Crude Oil Pipeline Pumping and Breakout Stations . . . . . . . . . 1-4
1.3 Environmental Concerns . . . . . . . . . . . . . . . . . . . . . . . . . . . . . . . . . . . . 1-4
1.4 Organization of Report . . . . . . . . . . . . . . . . . . . . . . . . . . . . . . . . . . . . . 1-5
2 Distribution of Organic Chemical Liquids . . . . . . . . . . . . . . . . . . . . . . . . . . . . . 2-1
2.1 Chemical OLD Background . . . . . . . . . . . . . . . . . . . . . . . . . . . . . . . . . . 2-12.1.1 SIC and NAICS Codes and Description of Service Providers . . 2-22.1.2 Affected Markets . . . . . . . . . . . . . . . . . . . . . . . . . . . . . . . . . . . . 2-2
2.2 Production/Service Overview . . . . . . . . . . . . . . . . . . . . . . . . . . . . . . . . 2-22.2.1 Service Overview . . . . . . . . . . . . . . . . . . . . . . . . . . . . . . . . . . . . 2-22.2.2 Major By-Products and Co-Products, if Applicable . . . . . . . . . 2-32.2.3 Costs of Production . . . . . . . . . . . . . . . . . . . . . . . . . . . . . . . . . . 2-62.2.4 Supply Elasticities . . . . . . . . . . . . . . . . . . . . . . . . . . . . . . . . . . . 2-72.2.5 Emissions . . . . . . . . . . . . . . . . . . . . . . . . . . . . . . . . . . . . . . . . . . 2-7
2.3 Industry Organization . . . . . . . . . . . . . . . . . . . . . . . . . . . . . . . . . . . . . . . 2-72.3.1 Market Structure . . . . . . . . . . . . . . . . . . . . . . . . . . . . . . . . . . . . 2-8
2.3.1.1 Producers . . . . . . . . . . . . . . . . . . . . . . . . . . . . . . . . . . 2-82.3.1.2 Product Differentiation . . . . . . . . . . . . . . . . . . . . . . . . 2-82.3.1.3 Market Share . . . . . . . . . . . . . . . . . . . . . . . . . . . . . . . . 2-92.3.1.4 Market Structure . . . . . . . . . . . . . . . . . . . . . . . . . . . . 2-10
2.3.2 Facilities . . . . . . . . . . . . . . . . . . . . . . . . . . . . . . . . . . . . . . . . . . 2-11

iv
2.3.2.1 Location . . . . . . . . . . . . . . . . . . . . . . . . . . . . . . . . . . 2-132.3.2.2 Production Capacity and Utilization . . . . . . . . . . . . . 2-132.3.2.3 Employment . . . . . . . . . . . . . . . . . . . . . . . . . . . . . . . 2-13
2.3.3 Firm Characteristics . . . . . . . . . . . . . . . . . . . . . . . . . . . . . . . . . 2-132.3.3.1 Ownership . . . . . . . . . . . . . . . . . . . . . . . . . . . . . . . . . 2-132.3.3.2 Size Distribution . . . . . . . . . . . . . . . . . . . . . . . . . . . . 2-162.3.3.3 Vertical and Horizontal Integration . . . . . . . . . . . . . 2-182.3.3.4 Financial Condition . . . . . . . . . . . . . . . . . . . . . . . . . . 2-19
2.4 Uses and Consumers . . . . . . . . . . . . . . . . . . . . . . . . . . . . . . . . . . . . . . 2-232.4.1 Major Consumers . . . . . . . . . . . . . . . . . . . . . . . . . . . . . . . . . . . 2-232.4.2 Purpose of Consumption . . . . . . . . . . . . . . . . . . . . . . . . . . . . . 2-242.4.3 Characterization of Demand—Derived Demand Elasticity . . . 2-24
2.5 Markets . . . . . . . . . . . . . . . . . . . . . . . . . . . . . . . . . . . . . . . . . . . . . . . . 2-242.5.1 Market Volumes . . . . . . . . . . . . . . . . . . . . . . . . . . . . . . . . . . . . 2-25
2.5.1.1 Domestic Production . . . . . . . . . . . . . . . . . . . . . . . . . 2-252.5.1.2 Domestic Consumption . . . . . . . . . . . . . . . . . . . . . . . 2-272.5.1.3 International Trade . . . . . . . . . . . . . . . . . . . . . . . . . . 2-27
2.5.2 Market Prices . . . . . . . . . . . . . . . . . . . . . . . . . . . . . . . . . . . . . . 2-282.5.3 Future Projections . . . . . . . . . . . . . . . . . . . . . . . . . . . . . . . . . . 2-29
3 Petroleum Liquids . . . . . . . . . . . . . . . . . . . . . . . . . . . . . . . . . . . . . . . . . . . . . . . 3-1
3.1 Petroleum OLD Background . . . . . . . . . . . . . . . . . . . . . . . . . . . . . . . . . 3-13.1.1 SIC and NAICS Codes and Description of Service Providers . . 3-23.1.2 Affected Markets . . . . . . . . . . . . . . . . . . . . . . . . . . . . . . . . . . . . 3-3
3.2 Production/Service Overview . . . . . . . . . . . . . . . . . . . . . . . . . . . . . . . . 3-43.2.1 Service Overview . . . . . . . . . . . . . . . . . . . . . . . . . . . . . . . . . . . . 3-53.2.2 Major By-Products and Co-Products, if Applicable . . . . . . . . . 3-53.2.3 Costs of Production . . . . . . . . . . . . . . . . . . . . . . . . . . . . . . . . . . 3-63.2.4 Supply Elasticities . . . . . . . . . . . . . . . . . . . . . . . . . . . . . . . . . . . 3-73.2.5 Emissions . . . . . . . . . . . . . . . . . . . . . . . . . . . . . . . . . . . . . . . . . . 3-8
3.3 Industry Organization . . . . . . . . . . . . . . . . . . . . . . . . . . . . . . . . . . . . . . . 3-83.3.1 Market Structure . . . . . . . . . . . . . . . . . . . . . . . . . . . . . . . . . . . . 3-8
3.3.1.1 Producers . . . . . . . . . . . . . . . . . . . . . . . . . . . . . . . . . . 3-83.3.1.2 Product Differentiation . . . . . . . . . . . . . . . . . . . . . . . . 3-93.3.1.2 Market Share . . . . . . . . . . . . . . . . . . . . . . . . . . . . . . . . 3-93.3.1.3 Barriers to Entry . . . . . . . . . . . . . . . . . . . . . . . . . . . . 3-12
3.3.2 Facilities . . . . . . . . . . . . . . . . . . . . . . . . . . . . . . . . . . . . . . . . . . 3-123.3.2.1 Location . . . . . . . . . . . . . . . . . . . . . . . . . . . . . . . . . . 3-13

v
3.3.2.2 Production Capacity and Utilization . . . . . . . . . . . . . 3-133.3.2.3 Employment . . . . . . . . . . . . . . . . . . . . . . . . . . . . . . . 3-13
3.3.3 Firm Characteristics . . . . . . . . . . . . . . . . . . . . . . . . . . . . . . . . . 3-133.3.3.1 Ownership . . . . . . . . . . . . . . . . . . . . . . . . . . . . . . . . . 3-133.3.3.2 Size Distribution . . . . . . . . . . . . . . . . . . . . . . . . . . . . 3-133.3.3.3 Vertical and Horizontal Integration . . . . . . . . . . . . . 3-193.3.3.4 Financial Condition . . . . . . . . . . . . . . . . . . . . . . . . . . 3-21
3.4 Uses and Consumers . . . . . . . . . . . . . . . . . . . . . . . . . . . . . . . . . . . . . . 3-213.4.1 Major Consumers . . . . . . . . . . . . . . . . . . . . . . . . . . . . . . . . . . . 3-223.4.2 Purpose of Consumption . . . . . . . . . . . . . . . . . . . . . . . . . . . . . 3-233.4.3 Characterization of Demand—Derived Demand Elasticity . . . 3-253.4.4 Substitution Possibilities . . . . . . . . . . . . . . . . . . . . . . . . . . . . . 3-26
3.5 Markets . . . . . . . . . . . . . . . . . . . . . . . . . . . . . . . . . . . . . . . . . . . . . . . . 3-273.5.1 Market Volumes . . . . . . . . . . . . . . . . . . . . . . . . . . . . . . . . . . . . 3-27
3.5.1.1 Domestic Production . . . . . . . . . . . . . . . . . . . . . . . . . 3-273.5.1.2 Domestic Consumption . . . . . . . . . . . . . . . . . . . . . . . 3-283.5.1.3 International Trade . . . . . . . . . . . . . . . . . . . . . . . . . . 3-30
3.5.2 Market Prices . . . . . . . . . . . . . . . . . . . . . . . . . . . . . . . . . . . . . . 3-353.5.3 Future Projections . . . . . . . . . . . . . . . . . . . . . . . . . . . . . . . . . . 3-36
3.5.3.1 Domestic Production . . . . . . . . . . . . . . . . . . . . . . . . . 3-373.5.3.2 Domestic Consumption . . . . . . . . . . . . . . . . . . . . . . . 3-373.5.3.3 International Trade . . . . . . . . . . . . . . . . . . . . . . . . . . 3-373.5.3.4 Market Prices . . . . . . . . . . . . . . . . . . . . . . . . . . . . . . 3-38
References . . . . . . . . . . . . . . . . . . . . . . . . . . . . . . . . . . . . . . . . . . . . . . . . . . . . . . . . . . . R-1

vi
LIST OF FIGURES
Number Page
2-1 Distribution of Organic Chemical Liquids Facilities . . . . . . . . . . . . . . . . . . . . 2-142-2 The Distribution of Organic Chemical Liquids Facilities by
Employment . . . . . . . . . . . . . . . . . . . . . . . . . . . . . . . . . . . . . . . . . . . . . . . . . . . 2-152-3 The Size Distribution of Companies that own OLD Facilities involved
in Chemical Distribution, by 1998 Sales (in $1997) . . . . . . . . . . . . . . . . . . . . 2-192-4 Size Distribution of Companies that own OLD Facilities involved in
Chemical Distribution . . . . . . . . . . . . . . . . . . . . . . . . . . . . . . . . . . . . . . . . . . . 2-202-5 Distribution of Firms by Profit Margin . . . . . . . . . . . . . . . . . . . . . . . . . . . . . . 2-21
3-1 Location of Petroleum Liquids Distributors . . . . . . . . . . . . . . . . . . . . . . . . . . 3-143-2 The Distribution of Organic Chemical Liquids Facilities by
Employment . . . . . . . . . . . . . . . . . . . . . . . . . . . . . . . . . . . . . . . . . . . . . . . . . . . 3-153-3 The Size Distribution of Companies that own OLD Facilities involved
in the Distribution of Nongasoline Petroleum Liquids, by 1998 Sales(in $1997) . . . . . . . . . . . . . . . . . . . . . . . . . . . . . . . . . . . . . . . . . . . . . . . . . . . . . 3-19
3-4 Size Distribution of Companies that own OLD Facilities Involved inthe Distribution of Non-gasoline Petroleum Liquids . . . . . . . . . . . . . . . . . . . . 3-20
3-5 Distribution of Firms by Profit Margin . . . . . . . . . . . . . . . . . . . . . . . . . . . . . . 3-233-6 Value of Shipments, 1989–1996 (SIC 2911) . . . . . . . . . . . . . . . . . . . . . . . . . . 3-283-7 GDP, 1989–1996 . . . . . . . . . . . . . . . . . . . . . . . . . . . . . . . . . . . . . . . . . . . . . . . 3-20

vii
LIST OF TABLES
Number Page
1-1 Nationwide HAP Totals (tons/yr) . . . . . . . . . . . . . . . . . . . . . . . . . . . . . . . . . . . 1-51-2 Summary of Facility Categories, Liquids, Modes of Transportation,
and Emissions Sources Covered by the OLD Source Category . . . . . . . . . . . . . 1-6
2-1 Principal OLD Facility Categories . . . . . . . . . . . . . . . . . . . . . . . . . . . . . . . . . . . 2-32-2 Specialization and Coverage Ratios for OLD Industries, 1982, 1987,
and 1992 . . . . . . . . . . . . . . . . . . . . . . . . . . . . . . . . . . . . . . . . . . . . . . . . . . . . . . . 2-52-3 Annual Production Costs ($1997 103) . . . . . . . . . . . . . . . . . . . . . . . . . . . . . . . . 2-62-4 Top Five OLD Companies Ranked by Sales within Four-Digit SIC . . . . . . . . . 2-92-5 Concentration Ratios by SIC Code . . . . . . . . . . . . . . . . . . . . . . . . . . . . . . . . . 2-112-6 Number of Total OLD Facilities and Affected Facilities, 1997 . . . . . . . . . . . . 2-122-7 Capacity Utilization Rates by Industry . . . . . . . . . . . . . . . . . . . . . . . . . . . . . . 2-152-8 Firms’ Legal Form of Organization for OLD Industries, 1987 . . . . . . . . . . . . 2-162-9 Small Business Size Standards for OLD Industries . . . . . . . . . . . . . . . . . . . . . 2-172-10 Profit Margins of Firms that own Organic Chemical Liquids
Distribution Facilities . . . . . . . . . . . . . . . . . . . . . . . . . . . . . . . . . . . . . . . . . . . . 2-202-11 Financial Condition of Firms in the Chemical Industry . . . . . . . . . . . . . . . . . . 2-222-12 Value of Shipments, 1989–1996 ($1997 103) . . . . . . . . . . . . . . . . . . . . . . . . . 2-262-13 Apparent Domestic Consumption, 1990–1996 ($1997 103) . . . . . . . . . . . . . . 2-272-14 Value of Imports and Exports, 1989–1996 ($1997 106) . . . . . . . . . . . . . . . . . 2-282-15 Producer Price Index (PPI), 1988–1997 . . . . . . . . . . . . . . . . . . . . . . . . . . . . . . 2-292-16 Current Market Prices of Common Organic Chemicals . . . . . . . . . . . . . . . . . 2-30
3-1 Petroleum Products Produced at U.S. Refineries, 1997 . . . . . . . . . . . . . . . . . . . 3-23-2 U.S. Refinery Receipts of Crude Oil by Method of Transportation and
Source, 1998 . . . . . . . . . . . . . . . . . . . . . . . . . . . . . . . . . . . . . . . . . . . . . . . . . . . 3-33-3 Principal OLD Facility Categories . . . . . . . . . . . . . . . . . . . . . . . . . . . . . . . . . . . 3-43-4 Specialization and Coverage Ratios for OLD Industries, 1982, 1987,
and 1992 . . . . . . . . . . . . . . . . . . . . . . . . . . . . . . . . . . . . . . . . . . . . . . . . . . . . . . . 3-63-5 Annual Production Costs ($1997 103) . . . . . . . . . . . . . . . . . . . . . . . . . . . . . . . . 3-73-6 Top Five OLD Companies Ranked by Sales within Four-Digit SIC . . . . . . . . 3-103-7 Concentration Ratios by SIC Code . . . . . . . . . . . . . . . . . . . . . . . . . . . . . . . . . 3-113-8 Number of Total OLD Firms and Affected Firms, 1996 . . . . . . . . . . . . . . . . . 3-16

viii
3-9 Firms’ Legal Form of Organization for OLD Industries, 1987 and1992 . . . . . . . . . . . . . . . . . . . . . . . . . . . . . . . . . . . . . . . . . . . . . . . . . . . . . . . . . 3-17
3-10 Small Business Size Standards for OLD Industries . . . . . . . . . . . . . . . . . . . . . 3-183-11 Profit Margins of Firms that own Organic Chemical Liquids
Distribution Facilities . . . . . . . . . . . . . . . . . . . . . . . . . . . . . . . . . . . . . . . . . . . . 3-223-12 Estimates of Price Elasticity of Demand for Petroleum Products . . . . . . . . . . 3-263-13 Total Production of Petroleum Products, 1989-1998 (103 barrels/day) . . . . . . 3-303-14 Consumption of Petroleum Products, 1989–1998 (103 barrels/day) . . . . . . . . 3-313-15 Imports of Petroleum Products, 1989-1998 (103 barrels/day) . . . . . . . . . . . . . 3-323-16 Crude Oil Imports as a Percentage of Consumption, 1989-1998
(103 barrels/day) . . . . . . . . . . . . . . . . . . . . . . . . . . . . . . . . . . . . . . . . . . . . . . . . 3-333-17 Exports of Petroleum Products, 1989-1998 (103 barrels/day) . . . . . . . . . . . . . 3-343-18 Crude Oil Exports as a Percentage of Production, 1989-1998
(103 barrels/day) . . . . . . . . . . . . . . . . . . . . . . . . . . . . . . . . . . . . . . . . . . . . . . . . 3-353-19 Table United States Crude Oil and Petroleum Products Prices ($/gal) . . . . . . 3-363-20 Petroleum Consumption and Net Imports in 1997 and 2020
(106 barrels/ day) . . . . . . . . . . . . . . . . . . . . . . . . . . . . . . . . . . . . . . . . . . . . . . . 3-38

DRAFT
1-1
SECTION 1
INTRODUCTION TO THE ORGANIC LIQUIDS DISTRIBUTION (OLD)
SOURCE CATEGORY
Under Title III of the Clean Air Act Amendments of 1990, the U.S. Environmental
Protection Agency’s (EPA’s) Office of Air Quality Planning and Standards (OAQPS) is
developing a national emission standard for hazardous air pollutants (NESHAP) to limit air
emissions from source categories covered under the proposed organic liquids distribution
(OLD) NESHAP. The NESHAP, which is also a maximum achievable control technology
(MACT) standard, is scheduled to be proposed in August 2000. The Innovative Strategies
and Economics Group is responsible for developing an economic impact analysis (EIA) in
support of evaluating impacts associated with the regulatory options considered for this
NESHAP. Industries that will be affected by this NESHAP include chemical manufacturers,
petroleum refiners, and pipeline owners and operators (organic liquids other than gasoline).
1.1 Brief Description of Source Category
The organic liquids distribution (OLD) source category consists of all of the source
category operations that receive, store, and distribute organic liquids throughout the
economy. For the purposes of this MACT standard, only those organic liquids with
appreciable hazardous air pollutant (HAP) content (beyond trace quantities) are considered to
be “organic liquids.” These liquids may consist of pure HAP chemicals (single HAP) or
chemical blends, refined petroleum products, natural gas liquids, or crude oil. They also may
consist of “appreciable” organic HAPs blended with inorganic, non-HAP liquids (such as
water).
OLD operations are carried out by a large number of industries. “Plant sites
performing OLD activities include those that produce, consume, or merely store and
distribute organic liquids. The four principal industries with the greatest volumes of OLD
operations are chemical manufacturing, petroleum refining, crude oil and natural gas liquids
pipeline transportation, and liquid terminalling and warehousing” (Abt, 1998).

DRAFT
1-2
Distributed organic liquids of concern in this profile fall under two broad categories:
C chemicals, including synthetic chemicals and petrochemicals (i.e., chemicalsmanufactured from crude petroleum); and
C petroleum liquids, including crude oil, natural gas liquids, and nongasolinerefined products.
Gasoline, which is subject to the gasoline distribution NESHAP, is not covered by the OLD
source category. Section 2 provides a more detailed description of the liquids covered by
this regulation.
For the purposes of this regulation, distribution includes the bulk transfer of an
organic liquid across a plant site boundary, either into or out of the plant site (Abt, 1998).
Also covered under this definition are the storage of OLD liquids after receipt and before
distribution, and waste and wastewater treatment and disposal practices associated with
distribution and storage activities. Not included in the OLD source category are the
following activities: the movement of packaged liquids (e.g., drummed or canned liquids);
any production, compounding, blending, or packaging activities at OLD facilities; and the
transportation of OLD liquids for activities other than loading and unloading.
The OLD activities described above take place at sites that serve as distribution
points from which organic liquids can be obtained for further use and processing.
Distribution activities are either collocated with liquid production operations, or they are
carried out at stand-alone storage and distribution terminals. Although the MACT standards
developed under this regulation will apply to any facility that receives, stores, and/or
distributes nongasoline liquids with HAP content, this profile focuses on five categories of
OLD facilities for which model plants were developed:
C chemical production,
C petroleum refineries,
C liquid terminals
C crude oil pipeline pumping/breakout stations, and
C petroleum terminals.
These categories were identified from EPA’s April 1998 source category survey as
accounting for the majority of OLD HAP emissions (Gale Business Resources, 1999).

DRAFT
1This discussion is largely based on the July 24, 1998, EPA memorandum entitled “Production Projections for
the OLD Source Category.”
1-3
1.2 Current Economic Conditions and Trends
OLD distribution points will incur the costs of this regulation; therefore, this profile
examines the current condition of the OLD source category as it relates to distribution
activities. This section briefly describes recent trends in each of the five principal, OLD
facility categories.1
1.2.1 Chemical Production
Recent trends in the chemical manufacturing industry include increased capital
spending and declining employment. In an effort to save money and increase efficiency,
many of the activities associated with repackaging, blending, reformulating, bar-coding,
testing, and quality assurance have been contracted out to third-party operators. This trend
has been growing in the chemical manufacturing business. With more of this work being
outsourced, manufacturers’ costs are decreasing (Distribution, 1996).
1.2.2 Petroleum Refineries
Over the past two decades, oil companies have been closing refineries that are no
longer profitable. To avoid expensive environmental cleanup costs, companies have started
to convert the refineries’ storage tanks and to operate them as storage and distribution
centers. However, in recent years, a stable supply market for crude oil has led to a reduction
in oil inventories, creating excess storage space at refineries. Refineries have responded to
this situation by leasing out this excess space to third parties. With continued merger and
cost-cutting activities in the source category, it is conceivable that more excess space will be
created in the future and more refineries will continue to lease increasing amounts of storage
space at their installations.
1.2.3 Liquid and Petroleum Terminals
The bulk liquid terminalling industry is undergoing changes as the major
manufacturers of organic liquids and chemicals are restructuring their industries to meet
present and future demands. Terminals face a dual challenge in the future. One challenge is
increasing regulatory demands that are raising the cost of operation for refineries, chemical
plants, and terminals. In addition, excess storage capacity at petroleum refineries and newly

DRAFT
2Originally, wastewater and semi-aqueous waste were also believed to be sources of HAP emissions for the
OLD source category. However, responses to the OLD survey indicated that insufficient information is
availab le to determine nonzero MACT floors for wastewater. In addition, the survey indicated that semi-
aqueous waste generated from OLD operations is generally kept in closed containers once it is collected.
The handling of these wastes, at both chemical facilities and refineries, is already covered under the
Resource Conservation and Recovery Act (RCRA) (“MACT Floor Development for the OLD Source
Category,” Memo, May 5, 1999). Consequently, emission sources associated with wastewater and semi-
aqueous waste are excluded from this analysis.
1-4
created storage capacity at smaller chemical distributors have started to directly compete
with the larger bulk terminals. Major consolidations within the chemical industry have also
affected the bulk terminalling industry. Major chemical companies have begun outsourcing
and consolidating their storage requirements at single-party terminals, rather than spreading
their operations across many terminals.
1.2.4 Crude Oil Pipeline Pumping and Breakout Stations
The Federal Energy Regulatory Commission (FERC) regulates interstate pipeline
companies. Similar to some of the other categories, these pipeline companies are
experiencing difficult times as well. In 1997 earnings from operations were down, following
a 2-year trend. The effects of warmer-than-normal weather during 1997 in North America
also caused oil deliveries to decrease. This decrease affected both operating revenues and
net income for pipeline companies (Oil & Gas Journal, 1998).
1.3 Environmental Concerns
EPA has identified four emission sources that account for the majority of HAP
emissions from OLD activities:2
C storage tanks,
C liquid transfer activities involving tank trucks and railcars (loading racks),
C container filling operations, and
C leaks from equipment components (e.g., pumps, valves).
Table 1-1 shows the nationwide HAP totals for each industry resulting from the different
emission sources. Storage tanks emit 63,315 tons/yr of HAPs, accounting for approximately
70 percent of the total OLD source category. Equipment leaks are the next greatest source of
HAP emissions, representing almost 19 percent of the source category total.

DRAFT
1-5
Table 1-2 lists all of the facility categories as well as the modes of transportation
employed and the emission sources covered by the OLD source category.
1.4 Organization of Report
Although numerous SIC codes and facility categories are covered by the regulation,
this report will focus on only the two primary facility categories—chemical liquids and
petroleum liquids. As shown in Table 1-1, 57 percent of the facilities affected by the OLD
NESHAP belong to the chemical industry. The remaining 43 percent of facilities are
involved in the distribution of petroleum liquids. Because the two types of facilities will face
different demand structures, the industry profile is broken into two virtually independent
profiles, one for each of the categories. Sections 2 and 3 are both organized as follows:
background, production overview, source category organization, characterization of uses and
consumers, and market information.
Table 1-1. Nationwide HAP Totals (tons/yr)a
Industry
Segment
No. of Major
Source
Facilities
Nationwideb
Storage
Tanks
Loading
Racks
Container
Filling
Equipment
Leaks Totals
Chemical production 370 38,785 4,660 48 10,030 53,520
Petroleum refinery 111 4,365 2,100 1 1,460 7,930
Liquid terminals 94 17,990 2,890 1 5,015 25,900
Crude oil pipelines 35 440 __a __a 45 490
Petroleum terminals 41 1,735 260 1 965 2,960
Total 651 63,315 9,910 51 17,515 90,800
a There are no transfer rack or container filling emissions at facilities with SIC code 46.b Estimated number of facilities based on industry data and previous NESHAP reports, as described in the
source document. Only 239 facilities returned surveys on their OLD activities. Emissions data for the
nonresponding facilities were estimated to develop the estimate of nationwide impacts.
Source: U.S. Environmental Protection Agency. 2000. Technical Support Document for the Organic Liquids
Distribution (Non-gasoline) Industry. Washington, DC: U.S. Environmental Protection Agency,
Office of Air Quality Planning and Standards.

DRAFT
1-6
Table 1-2. Summary of Facility Categories, Liquids, Modes of Transportation, andEmissions Sources Covered by the OLD Source Category
Facility Category Liquids Handled
Mode of Liquid
Transportation Emission Sources
Chemical production Synthetic chemicals
Petrochemicals
Tank truck
Tank car (railroad)
Sometimes pipelines
Storage tanks
Liquid transfer
Container filling
Equipment leaks
Petroleum refineries Crude oil
Natural Gas Liquids, (NGLs)
Nongasoline refined Products
Pipeline
Tanker ships
Barges
Tank car
Tank truck
Storage tanks
Liquid transfer
Container filling
Equipment leaks
Liquid terminals Synthetic chemicals
Petrochemicals
Crude oil
Nongasoline refined Products
Tank car
Tank trucks
Storage tanks
Liquid transfer
Container filling
Equipment leaks
Crude oil pipelines Crude oil Pipeline
Tanker ships
Barges
Tank car
Tank truck
Storage tanks
Equipment leaks
Petroleum terminals Crude oil
NGLs
Nongasoline refined Products
Tanker ship
Barge
Pipeline
Tank car
Tank truck
Storage tanks
Liquid transfer
Container filling
Equipment leaks
Sources: Various background documents.
Gale Business Resources. Pipelines, Crude Petroleum. 1999.
American Petroleum Institute. August 1998. Heating Oil in the United States.
DRAFT
2-1
SECTION 2
DISTRIBUTION OF ORGANIC CHEMICAL LIQUIDS
Organic chemical liquids include synthetic chemicals and petrochemicals (chemicals
manufactured from crude petroleum). Synthetic organic chemicals cover a wide range of
intermediate products, including inputs to the manufacture of synthetic resins, plastics
materials, and nonvulcanized elastomers, as well as cyclic organic intermediates and
dyes/pigments, and aliphatic and acrylic chemicals and solvents.
Petrochemicals are intermediate products resulting from the refinery process.
Petrochemical feedstocks include naphtha, a liquid obtained from refining crude oil, as well
as products recovered from natural gas and refinery gases (ethane, propane, and butane).
Other feedstocks include ethylene; propylene; normal- and iso-butylenes; butadiene; and
aromatics such as benzene, toluene, and xylene. The volume of petroleum liquids available
to the petrochemical industry depends primarily on the following three factors: crude
petroleum input to refineries, refinery process configuration and operating conditions, and
the demands and prices for naptha and gas oil in their primary fuel markets (DOE, EIA,
1999).
2.1 Chemical OLD Background
Synthetic organic chemical manufacturing industry (SOCMI) facilities manufacture a
variety of liquid chemicals that are pure HAPs or contain HAPs. A SOCMI facility typically
contains storage tanks, transfer racks, liquid piping and components, and a wastewater
handling and treatment system or systems, each a potential source of HAP emissions. The
Hazardous Organic NESHAP (HON) regulates these emission sources if they are assigned to
a chemical manufacturing process unit. Since many such activities are also involved in
distribution, many OLD activities at SOCMI facilities are already being regulated under the
HON. However, instances exist (especially certain storage tanks and transfer racks) where
such OLD activities are not currently covered by a MACT (Abt, 1998).

DRAFT
2-2
2.1.1 SIC and NAICS Codes and Description of Service Providers
Synthetic chemicals are associated with the OLD source category when they are
distributed from SOCMI facilities to liquid terminals. These chemicals are typically
transported by means of tank truck or tank car.
Petrochemical feedstocks travel by various modes throughout their product life. The
distribution components associated with the OLD source category are the shipments of
feedstocks from refineries to liquid terminals and SOCMI facilities. Most often,
petrochemicals travel by means of tank truck or tank car; however, some SOCMI facilities
have pipelines by which their products are distributed.
Synthetic organic chemical and petrochemical distribution facilities are most likely to
be classified under the three Standard Industrial Classification (SIC) codes listed in
Table 2-1. The table includes the North American Industry Classification System (NAICS)
codes that correspond to the affected SIC-coded industries.
2.1.2 Affected Markets
The chemical markets potentially affected by regulating the OLD source category
include the markets for both petrochemicals and their end products, including synthetic
organic chemicals. As with petroleum liquids, the demand for these chemicals depends
primarily on their end use. Organic chemicals, particularly petrochemicals, play an
important role in society. Petrochemicals are usually an intermediate product that is
converted into a variety of consumer and industrial products. Some of the end products
include plastics, antifreeze, synthetic fibers, rubber, solvents, and detergents. Higher demand
for these products translates into higher demand for their inputs (EPA, 1995).
2.2 Production/Service Overview
OLD distribution is a service that is part of the production process for organic liquids.
2.2.1 Service Overview
After a refining process, petrochemicals might be distributed to chemical production
plants for processing into synthetic chemicals, or they might be transported to an
independent liquid terminal for storage before further processing. In addition, independent
liquid terminals may also receive processed synthetic chemicals for storage. Liquids stored

DRAFT
2-3
at independent liquid terminals might be transported to chemical production plants or
refineries for further processing, they might be sent to a blending/packaging/distribution
facility, or they might be distributed to end users (Abt, 1998).
2.2.2 Major By-Products and Co-Products, if Applicable
By-products and co-products are unregulated commodities that result from the
production process in question. Knowledge of such products is important because they may
have economic value that should be considered when determining a regulation’s impacts on a
facility.
Table 2-1. Principal OLD Facility Categories
SIC
Code SIC Description
NAICS
Codes NAICS Description
Chemical Production (118 survey responses)
2821 Plastics Materials, Synthetic and
Resins, and Nonvulcanizable
Elastomers
325211 Plastics Material and Resin
Manufacturing
2865 Cyclic Organic Crudes and
Intermediates, and Organic Dyes
and Pigments
325192 Cyclic Crude and Pigment
Manufacturing
32511 Petrochemical Manufacturinga
325132 Synthetic Organic Dye and
Pigment Manufacturing
2869 Industrial Organic Chemicals, NEC 325188 All Other Basic Inorganic
Chemical Manufacturinga
32511 Petrochemical Manufacturinga
325193 Ethyl Alcohol Manufacturing
32512 Industrial Gas Manufacturing
325199 All Other Basic Organic Chemical
Manufacturinga
a Only part of the NAICS industry is made up of facilities from the corresponding SIC-coded industry.
Source: U.S. Census Bureau. March 2000. “1987 SIC Matched to 1997 NAICS.” http://www.census.gov/epcd
/naics/NSIC3B.HTM L. As obtained on March 13, 2000.

DRAFT
2-4
The Census assigns a “primary” SIC code to each establishment that corresponds to
the SIC code for the largest (by value) single type of product shipped by the establishment.
Thus, products shipped by an establishment that are classified in the same industry as the
establishment are considered “primary,” and all other products shipped by the establishment
are considered “secondary.” The Census then calculates two ratios to illustrate the product
mix between primary and secondary products in each industry.
The specialization ratio represents the ratio of primary product shipments to total
product shipments for all establishments classified in the industry. It answers the question:
“What percentage of the output of industry’s facilities is associated with the industry’s
primary SIC code?” By definition, if an industry does not have output other than its primary
product, by-products and co-products cannot contribute significantly to the industry’s
revenues. While a high specialization ratio precludes the existence of marketable by- or co-
products, a low specialization ratio does not necessarily prove the existence of these
products. A large percentage of a facility’s output not associated with its primary SIC code
may indicate the presence of by-products; however, it may also be the result of a separate
production line that would be neither directly nor indirectly affected by regulation.
The coverage ratio represents the ratio of primary products shipped by the
establishments classified in the industry to the total shipments of such products that are
shipped by all establishments classified in all industries. It answers the question: “What
percentage of the industry’s output is supplied by firms with the industry’s primary SIC
code?”
Analysts often use the specialization ratio and the coverage ratio as proxies when
determining the likely importance of by-products and co-products in an industry. Table 2-2
presents the specialization and coverage ratios for the industries covered under the OLD
source category. The numbers in Table 2-2 show that chemical manufacturers are
characterized by a high degree of specialization—between 75 and 86 percent.
The specialization ratio is a useful tool for assessing the likelihood of marketable co-
and by-products in an industry. However, by-products with economic value may exist even
if they are not sold in the market. Such by-products would not be reflected by the
specialization ratio because they do not represent “shipments.” Even if a facility does not
derive revenues from nonmarketable by-products, it may still benefit from them through cost
savings. One by-product that is not always sold in the market is electricity. Some facilities

DRAFT
1This information is presented for information purposes only and will not be used as an input into the EIA.
2-5
in both the petroleum and the chemical industries use excess heat from their production
processes to generate electricity through a mechanism commonly referred to as
“cogeneration.” For those facilities, electricity is a by-product because it is inextricably
linked to the production of organic liquids and has economic value to the facility (DOE, EIA,
1999).1
2.2.3 Costs of Production
Knowledge about the cost of production in an industry is important when estimating
likely shifts in the supply curve as a result of regulation. However, distribution costs are not
readily available. As indicated earlier, the demand and supply of OLD distribution activities
Table 2-2. Specialization and Coverage Ratios for OLD Industries, 1982, 1987, and1992
SIC
CodeSIC Description 1987a 1992a 1997b
Chemical Production
2821 Plastics Materials, Synthetic Resins, and Nonvulcanizable Elastomers
Primary Products Specialization Ratio 88 86 86
Coverage Ratio 81 80 83
2865 Cyclic Organic Crudes and Intermediates, Organic Dyes and Pigments
Primary Products Specialization Ratio 80 86 85c
Coverage Ratio 61 61 75c
2869 Industrial Organic Chemicals, NEC
Primary Products Specialization Ratio 75 76 78c
Coverage Ratio 84 85 81c
a Abt Associates. October 15 , 1998. Characterization of the Organic Liquid Distribution (Nongasoline)
Industry. Prepared for the U .S. Environmental Protection Agency. b U.S. Census Bureau. 2000. “Survey of Plant Capacity: 1998.” Current Industrial Reports. MQ-C1(98).
Washington, DC: Government Printing Office.c Weighted average of ra tios of the corresponding NAICS-coded industries. W eight = (number of facilities in
NAICS-coded industry that are in a given SIC-coded industry)/(total number of facilities in the SIC-coded
industry).

DRAFT
2-6
are driven by the market for the end product. Therefore, Table 2-3 presents overall
production costs for potentially affected OLD industries by SIC code. The Census
Department publishes production costs for manufacturing industries.
In terms of the percentage of total costs composed of capital, raw materials, labor, or
fuel and electricity, the three chemical manufacturing industry groups (SICs 2821, 2865,
2869) are very similar. In terms of production costs per facility, SIC 2865 (Cyclic Organic
Chemicals) is the smallest of these groups, and SICs 2821 and 2869 (Plastic Materials and
Synthetic Resins, Industrial Organic Chemicals NEC) are approximately the same size
(Abt, 1998).
Table 2-3. Annual Production Costs ($1997 103)a
Cost of Production
2821b
(percent of total)
2865b
(percent of total)
2869b
(percent of total)
Capital expenditures $2,863,610
(9.08%)
$1,005,883
(10.86%)
$5,218,629
(10.29%)
Raw material costs $25,542,668
(81.02%)
$7,173,464
(77.46%)
$39,258,273
(77.44%)
Labor costs $1,699,895
(5.39%)
$541,138
(5.84%)
$2,865,312
(5.65%)
Electricity costs $747,999
(2.37%)
$194,272
(2.10%)
$910,493
(1.80%)
Fuel costs $671,049
(2.13%)
$345,990
(3.74%)
$2,443,975
(4.82%)
Total $31,525,221 $9,260,747 $50,696,682
Number of
establishmentsc
449 206 705
Production cost per
establishment
$70,212 $44,955 $71,910
a Dollar values adjusted using the producer price index for four-digit SIC codes from the Bureau of Labor
Statistics.b 1996 Annual Survey of Manufacturesc 1992, Census of Manufactures

DRAFT
2-7
2.2.4 Supply Elasticities
The supply elasticity for synthetic organic chemicals and petrochemicals depends on
the ability and willingness of firms to scale up production in the face of higher demand.
Supply elasticity refers to the ratio of a given percentage change in price to a resulting
percentage change in quantity supplied. At a given point in time, firms can be expected to
supply an approximately profit-maximizing quantity, given their available technology. For a
given increase in the price of chemicals, the increase in quantity supplied will be greater
when the producers of that chemical have excess capacity and when new production lines for
the chemical are easy and inexpensive to establish.
2.2.5 Emissions
As shown in Table 1-1, facilities involved in the distribution of synthetic organic
chemicals and petrochemicals are estimated to account for 59 percent of all emissions. As
described in Section 1, four emission sources have been identified as accounting for the
majority of HAP emissions during the distribution of synthetic organic chemicals and
petrochemicals:
C storage vessels;
C liquid transfer activities involving tank trucks and railcars (loading racks);
C container filling operations; and
C leaks from equipment components (e.g., pumps, valves).
2.3 Industry Organization
This section describes the organization of the segments of the chemical industry most
likely to be affected by the NESHAP regulation and provides specific information on
affected OLD facilities and firms when such information is available. The section begins
with a discussion of market structure, followed by information on facilities that distribute
organic chemicals and the firms that own them.
2.3.1 Market Structure
The structure of the affected market(s) is an important factor in estimating the
potential impacts from a regulation. For example, in a competitive market where each
producer has little market power, it would be difficult for an affected firm to pass on

DRAFT
2-8
compliance costs to its consumers. On the other hand, in an industry with very few
producers or where the products are highly differentiated, it may be possible for affected
firms to recover part or all of the compliance costs through price increases. The most
important factors determining the competitive structure of an industry are the number of
producers, the degree of product differentiation, and the presence of barriers to entry. The
remainder of this subsection will provide a brief explanation of these factors and discuss the
competitive structure of the OLD markets in terms of each factor (CMA, 1995).
2.3.1.1 Producers
Table 2-4 lists the top five companies for each of the three chemical SIC groups
within this source category, ranked by sales. In addition to providing the name of the five
largest companies, the table also indicates whether the company is publicly or privately held,
and whether it is the parent or a subsidiary with a parent in a different SIC group.
2.3.1.2 Product Differentiation
Product differentiation is a form of nonprice competition used by firms to establish
market power in a specific product market. Product differentiation may result from unique
product characteristics or from brand recognition. In general, a company that sells a product
with valued characteristics that no or few other products possess will have more market
power than a company that sells a product that has no distinguishable characteristics from
other products in the same market. Similarly, market power is created if customers place a
higher value on a product produced by a specific company, or brand, even though the
product characteristics are identical to the products produced by other companies.
The products of concern to the OLD source category are characterized by a high
degree of homogeneity. Thus, brand loyalty is not expected to be an important factor in the
organic chemicals market (CMA, 1995; Arnold, 1989; Gale, 1999; DOE, EIA, 1999).

DRAFT
2-9
2.3.1.3 Market Share
The number of producers and the market shares of the largest firms are important
determinants of the degree of market power individual firms may have. The term
“concentration” refers to the combined percentage of total output accounted for by the largest
producers in the industry. For example, the four-firm concentration ratio (CR4) refers to the
market share of the four largest firms. The higher the concentration ratio, the more
concentrated the industry. A market is generally considered highly concentrated if the CR4
is greater than 50 percent. The Herfindahl-Hirschman index (HHI) is an alternative measure
of concentration. It is equal to the sum of the squares of the market shares for the largest 50
firms in the industry. The higher the index, the fewer the number of firms supplying the
industry and the more concentrated the industry is at the top. The Justice Department uses
the HHI for antitrust enforcement purposes. The benchmark used by the Justice Department
Table 2-4. Top Five OLD Companies Ranked by Sales within Four-Digit SIC
2821 2865 2869
1. Monsanto Co.
(Public)
1. Huntsman Corp.
(Private)
1. Bayer Corp.
(Private Subsidiary)
2. Ashland Chemical Co.
(Private Subsidiary)
2. Crompton and Knowles Corp.
(Public)
2. Union Carbide Corp.
(Public)
3. Rohm and Haas Co.
(Public)
3. Clariant Corp.
(Private Subsidiary)
3. ARCO Chemical Co.
(Public)
4. MA Hanna Co.
(Public)
4. ChemFirst Inc.
(Public)
4. Dow Corning Corp.
(Joint Venture)
5. Hercules Inc.
(Public)
5. System Bio-Industries Inc.
(Private Subsidiary)
5. Witco Corp.
(Public)
Sources: Gale Research. 1998. Ward’s Business Directory of U.S. Private and Public Companies, 1999.
Detroit, MI. Gale Research.
American Petro leum Institute. 1998. Heating Oil in the United States.
U.S. Environmental Protection Agency. 1995. Economic Impact Analysis for the Petroleum
Refining NESHAP.

DRAFT
2-10
is 1,000, where any industry with an HHI less than 1,000 is considered to be unconcentrated.
The advantage of the HHI over the concentration ratio is that the former gives information
about the dispersion of market share among all the firms in the industry, not just the largest
firms (Arnold, 1989).
In general, an industry with a large number of firms and a small concentration will be
relatively more competitive than an industry with few firms and a high concentration. Firms
that operate in a more competitive market will be relatively more affected by new regulations
because they are less likely to be able to pass on compliance costs.
Table 2-5 shows concentration ratios by SIC code for the affected OLD industries.
Ratios are included for the census years 1987 and 1992 (where possible). For some SIC
codes, data are available for only 1992. The numbers in Table 2-5 show that, by and large,
the OLD industries are characterized by a large number of firms and generally
unconcentrated markets, indicating a high degree of competitiveness in their respective
product markets. When interpreting the data presented in Table 2-5, it is important to note
that firms reporting SIC codes classified under the chemical production industry may
produce a variety of products that should not be regarded as belonging to one single market.
Therefore, although the numbers presented in Table 2-5 indicate the presence of many firms
and a low degree of market concentration, producers of certain specialty chemicals are likely
to have a higher degree of market power in “niche markets” than the data suggest. However,
it is expected that the majority of chemical production does not belong to such niche
markets, and that the chemical production industry can generally be classified as competitive
with respect to total number of producers and market concentration.
The chemical industry is undergoing a trend of mergers, acquisitions, and general
industry consolidation. According to an analysis by Speed (1999), “the market will
[comprise] fewer but larger companies, global in scope, and more focused in their business
pursuits.”
2.3.1.4 Market Structure
Barriers to entry are the mechanisms through which the total number of firms in an
industry can be kept small and a high degree of market concentration can exist. Where
barriers to entry are present, new firms find it impossible or unprofitable to enter the market.
Barriers to entry therefore create market power for the firms that already operate in the
market. Typically, barriers to entry exist when industries are capital intensive, are

DRAFT
2 Some portions of the Technical Support Document (TSD) report that 118 facilities in SIC code 28 returned
surveys. However, the report shows assigned model plant numbers for only 117 facilities in this SIC code.
(One facility, numbered 30-Q, was listed in the TSD but is nonexistent in the database compiled from ICR
survey responses. The TSD failed to report a model number for plant 32-E, which was in the database.
Facility 30-Q was excluded from analysis and 32-E was included.
2-11
characterized by significant economies of scale, require specialized knowledge (e.g.,
patents), or are subject to government regulation (Speed, 1999).
2.3.2 Facilities
Table 2-6 presents an overview of the total number of facilities for each OLD SIC
code, the total number of firms potentially affected by the OLD source category, and the
percentage of the source category potentially affected.
Although EPA received surveys from only about 32 percent (117 out of 370)2 of the
universe of organic liquids distributors in the chemical industry, an examination of the data
provided in the surveys does illustrate general characteristics of those facilities. The figures
and tables in this section include four facilities classified in SIC codes 30, 38, and 39 in
addition to the 117 facilities classified as part of the chemical industry. Facilities in SIC
Table 2-5. Concentration Ratios by SIC Code
SIC Code Year
Total
Number of
Firms
Concentration R atio Herfindahl-
Hirschman
Index4 Firm 8 Firm 20 Firm 50 Firm
Chemical Production
2821: Plastics Materials, Synthetic Resins, and Nonvulcanizable Elastomers
1987 288 20% 33% 61% 89% 248
1992 240 24% 39% 63% 90% 284
2865: Cyclic Organic Crudes and Intermediates, Organic Dyes and Pigments
1987 131 34% 50% 77% 96% 542
1992 150 31% 45% 72% 94% 428
2869: Industrial Organic Chemicals, NEC
1987 491 31% 48% 68% 86% 376
1992 489 29% 43% 67% 86% 336
Source: U.S. Department of Commerce, Bureau of the Census. Economic Census, 1992.

DRAFT
2-12
Table 2-6. Number of Total OLD Facilities and Affected Facilities, 1997
SIC
Code SIC Description
Total Number
of Facilitiesa
Total Number
of Affected
Facilitiesb
% of Source
Category that
is Affected
Chemical Production
2821 Plastics Materials, Synthetic and
Resins, and Nonvulcanizable
Elastomers
532
370 25.4%2865 Cyclic Organic Crudes and
Intermediates, and Organic Dyes
and Pigments
184
2869 Industrial Organic Chemicals,
NEC
738
a U.S. Census Bureau. August 1999. “Cyclic Crude and Intermediate Manufacturing.” 1997 Economic
Census, Manufacturing—Industry Series, E97M-3251I, Washington, DC: Government Printing Office.b U.S. Environmental Protection Agency. 2000. Technical Support Document for the Organic Liquids
Distribution (nongasoline) Industry. Washington, DC: U.S. Environmental Protection Agency, Office of Air
Quality Planning and Standards.
Sources: U.S. Census Bureau. August 1999. “Plastics Material and Resin Manufacturing.” 1997 Economic
Census, Manufacturing—Industry Series, E97M -3251I, Washington, DC: Government Printing
Office.
U.S. Census Bureau. August 1999. “All Other Basic Organic Chemical Manufacturing.” 1997
Economic Census, Manufacturing—Industry Series, E97M -3251I, Washington, DC: Government
Printing Office.
U.S. Census Bureau. August 1999. “Synthetic Organic Dye and Pigment Manufacturing.” 1997
Economic Census, Manufacturing—Industry Series, E97M -3251I, Washington, DC: Government
Printing Office.
U.S. Census Bureau. August 1999. “All Other Basic Inorganic Chemical Manufacturing.” 1997
Economic Census, Manufacturing—Industry Series, E97M -3251I, Washington, DC: Government
Printing Office.
U.S. Census Bureau. August 1999. “Ethyl Alcohol Manufacturing.” 1997 Economic Census,
Manufacturing—Industry Series, E97M-3251I, Washington, DC: Government Printing Office.
U.S. Census Bureau. August 1999. “Industrial Gas Manufacturing.” 1997 Economic Census,
Manufacturing—Industry Series, E97M-3251I, Washington, DC: Government Printing Office.
U.S. Census Bureau. August 1999. “Petrochemical Manufacturing.” 1997 Economic Census,
Manufacturing—Industry Series, E97M-3251I, Washington, DC: Government Printing Office.

DRAFT
2-13
codes 30, 38, and 39 use synthetic organic chemicals and petrochemicals as an input into
their production of various plastic parts and products. The data presented here are for the
105 facilities (out of 121) who did not request that their surveys be considered classified
information.
2.3.2.1 Location
Figure 2-1 shows the distribution of 105 organic chemical liquids distribution
facilities across 26 states. Twenty-nine percent of organic chemical liquids distribution
facilities are located in Texas, 9 percent are located in Louisiana, and 8 percent are located in
Ohio.
2.3.2.2 Production Capacity and Utilization
Table 2-7 shows that, in 1998, facilities classified under SIC codes 2821, 2865, and
2869 were using a fairly high percentage of their plant capacity, with some potential for
increasing their production. The OLD NESHAP is specifically concerned with the
distribution of chemicals, rather than their production. However, a facility’s ability to store
and transfer chemicals is considered in the calculation of plant capacity, so the data below
provide some indication of storage and transfer capacity.
2.3.2.3 Employment
Figure 2-2 shows almost all organic chemical liquids distribution facilities employ
more than 50 people and that more than 35 percent of those facilities employ at least
500 hundred employees each.
2.3.3 Firm Characteristics
Although facilities are the physical unit regulated by the OLD source category, this
regulation may also affect the firms that own the facilities. Firms are legal business entities
that have the capacity to conduct business transactions and make business decisions that
affect the facility. In this analysis, the terms firm and company are used synonymously.
2.3.3.1 Ownership
The legal form of ownership may affect the cost of capital, the availability of capital,
and the effective tax rate faced by the firm. Firms are generally organized as corporations,

DRAFT
2-14
Figure 2-1. Distribution of Organic Chemical Liquids Facilities

DRAFT
2-15
sole proprietorships, or partnerships. Each type has its own legal and financial
characteristics that may influence how firms are affected by regulating the OLD source
category.
Table 2-7. Capacity Utilization Rates by Industry
SIC Code SIC Description
Capacity Utilization Rate
in 1998
2821 Plastics Materials and Resins 81%
2865 Cyclic Crudes and Intermediates 80%
2869 Industrial Organic Chemicals, Not Elsewhere
Classified
80%
Source: U.S. Census Bureau. 2000. “Survey of Plant Capacity: 1998.” Current Industrial Reports. MQ-
C1(98). Washington, DC: Government Printing Office.
Figure 2-2. The Distribution of Organic Chemical Liquids Facilities by Employment
Source: Nonclassified responses to the 1998 Industry Specific Information Collection Request for the
Development of an Organic Liquids Distribution Maximum Achievable Control Technology.

DRAFT
2-16
Table 2-8 presents the legal form of ownership for the SIC codes associated with the
OLD source category. The OLD source category is heavily dominated by firms organized as
corporations. For example, 449 of 491 SIC 2869, Industrial Inorganic Chemicals, NEC, (or
91.4 percent) were classified as corporations in 1987. (DOE, EIA, 1999; Speed, 1999).
2.3.3.2 Size Distribution
Firm size is important when analyzing the distribution of the regulation’s financial
impacts. Analysis of likely impacts on small entities is required under the Small Business
Regulatory Flexibility Enforcement Act (SBREFA) and requires the categorization of firms
as either small or large. The Small Business Administration (SBA) publishes general size
standard definitions for small entities by SIC code. The size standards are defined either by
employment or by annual firm revenue, depending on the SIC code.
Table 2-9 presents the SBA small business standards for the chemical industries most
likely to be affected by the OLD NESHAP and also shows the number of small firms in the
source category. The SBA size definitions for all chemical industries is defined in terms of
number of employees. The size standard for these SIC categories ranges from 750 to 1,000
employees. Based on the SBA’s Statistics of U.S. Businesses, the number of small firms can
only be estimated. For most of the SIC groups of interest, the size categories provided do not
correspond to the SBA definition. Data are available for firms with fewer than 100
employees, between 0 and 499 employees, more than 500 employees, and more than 2,500
Table 2-8. Firms’ Legal Form of Organization for OLD Industries, 1987
SIC Code Corporations
Sole
Proprietorship Partnerships
Other and
Unknown Total
Chemical Production
2821 259 9 9 11 288
2865 125 2 1 3 131
2869 449 4 19 19 491
Sources: U.S. Department of Commerce. Year?. 1987 Census of Manufacturers, Subject Series.

DRAFT
3The SBA data do not rank firms by revenue.
2-17
employees.3
Thus, Table 2-9 presents two estimates—the number of definitely small firms and the
number of potentially small firms. For all SIC groups with SBA definitions of 750 or more,
the definitely small estimate is of firms with fewer than 500 employees. The potentially
small firm estimate includes the difference between those firms with 2,500+ employees and
500+ employees. Thus, the two estimates bracket the actual number of small firms. Note
that between 70 and 85 percent of chemical production firms are shown to be small
according to these statistics.
Although the above paragraphs present a general impression of the relative number of
small firms involved in the distribution of organic liquids, only a percentage of firms in each
of the three industries listed in Table 2-9 are actually going to be affected by the OLD
NESHAP. An examination of the data from the EPA survey of facilities in OLD source
categories shows that facilities affected by the NESHAP rule are much less likely to be
Table 2-9. Small Business Size Standards for OLD Industries
SIC
Code SIC Description
SBA Small
Business
Standard
Total
Firmsa
Number of
Definitely
Small Firms
(percent of
total)a,b
Number of
Potentia lly
Small Firms
(percent of
total)a,c
Chemical Production
2821 Plastics Materials, Synthetic
and Resins, and
Nonvulcanizable Elastomers
750 employees 403 309 344
76.67% 85.36%
2865 Cyclic Organic Crudes and
Intermediates, and O rganic
Dyes and Pigments
750 employees 152 107 128
70.39% 84.21%
2869 Industrial Organic Chemicals,
NEC
1,000 employees 444 316 356
71.17% 80.18%
a Source: Statistics of U.S. Businesses, 1996b Includes firms with fewer than 500 employees, except for SICs 5169 and 5171, where entry includes firms
with fewer than 100 employees.c Includes firms with fewer than 2,500 employees.

DRAFT
2-18
owned by small firms than is suggested by data from the Statistics of U.S. Businesses. Less
than 4 percent of surveyed firms are small businesses, compared to a 70 to 85 percent of all
firms in the affected source categories.
As previously stated, only 121 facilities out of an estimated 370 that handle organic
chemical liquids responded to the ICR survey. Those facilities are owned by 31 different
firms. Only one of those 31 firms is small according to the SBA small business standards.
That one small firm owns two facilities that distribute organic liquids. If the 121 facilities
are an accurate sample of the actual facilities, we can conclude that only about 1.7 percent of
all affected facilities are owned by small businesses. However, this could be an inaccurate
conclusion if a large percentage of nonresponding affected facilities are owned by small
firms.
Figures 2-3 and 2-4 show the distribution of surveyed firms by firm size as measured
by revenue and employment; respectively. The majority of affected firms took in more than
$1 billion in revenues in 1998 and employed more than 10,000 people.
2.3.3.3 Vertical and Horizontal Integration
Vertical and horizontal integration are important determinants in analyzing a firm’s
potential for impacts. Both measures are concerned with the types of industries in which a
firm operates. Vertical integration refers to the degree to which a firm operates facilities that
are part of the same supply chain. For example, if the same firm owns facilities in the
petroleum production, refining, and transportation industries, it would be considered
vertically integrated. Vertical integration is potentially important in analyzing firm-level
impacts because a regulation could affect a vertically integrated firm at more than one level.
Horizontal integration refers to the scale of production in a single-product firm or its scope in
a multiproduct one. A single-product firm is considered horizontally integrated if it owns
more than one facility producing the same product, which may be an advantage to the firm’s
ability to absorb costs if not all of the facilities are subject to the regulation and if the firm
can shift parts of the production to the unregulated facilities. A multiproduct firm is
considered horizontally integrated if it owns facilities in several unrelated industries. Here,
horizontal integration may improve a firm’s ability to absorb compliance costs if only one or
a few of the industries in which the firm operates are directly affected by the regulation.

DRAFT
2-19
According to industry sources, the degree of horizontal integration in the chemical
industry varies among different companies—while some companies (including Exxon, BP,
and Shell) have chosen to focus solely on basic chemicals, others (including ICI, Clariant,
and Ciba) are focusing on chemical specialties. A third group (including Dow) have sought
to balance their portfolios between cyclical commodities and less cyclical differentiated and
specialty businesses (Speed, 1999; Gale Business Resources, 1999).
2.3.3.4 Financial Condition
The 31 firms that are known to own chemical facilities that will be affected by the
OLD NESHAP have an average (median) profit margin of 5.4 (5.3) percent. Table 2-10
Figure 2-3. The Size Distribution of Companies that own OLD Facilities involved inChemical Distribution, by 1998 Sales (in $1997)
Sources: Dun & Bradstreet. 1999. Company Capsules. As available on EBSCO.
General Business File International (formerly Business ASAP). 1999. Gale Group Collections. As
obtained from InfoTrac Web.
Hoover’s Incorporated. 1999. Hoover’s Company Profiles. Austin, TX: Hoover’s Incorporated.
<http://www.hoovers.com/>.
Company W ebsites.
Company 10k Reports.
U.S. Environmental Protection Agency. 2000. “Technical Support Document for the Organic
Liquids Distribution (non-gasoline) Industry.” W ashington, DC: USEPA, Office of Air Quality
Planning and Standards.

DRAFT
2-20
shows the average, median, minimum, and maximum profit margins of these 31 firms.
Table 2-10. Profit Margins of Firms that own Organic Chemical Liquids DistributionFacilities
Median 0.054088
Average 0.052776
Maximum –0.04093
Minimum 0.11828
Source: Nonclassified responses to the 1998 Industry Specific Information Collection Request for the
Development of an Organic Liquids Distribution M aximum Achievable Control Technology.
Figure 2-4. Size Distribution of Companies that own OLD Facilities involved inChemical Distribution
Sources: Dun & Bradstreet. 1999. Company Capsules. As available on EBSCO.
General Business File International (formerly Business ASAP). 1999. Gale Group Collections. As
obtained from InfoTrac Web.
Hoover’s Incorporated. 1999. Hoover’s Company Profiles. Austin, TX: Hoover’s Incorporated.
<http://www.hoovers.com/>.
Company W ebsites.
Company 10k Reports.
U.S. Environmental Protection Agency. 2000. “Technical Support Document for the Organic
Liquids Distribution (non-gasoline) Industry.” W ashington, DC: USEPA, Office of Air Quality
Planning and Standards.

DRAFT
2-21
Figure 2-5 shows the distribution of profit margins among the firms.
Table 2-11 provides a more general view of the financial condition of firms in the
chemical industry. The table shows various measures of the financial condition of the
organic liquid distribution source category between 1996 and 1998. Each indicator is
discussed briefly below.
C Return on sales is an indicator of a firm’s ability to withstand adverse conditionssuch as falling prices, rising costs, and declining sales. It is calculated bydividing net profit after taxes by annual net sales.
C Return on assets is a key indicator of profitability that compares operatingprofits with the assets available to earn a return. It is calculated by dividing a
Figure 2-5. Distribution of Firms by Profit Margin
Sources: Dun & Bradstreet. 1999. Company Capsules. As available on EBSCO.
General Business File International (formerly Business ASAP). 1999. Gale Group Collections. As
obtained from InfoTrac Web.
Hoover’s Incorporated. 1999. Hoover’s Company Profiles. Austin, TX: Hoover’s Incorporated.
<http://www.hoovers.com/>.
Company W ebsites.
Company 10k Reports.
U.S. Environmental Protection Agency. 2000. Technical Support Document for the Organic Liquids
Distribution (Non-gasoline) Industry. Washington, DC: USEPA, Office of Air Quality Planning and
Standards.
Dun & B radstreet. 1997. Industry Norms & Key Business Ratios. Desk-Top Edition 1996–1997.

DRAFT
2-22
firm’s net profit after taxes by its total assets. According to Dun & Bradstreet, companiesthat use their assets efficiently will have a relatively higher return on assets than firms that donot use their assets efficiently.
C Return on equity is used to analyze the firm’s ability to realize an adequatereturn on the capital invested by the firm’s owners. It is calculated by dividingnet profit after taxes by net worth. According to Dun & Bradstreet, this ratio isused increasingly as a “final criterion” of profitability, and a relationship of atleast 10 percent is regarded as desirable for providing dividends plus funds forfuture growth.
C The current ratio is a measure of liquidity that gauges a company’s ability tocover its short-term liabilities. It is calculated by dividing a firm’s current assetsby its current liabilities. The standard guideline for financial health is a ratio oftwo or higher.
C The quick ratio also indicates a company’s ability to cover short-term liabilities. It is a variant of the current ratio, which does not include inventories, advances oninventories, marketable securities, or notes receivables. The quick ratio measuresthe protection afforded creditors in cash or near-cash assets. Any time this ratio isone or greater, the firm is said to be in a liquid condition.
Table 2-11. Financial Condition of Firms in the Chemical Industry
Indicator
SIC 28 SIC 2821 SIC 2865 SIC 2869
1998 1998 1997 1996 1998 1997 1996 1998 1997 1996
Value Value Value Value
Return on sales 4.4 4.1 4.8 4.9 3.7 2.7 4.6 4.6 7.2 6.4
Return on assets 6.7 7.7 7.9 9.1 4.8 8.5 8.4 8.4 8.1 9.1
Return on equity 14.3 16.4 15.5 21.2 21.4 26.1 16.7 16.7 19.4 18.0
Current ratio 2.2 2.0 2.0 1.8 1.9 2.4 2.1 2.1 1.7 1.7
Quick ratio 1.2 1.1 1.2 1.0 0.9 1.3 1.2 1.2 0.9 0.9
Number of
establishments
in sample
1,381 97 130 144 23 27 29 29 79 93
Source: U.S. Environmental Protection Agency. July 1995. Economic Impact Analysis for the Petroleum
Refinery NESHAP, Revised Draft for Promulgation.
DRAFT
2-23
2.4 Uses and Consumers
As with petroleum liquids, the demand for organic chemicals depends primarily on
their end use. Organic chemicals, particularly petrochemicals, play an important role in
society. Petrochemicals are usually an intermediate product that is converted into a variety
of consumer and industrial products. Some of the end products include plastics, antifreeze,
synthetic fibers, rubber, solvents, and detergents. Higher demand for these products
translates into higher demand for their inputs (EPA, 1995). This section lists the major
consumers of organic chemicals, the purposes of chemical consumption, and the factors
affecting the elasticity of demand for chemicals.
2.4.1 Major Consumers
Nearly everyone is a consumer of chemicals in some way. Chemicals are used as
inputs into the majority of manufacturing industries both domestically and internationally.
As with petroleum products, the markets for end-use products drive the demand for
individual chemicals. The major industrial consumers of chemicals in the United States are
C housing,
C motor vehicles,
C crops,
C tires,
C paper products,
C plastic products,
C textile mill products,
C apparel,
C furniture and fixtures,
C aluminum,
C basic steel and mill products, and
C household appliances (Oil & Gas Journal, 1999).

DRAFT
2-24
2.4.2 Purpose of Consumption
Two of the larger markets that drive demand for both petrochemicals and synthetic
chemicals are the housing and automotive industries. The housing industry consumes
chemicals as inputs to virtually all housing materials, including plastics used to make pipe,
siding, window sills and frames, roofing, carpeting, insulation, and sealants. The average
house completed in the United States contains chemical building products valued at $12,925,
approximately 7 percent of the cost of building a house (U.S. Department of Commerce,
1996). In addition to the house itself, the purchase of a home leads to purchases of
appliances, furniture, wallcoverings, and many other items that also have a heavy chemical
content. With 1.48 million houses started in 1997, the housing market generated $19.1
billion in chemical sales (CMA, Nov. 1995).
The automotive industry is an another important customer for the chemical industry.
This is especially true for the industrial chemicals segment, because every light vehicle
produced in the United States contains approximately $2,160 of chemical products and
chemical processing. Included, for example, are antifreeze and other fluids, plastic
dashboards, rubber tires and hoses, paint, and adhesives. With 15.0 million light vehicles
sold in 1997, this important market represents $32 billion in chemical sales (CMA, Sept.
1995).
2.4.3 Characterization of Demand—Derived Demand Elasticity
As with petroleum products, the price elasticity of demand for chemicals depends on
the availability of substitutes, either substitute products for the same use or alternative
production processes that do not need this chemical. There are 65 HAPs covered; since the
availability of substitutes varies among these chemicals, so will their demand elasticities.
2.5 Markets
Many business analysts view the chemical manufacturing industry as a mature, slow-
growth, and conservative industry. In 1998, the chemical industry continued its current
pattern of restructuring. Mergers of big chemical producers were announced or completed,
new joint ventures were created, companies continued to trim or expand their portfolios, and
traditional chemical companies strived to redirect their operations in new directions. These
signs all point to a chemical industry that is experiencing a slump worldwide. The spreading
financial crisis in Asia only worsened the condition for the chemical industry. Production of
chemicals throughout the world generally fell from their 1997 levels. Foreign markets

DRAFT
2-25
tightened, leading to diminished chemical trade surpluses in many countries, including the
United States growth of domestic demand for chemicals also slowed in many countries. As a
consequence, sales, profits, and profitability declined for many chemical producers
(Chemical & Engineering News, 1999).
A recent study conducted by the Chemical Manufacturers Association (CMA)
showed that U.S. shipments of chemicals and allied products for 1998 had increased by only
0.6 percent compared to the previous year. Domestic demand was the main driver of this
increase as exports declined 2.0 percent, the result of the Asia crisis and the high U.S. dollar.
Shipments of industrial chemicals, however, fell by 6.9 percent. Imports rose 8.5 percent,
which led to a reduction in the trade surplus from $19.1 billion (1997) to $13.4 billion
(1998). Deficits occurred in organic chemicals, pharmaceuticals, and inorganic chemicals.
The CMA expects the overall condition of the U.S. economy to remained favorable
through the first half of 2000. The financial crisis in Asia has come to an end, and exports
rebounded through June 2000. With continued expansion of the U.S. economy, overall
growth in chemical and allied products production volume is expected to be 1.3 percent
during 1999 (CMA, 1999; CMA, 2000).
2.5.1 Market Volumes
2.5.1.1 Domestic Production
The Annual Survey of Manufactures provides production information for the
chemical industry, expressed in terms of value of shipments. Table 2-12 shows the constant
dollar value of shipments for 1989 through 1996 and a per-establishment value of shipments
estimate. As shown, the value of shipments for all three SIC codes associated with OLD
chemical manufacturers has declined for this period, with SIC 2865 showing the greatest
decline. SIC 2869 has both the highest value of shipments and the greatest number of
establishments. It also, for the most part, generates the highest value of shipments per
establishment.

DRAFT
2-26
According to trade journals, however, production in the overall chemical industry has
increased in the past few years. Production in the overall chemical industry rose 4 percent in
1997, and 3 percent in 1996, according to the Federal Reserve Board’s index of production
for chemicals and allied products. Eleven of 13 chemical categories posted production gains,
according Federal Reserve figures. Production levels for the industrial organic chemicals
group increased 6 percent in 1997 (CMA, 1998). During 1998, however, the chemical
industry posted only a modest gain of 1 percent. In 1998, only seven of the 13 chemical
Table 2-12. Value of Shipments, 1989–1996 ($1997 103)
Year
2821
(Average per
Establishm ent)
2865
(Average per
Establishm ent)
2869
(Average per
Establishm ent)
Establishm ents 449 206 705
1989$41,663,543 $13,545,127 $68,292,396
$92,792 $65,753 $96,869
1990$37,617,734 $13,080,430 $65,038,291
$83,781 $63,497 $92,253
1991$34,147,102 $12,302,326 $61,292,533
$76,051 $59,720 $86,940
1992$35,185,584 $10,759,827 $60,981,721
$78,364 $52,232 $86,499
1993$34,545,260 $11,144,727 $58,438,582
$76,938 $54,101 $82,892
1994$39,899,914 $11,927,513 $62,091,775
$88,864 $57,901 $88,073
1995$45,402,987 $12,953,745 $66,028,846
$101,120 $62,882 $93,658
1996$40,893,978 $12,364,816 $63,986,002
$91,077 $60,023 $90,760
Percentage Change
1989–1996
–1.85% –8.71% –6.31%
Source: U.S. Department of Commerce, B ureau of the Census. Annual Survey of Manufactures. Washington,
DC: Government Printing Office.

DRAFT
2-27
groups posted production gains, and five groups showed a decline in production. A 1 percent
decline in production occurred in the industrial organic chemical group (DOE, EIA, 1999;
Chemical & Engineering News, 1998).
2.5.1.2 Domestic Consumption
Domestic consumption of chemicals appears to have fluctuated greatly from
1990–1996. Table 2-13 shows the variations in consumption.
2.5.1.3 International Trade
The chemical industry was the third largest export sector in the United States in 1998.
Only the machinery and transport equipment and miscellaneous manufacturers sectors
accounted for larger exports. Chemical exports fell for the first time in years in 1998,
Table 2-13. Apparent Domestic Consumption, 1990–1996 ($1997 103)
Year
2821
(Average per
Establishm ent)
2865
(Average per
Establishm ent)
2869
(Average per
Establishm ent)
1990 $4,969,288 $463,508 $4,128,328
1991 $6,325,065 $438,219 $4,344,540
1992 na na na
1993 na na na
1994 $5,838,556 $2,986,261 $716,683
1995 $657,905 $3,864,625 $1,168,075
1996 $6,773,578 $2,736,519 $160,646
Percentage Change
1990–1996
36.00% 490.00% –96.00%
na = not available at this time
Note: Apparent Domestic Consumption = U.S. Value of Shipments – Value of Domestic Exports + Value of
U.S. Imports for Consumption. Trade values adjusted using the PPI for the respective industry.
Sources: U.S. Department of Commerce, B ureau of the Census. Annual Survey of Manufactures. Washington,
DC: Government Printing Office.
U.S. International Trade Commission, Dataweb database. www.dataweb.usitc.gov
U.S. Bureau of Labor Statistics, Producer Price Index – Current Series, Series Ids: PCU2869#,
PCU2869#, PCU2821#. Data downloaded from www.bls.gov

DRAFT
2-28
dropping 2 percent from $70.8 billion in 1997 to $69.3 billion in 1998. At the same time,
chemical imports increased by 9 percent between 1997 and 1998, rising from $50.3 billion to
$54.6 billion. The increase in imports and decrease in exports has lowered the chemical
industry’s trade surplus by 28 percent from 1997. The surplus decreased from $20.5 billion
in 1997 to $14.7 billion in 1998 (Chemical & Engineering News, 1999). Table 2-14 presents
the value of imports and exports between 1989 and 1996 for the specific segments of the
chemical industry most affected by the OLD NESHAP.
2.5.2 Market Prices
Market prices for the chemical and allied products category were up only 0.3 percent
in 1998. However, prices for the important industrial chemicals category, which accounts
for more than 45 percent of chemicals and allied products shipments, declined by almost 4
percent from 1997 (Chemical & Engineering News, 1999). Table 2-15 presents the producer
price index (PPI) for the three SIC codes comprising the OLD chemical manufacturing
industry. The table shows that producer price levels have fluctuated over the 10-year period
but have increased compared to their 1988 levels.
Table 2-14. Value of Imports and Exports, 1989–1996 ($1997 106)
2821 2865, 2869a
Year Imports Exports Imports Exports
1989 $1,623 $5,767 $7,750 $13,198
1990 $1,998 $6,910 $8,565 $13,369
1991 $1,981 $8,240 $8,748 $13,453
1992 $2,408 $8,182 $9,720 $13,528
1993 $2,929 $8,353 $10,157 $14,479
1994 $3,666 $9,418 $11,763 $16,833
1995 $3,953 $10,005 $11,118 $16,433
1996 $4,296 $10,891 $11,555 $14,220
a Dollar values normalized using the producer price index (PPI) from the BLS for associated SIC codes. The
PPI for SIC 2869 was used to normalize the trade category combining 2865 and 2869.
Source: U.S. Department of Commerce: International Trade Administration, Trends T ables.

DRAFT
2-29
As noted in previously in this section, organic liquids distributors handle a large
number of chemicals. Table 2-16 lists the prices of 59 of the chemicals handled by facilities
that responded to the 1998 EPA survey.
2.5.3 Future Projections
Constant-dollar shipments of organic chemicals are forecasted to increase at about
1.4 percent annually through 2002. This low growth rate is expected to result from slowing
U.S. domestic markets and competition from foreign producers. Competition in the chemical
industry is not only increasing in foreign markets, but in domestic markets as well. While
imports have grown consistently since 1989 (and now account for 17 percent of demand),
Table 2-15. Producer Price Index (PPI), 1988–1997
Year
2821
Plastic Resins and
Materials
2865
Industrial Organic
Materials:
Intermediates
2869
Basic Organic
Chemicals
1988 132.4 114.5 108.2
1989 133.4 123.9 116.2
1990 124.1 122.8 112.9
1991 120.0 120.5 110.6
1992 116.4 111.0 108.1
1993 117.1 107.5 110.0
1994 122.4 121.2 114.5
1995 143.5 155.9 130.9
1996 133.1 132.2 127.9
1997 137.3 123.2 128.4
Percentage Change
1988–19973.70% 7.60% 18.67%
Source: Bureau of Labor Statistics

DRAFT
2-30
Table 2-16. Current Market Prices of Common Organic Chemicals
Organic Chemica l Liquid Price per Pound ($) Price per Gallon ($)
1,1,1 Trichloroethane 1.015
1,2 Ethylene Dichloride 0.17
Acetaldehyde 0.455
Acetone 0.165
Acetonitrile 0.65
Acrylic Acid 0.87
Acrylonitrile 0.53
Aniline 0.495
Carbon Tetrachloride 0.3825
Chlorine 0.1275
Creosote 0.925
Cresylic Acid 0.575
Cumene 0.2025
Diethanolamine 0.7225
Dispersions-Dibutyl Phthalate 0.78
Epoxy/Ester Blend 1.58
Ethanol 1.225
Ethyl acrylate 0.8
Ethylbenzene 0.2545
Ethyl chloride 0.3375
Ethylene Dibromide 0.76
Ethylene Dichloride 0.17
Ethylene Glycol 0.29
Ethylene Oxide 0.49
Formaldehyde Solution 0.125
Gama-Butyrolactone 1.925
Heptane 0.815
Hexane 1.04
Hydrazine 1.57
Hydrochloric Acid 0.036
Hydrogen Fluoride 1.83
Isophorone 0.85
(continued)

DRAFT
2-31
export prospects have been less positive. The United States is expected to remain a net
exporter but the country’s trade surplus is expected to continue to decline. Nevertheless,
U.S. producers of petrochemicals and other organics should continue to benefit from low raw
material and utility costs and productivity advantages (U.S. Industry and Trade Outlook,
1998).
Table 2-16. Current Market Prices of Common Organic Chemicals (continued)
Organic Chemica l Liquid Price per Pound ($) Price per Gallon ($)
Methyl Alcohol 0.47
Methyl Ethyl Ketone 0.46
Methyl Formate 0.4117
Methyl isobutyl ketone 0.65
Methyl methacrylate 0.65
Methyl tert butyl ether 0.975
Methylcyclohexane 1.1
Methylene Chloride 0.425
Monochlorobenzene 0.55
Naphtha 0.835
n-Hexane 1.04
Normal Heptane 0.815
o-Cresol 0.735
m-Cresol 0.125
Perchloroethylene/Tetrachloroethylene 0.335
Phenol 0.38
Polyester 0.7425
Source: Chemical Market Reporter. May 22, 2000. Chemical Prices. Pages 34–43. Schnell Publishing.

DRAFT
3-1
SECTION 3
PETROLEUM LIQUIDS
Petroleum liquids are made up of a number of different liquids:
C Crude Oil. Crude oil is a mixture of hydrocarbons that exists in liquid phase inunderground reservoirs and remains liquid at atmospheric pressure after passingthrough surface-separating facilities. Refineries turn crude oil into a myriad ofrefined petroleum products.
C Natural Gas Liquids (NGLs). Natural gas is a mixture of hydrocarboncompounds existing in the gaseous state or in solution with oil in naturalunderground reservoirs. Through a process of condensation, NGL are separatedfrom the “wet” natural gas, producing “dry” natural gas which is ready forconsumption.
C Nongasoline Refined Products. Refinery products fall into three majorcategories—motor gasoline (about 46 percent of production); fuels and liquefiedpetroleum gases (about 45 percent of production); and other products, such asasphalt, lubricants, and petrochemical feedstocks (about 9 percent of production)(DOE, EIA, 1999). Table 3-1 shows the distribution of petroleum productsproduced at U.S. refineries in 1997.
3.1 Petroleum OLD Background
Since gasoline is already covered by the gasoline distribution NESHAP, this profile
discusses the two major categories of nongasoline refined products—fuels and liquified
petroleum gases (LPGs). The main fuel products included in the OLD source category are
distillate fuel oil, kerosene-type jet fuel, and residual fuel oil. Distillate fuel oil includes
diesel oil, heating oils, and industrial oils. It is used to power diesel engines in buses, trucks,
trains, automobiles, and other machinery. In addition, it is used to heat residential and
commercial buildings and to fire industrial and electric utility boilers. Kerosene-type jet fuel
is primarily used in commercial airlines. Sometimes it is blended into heating oil and diesel
fuel during periods of extreme cold weather. Residual fuel is used by electric utilities to

DRAFT
3-2
generate electricity. It is also used as fuel for ships, industrial boiler fuel, and heating fuel in
some commercial buildings (DOE, EIA, 1999).
While most LPGs are used as feedstocks for petrochemical production processes,
individual LPG products also have distinct uses. Ethane is used primarily as a petrochemical
feedstock. Butane is used as a gasoline blending component and for many domestic and
industrial uses (DOE, EIA, 1999).
3.1.1 SIC and NAICS Codes and Description of Service Providers
C Crude Oil. The parts of the crude oil distribution channels that are relevant forthe OLD source category are storage in crude oil pipeline stations, distribution toindependent liquid terminals (including liquid terminals and petroleum terminals),and distribution of crude oil into the refineries. As shown in Table 3-2, pipelinesare the most heavily used mode of transportation to deliver crude oil to refineriesfrom domestic sources. Occasionally, trucks are used to transport crude oil fromremote field storage sites. Railroads carry only a small amount of petroleum,generally products rather than crude. The most common mode of transportingimported crude oil into refineries is by tanker. Because the unloading of tankersat domestic refineries is already covered under the marine vessels MACT, it is not
Table 3-1. Petroleum Products Produced at U.S. Refineries, 1997
Petroleum Product Percent Produced
Motor gasoline 45.7%
Distillate fuel oil 22.5%
Jet fuel 10.3%
Residual fuel oil 4.7%
Still gas 4.4%
Petroleum coke 4.6%
Liquefied petroleum gases 4.6%
Asphalt and road oil 3.2%
Petrochemical feedstocks 2.9%
Lubricants 1.2%
Other 1.4%
Source: EIA, Petroleum: An Energy Profile, 1999, Figure 5-2.

DRAFT
3-3
subject to the OLD regulation.
C NGLs. Refineries can receive NGLs directly from the production field. or fromgas processing plants. NGLs obtained from the production field are transporteddirectly with the crude oil in the same pipelines. NGLs received from gasprocessing plants are transported by several different modes.
C Nongasoline Refined Products. Nongasoline refined products can betransported in several ways. Petroleum product pipelines are often used totransport refined products from refineries to storage facilities. Trucks are mainlyused to deliver products from bulk storage to retail outlets or final consumers. Railroads carry only a small amount of petroleum, generally products.
Table 3-3 lists the SIC codes that fall under this description as well as corresponding NAICS
codes.
3.1.2 Affected Markets
Three types of petroleum liquids are covered by the OLD source category—crude oil,
NGLs, and refined petroleum products. Since crude oil and NGLs are the primary inputs
into the production of refined petroleum products, the discussion in this section focuses on
the consumers of, demand for, and price elasticities of the refined petroleum products (DOE,
Table 3-2. U.S. Refinery Receipts of Crude Oil by Method of Transportation andSource, 1998
Transport Method/Source
Receipts (103 Barrels)
Domestic Foreign
Pipeline 1,788,758 941,907
Tanker 424,939 2,121,744
Barge 66,995 64,458
Tank Car 13,019 0
Trucks 67,192 0
Total 2,360,903 3,128,109
Source: EIA, Petro leum Supply Annual, 1988, Vol. 1, Table 46.

DRAFT
3-4
EIA, 1999).
Petroleum liquids are inputs to virtually every industry in the United States. Crude
oil becomes gasoline, diesel fuel, and jet fuel, which affects the transportation industry and
facilitates the distribution of manufactured goods and the transportation industry. Refineries
separate crude oil into petrochemical feedstocks that are used as inputs in the chemical
industry and eventually become plastic or synthetic rubber products, automobile lubricants or
antifreeze, cleaning compounds, or cosmetics. LPGs also become inputs into chemical
compounds or fuel for household or farm use.
3.2 Production/Service Overview
OLD distribution is a service that is part of the production process for petroleum
liquids.
Table 3-3. Principal OLD Facility Categories
SIC
Code SIC Description NAICS Code NAICS Description
Petroleum Refinery (56 survey responses)
2911 Petroleum Refining 32411 Petroleum Refineries
Liquid Terminal (32 survey responses)
4226 Special Warehousing and
Storage, NEC
49311
49319
General Warehousing and Storage
Other Warehousing and Storage
Crude Oil Pipeline Pumping/Breakout Station (24 survey responses)
4612 Crude Petroleum Pipelines 48611 Pipeline Transportation of Crude Oil
Petroleum Terminal (10 survey responses)
5169 Chemicals and Allied Products,
NEC
42269 Other Chemical and Allied Products
Wholesalers
5171 Petroleum Bulk Stations and
Terminals
42271
454311
454312
Petroleum Bulk Stations and Terminals
Heating Oil Dealersa
LP Gas Sold Via Retail Methoda
a Only part of this NAICS-coded industry consists of facilities that would also be classified in the
corresponding SIC code.
Source: U.S. Census Bureau, March 2000, “1987 SIC Matched to 1997 NAICS”
http://www.census.gov/epcd/naics/NSIC3B.HTM L. As obtained on March 13, 2000.

DRAFT
3-5
3.2.1 Service Overview
Organic liquids first enter the path of the OLD source category at the point of custody
transfer, shortly before the refinery stage. Pipelines carry crude oil and/or NGLs from
production fields into the refineries. Along the way, the liquids are channeled through crude
oil pipeline stations, which are used for surge capacity, sorting, measuring, rerouting, and
temporary storage of the transported liquid. Crude oil pipeline stations are the first point of
OLD regulation for petroleum liquids.
From the crude oil pipeline station, crude oil and NGLs are transported to a
petroleum refinery; crude oil can also be transported to an independent liquid terminal (either
a liquid terminal or a petroleum terminal). Petroleum refineries process crude oil and/or
NGLs into refined petroleum products (including gasoline, distillate fuel oil, residual fuel oil,
liquified petroleum gases, and petrochemicals).
After the refining process, the refined petroleum products might be distributed to one
of three destinations—refined petroleum products might be distributed to end users
belonging to different industries or they might be transported to an independent liquid
terminal for storage before further processing. Liquids stored at independent liquid terminals
might be transported to chemical production plants or refineries for further processing, they
might be sent to a blending/packaging/distribution facility, or they might be distributed to
end users.
3.2.2 Major By-Products and Co-Products, if Applicable
As discussed in Section 2, the U.S. Census Bureau calculates the specialization and
coverage ratios only for industries that are classified as manufacturers (establishments with
primary SIC codes between 20 and 40). Therefore, no specialization and coverage ratios are
readily available for Liquid Terminal Facilities (SIC codes 4226—Special Warehousing and
Storage, NEC); Crude Oil Pipeline Stations (SIC code 4612—Crude Petroleum Pipelines); or
Petroleum Terminals (SIC codes 5169—Chemicals and Allied Products, NEC and
5171—Petroleum Bulk Stations and Terminals) (DOE, EIA, 1999).
Table 3-4 provides these ratios for petroleum refineries. The table shows a high
degree of specialization by petroleum refineries. From 1987 to 1997, 99 percent of
shipments from firms owning refineries were petroleum products. In 1997, 97 percent of all
petroleum products supplied domestically originated from firms classified as petroleum
refineries (DOE, EIA, 1999).

DRAFT
3-6
3.2.3 Costs of Production
Table 3-5 presents overall production costs for potentially affected OLD industries by
SIC code. The Census Bureau publishes production costs for manufacturing industries. No
data are available for the transportation industries (4226 and 4612). Only operating costs are
available for the wholesale industries (5169 and 5171). In contrast to the chemical sectors,
SIC 2911 (Petroleum Refinery) spends relatively less on capital, labor, electricity and fuel,
and relatively more on raw materials. In terms of production costs per facility, SIC 2911
(Petroleum Refinery) is approximately the same size as SICs 2821 and 2869.
3.2.4 Supply Elasticities
The price elasticity of supply, or own-price elasticity of supply, is a measure of the
responsiveness of producers to changes in the price of a product. The price elasticity of
supply indicates the percentage change in the quantity supplied of a product resulting from
each 1 percent change in the price of the product.
The EIA for the petroleum refinery NESHAP (1995) econometrically estimated the
price elasticity of supply for five petroleum products (motor gasoline, jet fuel, residual fuel
oil, distillate fuel oil, and LPGs). The price elasticity of supply for the five petroleum
products was estimated to be 1.24. Foreign supply is assumed to have the same price
elasticity of supply as domestic supply. A supply elasticity of 1.24 is considered elastic. The
Table 3-4. Specialization and Coverage Ratios for OLD Industries, 1982, 1987, and1992
SIC
CodeSIC Description 1987 1992 1997
Petroleum Refinery
2911 Petroleum refining
Primary products specialization ratio 99 99 99
Coverage ratio 100 99 97
Sources: U.S. Department of Commerce, Bureau of the Census. 1992. Economic Census.
U.S. Department of Commerce, B ureau of the Census. 1999 . 1997 Economic Census,
Manufacturing—Industry Series, “Petroleum Refining.” Report E97M-3241A. Washington, DC.

DRAFT
1Originally, wastewater and semi-aqueous waste were also believed to be sources of HAP emissions for the
OLD source category. However, responses to the OLD survey indicated that insufficient information is
availab le to determine nonzero MACT floors for wastewater. In addition, the survey indicated that semi-
aqueous waste generated from OLD operations is generally kept in closed containers once it is collected.
The handling of these wastes, at both chemical facilities and refineries, is already covered under the
Resource Conservation and Recovery Act (RCRA) (“MACT Floor Development for the OLD Source
Category,” Memo, May 5, 1999). Consequently, emission sources associated with wastewater and semi-
aqueous waste are excluded from this analysis.
3-7
percentage change in quantity exceeds the percentage change in price. In other words,
quantity supplied is relatively responsive to a change in price in percentage terms.
3.2.5 Emissions
As shown in Section 1, EPA estimates that 281 petroleum liquids distributors perform
activities that will be affected by the OLD NESHAP. Four emission sources have been
identified that account for the majority of HAPs emissions from OLD activities:1
• storage tanks;
Table 3-5. Annual Production Costs ($1997 103)a
Cost of Production 2911 (Percentage of Total)b
Capital expenditures $5,062,962
(3.60%)
Raw material costs $129,453,238
(92.16%)
Labor costs $2,240,193
(1.60%)
Electricity costs $1,290,729
(0.92%)
Fuel costs $2,418,863
(1.72%)
Total $140,465,985
Number of establishmentsc 232
Production cost per establishment $605,457
a Dollar values adjusted using the PPI for four-digit SIC codes from the B ureau of Labor Statistics.b Source: U.S. Department of Commerce. 1996 Annual Survey of Manufactures. Washington, DC.c Source: U.S. Department of Commerce. 1992 Census of Manufactures. Washington, DC.

DRAFT
3-8
• liquid transfer activities involving tank trucks and railcars (loading racks);
• container filling operations; and
• leaks from equipment components (e.g., pumps, valves).
3.3 Industry Organization
This section describes the organization of industries that distribute petroleum liquids,
including market structure, the characteristics of distribution facilities, and the firms that own
them.
3.3.1 Market Structure
Overall, the petroleum liquids distributors face a large degree of competition from
fellow distributors. This section describes the producers, product differentiation, market
concentration, and barriers to entry.
3.3.1.1 Producers
Suppliers in the petroleum industry can be divided into two principal types of firms:
• “Majors” are large companies that are typically fully integrated and operatefacilities in all of the different petroleum sectors (i.e., exploration, production,transportation, refining, and marketing);
• “Independents” are smaller, nonintegrated companies that generally specialize inone aspect, such as crude oil exploration and production or product marketing(DOE, EIA, 1999).
Historically, majors have dominated the petroleum industry. However, the majors recently
began a trend of selective refining/marketing divestiture that reduced their share of U.S.
refining capacity from 72 percent in 1990 to 54 percent in 1998. Over the same period, the
share of the independents rose from 8 percent to 23 percent.
Table 3-6 lists the top five companies for each of the petroleum SIC groups within
this industry, ranked by sales. In addition to providing the name of the five largest
companies, the table also indicates whether the company is publicly or privately held, and
whether it is the parent or a subsidiary with a parent in a different SIC group. Although
many of the most widely known companies in the U.S. economy are on the list, certain SIC
groups (e.g., 4226, 5171) are dominated by companies that are not widely known outside
their industry.

DRAFT
3-9
3.3.1.2 Product Differentiation
Petroleum products are produced according to quality grade specifications and
therefore do not vary much from one another. Brand loyalty is not expected to be an
important factor in the petroleum products market (DOE, EIA, 1999).
Table 3-6. Top Five OLD Companies Ranked by Sales within Four-Digit SIC
2911 4226 4612
1. Exxon Corp.
(Public)
1. GATX Terminals Corp.
(Private Subsidiary)
1. TransMontaigne Oil Co.
(Public)
2. Mobil Corp.
(Public)
2. DSC Logistics Inc.
(Private)
2. Exxon Pipeline Co.
(Private Subsidiary)
3. Texaco Inc.
(Public)
3. Pierce Leahy Corp.
(Public)
3. Lakehead Pipe Line Partners LP
(Public)
4. Chevron Corp.
(Public)
4. Support Terminal Services Inc.
(Private Subsidiary)
4. Golden West Refining Co.
(Private Subsidiary)
5. Shell Oil Co.
(Private Subsidiary)
5. Continental Terminals Inc.
(Private)
5. Williams Pipe Line Co.
(Private Subsidiary)
5169 5171
1. Degussa Corp.
(Private Subsidiary)
1. EOTT Energy Partners LP
(Public)
2. Harris Chemical Group Inc.
(Private)
2. Coastal Oil New England Inc.
(Private Subsidiary)
3. Airgas Inc.
(Public)
3. AmeriGas Propane
(Private Subsidiary)
4. CHEM CENTRAL Corp.
(Private)
4. Truman Arnold Co.
(Private)
5. SOCO Chemical Inc.
(Private Subsidiary)
5. Carlos R Leffler Inc.
(Private)
Sources: Gale Research. 1999. Ward’s Business Directory of U.S. Private and Public Companies: 1999.
Detroit, MI: Gale Research, Incorporated.
American Petroleum Institute. August 1998. Heating Oil in the United States.
U.S. Environmental Protection Agency. July 1995. Economic Impact Analysis for the Petroleum
Refinery NESHAP, Revised Draft for Promulgation.

DRAFT
3-10
3.3.1.3 Market Share
Table 3-7 shows concentration ratios by SIC code for the affected OLD industries
involved in petroleum product distribution. Ratios are included for the census years 1987
and 1992 (where possible), although only 1992 data are available for some SIC codes.
The numbers in Table 3-7 show that, by and large, the petroleum liquids distribution
industries are characterized by a large number of firms and generally unconcentrated
markets, indicating a high degree of competitiveness in their respective product markets.
The exception is crude oil pipeline stations, which has relatively few firms (52) and high
concentration ratios (a CR4 of 60.3 percent and a CR8 of 79.7 percent), indicating a high
degree of concentration. These numbers are not surprising given that the pipeline industry is
Table 3-7. Concentration Ratios by SIC Code
SIC
Code Year
Total
Number of
Firms
Concentration R atio Herfindahl-
Hirschman
Index4 Firm 8 Firm 20 Firm 50 Firm
Petroleum Refinery
2911: Petroleum Refining
1987 200 32% 52% 78% 95% 435
1992 132 30% 49% 78% 97% 414
Liquid Terminal
4226: Special Warehousing and Storage, NEC
1992 1,212 27% 36% 50% 64% NA
Crude Oil Pipeline Station
4612: Crude Petroleum Pipelines
1992 52 60% 80% 97% 10% NA
Petroleum Terminal
5169: Chemicals and Allied Products, NEC
1992 7,446 27% 35% 50% 65% NA
5171: Petroleum Bulk Stations and Terminals
1992 8,266 21% 34% 53% 64% NA
Source: U.S. Department of Commerce, Bureau of the Census, Economic Census, 1992.

DRAFT
3-11
highly capital intensive (see discussion on barriers to entry in Section 3.3.1.3). In addition,
FERC legislates and monitors the liquids pipeline industries. FERC ensures fair access to
pipeline transportation at reasonable rates. Interestingly, the vast majority of crude oil
pipeline companies with corporate offices in the United States are operated as subsidiaries of
other corporate entities, mostly major oil companies. Only a few of the pipeline companies
are independently listed on any stock exchange (Gale Business Resources, 1999).
An interesting fact can also be observed in the data for petroleum
refineries—between 1987 and 1992, the total number of firms operating refineries decreased
from 200 to 132 (a reduction of 34 percent). At the same time, neither the concentration
ratios nor the HHI showed a trend to increased industry concentration. All indicators except
the CR50 remained at their 1987 levels (or even declined).
More recently, two other trends in the petroleum market have affected the number
and market shares of firms—mergers/joint ventures and divestitures. Over the past few
years, a number of mergers and joint ventures have been undertaken in an effort to cut costs
and increase profitability. This merger activity has occurred among the largest firms (as best
illustrated by the recently approved acquisition of U.S.-based Amoco Corporation by the
UK-based British Petroleum and the announced mega-merger of Exxon and Mobil
Corporation) as well as among independent refiners and marketers (e.g., the independent
refiner/marketer Ultramar Diamond Shamrock [UDS] acquired Total Petroleum North
America in 1997 and announced a joint venture with Phillips Petroleum in October 1998,
which was later abandoned) (DOE, EIA, 1999).
During the 1990s, the U.S. majors also began a process of selective
refining/marketing divestiture to counter the long period of low profitability in the
refining/marketing line of business. This divestiture of downstream assets by the majors
created opportunities for smaller, independent U.S. refiners/marketers to acquire domestic
refineries and petroleum marketing outlets and to move into market areas formerly
dominated by the U.S. majors. In 1990, the U.S. majors (including their joint ventures) held
72 percent of U.S. refining capacity. The independent refiners/marketers who pursued
acquisition growth strategies in the 1990s (the “fast-growing independent refiners”) then held
only 8 percent of domestic capacity, while all other refiners held 20 percent. By October
1998, the U.S. majors’ share of domestic crude distillation capacity had fallen to 54 percent
(60 percent including their joint ventures), and the fast-growing independent refiners had

DRAFT
3-12
increased their share to 23 percent, an almost threefold increase. The remaining capacity (18
percent) is still held by all other refiners (DOE, EIA, 1999).
3.3.1.4 Barriers to Entry
As explained in Section 2, barriers to entry are an important component of the market
structure. As indicated above, common carrier pipelines in the United States are government
regulated due to the industry’s structure, which can be characterized as a natural monopoly.
The crude oil pipeline industry is capital intensive. Start-up costs are high, and entry into the
industry is restricted, as is indicated by the small number of firms operating with
headquarters in the United States. However, since the day-to-day maintenance of capital-
intensive industries tends to be relatively moderate, successful companies within the pipeline
industries have been able to take advantage of economies of scale.
3.3.2 Facilities
Although EPA has received surveys from only about 45 percent (126 out of 281) of
the universe of OLD in the chemical industry, an examination of the data provided in the
surveys does have the capacity to illustrate general characteristics of those facilities. The
data presented here are for the 118 facilities (out of 126) who did not request that their
surveys be considered classified information.
3.3.2.1 Location
Figure 3-1 shows that 31 percent of petroleum liquids distributors are located in
Texas, 12 percent are in Louisiana, and 10 percent are located in Alaska.
3.3.2.2 Production Capacity and Utilization
Facilities in SIC code 2911 were operating at 91 percent capacity in 1998 and 1997
according to the U.S. Census Bureau (U.S. Department of Commerce).
3.3.2.3 Employment
Figure 3-2 shows that almost 40 percent of facilities involved in the distribution of
petroleum liquids employ fewer than 25 people on-site, while another 40 percent of facilities
employ more than 250 employees each.

DRAFT
3-13
Figure 3-1. Location of Petroleum Liquids Distributors

DRAFT
3-14
3.3.3 Firm Characteristics
Table 3-8 presents an overview of the total number of firms for each petroleum OLD
SIC code, the total number of firms potentially affected by the OLD source category, and the
percentage of the source category potentially affected.
3.3.3.1 Ownership
Table 3-9 presents the legal form of ownership for the SIC codes associated with the
OLD source category. The OLD source category is heavily dominated by firms organized as
corporations. For example, in 1987, 177 of 200 petroleum refineries (or 88.5 percent) were
classified as corporations. In 1992, 914 of 1,212 liquid terminals (or 75.4 percent), and 49 of
52 crude oil pipeline stations (or 94.2 percent) were classified as corporations (DOE, EIA,
1999; Speed, 1999).
3.3.3.2 Size Distribution
Figure 3-2. The Distribution of Organic Chemical Liquids Facilities by Employment
Source: Nonclassified responses to the 1998 Industry Specific Information Collection Request for the
Development of an Organic Liquids Distribution Maximum Achievable Control Technology.

DRAFT
3-15
Table 3-10 presents the SBA small business standards for the OLD source category
and also shows the number of small firms in the industry. The SBA size definitions for all

DRAFT
3-16

DRAFT
3-17
Table 3-8. Number of Total OLD Firms and Affected Firms, 1996
SIC
Code SIC Description
Total Number
of
Establishmentsa
Total Number of
Affected
Facilities
% of Source
Category that is
Affected
Petroleum Refinery
2911 Petroleum Refining 244 111 45.5%
Liquid Terminal
4226 Special Warehousing and Storage,
NEC
1,218 -
2,576b
94 3.6%
to 7.7%
Crude Oil Pipeline Station
4612 Crude Petroleum Pipelines 482 35 7.3%
Petroleum Terminal
5169 Chemicals and Allied Products,
NEC
8,892
41d
0.2%
5171 Petroleum Bulk Stations and
Terminals
6,729c
a U.S. Census Bureau. September 1999. “Petroelum Refinery.” 1997 Economic Census,
Manufacturing—Industry Series, E97M-3251I, Washington, DC: Government Printing Office.
U.S. Census Bureau. January 2000. “Transportation and Warehousing.” 1997 Economic Census,
Manufacturing—Industry Series, E97M-3251I, Washington, DC: Government Printing Office.
U.S. Census Bureau. January 2000. “Wholesale Trade.” 1997 Economic Census, Manufacturing—Industry
Series, E97M-3251I, Washington, DC: Government Printing Office.
U.S. Census Bureau. March 2000. “Retail Trade.” 1997 Econom ic Census, Manufacturing—Industry Series,
E97M -3251I, Washington, DC: Government Printing Office.
U.S. Census Bureau. February 1998. “Statistics for Industry Groups and Industries.” 1997 Economic
Census, Manufacturing—Industry Series, E97M-3251I, Washington, DC: Government Printing Office.b The smallest number is the minimum number of facilities in this category. The larger number is the
maximum number of facilities in this category, calculated by including all 877 facilities in NAICS industry
49311 (General Warehousing and Storage) and all 486 facilities in NAICS industry 49312 (Refrigerated
Warehousing and Storage) in the source category, although only part of the facilities in those industries would
actually fit into the SIC code 4226. c This is an underestimate. Facilities now classified in NAICS codes 454311 (Heating Oil Dealers) and 454312
(Liquified Petroleum Dealers) are not included.d This is the combined estimated number of affected facilities in this industry.

DRAFT
2The SBA data do not rank firms by revenue.
3-18
OLD industries, except for liquid terminals, is defined in terms of employees. The size
standard for these SIC categories ranges from 100 employees in the petroleum terminal
industry to 1,500 employees for petroleum refineries and crude oil pipeline stations. Based
on currently available data (i.e., SBA’s Statistics of U.S. Businesses), the number of small
firms can only be estimated. For most of the SIC groups of interest, the size categories
provided do not correspond to the SBA definition. Data are available for firms with fewer
than 100 employees, with between 0 and 499 employees, with more than 500 employees, and
with more than 2,500 employees.2
Thus, Table 3-10 presents two estimates—the number of definitely small firms and
the number of potentially small firms. For all SIC groups with SBA definitions of 750 or
more, the definitely small estimate is of firms with fewer than 500 employees. The
potentially small firm estimate includes the difference between firms with 2,500+ employees
and those with 500+ employees. Thus, the two estimates bracket the actual number of small

DRAFT
3-19
Table 3-9. Firms’ Legal Form of Organization for OLD Industries, 1987 and 1992
SIC Code Corporations
Sole
Proprietorship Partnerships
Other and
Unknown Total
Petroleum Refinerya
2911 177 3 7 13 200
Liquid Terminalb
4226 914 168 126 4 1,212
Crude Oil Pipeline Stationb
4612 49 — 1 2 52
Petroleum Terminalc
5169 6,857 490 88 11 7,446
5171 7,040 985 173 68 8,266
Sources: a1987 Census of Manufactures, Subject Series, Table 2.b1992 Census of Transportation, Subject Series, Table 7.c1992 Census of Wholesale Trade, Subject Series, Table 9.

DRAFT
3-20
Table 3-10. Small Business Size Standards for OLD Industries
SIC
Code SIC Description
SBA Small
Business Standard
Total
Firmsa
Number of
Definitely
Small Firms
(Percentage
of Total)a,b
Number of
Potentia lly
Small Firms
(Percentage of
Total)a, c
Petroleum Refinery
2911 Petroleum Refining 1,500 employees 173 118 133
68.21% 76.88%
Liquid Terminal
4226 Special Warehousing and
Storage, NEC
$18.5 milliond 1,299
Crude Oil Pipeline Station
4612 Crude Petroleum Pipelines 1,500 employees 52 19 26
36.54% 50.00%
Petroleum Terminal
5169 Chemicals and Allied
Products, NEC
100 employees 8,040 7,634 N/A
94.95%
5171 Petroleum Bulk Stations and
Terminals
100 employees 5,854 5,362 N/A
91.60%
a Source: Statistics of U.S. Businesses, 1996b Includes firms with fewer than 500 employees, except for SICs 5169 and 5171, where entry includes firms
with fewer than 100 employees.c Includes firms with fewer than 2,500 employees.d The SBA small business standard for SIC Code 4226 represents annual firm revenue. Firm size by revenue is
not available in Statistics of U.S. Businesses 1996.
Sources: Small Business Association. Small Business Size Standards Matched to SIC codes as of June 14,
1999.
Speed, Phillip J. “The Changing Competitive Landscape of the Chemical Industry.” Chemicalbond.
<http://www.socma.org/bond/feature1.html>. As obtained on September 2, 1999.
U.S. Department of Energy, Energy Information Administration. July 1999. Petroleum: An Energy
Profile 1999. DOE/EIA-0545(99).

DRAFT
3-21
firms. Note that nearly all petroleum terminals are small and between 70 and 78 percent of
petroleum refineries are small. In contrast, only between 36 and 50 percent of crude oil
pipeline firms are small.
Although Table 3-10 provides a general impression of the size of firms owning
petroleum liquid distribution facilities, EPA’s survey of OLD facilities provides a more
accurate representation of firms owning facilities affected by the OLD NESHAP. The 126
surveyed facilities are owned by 45 companies. According to SBA standards, 9 percent (4
Figure 3-3. The Size Distribution of Companies that own OLD Facilities involved in theDistribution of Nongasoline Petroleum Liquids, by 1998 Sales (in $1997)
Note: Sales data are from 1998 but were converted into 1997 dollars to: (1) facilitate comparison with other
figures reported in this profile and (2) allow easy comparison with estimated compliance costs, which
are calculated in 1997 dollars.
Sources: Dun & Bradstreet. 1999. Company Capsules. As available on EBSCO.
General Business File International (formerly Business ASAP). 1999. Gale Group Collections. As
obtained from InfoTrac Web.
Hoover’s Incorporated. 1999. Hoover’s Company Profiles. Austin, TX: Hoover’s Incorporated.
<http://www.hoovers.com/>.
Company W ebsites.
Company 10k Reports.
U.S. Environmental Protection Agency. 2000. Technical Support Document for the Organic Liquids
Distribution (Non-gasoline) Industry. Washington, DC: USEPA, Office of Air Quality Planning and
Standards..

DRAFT
3-22
out of 45) of those companies are small businesses. A larger percentage of unsurveyed
petroleum liquid distribution facilities may be owned by small businesses, but even if all of
those facilities are owned by small businesses, the percentage of firms affected by the OLD
NESHAP that are small would at most be 57 percent.
Figures 3-3 and 3-4 show the distribution of surveyed firms by firm size as measured
by revenue and employment. The majority of affected firms took in more than $1 billion in
revenues in 1998 and employ more than 5,000 people.
Figure 3-4. Size Distribution of Companies that own OLD Facilities involved in thedistribution of non-gasoline petroleum liquids
Sources: Dun & Bradstreet. 1999. Company Capsules. As available on EBSCO.
General Business File International (formerly Business ASAP). 1999. Gale Group Collections. As
obtained from InfoTrac Web.
Hoover’s Incorporated. 1999. Hoover’s Company Profiles. Austin, TX: Hoover’s Incorporated.
<http://www.hoovers.com/>.
Company W ebsites.
Company 10k Reports.
U.S. Environmental Protection Agency. 2000. Technical Support Document for the Organic Liquids
Distribution (Non-gasoline) Industry. Washington, DC: USEPA, Office of Air Quality Planning and
Standards.

DRAFT
3-23
3.3.3.3 Vertical and Horizontal Integration
C Vertical Integration. The petroleum industry consists of two main functionalsectors—the upstream sector (including exploration and production) and thedownstream sector (including refining, transportation, and marketing). Theindustry exhibits a high degree of vertical integration with many firms operatingin more than one sector (DOE, EIA, 1999). For example, the crude petroleumpipeline industry is dominated by giant oil companies with assets in many of thedownstream sectors of the industry (Gale Business Resources, 1999). Of the twotypes of petroleum firms, majors are generally fully integrated and operatefacilities in all the different sectors. Independents, on the other hand, arenonintegrated and generally specialize in one aspect, such as crude oil explorationand production or product marketing (DOE, EIA, 1999).
C Horizontal Integration. Major petroleum companies are horizontally integratedbecause they operate several refineries that are often distributed around thenation. On the other hand, the smaller independent firms typically operate onlyone refinery each and are therefore not horizontally integrated (EPA, 1995). Fifty-six of the facilities that responded to EPA’s survey for the OLD NESHAPare petroleum refineries. Those refineries are owned by 21 firms. Three (14percent) of those firms own six refineries each. Nine (43 percent) of those firmsown two to four refineries each. The remaining nine firms own only one refineryeach and so are totally nonintegrated horizontally.
3.3.3.4 Financial Condition
Throughout the 1990s, the U.S. refining and marketing industry was characterized by
unusually low product margins, low profitability, selective retrenchment, and substantial
restructuring. Profitability (measured as return on investment) from refining operations of
domestic petroleum companies has varied widely throughout the decade (and even before
1990). During 1997, the profitability of U.S. refining and marketing was the highest since
1989, which was in part achieved by low energy costs as well as cost-cutting measures,
including a number of mergers and joint ventures in the downstream sector (DOE, EIA,
1999).
The crude petroleum pipeline industry has experienced modest but steady growth
since 1993. As a result, company profits have also increased. This trend has been a result of
lower operating costs and moderate expanses in deliveries (Gale Business Resources, 1999;
DOE, EIA, 1999).

DRAFT
3Forty-five firms own surveyed facilities. Profit, employment, and sales data were identified for only 43 of
those facilities.
3-24
Table 3-11 shows that, for the firms that own the 126 facilities that responded to the
EPA survey,3 the average (median) profit margin was 4.3 (4.7) percent. Figure 3-5 shows the
distribution of profit margins among firms that own petroleum liquids distributors.
3.4 Uses and Consumers
This section describes the uses and consumers of petroleum liquids, as well as the
demand elasticities and possible substitutes for the product.
3.4.1 Major Consumers
Five major economic sectors consume petroleum products (DOE, EIA, 1999):
C Residential Sector: This sector includes private households that consume energyprimarily for space heating, water heating, air conditioning, refrigeration,cooking, and clothes drying.
C Commercial Sector: This sector includes nonmanufacturing or nontransportationbusiness establishments, including numerous service enterprises; health, social,and educational institutions; religious and nonprofit organizations; andgovernment institutions. Street lights, pumps, bridges, and public services arealso included.
Table 3-11. Profit Margins of Firms that own Organic Chemical Liquids DistributionFacilities
Median 0.043364
Average 0.04732
Maximum 0.347377
Minimum –0.06935
Source: Nonclassified responses to the 1998 Industry Specific Information Collection Request for the
Development of an Organic Liquids Distribution M aximum Achievable Control Technology.

DRAFT
3-25
C Industrial Sector: This sector includes manufacturing, construction, mining,agriculture, fishing, and forestry establishments.
C Transportation Sector: This sector includes private and public vehicles (e.g.,automobiles, trucks, buses, motorcycles, railroads and railways, aircraft, ships,barges, and natural gas pipelines).
C Electric Utility Sector: This sector includes privately and publicly ownedestablishments that generate, transmit, distribute, or sell electricity primarily foruse by the public. Nonutility power producers are not included in the electricutility sector
Figure 3-5. Distribution of Firms by Profit Margin
Sources: Dun & Bradstreet. 1999. Company Capsules. As available on EBSCO.
General Business File International (formerly Business ASAP). 1999. Gale Group Collections. As
obtained from InfoTrac Web.
Hoover’s Incorporated. 1999. Hoover’s Company Profiles. Austin, TX: Hoover’s Incorporated.
<http://www.hoovers.com/>.
Company W ebsites.
Company 10k Reports.
U.S. Environmental Protection Agency. 2000. Technical Support Document for the Organic Liquids
Distribution (Non-gasoline) Industry. Washington, DC: USEPA, Office of Air Quality Planning and
Standards.
Dun & Bradstreet. 1997. Industry Norms & Key Business Ratios: Desk-Top Edition 1996–1997.

DRAFT
3-26
3.4.2 Purpose of Consumption
The demand for petroleum products is influenced by several factors, including crude
oil prices, economic growth trends, and weather conditions. Low oil prices tend to stimulate
demand. Demand also increases during periods of economic expansion, particularly in the
industrial and transportation sectors. Economic expansions lead to an increase in the
production of goods, which contributes in turn to an increase in the demand for
transportation of raw materials and the deliveries of finished products. Petroleum demand is
also influenced by weather conditions. Extreme weather tends to either increase or decrease
the use of heating oil and electricity, which contributes to the demand for petroleum
products. Weather can also contribute to the seasonal variations in demand for transportation
fuels (such as gasoline).
As discussed in Section 3.1, the main refinery products are motor gasoline, distillate
fuel oil, jet fuel, residual fuel oil, and LPGs. The demand for each of these products is
briefly discussed below. The demand for petrochemicals, an output from the refinery
process but an input into chemical manufacturing, is discussed in Section 2.
C Motor Gasoline: Although motor gasoline is not included in the OLD sourcecategory, the discussion of its demand is relevant to this source category becauseit accounts for the largest share of crude oil use. Demand for motor gasolinealone accounts for more than 40 percent of the total demand for petroleumproducts. A number of factors influence the demand for motor gasoline. Forexample, rising gasoline prices encourage consumers to reduce discretionarydriving and stimulate consumer demand for smaller, more fuel efficientautomobiles (DOE, EIA, 1999).
C Distillate Fuel Oil: Distillate fuel oil markets include transportation (diesel-powered trucks), household (space-heating), industrial (fuel for commercialburners), and electric utilities (electricity generation). Most diesel fuel is used fortransportation purposes; highway diesel fuel represents more than half of distillatefuel sales. Residential heating, the next largest end-use category, represents about12 percent of annual distillate use but is concentrated in the winter months (DOE,EIA, 1999). In addition, trucking use has been the fastest growing segment ofdistillate demand, accounting for only 40 percent of distillate oil sold in 1986, butmore than 52 percent in 1996 (API, 1998).
• Distillate fuel oil is the primary source of space heating for millions of businessesand residences. This demand is concentrated in the Northeast. Between 1990 and1996, the annual demand for heating oil for commercial and residential use

DRAFT
3-27
ranged between 9 and 11 billion gallons a year (API, 1998). As a country, theUnited States now uses less heating oil than it did in the 1970s, when demand wasat its peak. The decline in heating oil use reflects the increased availability ofnatural gas in the Northeast, the development of more efficient electric heatingsystems, and the investment in energy conservation by homes and businesses, allof which coincided with high oil prices.
C Jet Fuel Oil: Jet fuel is primarily used in commercial airlines. Its demand istherefore driven by a combination of price concerns and the overall health of theairline industry (EPA, 1995). Sometimes, jet fuel is also blended into heating oiland diesel fuel during periods of extreme cold weather (DOE, EIA, 1999).
C Residual Fuel Oil: The main uses of residual fuel oil include the commercial andindustrial sectors (heating), utilities (electricity generation), and the transportationsector (fuel for ships). Nonutility use of residual fuel has been decreasing due tointerfuel substitution in the commercial and industrial sectors. Although electricutilities use relatively little petroleum compared with the transportation andindustrial sectors, this sector depends on petroleum for about 5 percent of its totalenergy requirements. Much of the surplus capacity for electricity generation isoil-fired, so petroleum use by utilities is expected to increase along withelectricity demand (DOE, EIA, 1999). Annual demand for residual fuel oil hasfallen for 9 consecutive years and has been on a downward trend since peaking atapproximately 3 million barrels per day in 1977 (Oil & Gas Journal, 1999).
C LPGs: LPGs such as propene, ethane, propane, isobutane, and n-butane rank fifthin usage among petroleum products. Their major nonfuel use is as feedstocks forpetrochemicals. They are also used as fuel for domestic heating and cooking, andfarming operations and as an alternative to gasoline for use in internal combustionengines. Demand levels for LPGs can be attributed to their various end uses(DOE, EIA, 1999).
3.4.3 Characterization of Demand—Derived Demand Elasticity
The demand for petroleum is also influenced by the price of petroleum itself and the
price of available substitutes. The degree to which the price of petroleum influences the
quantity of petroleum products demanded is called the price elasticity of demand. Generally
speaking, the price elasticity of demand represents the percentage change in the quantity
demanded resulting from a 1 percent change in the price of the product. Table 3-12 lists the
price elasticities of demand for several of the major petroleum products.
The elasticity estimates indicate that each of these products has inelastic demand.
Regulatory control costs are more likely to be paid by consumers of products with inelastic

DRAFT
3-28
demand as compared to products with elastic demand, all other factors held constant. Price
increases for products with inelastic demand lead to revenue increases for the producers.
Thus, one can predict that price increases resulting from implementation of regulatory
control costs will lead to higher gross revenues for the producers (EPA, 1995).
Demand becomes more elastic with the availability of substitutes and the passage of
time. In the short run, there may not be substitutes readily available for consumption.
However, over time, consumers have the opportunity to adjust to the price increase and will
seek alternatives. In the case of the petroleum industry, as the prices of crude oil and
petroleum products increase, consumers may not be able to respond immediately. The short-
run demand elasticity is inelastic because petroleum plays a critical role in today’s lifestyles
(Oil & Gas Journal, 1999).
3.4.4 Substitution Possibilities
As time passes, consumers can adjust to price changes, and consumer behavior may
change. If the price of these products increases because of regulatory actions, consumers
will switch fuels (especially at electric utilities) in industrial plants having dual-fuel boilers
and in households that have wood-burning stoves and electric heaters. Sustained high prices
may also encourage actions such as design changes that increase fuel efficiency in
automobiles, improved insulation in newly constructed and existing buildings, and design
changes in appliances to improve energy efficiency. Once in place, these long-term
conservation measures continue to affect fuel use, regardless of subsequent price
fluctuations.
Table 3-12. Estimates of Price Elasticity of Demand for Petroleum Products
Motor gasoline –0.55 to –0.82
Jet fuel –0.15
Residual fuel oil –0.61 to –0.74
Distillate fuel oil –0.50 to –0.99
Liquified petroleum gases –0.60 to –1.0
Source: EPA, Economic Impact Analysis for the Petroleum Refining NESHAP, July 1995, p. 78.

DRAFT
3-29
The discussion of substitution in this section only addresses substitution among end
products. However, conceptually, it may be possible for a facility to substitute one mode of
liquid transportation for another. This substitution could make sense economically if the
loading or unloading activities associated with one mode of transportation were found to
account for significantly more HAP emissions, and therefore potential compliance
requirements, than another. However, it is equally important that a switch from one mode of
transportation to another must be technically feasible. Neither engineering analyses nor
compliance cost estimates developed for this regulation have given any indication of
potential substitutability between different modes of liquid transportation. Therefore, this
analysis assumes that the only substitution possibilities exist between end products (Oil &
Gas Journal, 1999; EPA, 1995).
3.5 Markets
The petroleum industry is a major sector in the U.S. economy. A significant portion
of the petroleum consumed domestically is imported. The industry experienced relatively
high prices in 1996 and 1997; however, petroleum prices declined substantially in 1998
(Gale Business Resources, 1999).
3.5.1 Market Volumes
Petroleum refining is one of the leading manufacturing industries in the United
States. The value of shipments by the petroleum refining industry accounts for about 4
percent of the value of shipments by the entire manufacturing sector of the U.S. economy. In
1996, the value of shipments by the petroleum refining industry was an estimated $158
billion (DOE, EIA, 1999).
Figures 3-6 and 3-7 compare trends in the value of shipments by petroleum refineries
(SIC code 2911) to gross domestic product (GDP) growth between 1989 and 1996. While
GDP grew every year except 1992, value of shipments of petroleum refineries decreased
between 1990 and 1994. This decrease is the result of sharp drops in the prices of petroleum
products. The fact that value of shipments decreased despite increases in the production of
petroleum products (see Table 3-13) reflects that the price elasticity of demand for petroleum
products is relatively inelastic—for each 1 percent decrease in price, the quantity demanded
increases by less than 1 percent, causing value of shipments to fall.

DRAFT
3-30
Figure 3-6. Value of Shipments, 1989–1996 (SIC 2911)
3.5.1.1 Domestic Production
Table 3-13 lists the domestic production trends for crude oil and petroleum products
for the past decade. From its peak of 9.6 million barrels per day in 1970, domestic crude oil
production has declined to 6.3 million barrels per day in 1998. In the past decade, the
production of crude oil has declined by 18 percent from its 1989 production level. The
decline in domestic production of crude oil has been attributed to a transfer of U.S.
investment from domestic sources to foreign production. The transfer is a result of lower
labor costs, less stringent regulatory environments, and the increased likelihood of
discovering larger fields in overseas activity.
In contrast to crude oil, the domestic production of most petroleum products has
increased in the past decade. Refinery production of motor gasoline has increased each year,

DRAFT
3-31
Figure 3-7. GDP, 1989–1996
with the exception of periods of economic recession. Distillate fuel oil production has also
increased in the past decade, with a 1998 production level that is 16 percent higher than the
1989 level. Residual fuel oil is the only petroleum product that has not experienced an
increase in production over the last 10 years. The current production rate is 20 percent lower
than it was a decade ago. Domestic production of jet fuel, LPGs, and other petroleum
products has also grown, with increases of 9 percent, 17 percent, and 17 percent,
respectively.
3.5.1.2 Domestic Consumption
Table 3-14 presents domestic consumption of crude oil and petroleum products for
the past decade. Crude oil is the primary input for the production of the various petroleum
products. Therefore, as consumption of the various end products either increases or

DRAFT
3-32
decreases, so does the consumption of crude oil. While there were slight declines in crude
oil consumption in the early 1990s, the overall demand for crude oil has increased by 9
percent in the past decade.
Table 3-14 also shows that domestic consumption of petroleum products has
fluctuated in the past decade. However, the overall trend has been an increase in
consumption for most products. Level of consumption and increase in consumption have
been greatest for LPGs, motor gasoline, and other petroleum products. The consumption of
motor gasoline has increased by 13 percent in the past 10 years. The increase in motor
gasoline in the late 1990s can be partly attributed to more vehicles with reduced fuel
efficiency (i.e., light truck, vans, and sport utility vehicles) being purchased in response to
low gasoline prices (DOE, EIA, 1999). Also responsible for the increase in motor gasoline
consumption is the increase in vehicle miles driven per car from 8,813 in 1980 to 11,314 in
Table 3-13. Total Production of Petroleum Products, 1989-1998 (103 barrels/day)
Year
Crude
Oil
Finished
Motor
Gasoline
Distillate
Fuel Oil
Residual
Fuel Oil Jet Fuel LPG
Other
Petroleum
Productsa
1989 7,613 6,963 2,899 954 1,403 1,668 2,771
1990 7,355 6,959 2,925 950 1,488 1,556 2,842
1991 7,417 6,975 2,962 934 1,438 1,689 2,826
1992 7,171 7,058 2,974 892 1,399 1,755 2,928
1993 6,847 7,360 3,132 835 1,422 1,734 3,035
1994 6,662 7,312 3,205 826 1,448 1,880 2,973
1995 6,560 7,588 3,155 788 1,416 1,899 3,031
1996 6,465 7,647 3,316 726 1,515 2,012 3,108
1997 6,452 7,870 3,392 708 1,554 2,038 3,204
1998 6,252 8,082 3,424 762 1,526 1,952 3,253
Percentage
Change
1989-1998
–18% 16% 18% –20% 9% 17% 17%
a Other petroleum products include pentanes plus other hydrocarbons and oxygenates, unfinished oils, gasoline
blending components, and all finished petroleum products except for those listed in the table.
Source: EIA, Petro leum Supply Annual, 1998, Vol. I, Table S2, S4, S5, S6, S7, S9, S10

DRAFT
3-33
1996 (Oil & Gas Journal, 1998). Residual fuel oil consumption has experienced perhaps the
most noticeable change in the past decade, declining 35 percent. This decline in demand can
be attributed to a change from heavier fuels to lighter ones, as industry complies with
environmental regulations (mainly air emission reductions). In addition, lower natural gas
prices have contributed to displacing residual fuel use. An increasing number of air
passengers and flights has led to a rise in the demand for jet fuel from 1989 to 1998.
3.5.1.3 International Trade
Imports. Foreign trade plays a critical role in the U.S. crude oil market, and imports
of crude oil in the United States far outweigh exports of crude oil. With a decline in
domestic production and an increase in consumption, crude oil imports provide the missing
link as U.S. oil demand continues to increase. Table 3-15 shows imports of petroleum
between 1989 and 1998.
Table 3-14. Consumption of Petroleum Products, 1989–1998 (103 barrels/day)
Year
Crude
Oil
Finished
Motor
Gasoline
Distillate
Fuel Oil
Residual
Fuel Oil Jet Fuel LPG
Other
Petroleum
Productsa
1989 17,325 7,328 3,157 1,370 1,489 1,668 2,285
1990 16,988 7,235 3,021 1,229 1,522 1,556 2,402
1991 16,714 7,188 2,921 1,158 1,471 1,689 2,269
1992 17,033 7,268 2,979 1,094 1,454 1,755 2,470
1993 17,237 7,476 3,041 1,080 1,469 1,734 2,426
1994 17,718 7,601 3,162 1,021 1,527 1,880 2,518
1995 17,725 7,789 3,207 852 1,514 1,899 2,457
1996 18,309 7,891 3,365 848 1,578 2,012 2,608
1997 18,620 8,017 3,435 797 1,599 2,038 2,733
1998 18,917 8,253 3,461 887 1,622 1,952 2,741
Percentage
Change
1989-1998
9% 13% 10% -35% 9% 17% 20%
a Other petroleum products include pentanes plus other hydrocarbons and oxygenates, unfinished oils, gasoline
blending components, and all finished petroleum products except for those listed in the table.
Source: EIA, Petro leum Supply Annual, 1998, Vol. I, Table S2, S4, S5, S6, S7, S9, S10

DRAFT
3-34
As shown in Table 3-15, U.S. imports of crude oil have increased 49 percent in the
last decade alone. Imports of refined petroleum products, on the other hand, have declined
since the mid-1980s, accounting for slightly more than one-third of total petroleum imports
in 1985, but less than one-fifth by 1997 (DOE, EIA, 1999). In the past decade, the amount of
motor gasoline, distillate fuel oil, and residual fuel oil imported have all declined, while
imports of LPG and other petroleum products have increased.
Similarly, the import-to-consumption ratios presented in Table 3-16 show a pattern of
increasing dependency on imports. The import-to-consumption ratio reveals the degree to
which imports account for the amount of crude oil used domestically. It is quite substantial
in the United States, accounting for 46 percent in 1998 and has been increasing over the
period shown.
Table 3-15. Imports of Petroleum Products, 1989-1998 (103 barrels/day)
Year
Crude
Oil
Finished
Motor
Gasoline
Distillate
Fuel Oil
Residual
Fuel Oil Jet Fuel LPG
Other
Petroleum
Productsa
1989 5,843 369 306 629 106 181 627
1990 5,894 342 278 504 108 188 705
1991 5,782 297 205 453 67 147 675
1992 6,083 294 216 375 82 131 707
1993 6,787 247 184 373 100 160 770
1994 7,063 356 203 314 117 183 761
1995 7,230 265 193 187 106 146 708
1996 7,508 336 230 248 111 166 879
1997 8,225 309 228 194 91 169 945
1998 8,706 311 210 275 124 194 888
Percentage
Change
1989-1998
49% –16% -31% –56% 17% 7% 42%
a Other petroleum products include pentanes plus other hydrocarbons and oxygenates, unfinished oils, gasoline
blending components, and all finished petroleum products except for those listed in the table.
Source: EIA, Petro leum Supply Annual, 1998, Vol. I, Table S2, S4, S5, S6, S7, S9, S10
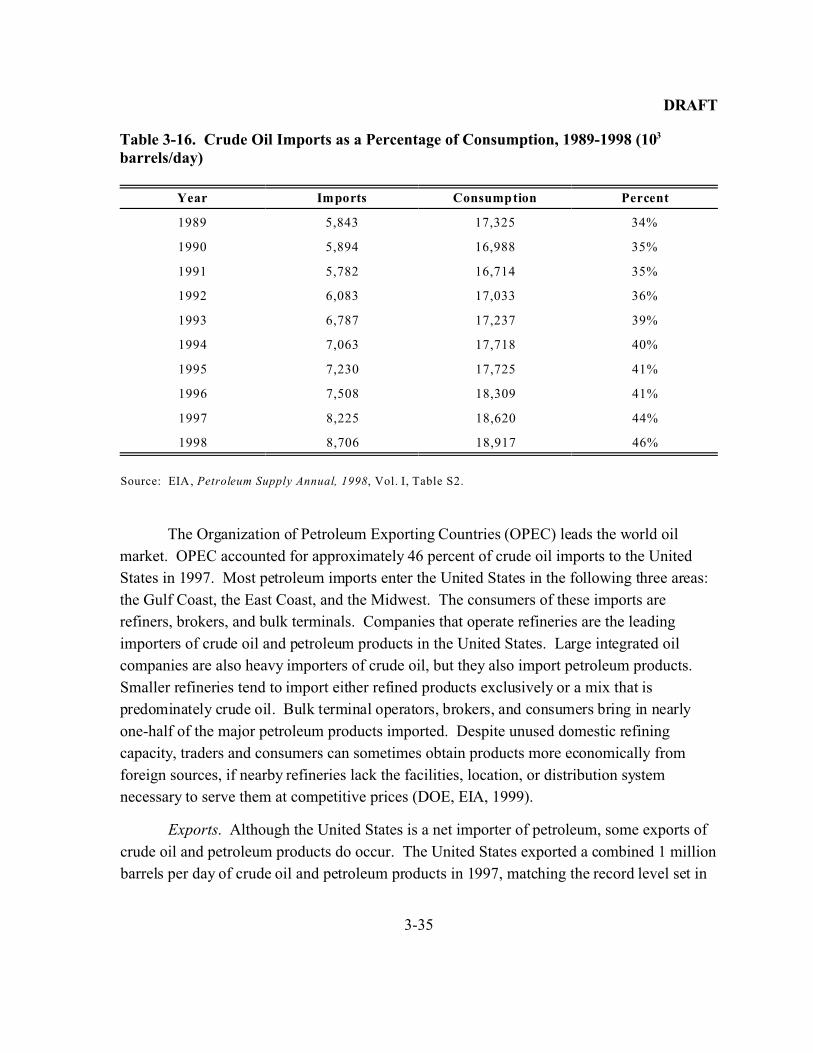
DRAFT
3-35
The Organization of Petroleum Exporting Countries (OPEC) leads the world oil
market. OPEC accounted for approximately 46 percent of crude oil imports to the United
States in 1997. Most petroleum imports enter the United States in the following three areas:
the Gulf Coast, the East Coast, and the Midwest. The consumers of these imports are
refiners, brokers, and bulk terminals. Companies that operate refineries are the leading
importers of crude oil and petroleum products in the United States. Large integrated oil
companies are also heavy importers of crude oil, but they also import petroleum products.
Smaller refineries tend to import either refined products exclusively or a mix that is
predominately crude oil. Bulk terminal operators, brokers, and consumers bring in nearly
one-half of the major petroleum products imported. Despite unused domestic refining
capacity, traders and consumers can sometimes obtain products more economically from
foreign sources, if nearby refineries lack the facilities, location, or distribution system
necessary to serve them at competitive prices (DOE, EIA, 1999).
Exports. Although the United States is a net importer of petroleum, some exports of
crude oil and petroleum products do occur. The United States exported a combined 1 million
barrels per day of crude oil and petroleum products in 1997, matching the record level set in
Table 3-16. Crude Oil Imports as a Percentage of Consumption, 1989-1998 (103
barrels/day)
Year Imports Consumption Percent
1989 5,843 17,325 34%
1990 5,894 16,988 35%
1991 5,782 16,714 35%
1992 6,083 17,033 36%
1993 6,787 17,237 39%
1994 7,063 17,718 40%
1995 7,230 17,725 41%
1996 7,508 18,309 41%
1997 8,225 18,620 44%
1998 8,706 18,917 46%
Source: EIA, Petroleum Supply Annual, 1998, Vol. I, Table S2.

DRAFT
3-36
1993. The five leading countries that receive United States exports of petroleum are Mexico,
Canada, Japan, Republic of Korea, and Spain. Crude oil exports averaged 110,000 barrels
per day in 1998. This average is down from its peak in 1980 of 287,000 barrels per day.
Product exports have averaged more than 600,000 barrels per day since 1986 and reached
896,000 barrels per day in 1997, when they accounted for more than 89 percent of petroleum
exports. This number dropped in 1998 to 835,000 barrels per day, representing 88 percent of
total petroleum exports. The three leading petroleum product exports, in order of volume
exported, are petroleum coke, distillate fuel oil, and motor gasoline (DOE, EIA, 1999).
Table 3-17 shows that the exports of crude oil, residual fuel oil, and jet fuel have all
declined in the past decade. The most noticeable export increase has been in motor gasoline,
which has increased by 221 percent in the past 10 years. While foreign demand is the
primary factor determining export levels for the heavier petroleum products, there are other
economic incentives for exporting petroleum products. For example, shipping costs may be
lower for exports than for domestic transfers because many international water shipments are
shorter than domestic transfers. In addition, because many United States ports cannot
accommodate large supertankers, domestic shipments are often unable to realize the same
economies of scale as international shipments.
Table 3-18 shows the percentage of domestic production that is exported. This ratio
is extremely small, showing that most crude oil produced in the United States is used for
domestic consumption. The ratio has remained stable over the past 10 years, only varying
between 1 and 2 percent.
3.5.2 Market Prices
Crude oil prices are set in international market and have been on a general decline
since 1981. OPEC has the ability to influence oil prices worldwide because its members
possess such a large portion of the world’s oil supply. If OPEC restricts supply, prices
increase. If OPEC floods the market with crude oil, prices decrease, which is what happened
in 1986 when prices fell dramatically because OPEC increased supplies of crude oil. The
sharp price decline in 1998 was attributable to plentiful crude oil supplies (partly due to
Iraq’s increased production). There has also been a general trend of price decline in
petroleum products. Part of this decline is due to a reduction in demand from suffering

DRAFT
3-37
Asian economies and a decrease in United States demand for heating oil because of
unseasonably warm weather (API, 1999).
Table 3-19 shows that the price of crude oil and refined petroleum products have all
substantially decreased from 1989 to 1998. The largest drop was in crude oil, closely
followed by kerosene-type jet fuel, and residual fuel oil.
3.5.3 Future Projections
The current status of the potentially affected industries is important to establish a
baseline for the economic impact analysis. However, since compliance costs will not be
incurred until some time in the future, it is also important to consider projections of future
economic trends when estimating likely impacts of a regulation.
Table 3-17. Exports of Petroleum Products, 1989-1998 (103 barrels/day)
Year
Crude
Oil
Finished
Motor
Gasoline
Distillate
Fuel Oil
Residual
Fuel Oil Jet Fuel LPG
Other
Petroleum
Productsa
1989 142 39 97 215 27 35 305
1990 109 55 109 211 43 40 289
1991 116 82 215 226 43 41 277
1992 89 96 219 193 43 49 263
1993 98 105 274 123 59 43 300
1994 99 97 234 125 20 38 329
1995 95 104 183 136 26 58 348
1996 110 104 190 102 48 51 376
1997 108 137 152 120 35 50 402
1998 110 125 124 138 26 42 380
Percentage
Change
1989-1998
–23% 221% 28% –36% –4% 20% 25%
a Other petroleum products include pentanes plus other hydrocarbons and oxygenates, unfinished oils, gasoline
blending components and all finished petroleum products except for those listed in the table.
Source: EIA, Petro leum Supply Annual, 1998, Vol. I, Table S2, S4, S5, S6, S7, S9, S10.

DRAFT
3-38
The Energy Information Administration (EIA) publishes the Annual Energy Outlook,
which presents midterm forecasts on energy supply, demand, and prices. The analysis
performed focuses on a reference case and four other cases that assume higher and lower
economic growth and higher and lower world oil prices than in the reference case. The
projections are based on results from EIA’s National Energy Modeling System (NEMS).
Information on petroleum found in this section is based on the 1999 Annual Energy Outlook.
3.5.3.1 Domestic Production
Domestic crude oil production is expected to continue to decline throughout the next
20 years. It is expected to decrease by 1.1 percent a year, from 6.5 million barrels per day in
1997 to 5.0 million barrels per day in 2020. This decline in domestic production will lead to
a decline in domestic petroleum supply. Domestic supply in 1997 was 9.4 million barrels per
day. In NEMS’s low price projection, supply drops to 7.6 million barrels per day in 2020; in
its high price projection, supply drops to 9.3 million barrels.
Table 3-18. Crude Oil Exports as a Percentage of Production, 1989-1998 (103
barrels/day)
Year Exports Production Percent
1989 142 7,613 2%
1990 109 7,355 1%
1991 116 7,417 2%
1992 89 7,171 1%
1993 98 6,847 1%
1994 99 6,662 1%
1995 95 6,560 1%
1996 110 6,465 2%
1997 108 6,452 2%
1998 110 6,252 2%
Source: EIA, Petroleum Supply Annual, 1998, Vol. I, Table S2.

DRAFT
3-39
3.5.3.2 Domestic Consumption
Domestic consumption of petroleum is expected to increase over the next 20 years.
United States petroleum consumption is projected to increase by 6.0 million barrels per day
between 1997 and 2020 in the reference case, 3.9 million barrels per day in the low growth
case, and 8.2 million in the high growth case. The transportation sector is expected to
account for most of the increase in petroleum consumption. However, a change in the
consumption pattern of the transportation sector is expected to occur. Gasoline accounted
for 65 percent of the petroleum consumed for transportation. However, this share is
expected to decrease to 61 percent in 2020 as alternative fuels are introduced to the
transportation market. The share of jet fuel is expected to increase from 13 percent to 17
percent as air travel continues to expand.
Table 3-19. Table United States Crude Oil and Petroleum Products Prices ($/gal)
Year
Refiner Acquisition
Cost of Crude Oil
(Domestic)
Motor
Gasoline
No. 2
Distillate
Fuel Oil
Residual
Fuel Oil
Kerosene-
Type Jet Fuel
1989 $0.43 $0.76 $0.59 $0.39 $0.59
1990 $0.54 $0.88 $0.73 $0.44 $0.77
1991 $0.46 $0.80 $0.65 $0.34 $0.65
1992 $0.44 $0.79 $0.62 $0.34 $0.61
1993 $0.40 $0.76 $0.60 $0.34 $0.58
1994 $0.37 $0.74 $0.56 $0.35 $0.53
1995 $0.41 $0.77 $0.56 $0.39 $0.54
1996 $0.49 $0.85 $0.68 $0.46 $0.65
1997 $0.47 $0.84 $0.64 $0.42 $0.61
1998 $0.31 $0.67 $0.49 $0.30 $0.45
Percentage
Change
1989-1998
–28% –12% –17% –23% –24%
Source: EIA, Petro leum Marketing Monthly , September 1999, Table 1&2.

DRAFT
3-40
3.5.3.3 International Trade
As domestic production continues to decline and domestic consumption continues to
grow, oil imports will continue to increase. The projections for net petroleum imports in
2020 range from a high of 18.3 million barrels per day in the low oil price case to a low of
14.3 million barrels per day in the low growth case. This is more than double the 1997 level
of 9.2 million barrels per day. Table 3-20 shows consumption and net imports of crude oil
and petroleum products for 1997 and projections for 2020.
As discussed earlier, crude oil imports currently account for the majority of foreign
imports of petroleum. Crude oil is expected to continue as the major component of
petroleum imports. However, the import share of refined products is expected to increase in
the future. More imports of petroleum products will be needed as growth in demand for
refined products exceeds the expansion of domestic refining capacity.
Future exports of petroleum from the United States will depend on economic
conditions worldwide and the restrictions placed on trade both in the United States and
abroad. The industrialized countries will continue to be the major oil consumers over the
next 20 years. However, petroleum use will increase at the fastest rate in developing
Table 3-20. Petroleum Consumption and Net Imports in 1997 and 2020 (106 barrels/day)
Year and
Projection Consumption Net Imports Net Crude Im ports
Net Product
Imports
1997 18.6 9.2 8.1 1.0
2020 Projections
Reference 24.7 16.0 12.0 4.0
Low oil price 26.0 18.3 13.1 5.2
High oil price 24.0 14.6 11.5 3.1
Low growth 22.5 14.3 11.4 2.9
High growth 26.8 17.7 12.6 5.1
Source: EIA, Annual Energy Outlook 1999, Table 10.

DRAFT
3-41
countries. The United States will continue to export petroleum products (especially the
heavy products, which are in less demand in this country) (DOE, EIA, 1999).
3.5.3.4 Market Prices
Oil prices have fluctuated greatly in the past, which makes future price projections
uncertain. However, future oil prices are expected to be higher than current prices. The
latest year for which comprehensive data is available is 1998, a year which saw
uncharacteristically low prices for petroleum-based products. The reference case for oil
projects prices to rise by about 0.9 percent a year, reaching $22.73 in constant 1997 dollars in
2020. In nominal dollars, the reference case price exceeds $43 in 2020. The low price case
projects prices rising to $14.57 by 2005 and remaining at about that level until 2020. The
high price case has a price rise of about 2.5 percent per year until 2015 and then remains at
$29.35 until 2020. The leveling off at about $29.35 in the high price case is due to the
market penetration of alternative energy supplies that could become economically viable at
that price (DOE, EIA, 1999).

DRAFT
R-1
REFERENCES
Abt Associates. October 15, 1998. Characterization of the Organic Liquid Distribution
(Nongasoline) Industry. Prepared for the U.S. Environmental Protection Agency.
American Petroleum Institute. August 1998. Heating Oil in the United States.
American Petroleum Institute. February 26, 1999. Economic State of the U.S. Petroleum
Industry.
Arnold, Roger A. 1989. Microeconomics. 2nd Ed. St. Paul: West Publishing Company.
Baseline Emissions for the Organic Liquids Distribution (Nongasoline) Source Category.
Memo to Docket. June 7, 1999.
Chemical & Engineering News. 1999. “Facts and Figures for the Chemical Industry.”
77(26).
Chemical & Engineering News. June 29, 1998.
Chemical Manufacturers Association. Mid-2000 Business of Chemistry Outlook, as
obtained on June 22, 2000.
<www.cmahq.com/cmahg.com/cmawebsite.nsf/s?readform&nnar-ljhw6>.
Chemical Manufacturers Association. March 1999. The 1998 U.S. Chemical Industry
Performance and Outlook. Downloaded from website.
Chemical Manufacturers Association website (www.cmahq.com). Economic News and
Information: Houses and Chemicals, based on an article in the November 1995 issue
of CMA News.
Chemical Manufacturers Association website (www.cmahq.com). Economic News and
Information: Cars and Chemicals, based on an article in the September 1995 issue of
CMA News.
Chemical Market Reporter. May 27, 2000. Chemical Prices. Pages 34–43. Schnell
Publishing.
Distribution. August 1996. “More Work for Chemical Distributor.”

DRAFT
R-2
Dun & Bradstreet. 1999. Company Capsules. As available on EBSCO.
Dun & Bradstreet. 1997. Industry Norms & Key Business Ratios. Desk-Top Edition
1996–1997.
EIA, Petroleum: An Energy Profile, 1999, p. 30.
Encyclopedia Britannica. “Petrochemical.” As obtained on June 19, 2000.
<www.britannica.com.>
Gale Business Resources. 1999. “Chemicals and Allied Products, Not Elsewhere
Classified.”
Gale Business Resources. 1999. “Pipelines, Crude Petroleum.”
Gale Business Resources. 1999. “Special Warehousing and Storage, Not Elsewhere
Classified.”
Gale Research. 1999. Ward’s Business Directory of U.S. Private and Public Companies:
1999. Detroit, MI: Gale Research, Incorporated.
General Business File International (formerly Business ASAP). 1999. Gale Group
Collections. As obtained from InfoTrac Web.
Hoover’s Incorporated. 1999. Hoover’s Company Profiles. Austin, TX: Hoover’s
Incorporated. <http://www.hoovers.com/>.
Oil & Gas Journal. 1999. “Supply Management By Major Exporters Key to Market In
Year’s Second Half.” July 27:60-61.
Oil & Gas Journal. 1998. “Weather, Construction Inflation could Squeeze North American
Pipelines.” 96(35).
Small Business Administration. Statistics of U.S. Businesses, 1996. Washington, DC.
Speed, Phillip J. “The Changing Competitive Landscape of the Chemical Industry.”
Chemicalbond. <http://www.socma.org/bond/feature1.html>. As obtained on
September 2, 1999.
U.S. Bureau of Labor Statistics, Producer Price Index – Current Series, Series Ids:
PCU2869#, PCU2869#, PCU2821#. Data downloaded from www.bls.gov

DRAFT
R-3
U.S. Census Bureau. March 2000. “1987 SIC Matched to 1997 NAICS.”
http://www.census.gov/epcd /naics/NSIC3B.HTML. As obtained on March 13, 2000.
U.S. Census Bureau. August 1999. “Plastics Material and Resin Manufacturing.” 1997
Economic Census, Manufacturing—Industry Series, E97M-3251I, Washington, DC:
Government Printing Office.
U.S. Census Bureau. August 1999. “All Other Basic Organic Chemical Manufacturing.”
1997 Economic Census, Manufacturing—Industry Series, E97M-3251I, Washington,
DC: Government Printing Office.
U.S. Census Bureau. August 1999. “Synthetic Organic Dye and Pigment Manufacturing.”
1997 Economic Census, Manufacturing—Industry Series, E97M-3251I, Washington,
DC: Government Printing Office.
U.S. Census Bureau. August 1999. “All Other Basic Inorganic Chemical Manufacturing.”
1997 Economic Census, Manufacturing—Industry Series, E97M-3251I, Washington,
DC: Government Printing Office.
U.S. Census Bureau. August 1999. “Ethyl Alcohol Manufacturing.” 1997 Economic
Census, Manufacturing—Industry Series, E97M-3251I, Washington, DC:
Government Printing Office.
U.S. Census Bureau. August 1999. “Industrial Gas Manufacturing.” 1997 Economic
Census, Manufacturing—Industry Series, E97M-3251I, Washington, DC:
Government Printing Office.
U.S. Census Bureau. August 1999. “Petrochemical Manufacturing.” 1997 Economic
Census, Manufacturing—Industry Series, E97M-3251I, Washington, DC:
Government Printing Office.
U.S. Department of Commerce, Bureau of the Census. 1999. 1997 Economic Census,
Manufacturing—Industry Series, “Petroleum Refining.” Report E97M-3241A.
Washington, DC.
U.S. Department of Commerce, Bureau of the Census. U.S. Industry and Trade Outlook
1998: Chemicals and Allied Products. Washington, DC.
U.S. Department of Commerce, Bureau of the Census. January 1996. Current Construction
Reports: Value of New Construction Put in Place. Washington, DC.

DRAFT
R-4
U.S. Department of Commerce, Bureau of the Census. December 1995/January 1996.
Housing Completions. Washington, DC.
U.S. Department of Commerce. 1996 Annual Survey of Manufactures. Washington, DC.
U.S. Department of Commerce. 1992 Census of Manufactures. Washington, DC.
U.S. Department of Commerce, Bureau of the Census. 1992. Economic Census.
U.S. Department of Energy, Energy Information Administration. July 1999. Petroleum: An
Energy Profile 1999. DOE/EIA-0545(99).
U.S. Department of Energy, Energy Information Administration. Annual Energy Outlook,
1999.
U.S. Department of Energy, Energy Information Administration. “The U.S. Petroleum
Refining and Gasoline Marketing Industry.” Overview of Domestic Petroleum
Refining and Marketing.
<http://www.eia.doe.gov/emeu/finance/usi&to/downstream/>. As obtained on July 9,
1999.
U.S. Department of Energy, Energy Information Administration. “The U.S. Petroleum
Refining and Gasoline Marketing Industry.” Recent Structural Changes in U.S.
Refining: Joint Ventures, Mergers, and Mega-Mergers.
<http://www.eia.doe.gov/emeu/finance/usi&to/downstream/>. As obtained on July 9,
1999.
U.S. Department of Energy, Energy Information Administration. July 1999. Petroleum: An
Energy Profile 1999. DOE/EIA-0545(99).
U.S. Department of Energy, Energy Information Administration. June 1999. Petroleum
Supply Annual 1998. Volume 1. DOE/EIA-0340(98)/1. Washington, DC.
U.S. Environmental Protection Agency. 2000. Technical Support Document for the Organic
Liquids Distribution (Non-gasoline) Industry. Washington, DC: U.S. Environmental
Protection Agency, Office of Air Quality Planning and Standards.
U.S. Environmental Protection Agency. May 5, 1999. Memorandum. “MACT Floor
Development for the OLD Source Category.”
U.S. Environmental Protection Agency. June 24, 1998. Memorandum. “Production
Projections for the OLD Source Category.”

DRAFT
R-5
U.S. Environmental Protection Agency. July 1995. Economic Impact Analysis for the
Petroleum Refinery NESHAP, Revised Draft for Promulgation.
U.S. Environmental Protection Agency. Crude Oil and Natural Gas Production and Natural
Gas Distribution NESHAP.
U.S. International Trade Commission, Dataweb database. www.dataweb.usitc.gov